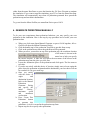
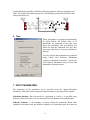
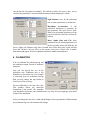
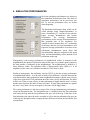
1
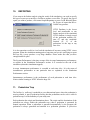
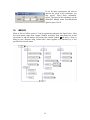
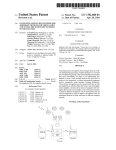
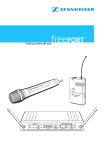
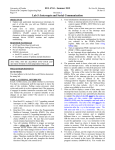
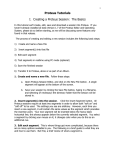
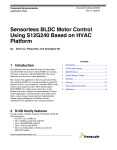
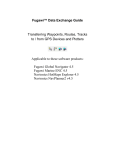
Micro-PedSim User Manual
Version 1.3
By
Kardi Teknomo, Ph.D.
1. INTRODUCTION
Welcome to Micro-PedSim, an innovative research tool to study the movement behavior
of pedestrians through microscopic pedestrian traffic simulation. Micro-PedSim gives
you the power to visualize and simulate pedestrian interaction and behavior
microscopically. It also presents links between microscopic level of individual behaviors
of pedestrians and macroscopic level of pedestrians’ traffic analysis.
Pedestrians can be generated either by manually, through text file, or automatically, in
either randomly distributed or systematic way. Experiments can be constructed through
variation of parameters specification. The simulation can also be calibrated in term of
time and space. The performance output of the simulation can be shown in either real
time simulation or can be reported as files for further analysis.
This manual is an introduction to the basic features of Micro-PedSim. It is not intended to
be a comprehensive discussion on the entire tools and the models. Readers should refer to
papers and dissertation of the author and other researchers in the discussion group for
more complete information.
The latest version of Micro-PedSim is still under development. Your valuable input and
support would be welcome. Please report any bugs or error to the author.
The software can be downloaded for free in
http://www.plan.civil.tohoku.ac.jp/~kardi/download.htm
To join research discussion group about Micro-PedSim, enter your email address in that
page and click ‘Join Now’ button.
1
2. INSTALLATION OF Micro-PedSim
1. Download SetUp.zip from
Micro-PedSim page.
2. Unzip the SetUp.zip file
into a temporary folder
3. Select Setup.exe and press
enter or double click.
4. Click OK and go to the
next dialog.
5. You may specify other
directory where do you
want to install the program
using Change Directory
button, or you can directly
proceed to step 6.
6. Click the button on the left
to start the set up.
7. Click Finish button.
The software run under Microsoft
Windows 9x and above. You need
at least 500 MHz computer speed and 256 MB memory to simulate several pedestrians
and higher computer speed and memory is needed to run more pedestrians.
3. RUN THE SIMULATION
After you set up Micro-PedSim, you
can run it from the start Menu of
Windows. The starting window is
shown as the figure on the right. The
default starting forms are Pedestrian
Trap and Simulation Performance
forms.
You can start to run the simulation
simply by pressing a function key F5
or using menu Run-Start. If you do not
specify any parameter configuration,
the simulation will run with its default
values. You may pause the simulation
2
either from the menu Run-Pause or press the function key F6. Press F6 again to continue
the simulation. If you want to stop the simulation, press F5 or from the menu Run-Stop.
The simulation will automatically stop when all pedestrian generated have passed the
pedestrian trap and reach their destinations.
To go out from the Micro-PedSim, use menu Run-Exit or press Ctrl-X.
4. GENERATE PEDESTRIAN MANUALLY
To do your own experiments about pedestrian behaviors, you may specify your own
pedestrian in the simulation. Here is the step by step procedure how to make your own
pedestrian data.
a. When you click menu Input-Manual Generator or press Ctrl-M together, MicroPedSim will show the Manual Generator Dialog.
b. Click the handle (top) of the pedestrian Trap form to put this form on top.
c. Click in the pedestrian trap where the pedestrian will be generated.
d. When you move your mouse on top of the pedestrian trap, the coordinate location
of the mouse is shown in the
status bar to help you specify
the correct location. A blue line will follow the movement of the mouse in the
pedestrian trap from the place you click first.
e. Locate the destination place of the pedestrian and click again. The line turns to
red color.
f. If you do not satisfy with this choice of location, simply start to locate again the
place where the pedestrian originated and the destination, your last choice will not
be recorded. Or else go to next step.
g. Once you satisfy
with the choice of
origin
and
destination location,
back to the Manual
Pedestrian
Generator Dialog
and specify the
initial
velocity,
maximum
speed
and
maximum
acceleration.
h. Press ‘Create This
Pedestrian’ button
to generate this
pedestrian. A circle is created in the pedestrian trap form.
i. Repeat step b to h to specify other pedestrians.
3
If you want to save the pedestrian data that have you have made, click ‘Save
Pedestrian’ button. Later you can use this data using ‘Load Pedestrian’ button. Once
you have specified the pedestrian data, you can start to run the simulation.
A note must be specified for warning: If you create other pedestrians in one session,
the data that you have created before have not been deleted from the memory and will
be added to your data. If you load pedestrian data, all your current data will be
replaced by the new set of data.
If you use manually generated data, your pedestrian will always have color of blue.
Darker color represents the higher speed relative to its maximum speed.
5. CREATE PEDESTRIAN DATA FROM TEXT FILE
Once you have generated pedestrian data manually, you may also want to create your
pedestrian data using any text editor such as NotePad or WordPad. The location of the
pedestrian data is in your Micro-PedSim directory, a file name “PedData.pim”.
The record of each pedestrian is in one row in the text file. The data is separated by
commas consecutively consist of
1. Pedestrian number
2. Initial position (x, y) in meter relative to the pedestrian trap
3. Target position (X,Y) in meter relative to the pedestrian trap
4. Initial velocity (Vx,Vy) in meter/second
5. Maximum speed in meter/second
6. Maximum acceleration in meter/second square.
Once you have modify the pedestrian data file,
make sure that you have back up a copy of
this data in another directory since any new
manually generated data that you create and
save will replace this file without warning.
6. AUTO GENERATOR
The default of Micro-PedSim is auto
generated pedestrians. You may need to
specify how Micro-PedSim will generate the
pedestrians automatically for you. When
menu Input-Auto generator is clicked or CtrlA is pressed; ‘Automatic Pedestrians
Generator’ dialog will appear. It has four tabs:
Time, Space, Max Speed and Ways.
4
1. Number of Ways
In this version of Micro-PedSim, a maximum
of two ways pedestrians can be generated
from right and left. The left origin pedestrians
have red to brown color while right-origin
pedestrians have light blue to dark blue color.
Darker color expressed the better emotion of
the pedestrian. The more obstruction a
pedestrian face, the relative current speed
compare to the maximum or desire speed is
smaller and color is lighter.
The total number of pedestrian generated from
the left and the right side is specified in this
Tab.
2. Maximum Speed
You may specify up to two categories of pedestrians based on the maximum speed in the
Max Speed Tab. For example, you want to distinguish elderly from normal pedestrians,
or you may include some percentage of pedestrians who are in hurry. If you specify one
category as 100%, pedestrians with the other category (0%) will not be generated.
In each category, you can indicate whether
there is only single maximum speed value or
the maximum speed is also distributed
normally with some mean and standard
deviation.
You can use the scroll bars to help you
specify the value or you can type the values
in the text boxes.
3. Space
The space Tab is related to the Calibration
dialog. It is to specify
where and how the
pedestrians are
generated. The
locations of originpoints are generated
randomly (uniform or
5
normal distribution spatially) within the pedestrian generator without overlapping each
other. The location of pedestrian generator is determined symmetrically from the center
of the pedestrian Trap.
4. Time
When pedestrians are generated automatically
by Micro-PedSim, the default value is all
pedestrians are generated at the same time
before the simulation. This specification will
make sure that the simulation will stop after
some time when there is no more pedestrian in
the trap.
You may specify that pedestrians are generated
using certain time headway distribution
(uniform, exponential or normal). Specify the
time headway distribution using its mean and
standard deviation parameters.
7. INPUT PARAMETERS
The parameters of the simulation can be specified using the ‘Input Pedestrians
Parameters’ dialog that called using menu Input-Parameters or pressing Ctrl-P together.
Pedestrian diameter: Since the model of a pedestrian is a circle, it is specified using
diameter. The default value is 60 cm measured from left shoulder to the right shoulder.
Influence diameter: is the boundary of uneasy feeling for pedestrian. When other
unfamiliar pedestrians enter her influence diameter, our pedestrian agent feels insecure
6
and deviate the movement accordingly. The influence radius also gives a nice way to
visualize the pedestrians’ movement and interaction without bumping or collide.
Sight distance: how far the pedestrian
can see other pedestrians or obstruction.
Maximum
Acceleration:
if
the
pedestrian simulation is generated by
auto generator, this value will be used.
When you use manual generator or from
your own data file, this value will not be
utilized.
Mass, Alpha, Beta and Chi: these
parameters are the internal parameters of
the force models. Mass will influence all
forces, Alpha will influence only move forward force, Beta affect only avoid collision
force and Chi have only an effect on the repulse away force. Please refer to author
dissertation and papers for more explanation about the model and parameters.
8. CALIBRATION
You can calibrate the pedestrian trap and
the simulation output in term of both time
and space.
First you can specify the size of the
pedestrian trap. Pedestrian trap is the
boundary of your study area. For example
if your study area is a pedestrian crossing
then you may change the trap similar to
whole area of the crossing.
Second calibration is the time slice (dt).
This number affects the numerical
integration of the model. The smoother
your simulation will make your simulation run very slow, but you might get quite detail
results of the simulation.
After you change the time slice, width and the height, when you push the Calibrate button,
the pedestrian trap size will automatically change.
7
9. SIMULATION PERFORMANCES
Real time simulation performances are shown in
the Simulation Performance form. The detail of
simulation performance can be saved into text
file. To save the performance files, see section
about Reporting.
The Simulation Performance form, which can be
called through menu Output-Performance or
press a function key F7, consists of two real time
report: Average Instantaneous and System
Performance. The Average Instantaneous
performances are the average of measurements at
that particular time of the simulation. For
example if at this moment there are 7 pedestrians
in the traps, then the Average Instantaneous will
report the average performances over these seven
pedestrians. Instantaneous speed, delay and
uncomfortability index are respectively the speed,
delay and uncomfortability at this moment of all
pedestrians in the trap.
Homogeneity is the average performance of neighborhood indices. It measures in the
neighborhood, the number of pedestrian who has the same way with the agent compare to
the total number of pedestrian in the neighborhood. The neighborhood is defined as 2
times influence radius. The individual value of Homogeneity index (NHI) is 1 if all
neighbors are the same way with the actor and zero if the actor is alone.
Similar to homogeneity, the uniformity velocity (NUVI) is also the average performance
of neighborhood indices . It is the ratio of norm of the difference velocities between the
actor agent and the other pedestrians in the neighborhood compare with the norm velocity
of the actor agent itself. If all pedestrians have the same velocity and direction, the index
will be zero. If the average velocity of other pedestrians is higher than the actor’s velocity
but the same direction, the index is between 0 and 1. If most other pedestrians are against
the actor’s way (their velocity are negative), the index will be bigger than 1.
The system performance is the time average of the Average Instantaneous performances,
except the dissipation time. The dissipation time is calculated from the first pedestrian
who enters the trap until the last pedestrian who goes out of the trap. If the time of the
first pedestrian who enters the trap is recorded as well as the last pedestrian who goes out
of the trap, the dissipation time is simply the time difference between the last and the first
recorded time.
8
10.
REPORTING
If you want to do further analysis using the result of the simulation, you need to specify
the type of report you want Micro-PedSim to produce as text files. To specify the type of
report you want to produce, click menu Output-Reporting or press Ctrl-R. Basically there
are 4 types of report that MicroPedSim can generate:
NTXY Database is the lowest
level and transferable to any
further analysis of the simulation.
NTXY database is simply record
of the pedestrian number (N),
time (T) and the coordinate
location (X, Y) of the
pedestrians in the trap at any
time slice.
It is also sometimes useful to view back the simulation if necessary using NTXY viewer
program. When the simulation running quite a long time and you are specifying to report
this text file, it may produce a very huge database. Please make sure that you have
enough hard disk space.
The System Performance is the time average of the Average Instantaneous performances,
as explain in the Simulation Performance section. It is recorded at the end of the
simulation (when the simulation stopped).
Average instantaneous performance is recorded at each time slice. It is the mean of
instantaneous performance at one particular time as explained in the Simulation
Performance section.
Instantaneous performance is the performance of each pedestrian at each time slice.
Notice similar warning to NTXY about the huge file.
11.
Pedestrian Trap
The facility (i.e. walkway) is modeled as a two-dimensional space where the pedestrian is
moving around. A part of pedestrian facility that the pedestrians can be seen is called a
pedestrian trap. It is the boundary of your study area.
Each pedestrian has origin and destination places. The origin and the destination of the
pedestrian are always within the pedestrian trap, when a pedestrian is generated by
manual operation. When a pedestrian is generated automatically by the program, the
pedestrian is always generated and attracted in a pedestrian generator. A pedestrian
9
generator is a rectangular area located outside the pedestrian trap where the pedestrians
appear in some point of time. The origin point of the pedestrian is inside a pedestrian
generator while the destination point is in another pedestrian generator. The location of
the origin point inside the pedestrian generator is determined using uniform random
distribution. When a pedestrian reaches the location near the destination point, the
pedestrian will disappear.
When the pedestrians are generated automatically by the program, all pedestrians are
generated at the same time before the simulation. The locations of origin-points are
generated randomly (uniform or normal distribution spatially) within the pedestrian
generator without overlapping each other.
You can set the size of the pedestrian trap in Calibration dialog. If you feel the size of the
trap too small or too big visually, you can change the pedestrian trap form by dragging its
edge left or right. The visual size of the trap will not affect the result of the simulation
because the coordinate will eventually change as you change the size of the form.
By default the pedestrian trap is always shown, but if you close it accidentally, you can
see it again by menu Output-Show Trap or press function key F3.
12.
Forces
Just in case you want to experiments with the forces and
calibrate parameters inside the models, you may specify
which individual force will be included in the simulation
by using menu Run-Option-Force or Ctrl-F.
Forward force is the motivation to go ahead. Without this
force the pedestrian will not move from origin to the destination. Input Parameters mass
and alpha are influencing the forward force.
i
fi,r
distance
other
pedestrian j
Repulse away
Avoid collision force
Repulse away force is the motivation to go away from other pedestrians. This force is
useful for avoiding when pedestrian meet each other from a distance. The force is also
10
used for overtaking if several pedestrians have the same way and the back pedestrian has
faster speed. Input parameters mass and chi are related to this force.
In case of high pedestrian traffic density or when the pedestrians are closed to each other
the repulse away force is not strong enough to avoid the collision. Avoid collision force
need to be added. Input parameters mass and alpha affect this force.
13.
Visualization
Using show options from menu RunOptions-Show or Ctrl-V you can
determine the visualization of the
simulation in the pedestrian trap. You
may specify the influence circle to see
how the simulation behaves to avoid
the collision, or the sigh box to
measure how far the pedestrian can see.
The acceleration and the velocity can
also be shown as vector from the
center of the pedestrian circle.
You may also want to see the detail of the ID number of each
pedestrian, or simply fill the circle with color to see the emotional level of the pedestrian.
Lighter color indicates that the pedestrian get more interaction and slowed down due to
the other pedestrians or obstructions. The pedestrian circle can also be removed. Trace
path option gives an alternative way to see the path of each pedestrian.
11
If you do many experiments and want to
increase the speed of the simulation, you
may specify “Don’t Show Animation”
option. The speed of the simulation can be
controlled though menu Run-Simulation
Speed or press Ctrl-W.
14.
MENUS
Menu of Micro-PedSim version 1.3 can be organized as shown in the figure below. It has
five main menus: Input, Run, Output, Window and Help. Each main menu has several
sub menus or sub-sub menus. Sub menus that contain symbol will show a form or
dialog to user. Shortcut using Control and a letter together or a function key is also
provided for each sub menu.
12