Download Appendix K: Existing Tool Functional Testing - VLE
Transcript
Techniques for Analysing Website Usage Howard Dobson BSc Computing (Industry) 2005/2006 The candidate confirms that the work submitted is their own and the appropriate credit has been given where reference has been made to the work of others. I understand that failure to attribute material which is obtained from another source may be considered as plagiarism. (Signature of student) Summary This report documents the final year project undertaken to investigate a variety of web site usage analysis techniques. It implements some of these techniques in separate tools written in Perl. The investigation involved a software survey of commercial and freely available existing techniques, as well as the newer techniques available, predominantly research and university projects. A discussion surrounding the effectiveness of log file usage analysis is presented, in contrast with modern data collection techniques. The log files used throughout this report were obtained from the School of Computing web site. scs2htd i Acknowledgements Firstly I would like to thank my supervisor Roy Ruddle for his guidance and time throughout the project, and to my assessor David Duke for the feedback he provided at mid project and demonstration. Thanks to all those on the newsgroups, in particular Graham Hardman, Simon Myers and Mark Conmy for their assistance with getting me over those Perl hurdles, and to those who contributed in general. Also thanks goes to Jonathan Ainsworth for giving feedback on the existing techniques tool. Special thanks go to my girl friend and family for trying to keep me sane and for all the proof reading. scs2htd ii Contents 1 INTRODUCTION ....................................................................................................................................... 1 1.1 PROBLEM DEFINITION ............................................................................................................................ 1 1.2 PROJECT AIM ......................................................................................................................................... 1 1.3 MINIMUM REQUIREMENTS ..................................................................................................................... 1 1.3.1 Possible Extensions to the minimum requirements .......................................................................... 1 1.4 DELIVERABLES ...................................................................................................................................... 1 1.5 PROJECT SCHEDULE ............................................................................................................................... 1 1.5.1 Schedule Revisions........................................................................................................................... 2 1.6 METHODOLOGY ADOPTED ..................................................................................................................... 2 2 BACKGROUND .......................................................................................................................................... 3 2.1 THE DATA .............................................................................................................................................. 3 2.1.1 Data Source....................................................................................................................................... 3 2.1.2 The Log Line .................................................................................................................................... 3 2.2 WHY ANALYSE WEB LOGS? .................................................................................................................. 4 2.3 DATA, INFORMATION, KNOWLEDGE AND WISDOM? .............................................................................. 4 2.4 DATA REPRESENTATION ........................................................................................................................ 4 2.5 EXISTING TECHNIQUES .......................................................................................................................... 5 2.5.1 Primitive (log file data) Techniques ................................................................................................. 5 2.5.2 Modern (cookies, tagging data) Techniques ..................................................................................... 6 2.5.3 Software Survey................................................................................................................................ 6 2.5.4 Common Primitive Reports .............................................................................................................. 7 2.5.5 Uncommon Primitive Reports. ......................................................................................................... 8 2.5.6 Common Modern Reports ................................................................................................................ 8 2.5.7 Uncommon Modern Reports ............................................................................................................ 9 2.6 NEW TECHNIQUES ............................................................................................................................... 10 2.6.1 Software Survey.............................................................................................................................. 10 2.6.2 Common Techniques ...................................................................................................................... 11 2.6.3 Uncommon Techniques .................................................................................................................. 11 3 PARSER PHASE ....................................................................................................................................... 12 3.1 REQUIREMENTS ANALYSIS .................................................................................................................. 12 3.1.1 Problem, Data Collection and Target Users.................................................................................... 12 3.1.2 Functional Requirements ................................................................................................................ 12 3.2 SYSTEM DESIGN................................................................................................................................... 13 3.2.1 Conceptual Design.......................................................................................................................... 13 3.3 SYSTEM IMPLEMENTATION .................................................................................................................. 15 3.3.1 Problems Encountered .................................................................................................................... 15 3.3.2 Actual Functionality ....................................................................................................................... 16 3.4 TESTING ............................................................................................................................................... 17 3.4.1 Defect Testing................................................................................................................................. 17 3.4.2 Non Functional Testing .................................................................................................................. 18 3.5 EVALUATION ....................................................................................................................................... 18 3.5.1 Evaluation Criteria.......................................................................................................................... 18 3.5.2 Evaluation Results .......................................................................................................................... 19 3.5.3 Future Improvements...................................................................................................................... 21 4 EXISTING TECHNIQUES PHASE ........................................................................................................ 23 4.1 CHOSEN TECHNIQUES .......................................................................................................................... 23 4.2 REQUIREMENTS ANALYSIS .................................................................................................................. 24 4.2.1 Data Gathering................................................................................................................................ 24 4.2.2 Target Users.................................................................................................................................... 24 4.2.3 Functional Requirements ................................................................................................................ 25 4.2.4 Non – Functional Requirements ..................................................................................................... 25 4.3 SYSTEM DESIGN................................................................................................................................... 25 4.3.1 Conceptual Design.......................................................................................................................... 25 4.3.2 Physical Design .............................................................................................................................. 29 scs2htd iii 4.4 SYSTEM IMPLEMENTATION .................................................................................................................. 29 4.4.1 Problems Encountered .................................................................................................................... 30 4.4.2 Actual Implementation ................................................................................................................... 31 4.5 TESTING ............................................................................................................................................... 33 4.5.1 Defect Testing................................................................................................................................. 33 4.5.2 Non Functional Testing .................................................................................................................. 33 4.5.3 Performance Testing ....................................................................................................................... 34 4.5.4 Usability Testing............................................................................................................................. 35 4.6 MAINTENANCE..................................................................................................................................... 36 4.6.1 Fixed ............................................................................................................................................... 36 4.6.2 Future Maintenance ........................................................................................................................ 37 4.7 EVALUATION ....................................................................................................................................... 38 4.7.1 Evaluation Criteria.......................................................................................................................... 38 4.7.2 Evaluation Results .......................................................................................................................... 39 4.7.3 Future Improvements...................................................................................................................... 42 5 NEW TECHNIQUES PHASE .................................................................................................................. 44 5.1 CHOSEN TECHNIQUES .......................................................................................................................... 44 5.2 REQUIREMENTS ANALYSIS .................................................................................................................. 44 5.2.1 Data Gathering, Target Users and Possible Solutions .................................................................... 44 5.2.2 Functional Requirements ................................................................................................................ 44 5.2.3 Non Functional Requirements ........................................................................................................ 45 5.3 SYSTEM DESIGN................................................................................................................................... 45 5.3.1 Conceptual Design.......................................................................................................................... 45 5.3.2 Physical Design .............................................................................................................................. 46 5.4 SYSTEM IMPLEMENTATION .................................................................................................................. 47 5.4.1 Problems Encountered .................................................................................................................... 47 5.4.2 Actual Implementation ................................................................................................................... 48 5.5 TESTING ............................................................................................................................................... 49 5.5.1 Defect Testing, Non Functional Testing ........................................................................................ 49 5.6 MAINTENANCE..................................................................................................................................... 50 5.6.1 Future Maintenance ........................................................................................................................ 50 5.7 EVALUATION ....................................................................................................................................... 50 5.7.1 Evaluation criteria........................................................................................................................... 50 5.7.2 Evaluation Results .......................................................................................................................... 50 5.7.3 Future Improvements...................................................................................................................... 52 REFERENCES ................................................................................................................................................... 53 APPENDIX A: PERSONAL REFLECTION .................................................................................................. 57 APPENDIX B: SCHEDULE.............................................................................................................................. 58 APPENDIX C: SOFTWARE SURVEY COMPARISON TABLE ................................................................ 59 APPENDIX D: REQUIREMENTS DATA GATHERING............................................................................. 62 APPENDIX E: PARSER REQUIREMENTS SPECIFICATION ................................................................. 64 APPENDIX F: PARSER FUNCTIONAL TESTING...................................................................................... 66 APPENDIX G: PARSER NON-FUNCTIONAL TESTING........................................................................... 68 APPENDIX H: EXISTING TOOL REQUIREMENTS SPECIFICATION ................................................. 70 APPENDIX I: PROGRAMMING LANGUAGE CHOICE ........................................................................... 73 APPENDIX J: EXISTING TOOL PHYSICAL DESIGN............................................................................... 74 APPENDIX K: EXISTING TOOL FUNCTIONAL TESTING..................................................................... 81 APPENDIX L: EXISTING TOOL NON-FUNCTIONAL TESTING ........................................................... 85 APPENDIX M: EXISTING TOOL TESTING LOGS.................................................................................... 88 APPENDIX N: EXISTING TOOL PERFORMANCE TESTING RESULTS ............................................. 92 APPENDIX O: EXISTING TOOL USABILITY TESTING.......................................................................... 93 scs2htd iv APPENDIX P: EXISTING TOOL CONSOLE DUMPS AND GRAPHICS............................................... 105 APPENDIX Q: NEW TOOL REQUIREMENTS SPECIFICATION ......................................................... 112 APPENDIX R: NEW TOOL PHYSICAL DESIGN...................................................................................... 114 APPENDIX S: NEW TOOL FUNCTIONAL TESTING.............................................................................. 115 APPENDIX T: NEW TOOL CONSOLE DUMPS ........................................................................................ 117 scs2htd v 1 Introduction 1.1 Problem Definition The School of Computing (SoC) website has an associated access log that could be utilised to produce analytical information about the site’s usage. Currently this log is only used for investigation after suspected security attacks and no website usage analysis is performed. 1.2 Project Aim The aim of the project is to investigate established techniques for website usage analysis, implement some of these techniques in a stand-alone tool and to develop some newer methods including my own ideas. The tool will aid users to understand the SoC website usage. 1.3 Minimum Requirements 1. A tool that can parse the SoC web server log. 2. A tool that can analyse the SoC website using a small selection of existing techniques. E.g. page hits. 3. A tool that can analyse the SoC website using a new technique. E.g. Trails. 1.3.1 Possible Extensions to the minimum requirements 1. The tool will allow the users to interact with visualisations of statistics e.g. allowing the user to click a country on a world map and view page requests etc. 2. A tool that can visualise the structure of the SoC website, and also display the statistics obtained from log analysis using the existing tool. 1.4 Deliverables The implementation will take the form of a tool or tools that can be used along with log files (not to be provided). 1. The tool/s (software) 2. User manual/s for the software. 3. This report. 1.5 Project Schedule The schedule was initially laid out at the beginning of November 2005. It takes the form of a Gantt chart and shows tasks to be carried out with a certain amount of time, as well as milestones which relate to SoC deadlines and those of my own. It also takes into account the Christmas holiday and revision time needed for the January exams. This original schedule can be seen in Appendix B – Schedule. scs2htd 1 1.5.1 Schedule Revisions A number of changes were made to the original schedule and chart. I anticipated that this would happen from the very beginning of the project, so to account for unforeseen circumstances and delays; every schedule I produced had some degree of flexibility. These changes and the updated chart can been seen in Appendix B – Schedule. 1.6 Methodology Adopted The chosen software development methodology reflects a hybrid of many rather than one single approach. Sommerville [1] describes a variety of these methodologies. The waterfall method was chosen because it includes a good well structured number of processes which clearly follow on from one another. However the author will allow much more flexibility that the basic waterfall method, in that some feed back can occur and effectively the water can flow upstream if changes need to be made at any time. The author has also learnt that to build a piece of software and then test separately it is not possible. Building the software involves incremental coding and testing as one process, with further structured testing occurring after implementation. scs2htd 2 2 Background 2.1 The Data 2.1.1 Data Source The World Wide Web (WWW) is the ‘first global networked information service’ [2] which exists on the Internet. The SoC host one of the many web pages which comprise this ‘web’ and this project seeks to look at how to analyse the usage of this web site. Before the usage is under stood it is useful to know that the WWW uses the Hyper Text Transfer Protocol (HTTP). HTTP is a client/server protocol whereby the surfers are the client’s and the servers are those such as the SoC web server. People send requests to view SoC web pages everyday via their web browser and each request is dealt with by the server. Every single request that is received by the SoC web server is logged in an access log. This access log can become extremely big if many people are sending requests to the web server so it is periodically replaced, and a new one created every week as discovered in Appendix D Requirements Data Gathering. This access log is the data set to be used. 2.1.2 The Log Line Sample Log file (personal data removed to maintain anonymity) 129.11.147.71 - USER [22/Sep/2005:14:09:27 +0100] "GET /internal/ HTTP/1.1" 200 9884 129.11.146.28 - USER [22/Sep/2005:14:09:19 +0100] "GET /cgi-bin/sis/main/index.cgi HTTP/1.1" 200 2816 129.11.145.96 - USER [22/Sep/2005:14:09:21 +0100] "GET /cgi-bin/sis/ts/index.cgi HTTP/1.1" 200 5177 129.11.146.199 - USER [22/Sep/2005:14:09:44 +0100] "GET /gph/linux/ HTTP/1.1" 200 1009 The SoC log file is an access log in Common Log Format (CLF) [3] [4] as defined by the W3C at [5]. This has been confirmed by [6]. Its 7parts are as follows: • Client IP Address • RFC 1413 identity of the client determined by identd on the client’s machine (info not shown in example above.) • userid • DateTime (time the server finished processing the request.) • HTTP Request (type of request and the resource requested.) • HTTP Status code (begin with 2 = Ok) • Size of object returned to the client. scs2htd 3 2.2 Why Analyse Web Logs? Web access logs contain large amounts of usage data. Analysing this data can answer many questions. Ask your self, how many people are visiting your site? What is your most popular web page? These questions may arise due to simple curiosities, but in a world where e-commerce and information on the WWW is increasingly the dominant communication medium, answering questions such as those above are vital. Large and Arnold [7] highlight this point. The NHS has a relatively new website where information is presented to anyone that wishes to get help on certain health issues. Obviously the NHS wished to know if anyone was visiting this site and its existence wasn’t a waste of money compared with their other communication mediums. Analysing the logs for the web site revealed that this was not the case and the existence of the website was cost-effective. Large and Arnold [7] also highlight that analysing log files can not only tell you how many people are visiting the site, and what are the most often viewed pages, but that the logs contain other data such as the paths taken by people through the site. Finding out how most people viewed the current web site meant it became obvious its current structure wasn’t good enough. This allowed it to be reorganised so that the vital health information people needed was displayed on the first page. The same techniques are employed for commercial web sites, and not surprisingly many e-commerce sites analyse their logs extensively so that they can increase their sales. 2.3 Data, Information, Knowledge and Wisdom? The solution must in some way transform this large data set contained in the log file into information and hopefully give the user some knowledge overall. In [8] we see that: ‘Transformation of information into knowledge is the result of two complementary dynamics: the “structuring” of data and information that imposes or reveals order and pattern…’ See Figure 2.1 [8] for the full progression, from data to knowledge. 2.4 Data Representation There are a number of methods we could use to try and reveal the ‘patterns’ or knowledge within the log file. As discussed by Spence [9] the data contains numerical, ordinal and categorical data (e.g. bytes sent, days of the week and status codes). This data needs to be represented in some manner. The obvious first step would be to represent the data using statistics, for example by adding together all the bytes sent for each day of the week and displaying them in a table. scs2htd 4 Figure 2.1: Depicts the progression of data into information and knowledge. An alternative method of representing the data would be to use charts and graphs with use of colour, shape and size to distinguish between different parts of the data. A simple pie chart could depict the percentages of total requests for each status code, using colours for each code segment and the size of this segment represents the magnitude of the percentage. Understanding the pie chart is quicker and easier than reading through the values in a table to find a specific statistic, even though both methods of representation display the same data. 2.5 Existing Techniques 2.5.1 Primitive (log file data) Techniques In the 1990’s when web analytics was in its early stages it was sufficient to analyze just web logs. Applications could be designed to read in the file, produce some analysis and more often than not display the results in some graphical form. Much like what this project aims to achieve. This relatively simple method of taking data direct from your web server and analyzing it has become redundant in today’s world where better and more accurate results are required. Primitive analysis has been surpassed by modern data collection techniques which offer more accurate results. This is due to the following reasons outlined in [10] and [11] which cover the problems surrounding the accuracy of the data held in a log file. It is arguable that it is not good enough if you want to know how many individuals are visiting your site, because more than one person could be behind one IP address. See Figure 2.2 [12] for these disadvantages in summary. scs2htd 5 2.5.2 Modern (cookies, tagging data) Techniques With more emphasis being put on web sites to be successful in today’s e-commerce world, analysis of marketing metrics and user time spent on the site are examples of the newer analysis approaches that had to be introduced. [13] and [14] discuss these needs to get better web analytics. These modern tools all tend to use a variety of techniques, and have the option to use primitive data collection (log files) as well as modern data collection. They can all be dubbed hybrids that offer the most accurate web site analysis because they don’t suffer from one or the other’s disadvantages. The modern data collection techniques use cookies and page tagging (JavaScript) as described in [15]. These eliminate the problems as seen in Figure 2.2. And offer far better metrics which can be used effectively to gain more money from websites for example. 2.5.3 Software Survey Analog - This software is freely available and was regarded as one of the simplest, quickest and easy to use analytics available. Leeds University’s Information Systems Services use this software in conjunction with their web servers to analyse hosted sites. [16] WebStats - Again free software from the University of Columbia in New York offers similar functionality as does Analog and only utilises web server log files. [17] AWStats - Another free application under the GNU General Public License (GPL), again similar functionality and can be used with a wide range of log file formats as can the others. [18] Webalizer - Free under GNU’s GPL, this offers a smaller variety in the formats of log file it can take. [19] Visitors - This software offers similar to the above, but in conjunction with GraphViz, a graph drawing application, Visitors can draw what it terms ‘web trails’. This as it describes is not a graph of the site, but a graph of usage patterns determined from the log file. [20] ISS - The Apache web server does not come with any built in web analytic application. In contrast Microsoft’s Internet Information Server (IIS) does come with an integrated application [21]. scs2htd 6 Deep Log Analyzer - This software is not free, however it does not offer any more functionality or reports over the free software above. [22] These following pieces of software are not free and companies charge monthly or one off costs. The analysis can either be outsourced or installed on the user’s web server at their choice. All these software vendors list customer feedback on their products and it is clear that the advanced techniques offer more accurate web site analysis, because some customers explicitly say their primitive results were totally different. LiveStats.Net - This package boasts ‘interactive visualisation’ when talking about requests from different countries. The user can click a country on a map and find out the usage statistics. It has enough confidence in modern data collection that primitive techniques are no longer used. [12] Web Trends 7 - This software appeared to be the leader within the industry at present. ‘…you’ll be able to transform complex path and scenario reports into easy to interpret visual diagrams that help you make smart decisions’ [23]. It uses both methods of data collection, hybrid software. HBX Analytics - The actual data collection methods are not listed on their website. However [24] shows that it does in fact use page tagging and log file data collection methods, therefore another hybrid. [25] For a tabulated comparison of all tools surveyed here which lists the representation methods, see Appendix C – Software Survey Comparison Table. 2.5.4 Common Primitive Reports The majority of the primitive software is free, all utilize the CLF, and all produce ststistical as well as graphical output to display the analysis. Total requests – A count of each line in the log file. Successful requests – A count of only the lines which have successful status codes. Failed requests – It will also be possible to count any failed status codes. Averages of the previous two – Averages per day can also be calculated because of the date/time information contained in each line. Status codes – Reports regarding exactly which codes were present. The usual approach is to represent these in a pie chart. scs2htd 7 Corrupt log file lines – Sometimes the web server may not write a full line to the log file. Most parsers can detect this and count them. Total data transferred – Each line also stores the size of the object being requested. We can therefore calculate the total amount of data transferred by the web server for the whole log file. Average data transferred per day – Knowing the total transferred each day we can average this. Days of the week summary requests – The date/time information can be used to associate the total requests per day with its day of the week. Key search phrases – This allows us to see what word or phrase a user entered into a search engine to then be referred to the site. User agent – This extra information logs the user’s browser type for each request. We can produce a pie chart showing the percentages of type of browser used to view the site. User OS – Similar representations as the user agent can be made using pie charts. File type – Each request lets us know the specific resource the user requested. E.g. .html, .gif. Host domain – The IP address on each log can be resolved to produce the domain name associated with it. E.g. .com .uk etc. Gives us more detailed information on where the users are coming from. This covers the basics, but all of the packages offer more or less similar to the above depending on the log formats they support. 2.5.5 Uncommon Primitive Reports. Visitors offers some extra functionality because it utilizes another software package called GraphViz. This allows graphs of user paths through the website to be drawn or ‘web trails’ [20] 2.5.6 Common Modern Reports All of the modern data collection methods provide the functionality seen in the primitive data collection packages with more reports increasingly focused on targeting the big e-commerce picture. They all seemed to be very marketing oriented and had graphical user interfaces. It was a lot harder to ascertain the exact features offered by these packages because they were not freely available and no responses were received for information requests. Below are just some of the common features offered: Entry and Exit pages – Summary of the very first pages people enter the site on and where they leave. Especially in the context of the ordering and ‘checkout’ process. scs2htd 8 Unique Visitors – Due to the page tagging data collection, the packages can offer a report highlighting individual visitors to a greater level of accuracy. Interactive Visualization – For example, simply allowing the user to view a world map, and clicking a country of interest to find out the number of visits. Superimposed Metrics – Statistics are superimposed over the actual web page to give the user a better view of where the figures are, and to highlight important web page space. Marketing and Product Metrics – Main focus of each package was marketing and e-commerce information. They all boasted advertising campaign metrics (e.g. effectiveness of email or banner ads), Pay Per Click reports for accurate info on any advertising and reports on advertising conversion from advert to the customer buying the product. Figure 2.2: Depicts the problems associated with only using log files for analysis. 2.5.7 Uncommon Modern Reports LiveStats.Net [12] This package offers the unique report for forecasting numbers of visitors. Figure 2.3 [12] depicts this. scs2htd 9 Figure 2.3: Depicts the visitor numbers forecasting produced by LiveStats.Net 2.6 New Techniques The new techniques are still limited in where they obtain their data from, either log files or page tagging data; however they display the usage data in advanced graphical form. 2.6.1 Software Survey Visual Web Mining - This software took a web server log and produced usage visualisations in 3D. It also produced the structure of the web site using 3D visualisations and then superimposed the usage on top of the structure. [26] DMASC - This software produced 2D images of a user’s path through a website. It emphasises the use of colour to show the chronological order taken by a user. Both static and dynamic web pages can be visualised. [27] Visitor Ville - This software took the standard existing techniques of log analysing, and put a modern fun way of viewing the statistics and reports. It uses the graphics engine of the well known computer game ‘The Sims’. The user enters a 3D world, where each person represents a visitor to your site, and buildings represent the pages. [28] VISVIP- 2D visualisations of the website structure are created using a directed graph, where nodes are the pages and edges are links. Pages are colour coded by file type, and usage is over laid to view single or multiple users’ paths. [29] Path Finder - Similar work to [26] this produces 3D visualisations of the structure of the website, and overlays the usage information from log files. Use of colour and shape is used to denote different nodes of the website and to highlight the path of a selected user. [30] scs2htd 10 Web Site traffic Map - This software produces interesting 2D images which show the aggregate user traffic through a website. It shows traffic moving clockwise around the structure of the website instead of showing simple straight lines denoting user paths. [31] Anemone - This software uses access logs from websites and visualises them by simulating organic growth. The visualisation shows frequent areas of usage by growing the nodes and less visited areas by withering the nodes. [32] 2.6.2 Common Techniques The majority of new log analysis techniques seek to aid the user’s cognition of the usage data, not by simply outputting the usage as tables or graphs, but by putting the usage in context by overlaying the usage data in some way onto the structure of the website. Both two and three dimensional visualisations are used, while some software allows for full user interaction and movement through the 3D website and usage data. The typical usage data of the existing techniques is converted into other forms of representation by using shape and colour to distinguish different types of usage. A large number of them show traffic or user paths taken through the website rather than simply highlighting popular pages. There are no common techniques as such, because all software surveyed tries to find different and more useful ways of analysing usage than previous attempts. 2.6.3 Uncommon Techniques An interesting way of displaying usage of a website was found in [28]. It uses a computer game graphics engine to display the usage. See Figure 2.4. Figure 2.4: Visitor Ville’s screenshot depicting visitors as individual avatars. scs2htd 11 3 Parser Phase 3.1 Requirements Analysis 3.1.1 Problem, Data Collection and Target Users The log file contains only text. This text file can reach up to 180Mb in size. The log file consists of a number of lines; each line contains valuable information that needs to be found and extracted in order to produce useful analytical statistics. Fortunately the text is structured and limited by white space and other characters e.g. the date time field alone is contained within square brackets. To define the requirements of any system you must perform certain data gathering techniques so that this data can be analysed and then the requirements can be found. Bennett et al [33] describe the SQIRO range of techniques for this purpose. However there was no real need to use traditional data gathering techniques for the requirements of this phase of the project. The parser does not depend so much on any current parsers, it simply has to find and extract certain items of information from some input data. These items are defined in section 4.2 which is documented later in this report. The target user in this case will not be a human user, but will be the main software tool which utilises the parsed data and does some processing upon it. 3.1.2 Functional Requirements These requirements relate only to the techniques that ‘must’, ‘should’, ‘could’ and ‘want to have implemented but not this time’ as stated by the MoSCoW rules in [34]. They are split into these sections for implementation priority. Bennett et al [35] define the functional requirements of a system as ‘the functionality or services the system is expected to provide’. Must Have 1. The system shall work with CLF log files. 2. The system shall ‘clean’ up each log file line, such as removing unwanted characters like white space and brackets. 3. The system shall parse each line of the file. 4. The system shall find and extract the ‘bytes’ information. 5. The system shall find and extract the ‘status’ information. 6. The system shall find and extract the ‘file’ information. 7. The system shall find and extract the ‘date’ information. 8. The system shall store the information from the parsed log file either within the running program for advanced processing or output the parsed ‘clean’ data to another text file. Should Have 1. The system shall detect ‘bad’ log file lines and report on them. scs2htd 12 2. The system shall find and extract the ‘IP’ information. Could Have 1. The system shall handle all log file formats. Will Not Need 1. The system will not need to extract the request method information. 2. The system will not need to extract the request protocol information. 3. The system will not need to extract the client id information. See Appendix E - Parser Requirements Specification for the final requirements document adapted from [36]. 3.2 System Design The requirements detail what the user wants and the design should detail how these requirements will be realised. For the design section [37] was consulted which splits the design of the software down into two levels, a conceptual design and the physical design. This will give me a blueprint for how I will implement and code the program and also, how the program should interface with the user. 3.2.1 Conceptual Design [37] describes the conceptual design as ‘a description of the proposed system in terms of a set of concepts about what it should do, behave and look like, that will be understandable by the users…’. I will try to follow this and describe each part of the system, and what each part of the system will do, and how conceptually it will do this. To make things easier to describe, I will break the system down into sections using helpful advice on modular decomposition given in [1]. The data flow model can help perform the decomposition. The data flow model recognizes systems that can be ‘decomposed into functional modules which accept input data and transform it in some way to output data’ [1]. See Figure 3.1 for an overview of the proposed system and its conceptual ‘modules’. Each circle represents a different process or part of the system that takes input data from the previous. You can see that the log file is produced from the web server depicted as the source. This log file is then ‘parsed’ in some manner so that the log file is cleaned up and the right items of information required are found and extracted. Then the processing of these items can begin which will be detailed later. Here we only focus on the design of the parser module. scs2htd 13 Figure 3.1: Data flow diagram for the proposed system. Loading the Log File For the log file to be parsed it must first be opened. It is expected that the user will supply a log file in CLF format via command line argument. This satisfies the existing tool requirement 2.0 and 3.9. The file they wish to use must be in the same directory as the program file. If no log file is given as an argument, the user must be informed that one must be supplied, and the correct method of running the program and supplying the log file should be shown to the user. This satisfies the tool requirement 3.7. If an argument is given but the file does not exist in the same directory, then an error message must be shown indicating this, so that the user can try again. When opening a log file the system must inform the user what is happening and when it has been opened this must also be conveyed satisfying tool requirement 3.5. Once this is complete the parsing of the log file can begin. Parsing the Log File The log file is open and now the log lines can be read in. The file will be read one line at a time by looping over the log file. For every line (this satisfies parser requirement 4.1) of the log file each item will be found and placed inside a variable. This will be done by using a regular expression to match specific items as follows: 1. The bytes information will be extracted by matching the last double quotes character followed by one white space followed by a numerical value three characters long followed by one white space followed by a numerical value which is the item we wish to enter into a variable. This satisfies parser requirement 4.2. scs2htd 14 2. The status information will be extracted by matching the last double quotes character followed by one white space followed by a numerical value three characters long which is the item we wish to enter into a variable. This satisfies parser requirement 4.3. 3. The file information will be extracted by matching the characters within the double quotes, and placing them into a variable. This satisfies parser requirement 4.4 4. The date information will be extracted by matching the square brackets which surround the date/time, and this will be placed into a variable. This satisfies parser requirement 4.5. 5. The IP information will be extracted by matching the very first characters of the log line which are in the standard IP format (e.g. 12.13.14.15) followed by one white space. This will be entered into a variable. This satisfies parser requirement 4.8. All the information required has been extracted by using regular expressions. These expressions should remember the important information for each item. This will effectively mean we have cleaned up the log line and now our variables only contain the characters of interest without any white space etc. This satisfies the parser requirements 4.0 and 4.6. The log file examples seen have so far all been in perfect CLF format. However for some reasons blank lines may get entered into the log. To account for this inside the loop for each line, a check will be performed. If the line matches a white space character or any number of white space characters, starting at the very beginning of the log line, then another variable will be incremented which will tell us how many ‘errors’ were found. This satisfies parser requirement 4.7. This parser design satisfies all but the ‘could have’ parser requirements. Those designs will only be laid down if time allows in the implementation stage. 3.3 System Implementation Perl was chosen to produce the software. For justification see Appendix I - Programming Language Justification. 3.3.1 Problems Encountered This section documents any problems encountered while trying to implement the design. Any design changes or requirements changes are listed here along with an explanation of the problem. scs2htd 15 There were no real set backs, once I had implemented a simple if statement for testing how many arguments were supplied, the ‘Open or Die’ file handling provided by Perl. The file supplied in the arguments would either open, and if not, an error message is displayed. The only problem encountered was that the error message produced was confusing to the user. It originally looked like this: cslin-gps% ./Parser.pl eggs No such file or directory, ./Parser.pl line 33. I felt this did not provide enough information to the user, and did not prompt them enough to re enter a sensible argument. It includes the line at which the program cannot continue. To improve this I added some more information: cslin-gps% ./Parser.pl eggs Could not open file 'eggs', No such file or directory, script stopped at ./Parser.pl line 33. The error now tells the user that the argument they entered could not be opened, because it did not exist, and that the script stopped as before because of this. 3.3.2 Actual Functionality This section documents the actual implementation carried out and the final software. Any design changes or requirements changes made not due to problems are listed here. Everything was implemented as designed, apart from the way in which the parser extracted the pieces of information from each line. The design requires regular expressions to do this, which is possible. However it became clear that using a built in Perl function to break up the log line was the better solution. It was not apparent to the author previously that the log line consisted of 10 items all separated by one white space character. This formatting can be utilised with the Split function to get those 10 items. ($ip, $rfc, $user, $date, $gmt, $req, $file, $proto, $status, $bytes) = split (' ' ,$line); This takes the log line, and uses the pattern supplied (in this case one white space) and separates out the string on that separator. The end result is that we have 10 items in variables, with out the white space. This meant that some of those variables however still had unwanted characters in them, for example the time zone information now had a closing square bracket in it at the very end. Further cleaning of these variables was as follows. scs2htd 16 To remove the last character of a string it is easy to use the Chop function: chop($gmt); chop($proto); The transfer request had an unwanted double quote at the beginning of the string. Chop only gets rid of the very last character of a string, so the Substr function was used with an offset of 1 instead: $req = substr($req, 1,); For completeness and to remove the opening square bracket, the date information was also used with the Substr function, so that we ended up with a clean date variable and a clean time variable instead of one unclean date variable: $time = substr($date, 13); $date = substr($date, 1, 11); This meant for every line there were 11 variables held in memory as follows: $ip, $rfc, $user, $date, $time, $gmt, $req, $file, $proto, $status, $bytes 3.4 Testing 3.4.1 Defect Testing This section details the functional defect testing. Sommerville [1] defines defect testing as ‘exposing latent defects in a software system before the system is delivered.’ So hopefully this will successfully find any defects present in the software which were not originally found when implementing the software. Functional testing is described as such because ‘the tester is only concerned with the functionality and not the implementation of the software.’ [1]. Also known as ‘black-box testing’ this process involves giving the software inputs and checking that the actual outputs match the expected results. The expected results are derived from the software design and requirements. Test Plan The following functional areas have been determined as needing testing. The numbers in brackets represent the requirements specification numbers, which in turn relate to specific design requirements. D.1 Parse and output a log line (4.0, 4.1, 4.2, 4.3, 4.4, 4.5, 4.6, and 4.8) D.2 Detect any bad lines (4.7) D.3 Work with CLF log files (3.9) scs2htd 17 Results The actual test plan and results can be found in Appendix F - Parser Functional Testing. It shows the area being tested along with each test and the outcome. The parser passed 100% of the functional tests. 3.4.2 Non Functional Testing This section details the testing of those non-functional aspects of the parser that filtered down from the existing tool requirements. They are not required for the program to function, but must tested so that they are present and work correctly. Test Plan The following non functional areas have been determined as needing testing, the number in brackets represent the requirements specification numbers, which in turn relate to specific design requirements. U.1 Inform the user of proper usage (2.0, 3.7) U.2 Inform the user if a bad file was supplied (2.0, 3.7) U.3 Inform the user of the current operation being performed (2.0, 3.5) Results The actual test plan and results can be found in Appendix G – Parser Non-Functional Testing. It shows the area being tested along with each test and the outcome. The parser passed 100% of the non functional tests. 3.5 Evaluation 3.5.1 Evaluation Criteria I will list the criteria with which I will evaluate the effectiveness of the tool and give a short justification as to why the criterion is being used. 1. Requirements Review The requirements laid down at the beginning of the parser phase were the basic functions and services that the parser should now perform. If the parser does not now meet these requirements then the wrong parser has been built. 2. Testing Results. The requirements may have been met, the test results will help reveal this, but will also tell the author how effective those requirements are that have been implemented. 3. Parser Comparison. A useful way to judge the effectiveness of the software is to compare it with other parsers, in particular looking at those parsers used by the software surveyed in section 2.5.3. scs2htd 18 4. Project Requirements Review The parser was built to satisfy one of the three minimum requirements of this project. It will be also useful to look at the final parser and answer the question; does this software meet the minimum requirement? 3.5.2 Evaluation Results 1. Requirements Review It is clear from looking at the final version of the parser that it definitely meets the original requirements. The testing revealed this and also from running the parser on actual CLF files supplied from the SoC web server, which clearly show clean output of the relevant information. The following is a list of the original parser requirements. A tick indicates a requirement that has been achieved: Must Have: 9 3.9 The system shall work with CLF log files 9 4.0 The system shall ‘clean’ up each log file line, such as removing unwanted characters like white space and brackets. 9 4.1 The system shall parse each line of the file 9 4.2 The system shall find and extract the ‘bytes’ information 9 4.3 The system shall find and extract the ‘status’ information 9 4.4 The system shall find and extract the ‘file’ information 9 4.5 The system shall find and extract the ‘date’ information 9 4.6 The system shall store the information from the parsed log file either within the running program for advanced processing or output the parsed ‘clean’ data to another text file. Should Have: 9 4.7 The system shall find and extract the ‘IP’ information. 9 4.8 The system shall detect ‘bad’ log file lines and report on them. Could Have: 8 4.9 The system shall handle all log file formats. The only requirement not met was the ‘Could Have’ requirement which was not initially designed into the system due to time constraints. The parser works on CLF files only and this highlights a weakness of the parser. 2. Testing Results Overall 100% of the testing passed and no defects were found. The high percentage of ‘passed’ tests reveals a well functioning parser that meets the requirements. scs2htd 19 3. Parser Comparison. It is possible to find out how other log file analyzers parse their files by studying the information provided, as well as looking directly at their source code. AW Stats - This log file analyser is also written in Perl. It can parse any of the log file formats. You supply the log file and it automatically recognises the format of the file you supplied. It specifically parses each log line by using regular expressions to identify and store the different items of interest. This parser is much more flexible. It can deal with multiple formats, while mine can only parse CLF files. AW Stats parser uses regular expressions mainly because it is an easy way of dealing with multiple formats. Using regular expressions means all the formats can be hard coded with their specific pattern, and thus the program can simply check what the input matches. If my parser were to also deal with multiple formats, using regular expressions would be the implementation choice. However currently the SoC web server log files are set as CLF by default and my parser deals with these adequately. Analog - This log file analyzer is written in C. Although it is not possible to do direct comparison of programming languages, it is useful to look at how this program carries out its parsing. Again this parser automatically identifies the log file format supplied to it, so it can deal with multiple formats. If however it cannot identify the format, it allows the user to supply it. This is extremely flexible and can even deal with user defined log file formats which do not match any of the standard formats. log_report.plx - This code from [38] highlights another approach to parsing a log file. It is written in Perl. This uses regular expressions to identify the items of interest. However instead of automatically identifying the file format given as input, the user has to manually alter a program variable in the code. This method involves less code for the automation of format detection, and the user may not have to alter the code if the program was adapted to simply allow the user to input the format being used via the command line. All of the other parsers use a different method for parsing the log lines, namely using regular expressions. My implementation does not, because it only has to handle CLF files. This highlights some inflexibility in my parser and scope for possible improvements. 4. Project Requirements Review. The first project minimum requirement was ‘A tool that can parse the SoC web server log.’ It is obvious that my parser can do this. The SoC log files are all in CLF and my parser was built to parse scs2htd 20 these and these only. If for some reason the format of the SoC log files were to change then this parser would not work, again highlighting some inflexibility. The evaluation revealed that the parser met both its initial software requirements and the project requirement. The testing revealed no major defects and it is safe to conclude that this parser is effective. 3.5.3 Future Improvements A distinction was made between maintenance and an ‘improvement’, where any function or feature of the software mentioned in the ‘must’ and ‘should’ requirements and were not implemented perfectly would result in maintenance, and everything else is an improvement on the attempted software. CLF Only Checking – The parser will only work with CLF files and was designed to do so. However it is possible to give the program another log file format and the program will try to run as normal, but the results will not be meaningful because the items of interest may be in different places within the log line. To improve this, a simple check could be done which looks at the first line of the input file and checks it matches the pattern for the CLF log files. This is the regular expression pattern: my ($w) = "(.+?)" /^$w $w $w \[$w:$w $w\] "$w $w $w" $w $w$/ The check would come before all other checks for bad lines, but obviously after the file is opened. If the first line of the log did not match this pattern, you could safely assume that the whole input file was not a CLF file, and an error could be displayed to the user informing them of this. This description could be easily transformed into Perl code to implement the improvement. This improvement does not add any flexibility to the program but rather adds error checking. It would stop such things as people supplying an image file, because it would not match the pattern. Handle Multiple Formats – As mentioned above the program can currently only parse CLF files. This is inflexible because the SoC may change their file format to another Apache log standard, or they may even change their web server, meaning a whole other range of formats would be possible. So to account for this and to build in flexibility, one of the methods mentioned in the Parser Comparison in section 3.5.1 could be used. I think the best method would be to perform more checking on the first line of any given input. For instance, when the program reaches the first log line, it could do multiple checks against a regular expression for each known log file format. If the log matches one of these patterns then, the program can alter its execution, so that meaningful results are obtained from whatever format log file was supplied. If, for example, the supplied log file was in ‘National Centre for Supercomputer scs2htd 21 Applications (NCSA) extended’, the program would see that the first line of the log matched the NCSA pattern and none of the others. Then the execution could be passed to a function which processes and outputs information only from NCSA format files. You would end up with a number of different functions which dealt with different formats. These patterns would mean if someone supplied a non text log file such as an image, it would be detected and the user could be informed that their input file did not conform to a valid input type. scs2htd 22 4 Existing Techniques Phase 4.1 Chosen Techniques This section documents the choice of techniques to be used divided into the MoSCoW rules again. Must Have 1. The system shall display the total number of requests (hits) 2. The system shall display the total number of bytes sent. 3. The system shall display the total number of successful requests (status code 200) 4. The system shall display the total number of failed requests (e.g. code 400 and 404) 5. The system shall display the total number of redirected requests (code 3xx) 6. The system shall display total number of requests per file. 7. The system shall display the total number of requests for pages. 8. The system shall display the total number of requests per page. 9. The system shall display the total number of requests per day (E.g. Monday – 12, Tues etc). 10. The system shall display the total number of requests for pages per day. 1 – 5 and 7 occur in all the packages within the standard summary that the user always sees first and offers a good overview of the log information. Page information offers a greater level of detail from the ‘summary’ items. Should Have 1. The system shall display a file type report. (E.g. 10% .gifs, 56% .pdf etc) 2. The system shall display the total number of unique users (unique IP addresses). 3. The system shall display a status code report (E.g. 10 % 200, 70% 400 etc) 4. The system shall display a summary of total requests per hour. The holy grail of web analytics is to find out exactly how many individual people are accessing your site. Each unique IP address should tell us at least how many people we have visiting. These ‘should have’ reports become more detailed and offer more information in each area. Could Have 1. The system shall resolve all IP addresses so that their domain names become available. 2. The system shall display a report regarding file sizes served. (E.g. 10 % 1kb, 50% 10Mb etc). Want to Have, but not this time around 1. The system shall ‘know’ which IP addresses represent those visitors which are not human i.e. they are web spiders and robots. I deemed some log line items useless, and therefore they do not fit under the MoSCoW rules. scs2htd 23 Not Very Useful 1. The system shall not display reports regarding the time zone information. 2. The system shall not display reports regarding the actual request method. This information is almost always ‘GET’. 3. The system shall not display reports regarding the request protocol used. This is predominantly HTTP1.1 or one of its versions. Useless 1. The system shall not display reports regarding the client identity. This information is never present in the log file and therefore such reports would be impossible to produce anyway. 4.2 Requirements Analysis 4.2.1 Data Gathering A very limited informal semi structured interview via email with one of the intended users which gave some insight into the requirements. The script from this interview can be seen in Appendix D – Requirements Data Gathering. ‘R’ stands for Reading in the ‘SQIRO’ range of techniques so the software survey in section 2.5.3 counts for this. These methods, combined with the fact there is no current solution to the problem gave me enough information to start defining the requirements for the tool. 4.2.2 Target Users It is useful to use a Use Case diagram for this section because it both shows the users and stakeholders of the system and it ‘describes what the system should do from the perspective of its users’ [39] and therefore we can determine the functional requirements of the system by looking at each use case. The main administrator of the system is Dr Jonathan Ainsworth who is the ‘Information Systems Support Officer’ and has access to the SoC web server as part of his job. There are other possible stakeholders who may wish to view the SoC web site usage if such a method was available. See the UML Use Case diagram in Figure 4.1 Other staff may wish to view the SoC website usage also. We could consider students to be possible users; they also may wish to view the SoC website usage. However the nature of the data held in the log file would probably make this unlikely, as data protection applies to it. Figure 4.1 also shows the interaction between the stakeholders and the system. You can see that in general the users will be SoC staff. There are more specialised cases of staff however. For instance you can see that staff may only be concerned with web server specific information from the log such as status codes and data sent, whereas a webmaster is concerned with reports regarding the web pages on the SoC website. scs2htd 24 4.2.3 Functional Requirements This section covers the functional requirements of the system determined from Figure 4.1 and via the software survey in section 2.5.3. Must Have 1. The system shall operate through the command line interface. 2. The system shall generate and output text reports to the command line. 3. The system shall use a small selection of existing techniques. 4. The system shall operate through a menu via the command line. 5. The system shall generate and output graphical reports. Should Have 1. The system shall use the full range of existing techniques possible. Could Have 1. The system shall have a graphical user interface. Want to Have, but not this time around 1. The system shall use log files in different formats that provide more information for analysing such as ‘user OS’. 4.2.4 Non – Functional Requirements Bennett et al [35] describe the non-functional requirements of a system to be ‘the qualities of a system rather than specific functions, which come under the headings of usability, security and performance.’ 1. The system should inform the user what the current operation is doing so the user does not lose interest and is not confused. Faulkner [40] highlights this as a useful piece of interaction that supports the user and allows them to answer such questions as ‘what is happening’ and ‘what can I do’. 2. The system menu should be easy to navigate and allow the user to exit or go back at any point. 3. The system should give prompts when it is awaiting input. 4. The generation of the reports should be as quick as possible. See Appendix H – Existing Tool Requirements Specification for the final requirements document. 4.3 System Design 4.3.1 Conceptual Design This design discusses the processing, output and graphics modules as seen in Figure 3.1. Processing Firstly some sort of count needs to be performed every time a log line is processed. This represents the total number of requests the web server had to deal with. So a variable will have to be incremented by one every time this processing stage occurs. This satisfies tool requirement 1.0. scs2htd 25 Figure 4.1: A UML Use Case diagram depicting the proposed system and its stakeholders. Every log line has a value for the bytes sent from the web server to the client in a response. A variable which adds this bytes value to itself for every line will result in a variable that contains the total number of bytes sent for the entire log file. This satisfies tool requirement 1.1 To work out how many of the total requests had successful http status codes, a variable can be incremented. If the log lines status code is equal to either 304 or any three digit number beginning with a 2, this variable can be incremented by one. This satisfies tool requirement 1.2. Similarly for tool requirements 1.3 and 1.4 another variable could be incremented if the equality condition is met. To satisfy tool requirement 1.5 a data structure called a hash in Perl can be used. Basically this is just an associative array which stores key-value pairs with the keys always being unique. For this each file requested will have to be stored as the key and the value associated to each of these keys will be an integer. This integer will represent a count of how many times that particular file was requested. So this hash will add the first log line’s file to it with a count of 1. For every subsequent log line, it will scs2htd 26 find whether the file exists within the hash. If it does, the associated count will be incremented by one; if it does not then it will be added. The distinction between a request and a page request needs to be made. A request is a single log line, which can be a request for any object held on the web server be it an image file, a text file or a HTML page. A page request is a request but only for viewable web pages. These pages are defined as those files with the extension .html, .htm, .shtml, .cgi, .php, .asp, .jsp. To satisfy tool requirement 1.6 there will be a variable for each different page type. For every log line, a check will be performed to see if the file contains any of the page extensions. This will be done using regular expressions and the pattern will be similar to: /\.html/ The back slash allows the period character to not be interpreted as the special character which normally acts as a wild card. This gives us the pattern for a file extension. If any file matches a pattern similar to the one above, then the variable for that type of web page is incremented. Then we can add all the page type variables together and this will reveal how many pages were requested in total. Requirement 2.5 can utilise a similar method as that for 1.6. All the different file extensions will have their own variable. With this information each extension can be calculated as a percentage of the total requests. Requirement 2.7 also uses the method of showing status codes as a percentage of the total requests. However the status codes do not need regular expressions and can be identified if the status code equates to a value instead. 1.8 and 1.9 involve identifying the specific day of the week for each log line. This could be complicated because only dd/mm/yy date information is available. As the day of the week for a certain date keeps changing every year, an additional Perl module will have to be utilised for this function. One of the modules listed at [41] which deals with Date/Time information may be able to help. This will involve the installation of the chosen module to the user’s machine or Perl root directory. Once each date is turned into a specific day of the week, it will be possible to simply have a variable for each day, and when that day appears in the log, increment this variable by one. 1.9 refers to calculating the total number of page requests per day as opposed to requests per day. So if a page match is found and the line was on a particular day of the week, the appropriate variable can be incremented. In total there will be 14 variables, 7 which hold normal requests and 7 which hold the page request numbers. scs2htd 27 2.8 will be a much easier requirement to implement. It simply requires a list of how many requests were made in each hour of the day. There is a time variable in the format HH:MM:SS so it can be converted to seconds using another Perl module, and then a comparison is performed to see if this log line’s time falls within a certain period of seconds. Then the variable associated to that time period can be incremented. Requirement 1.7 can be satisfied using a hash similar to the method described for 1.5. Those files that match a web page should be added to a hash with a count as described previously. The method for matching those pages using patterns as described to satisfy requirement 1.6 and 2.5 can be built upon. When the pattern matches a web page, it can increment that web page’s variable but also add the current log line’s file to the hash. 2.6 can be completed by using another hash. The same checking can be performed for IP addresses as was done for the files. The very first log line’s IP address is added to the hash. Every subsequent line should check to see if its IP is already in the hash. If it is then simply increment the count, if not then add it to the hash. This will give a hash keyed on IP address. Not only will it offer information for how many requests each IP made, it can count how many visitors; by putting the hash’s keys into an array and then finding the size of this array. The last requirement 2.2 will be satisfied if all of the above are implemented properly. This is adequate for ‘a small selection’ of techniques. Output The processing will finish after the last line of the file has been processed. Then some way of showing the user this new information is needed. Requirement 2.0 specifies it must be via the command line. To do this a list of reports could be displayed after processing. These reports would simply be in text format by printing out the variables and some presentation formatting. This satisfies requirement 2.1 also. The reports could be output to the command line at will when the user wished to see them instead of printing them all out at once. So a simple command line menu will be output. This menu will show all the options the user can take. Each option will be a report of some type or a command to return to the main menu. The physical design discussed later describes the menu system and its appearance in more detail. This menu system will be kept as simple as possible and the user will only have very few choices at each point of the menu. Navigation through the menu forwards and backwards must be allowed. This satisfies the non-functional requirement 3.6. scs2htd 28 Graphics To satisfy requirement 2.4 that the ‘system shall generate and output graphical reports’ the processed information will need to be input into some graphics package that can easily produce simple bar and pie charts. This will aid the user’s cognition when looking at the information compared with the text reports. The graphs will basically be produced in an image format. These images need to be saved within a new directory contained within the current directory of the running script. This will allow the user to exit the command line program and then go view the charts. The ‘Could Have’ requirements will not be designed for at this time, if the implementation for everything else goes better than expected then these requirement will be designed and added to the system. 4.3.2 Physical Design Text Output After the user supplies a log file as an argument to the Perl script on the command line, there will be a few informational alerts printed to the console. These are simply to keep the user informed. Once these have been printed out the parsing and processing will have finished and the summary report can be printed. This summary report contains the simple totals of data and can be listed. They offer a good first look at the data. Immediately following this report the main menu will appear also. The menu will allow the user to access all the reports. There will also be an option on the menu to view the summary report again if needed and an option to exit the program. After each report has been output a prompt will be printed asking the user if they wish to return to the main menu or exit the program now. This satisfies requirement 2.3. Sketches of these reports can be seen in Appendix J - Existing Tool Physical Design. Graphical Output The graphical output should be produced just after the processing has finished but before the user is informed that the parsing has finished. If the graphs were produced when the user chooses to exit the program, there may be some delay in generating them, so if we simply add this delay to the time it takes to process it will become more transparent to the user when the graphics are being produced. You can see the initial design sketches of the intended graphical output in Appendix J - Existing Tool Physical Design. 4.4 System Implementation It was decided for continuity and so that a new language did not have to be learnt that the Perl module GD::Graph would be used. It required installation into the author’s user area. The perl script was dubbed ‘Logalyse’. scs2htd 29 4.4.1 Problems Encountered When implementing requirements 1.5 and 1.7 the initial design was implemented. However it became clear that this method would not be practical for an average sized log file. Simply printing out the whole hash with a count for each unique file meant that a large amount of printing to the command line would be done, too much for the user to assimilate. Therefore an alternative method was devised; instead of outputting all of the hash, now only the ‘top ten’ files would be output. This would mean a static report size, and the information supplied would me more useful. The user would be able to see the most frequently visited files or web pages on the site. This implementation involved sorting the hash by value rather than by its keys. It would have to be sorted in descending order and then only the top ten items should be output to the command line. This took two stages; the first stage of which was to sort the hash by value. To do this the author had to create his own function as follows: sub highPage {$pageList{$b} <=> $pageList{$a}} #sorts hash values in descending order This function would be used in conjunction with Perl’s ‘Sort’ function. The second stage was to ensure that only the top ten were output. This involved adding some control variables to the loop which was originally used to go through each of the hash’s keys and output them. A variable was set to hold the maximum number of output, and another was initialised to zero. Within the loop the second variable would be incremented each time, and then a check would be performed to see if the first variable equals the second, then exit the loop and therefore stop printing out to the command line. foreach $page (sort highPage(keys(%pageList))) { $pageCount = $pageList{$page}; write; $num_output++; last if $num_output == $docsInReport } The end result is that for both the object and page hashes there is a ‘top ten’ report. Building the tool also revealed a problem with the parsing module built previously. When running the tool on a small sample file it worked well. However a strange error occurred when running it on a larger log file as follows. scs2htd 30 Use of uninitialized value in pattern match (m//) at ./fileAccesses.pl line 47, <LOGFILE> line 1747909. Use of uninitialized value in hash element at ./fileAccesses.pl line 51, <LOGFILE> line 1747909. These errors consistently appeared the same number of times for the larger log file. This meant something was present in the larger log file that was not in the sample. Because the larger log file was so big, it was not possible to manually search for any obvious bad data. So instead it was decided to change the way in which the parser identifies a ‘bad line’. Originally it just took a bad line as white space. However this obviously doesn’t catch all cases of a bad line. So to remedy this, if the line did not match the pattern for a CLF file then the bad lines variable would be incremented as before. This remedy is similar to one of the future improvements that could have been made to the parser. The regular expression for the CLF file can be found in section 3.5.3. 4.4.2 Actual Implementation When implementing the other program functions it became clear that something had been omitted. All the processing currently ran on the whole log file. What if someone didn’t want to view the whole website’s usage, only a particular part of it? The solution to this would be simple. Allow the user to supply their own directory of the SoC website and then perform the processing as normal, but only on those log lines whose files matched the supplied directory. With this restriction it also became clear that other user supplied restrictions on the processing could be carried out. For example a user could supply an IP address, and again the processing would only be performed on those lines which match the supplied IP. This would be of use because it would allow the user to view the pages and information relating to that particular IP address and how it used the website. This resulted in a requirements and design change; in particular changes were made to Figure 4.1 to include two extra use cases as described above. This change to the requirements also meant the design had to be amended. The implementation had to be changed to allow the user to supply not just one argument (the log file) but now another optional argument which could either be an IP address or a directory of the SoC website. The checking of this extra argument involved using the full IP address regular expression: /^(\d|[01]?\d\d|2[0-4]\d|25[0-5])\.(\d|[01]?\d\d|2[0-4]\d|25[0-5])\.(\d|[01]?\d\d|2[0-4]\d|25[05])\.(\d|[01]?\d\d|2[0-4]\d|25[0-5])$/ If the second argument matched this pattern, then the user is supplying an IP address, if the user is supplying any number of characters then they must be specifying a directory. If neither of the above scs2htd 31 cases were met then the execution of the script stops and an alert is printed to the user informing them that the second argument they supplied was not in the correct format. If no arguments were supplied then the normal processing is carried out on the whole log file, however if the second argument was supplied and the IP address or file of the current log line match the argument supplied, then processing is performed, and lines are ignored that do not match the supplied argument. Originally the designed specified that requirement 2.8 should be implemented by converting the time to seconds by obtaining a Perl module that could handle and manipulate date/time information. However an easier method was implemented that did not involve the installation of a module. The time is in the format HH:MM:SS so as to enable the numerical comparisons to determine which hourly variable to increment the time must be free from the colons. Using the ‘split’ function, the time was divided into three pieces and then concatenated back together. This resulted in the time being a six digit number. The comparisons were performed on this basis rather than the number of actual seconds each time represented. Calculating the number of unique visitors to the site was completed, and a value was calculated based on the number of keys within a hash that contains unique IP addresses as keys. It was decided to add a report which output the ‘top ten’ IP addresses and their number of requests on the web site in a similar fashion to the implementation of requirements 1.5 and 1.7. The design stated that when the user selects a report from the menu, the report would be output followed by a prompt, asking the user if they wished to exit or return to the main menu. This was not implemented because it was thought just as simple to output the main menu straight after each report. The user can still choose another report this way and exit, but it removes a step in the design which was deemed unnecessary. The implementation did not include requirements 1.8 and 1.9. It was felt that giving the hourly report was adequate, and that other implementations such as the ‘Should have’ requirements were to be concentrated on. There was not time to implement these requirements so this functionality is missing from the system. scs2htd 32 4.5 Testing 4.5.1 Defect Testing Test Plan The area numbers continue from those in the Parser testing phase (section 3.4). D.4 Accurate Techniques (1.0, 1.1, 1.2, 1.3, 1.4, 1.5, 1.6, 1.7, 2.5, 2.6, 2.7, 2,8) D.5 Bad Lines Detection (parser requirements retested due to implementation change 4.7) D.6 Supply an IP address (New requirement 4.0) D.7 Supply a directory (New requirement 3.9) D.8 Command Line menu controlled text based reports (2.0, 2.1, 2.3) D.9 Graphical Reports (2.4) Results 80 % passed the functional tests, and only 2 tests failed, successfully revealing defects. Functional areas D.6 and D.7 both failed, revealing defects because the program output meaningless blank reports, rather than informing the user the supplied restriction was not present in the log file. These defects are not critical. Appendix K – Existing Tool Functional Testing contains the full test plan and results. 4.5.2 Non Functional Testing Test Plan Area U.1 was repeated to ensure the program informs the user of proper usage, now that it is possible to supply a second argument. U.1 Inform the user of proper usage (2.0, 3.7) U.4 Inform the user if an invalid IP address was supplied (2.0, 3.7) U.5 Inform the user if an invalid directory was supplied (2.0, 3.7) Results 66 % of the tests passed with no defects however, 33 % failed. Both failures were due to defects meaning that the argument checking was not working correctly meaning invalid input could be provided by the user. This was deemed critical. Appendix L – Existing Tool Non-Functional Testing contains the full test plan and results. scs2htd 33 4.5.3 Performance Testing Sommerville [1] describes this testing as ‘stress testing’ and its purpose is ‘…to ensure that the system can process its intended load’. Throughout the implementation testing was performed using a very small sample of a full log file, and it was not tested in full on larger log files such as the typical sized ones that will come from the SoC web server. This testing will seek to both test the ‘failure behaviour’ of the system to see if and how the program can fail, and to find defects which have not been caught in the defect testing with the smaller sample log files. Test Plan The program will run on increasingly larger log files obtained from the SoC web server. This should give us an accurate view of how well the program performs under increasing loads. The log file size will go beyond that of the weekly rotation log file size, to see if the program will fail. Not all logs used are ‘real’ logs, some have been created using a small set of the actual logs obtained, differing in file sizes. The time taken to finish all parsing and processing will be the main factor recorded during testing. All file sizes are approximate. Test 1 – Normal operation, no supplied IP address or directory. Log 1 – 5Mb, Log 2 – 8Mb (actual log), Log 3 – 10Mb, Log 4 – 15Mb, Log 5 – 29Mb (actual log), Log 6 – 30Mb, Log 7 – 60Mb, Log 8 – 120Mb, Log 9 – 180Mb (actual log), Log 10 – 240Mb. Test 2 – User supplied IP address, same logs Test 3 – User supplied directory, same logs Results A run time graph can be found in Appendix N – Performance Testing Results which details the running times for the program. Performance logs 8 and 10 could not be produced due to storage capacity constraints on the author’s user area. However all the actual SoC logs were tested with a file size of up to 60 Mb. Logalyse takes significantly less time to run if an IP address or directory is specified. The longest run time was 9 minutes 30 seconds, which was the largest 180 Mb log with no restrictions specified. No additional defects were detected due to the large data sets, and the program worked effectively for all log sizes. scs2htd 34 4.5.4 Usability Testing This section details the user testing of the software produced. Preece et al [37] describe ‘usability testing involves measuring typical user’s performance on carefully prepared tasks that are typical of those for which the system was designed’. The testing needs real users. This helps because you ‘…shouldn’t presume that following design guidelines guarantees good usability’ [37]. Even though the author may have built the product to the correct specifications, this doesn’t mean people will be able to use it. This testing section will help test the requirements such as 3.6 which require that ‘the system should be easy to navigate…’ Participants The system was intended to be used by mainly SoC staff; however this does not mean SoC staff should be the only people testing. A typical user could be anyone in reality so the spectrum of users in the test must reflect this as much as possible. Preece et al [37] describe one of the most important characteristics in choosing users as those with ‘previous experience with similar systems’, and conversely those who have not had any previous experience with web analytics systems should be chosen. Users chosen were IT literate and those who were not. This reflects the general IT literacy of SoC staff and for someone who is likely to be interested in web analytics in general, and those who don’t have any IT knowledge. The users are as follows: Benjamin Carter – 21-year-old finalist at the University of Leeds, studying Computing with AI. Nicholas Read – 22-year-old finalist at the University of Leeds, studying Information Systems. Tarun Mistry – 22-year-old finalist at the University of Leeds, studying Computing. Katherine Berrill – 19-year-old at the University of Leeds, studying Cinema, Photography and TV. Procedure Each user will be given a consent form to sign. If they agree to the form conditions then a short introduction to the problem and the software will be given. No demonstration of the software’s operation will be given before the tests; testers must follow the tasks given to them for knowledge on how to use the system. The author will observe each tester while performing the tasks and make note of any program errors that arise. After each task the tester will fill out the appropriate section of a user satisfaction questionnaire. The author will be present at all times to ensure that test conditions allow for minimum distraction. This user testing is ‘strongly controlled’ by the evaluator as described by [42]. The tasks will comprise familiarising the tester with the tool, operating the tool and viewing the reports on ‘doctored’ log files. This will enable the author to ascertain if the tool is presenting the scs2htd 35 correct information to the user. Then ‘real’ log files will be used and the tester asked for their opinions. Results The feedback from the testers was positive in some areas, while there was a consensus for plenty of improvement. Users agreed what was present was easy to use; the average participant score was 2.9. However there were many suggestions for future improvements and additions to the functionality. The lowest average participant score (2.7) came from one of the people who had used web analytics previously, but overall though the tool was perceived as a good grounding for a tool which could easily be extended. Common suggestions were to move away from the command line interface to a HTML web based report, which would somewhat remove the ‘boring’ reports seen on the console. These reports are fine, and for a user who uses the software a lot, however if you wish to compare the previous usage or usage of another log file there is no option to do so. The full usability results and full discussion of other details can be found in Appendix O – Existing Tool Usability Testing. 4.6 Maintenance 4.6.1 Fixed M1.The non functional testing had a number of failures in the area surrounding checking of the second argument supplied (see section 4.5.2), be it an IP address or directory. This checking was not working to an acceptable standard so was deemed critical enough to warrant the following fixes. The implementation meant that the user could supply any number of characters for the second argument. This however meant it was not distinguishing between a directory being supplied and the user providing incorrect input or an IP address. This also meant that entering ‘a.b.c.d’ was not caught as an incorrect IP address but was used as the directory supplied. The fix was to ensure that the second argument matched two things. The IP pattern was kept as before but this time instead of matching any number of characters, the user must supply the directory in the format ‘/directory’ so if the second argument matched this pattern: m/\/.+/i scs2htd 36 then it is safe to assume they are trying to specify a directory. This also meant that later on, the check to see if the current line’s file matched the supplied variable had to be changed. The pattern here previously had the forward slash added to it, but now as the user is supplying this it is not needed. This meant that the input values were controlled, which makes the input checking easier. M2. Fix 1 meant that the user supplies either an IP address or a directory (in format /<directory>). This meant that the checks to see if the current log lines file matched either the IP variable or the directory variable no longer worked. Before a check was to done to see if the current line IP matched the supplied IP, or if the current line’s file matched the supplied directory preceded by a forward slash. This forward slash was taken out in fix 1 because the user is now supplying it. However this meant when someone was entering and IP address, the directory variable would be set to zero, and the check would see if any lines file matched only a zero, as well as checking the IP for each line. This meant the results were wrong when the user specified an IP address. The solution was to set the variables not to zero but to set them to a null sting: if ($ARGV[1] =~ m/^(\d|[01]?\d\d|2[0-4]\d|25[0-5])\.(\d|[01]?\d\d|2[0-4]\d|25[0- 5])\.(\d|[01]?\d\d|2[0-4]\d|25[0-5])\.(\d|[01]?\d\d|2[0-4]\d|25[0-5])$/ ) { $ipSpecified = $ARGV[1]; $directorySpecified = ''; } elsif ($ARGV[1] =~ m/\/.+/i) { $directorySpecified = $ARGV[1]; $ipSpecified = ''; } This means, if the supplied argument was an IP address the pattern would match, and consequently set the directory variable to null, and conversely, if the user supplied a directory it would match and set the IP variable to null. Meaning the checks later could not falsely match to a zero, because they perform their checks on null values which would never match in the log file. 4.6.2 Future Maintenance F1. The file extension reports and the status code reports are not exhaustive. They only list a few of the possible file extensions and status codes. So to make them complete you would have to add to the current list of codes and extensions and increase the size of the report formatting. F2. The status code and file extension reports basically list the values found for each. Currently if a value is zero and none are found this fact is still shown. This produces a large and unnecessary report. scs2htd 37 Even more so if F1 were to be fixed. So the solution would be to only output those values which are non zero. F3. It is noticeable that in the reports which output the frequent objects and pages that some files have different counts although they mean the same thing. For example the files: /file1 400 /file1/ 265 These are the same objects on the web server (due to the format in which web servers allow requests to be supplied); however they are counted as two different objects. This is misleading and the solution would be to only add a file to the hash if it definitely wasn’t already present in it as a key. For example you could perform some checks, if the current file matches a pattern you know to be the same as another then simply replace the file with the standard one. This is basically making the files canonical before placing them in the hash. F4. The pie chart output is currently not sorted in any way. The pie segments are not ordered descending or ascending which I feel would help. The current implementation using the GD::Graph module does not allow this. Therefore another graphics module should be found. This may also mean better quality less pixelated images are produced if chosen carefully. 4.7 Evaluation 4.7.1 Evaluation Criteria 1. Requirements Review The requirements laid down at the beginning of the existing techniques phase were the basic functions and services that the tool should now perform. If the tool does not now meet these requirements then the wrong tool has been built. 2. Testing Results. The requirements may have been met, the test results will help reveal this, but will also tell the author how effective those requirements are that have been implemented. The user testing will give us good insight as to whether or not the software is useable, and the performance testing will tell us if the running time aspects have been met. 3. Tool Comparison. A good way to see if what has been built is good or not is to compare it to other tools around. In particular looking at those tools surveyed in the background section of this report (section 2.5.3). scs2htd 38 4. Jonathan Ainsworth Consultation Preece et al [37] identify one way of evaluating software by performing ‘quick and dirty’ evaluation. I consulted the SoC web site administrator informally and demonstrated the tool. 5. Project Requirements Review The existing tool was built to satisfy one of the three minimum requirements of this project. It will be also useful to look at the final tool and answer the question; does this software meet the minimum requirement? 4.7.2 Evaluation Results 1. Requirements Review By looking at the final tool (see Appendix R for the console dumps of the existing tool) you can see it meets most of its requirements. The following is a list of the existing tool requirements. A tick indicates a requirement that has been achieved: Must Have: 9 1.0 The system shall display the total number of requests (hits) 9 1.1 The system shall display the total number of bytes sent. 9 1.2 The system shall display the total number of successful requests (status code 200) 9 1.3 The system shall display the total number of failed requests (e.g. code 400 and 404) 9 1.4 The system shall display the total number of redirected requests (code 3xx) 9 1.5 The system shall display total number of requests per file. 9 1.6 The system shall display the total number of requests for pages. 9 1.7 The system shall display the total number of requests per page. 8 1.8 The system shall display the total number of requests per day (E.g. Monday – 12, Tues etc). 8 1.9 The system shall display the total number of requests for pages per day. 9 2.0 The system shall operate through the command line interface. 9 2.1 The system shall generate and output text reports to the command line. 9 2.2 The system shall use a small selection of existing techniques. 9 2.3 The system shall operate through a menu via the command line. 9 2.4 The system shall generate and output graphical reports. Should Have: 9 2.5 The system shall display a file type report. (E.g. 10% .gifs, 56% .pdf etc) 9 2.6 The system shall display the total number of unique users (unique IP addresses). 9 2.7 The system shall display a status code report (E.g. 10 % 200, 70% 400 etc) 9 2.8 The system shall display a summary of total requests per hour. 8 scs2htd 2.9 The system shall use a full range of existing techniques. 39 Could Have: 8 3.0 The system shall resolve all IP addresses so that their domain names become available. 8 3.1 The system shall display a report regarding file sizes served. (E.g. 10 % 1kb, 50% 10Tb etc). 8 3.2 The system shall have a graphical user interface. General: 9 3.5 The system shall inform the user what the current operation is doing so the user does not loose interest and is not confused. 9 3.6 The system should be easy to navigate and allow the user to exit or go back at any point. 9 3.7 The system should give clear prompts when it is awaiting input. 9 3.8 The generation of the reports should take no longer than 10 minutes. Additional Requirements: 9 3.9 The system shall allow the user to supply a directory as an optional argument, and display usage only for that content. 9 4.0 The system shall allow the user to supply an IP address as an optional argument, and display usage only for that address. Two of the ‘must have’ requirements were not met. It is arguable that the existing tool is not the right product for the solution because of this; however the author believed that other requirements in the ‘should have’ sections took precedence and this highlights a possible requirements analysis or at least MoSCoW classification failure. Not all of the ‘should have’ requirements were met. There were many reports not present in the tool, because they were deemed useless for this particular project, so the requirement to use a full range of existing techniques was not met. None of the ‘could have’ techniques were designed for and consequently not met. All of the non functional ‘general’ requirements were met, as were the additional requirements added during implementation. 2. Testing Results. The majority of the testing revealed that all functionality worked effectively. Some issues to do with argument checking had to be dealt with because it was a critical problem. Overall high percentages of passed tests were seen. The performance testing revealed large run times on logs over 100Mb in size. However the testing on the largest 180Mb log file still showed that the run times were below 10 minutes. Complexity of the scs2htd 40 program for both normal operation and user supplied restrictions was O(n). This reflects the code in that for every line of the log file some processing has to be performed. Supplying restrictions obviously decreases the number of times the processLine sub routine is called and therefore less processing performed giving the lower run times. Normal processing is performed for every log line that matches the CLF pattern. This processing involves a number of regular expressions and entry of data into hashes inside the processLine sub routine. Although there is no deterioration in run time because of the program’s complexity, the inefficiencies are thought to be due to some of the coding pitfalls as highlighted by [43], but this is only an assumption and not proven whether or not the improvements mentioned in [43] would help. The usability testing revealed that the software was easy to use. Participant scores were all high. Good suggestions for improvement were received, and many matched those already conceived by the author, confirming that they are sensible improvements that the user would wish for. 3. Tool Comparison. Logalyse is lacking the HTML web based reports which the majority of the other tools seem to have. Using HTML allows for good presentation of both the images and textual statistics in one place, Logalyse struggles to bring the two together because of being command line operated. Logalyse also lacks a number of reports common to the other tools; however this is largely due to the fact that Logalyse can only parse CLF files, and therefore cannot produce information such as an operating system report for example. Logalyse would need to parse other file formats and offer the full range of techniques to meet the standards set by the other tools. 4. Jonathan Ainsworth discussion Jon kindly agreed to give some feedback on the final version of the tool. He was given a short demonstration of the tool and then said what he liked and gave possible improvements. Positives 1. The tool looked simple to use and gave some good figures on the status codes and most frequently visited pages which helped confirm what Jon already suspected about the web site usage. 2. Overall a good basic tool which could be easily extended. scs2htd 41 Negatives 1. The fact that the tool was command line based meant Jon felt it wouldn’t be very usable, he immediately suggested a HTML report which brought together both the textual statistics and the images produced. 2. Jon felt that allowing the user to supply some options via the command line or via a cgi interface would allow for greater control over the reports. For example he may not wish to see an hourly report, but only daily or monthly, so instructing the program to leave this out would be a nice feature to have. 3. Jon is frequently asked questions regarding the usage of the website, such as how many people are viewing our admissions pages? And where are they viewing it from? Are we expecting a lot of admissions this year from China? To give the geographical information, it would be possible to produce an IP ‘range’ report. This would indicate how many requests came from a particular IP range, and these ranges can usually be linked to certain geographical areas. 4. Jon also commented that the hourly request report would not be the most accurate. Because it may well show when all requests were made for GMT time, however it would not accurately show when people in Australia were viewing the website. All requests may appear at 2pm, but in reality the Australians would be viewing at 2am. 5. Project Requirements Review The second project requirement was ‘A tool that can analyse the SoC website usage using a small selection of existing techniques. E.g. page hits.’ I think that Logalyse meets this requirement. It not only analyses the SoC CLF files and produces reports, but it allows the user to supply particular IP addresses or directories. This functionality was not seen on any of the other tools. The evaluation went successfully and revealed plenty of positives and negatives of the tool. While there weren’t many problems as such, there was plenty of room for additional functionality. Quoting [6] ‘No matter what functionality and reports you do, you can never please everyone.’ The author believes it is a positive that so many improvements were suggested because, even though they are currently missing, it would be simple to add them, and once added the tool would be on par with the other tools available. 4.7.3 Future Improvements Full Range of Reports – Those reports such as the file size report deemed useless in the requirements should be added for completeness. This also includes the reports that would come with multi format handling mentioned in the parser improvements (section 3.5.3). HTML interface – Many suggestions made came back to this one point. Having a single HTML output report would mean you can view both the textual statistics and images created in one place. This scs2htd 42 would be a very simple extension. Some HTML with the text output and images created could be created and then saved to file. IP Ranges – Jonathan Ainsworth suggested this improvement. He thought it more useful to do such a report rather than resolving IP addresses. If a particular IP comes within a certain range, variables can be incremented and a list of those files requested also kept so that for instance, a world map could be produced on the HTML output. When someone hovers over an area of the map the different ranges and geographical areas could be highlighted and clicking on one could reveal the total usage coming from that particular area. The hourly request report could be remedied in this way and the true world times could be shown. Date Range Processed – A nice touch to the program would be to tell the user the period over which the log file covers. E.g. This log file covers 22nd Sept 2006 to 27th Sept 2006. This could be obtained by storing the date/time information from very first and very last line of the log. Spider and Robot List – The program currently identifies very unique IP address that visits the site as one individual human visitor. In reality not every IP address is a human viewing the site but could be a spider or robot sent out on the web to collect information such as Google’s spider [44]. To make the figures more accurate about human visitors a list of known robots and spiders can be obtained from the internet. Using such a list if a request is made by someone from this list then do not count it as a human visit. Dual Log Processing / Historical context – The user testing revealed a desire for some functionality that could analyse two logs. This is so that comparisons could be made. For example the current log file and the previous weeks could be analysed together and the reports could show the usage side by side for easy comparison. This or some way of saving the previous usage reports could be done. With a HTML report the user could manually save each report as a dated file and compare them by opening them separately, but some sort of automatic comparison could possibly be done. For instance the current usage could be displayed and if for example the number of requests had gone up since the last processed log, an upwards arrow could indicate this. Improved Bad Line Reporting – Currently the program only reports on how many bad lines were detected and did not match the CLF file regular expression. The functionality to view all the bad lines may be useful. If the program detects a bad line it could store this information so that the user can see the bad lines. scs2htd 43 5 New Techniques Phase 5.1 Chosen Techniques Due to time restrictions the very simplest techniques were chosen. Must Have 1. The system shall display the most common paths taken through the website. Should Have 1. The system shall display the most common paths taken through the website in graphical form. Could Have 1. The system shall display the most common paths taken through the website in two dimensional graphical form overlaid onto the website structure. Want to have but not this time around: 1. The system shall display the most common paths taken through the website in three dimensional graphical form overlaid onto the website structure. 5.2 Requirements Analysis 5.2.1 Data Gathering, Target Users and Possible Solutions To define the requirements for the new tool extensive reading was performed in the shape of the software survey in section 2.6.1. There is no existing system in place so no other data gathering can be done and the requirements must be produced based on other software examples. The target users are the same as those outlined for the Existing tool in section 4.2.2. The usage data is still from the SoC log files; however the new techniques surveyed must be attempted. Due to time restrictions the author will aim to produce software which shows the usage of paths taken through the SoC website only rather than try to put this usage in context by visualising it with the SoC website structure. 5.2.2 Functional Requirements Must Have 1. The system shall operate through the command line interface. 2. The system shall generate and output text reports to the command line. 3. The system shall use one aspect of the new techniques. 4. The system shall operate through a menu via the command line. Should Have 1. The system shall use the full range of new techniques possible. scs2htd 44 Could Have 1. The system shall operate through a Graphical User interface. 5.2.3 Non Functional Requirements The system has the same non functional requirements as those outlined in section 4.2.4. See Appendix Q - New Tool Requirements Specification for the full requirements document. 5.3 System Design 5.3.1 Conceptual Design The conceptual design of this tool is similar to that in section 3.2.1. However this tool will not need any graphical output so you can imagine the data flow diagram for this tool looking similar to Figure 3.1, but without the graphical output data flows. The log file will be parsed using the same parser module as before, and the output will be text via the command line, however the processing will be very different. The main concern with this tool is finding the common paths taken by users through the website. A path is defined as the list of consecutive files requested by a single visitor to the site in one session or visit to the site. This ‘session’ paradigm is used because visitors usually view the website not in one large visit but often in smaller occasional visits with different goals. So a visitor may view three different pages within 20 minutes and then not view the website again for another 30 minutes. When they return they may view ten pages. So this would give us two paths through the website, produced by the same visitor. The visitor had one session lasting 20 minutes, and then left for 30 minutes so their previous session ‘expired’ meaning when they returned we assume they have a different goal so a new session is started. The previous tool gave information such as the most frequently viewed web page. However it does not reveal the different paths people took to get to that particular page and this tool seeks to highlight the common paths taken by all people through the website. Processing Once the log line is parsed as before, to satisfy requirements 5.0 and 5.3 some lengthy processing must be performed. Firstly we must identify and store all the different paths taken using the session paradigm, and then compare them to find the most common paths. Using an array of hashes as the data structure this should be possible. [@session1, @session2…….] @session1 = {‘IP’ => 12.13.14.15 ‘PATH’ => file string ‘TIME’ => 12345} scs2htd 45 The top level array stores all the different sessions identified. Multiple array elements can belong to the same visitor. Each array element contains three hashes keyed on strings of IP, PATH and TIME. The associated values are the actual IP address, a string which stores the files visited in the session and the time in seconds since epoch of the last file access. The first log line must always be entered into the session array first otherwise it will be empty. For every other line, checks must be performed to see if three conditions are met. Firstly the current line already has an ‘active’ session so the file must be added to this session. Secondly the current line already has a session, but the difference between the current time minus the last time recorded for that session is greater than an arbitrary ‘expired time’ so a new session must be created. Thirdly the current IP is not found in the array anywhere so create a new session. This should ensure all sessions and paths have been stored successfully and we have a number of paths ready to be compared to see if they are equivalent. Each path must be accessed in turn and then compared to every other path present in the array. If the paths are string equivalent by using ‘eq’ then they must be paths the same length and the same files visited. For example: Foo/lecturer1 Æ Foo/lecturer1/bar Foo/lecturer1 Æ Foo/lecturer1/bar These are identical paths, both two files long and both visiting the same resources. Foo/lecturer1 Æ Foo/lecturer1/bar Foo/lecturer2 Æ images/lecturer2 These paths both visit two resources each, however the strings do not match and so are not identical paths. When a match is found the path itself should be stored by entering it into a hash. This hash will store all the paths identified as ‘matched’. Every time that path appears again the hash value can be incremented. This will mean we can identify the most frequently taken paths through the web site. Output The output of this tool is the same text output as described for the existing tool in section 4.3.1. Requirements 5.1, 5.2 and 5.4 will be satisfied. Requirement 6.0 is satisfied because the same parser module is being utilised. 5.3.2 Physical Design For design sketches of the new tool see Appendix R – New Tool Physical Design. The design has not changed since the existing tool in section 4.3.2 only the summary report will not be output and the reports will obviously be different. Requirement 6.1 and 6.2 will be satisfied. scs2htd 46 5.4 System Implementation 5.4.1 Problems Encountered The design for requirement 5.0 stated an array of hashes should be used to store the paths. This was implemented and worked to some extent. However when determining to add new sessions or not, it became obvious that using an array of hashes was not the correct solution to the problem. To access an element of the session array meant using a loop. So for example, on the first pass of the loop, there was an IP address with a session already present in the array, and the conditionals noticed that the current log line has the same IP address and the session has expired, so a new session is added to the array, which is correct. However the loop gets to the last element of the array that was just added within the same loop iteration, and it doesn’t distinguish this as the element just added, so it counts it as a session which hasn’t expired for that IP address and adds the current file to the path resulting in a path consisting of the current file twice. Additional to this problem, if the next log line has the same IP address, the comparisons produce yet another new session because the fact that a current session for this IP is at the end of the array is not known, so the loop produces far too many sessions. It was obvious the three conditions for adding a new session were correct; however the data structure used was not adequate. A new approach was taken which was adapted from [38]. This uses multiple hashes to keep track of sessions. It overcomes the problems met previously with looping through all sessions because we have data structures keyed on IP addresses and session numbers so finding a particular active session for an IP address is easy. The data structure now looks like the following: % session_num = {‘12.13.14.15’ => 1} % path = {‘1’ => file string} % last_seconds = {‘1’ => 12345} These three hashes are sufficient to store a path for each session. The three conditions for producing a new session or appending to the active session are still the same. Firstly if the current line’s IP is present in the session_number hash then a session must exist already for this IP. A check is then made to see if the current number of seconds since epoch minus the number of seconds since epoch of the last file access for this file in the last_seconds hash, is greater than the session expire time. If so then this means we need to add a new session and therefore the data structure would look like this: % session_num = {‘12.13.14.15’ => 2} % path = {‘1’ => file string, ‘2’ => file string} % last_seconds = {‘1’ => 12345, ‘2’ => 3456} scs2htd 47 Notice the session_num hash stores the ‘current’ session for the visitor IP and that previous paths are not lost and present in the path hash. If the session has not expired, then the current file is simply appended onto the end of the existing path by using: $path{$session_num} .= " ---> $file "; Including the arrow seen above was for output purposes only so when printing the path it as easier to see each file. If there is no IP address present in the session_num hash that matches the current line’s IP then no sessions exist at all for that IP and a new session must be added in the same way as before. Functions called new_visit and append_visit were produced to deal with this. This meant all paths were stored; however performing the comparison using this data structure only presented another problem. The path hash was keyed on session number and the associated values were paths, some unique some similar. To produce the hash keyed on each path so to store a count for that path as stated in the design troubled the author for a while. The solution was to ‘reverse’ the path hash. This had the effect of turning the values into keys and the keys into values, meaning the resulting reversed_path hash comprised of a number of unique paths. Next the program looped through the keys of the original path hash and performed a check to see if the value for each key was present in the reversed_path hash, if so then the path is added new hash called path_counter. This meant path_counter finally contained keys of paths and the associated values were a count of how many times each path occurred in the original path hash. 5.4.2 Actual Implementation Outputting the final results of the path_counter hash revealed that some further processing not designed for would have to be done. Paths output were showing the typical mistakes of users such as requesting bad URLs which obviously the web server could not find. Also paths to files other than web pages were being shown, and the author guessed that not all paths were being treated as equivalent paths. For example the dynamic School Information System (SIS) pages contained student’s unique identification numbers in the files stored in the log file. Because reversing the path hash gives a hash keyed on unique path strings, the same resource (a timetable for example) would be stored as two different keys because of the student id, which is not correct. Eliminating the first two problems discussed above was easy. Inside the loop for each log line but before any session processing is performed the following was placed. scs2htd 48 next if $status !~ /(200|304)/; next if $file =~ /\.(jpg|png|gif|css|ico|tif|bmp|doc|faq|jar|js|jso|pdf|log|pl|ppt|txt|xls|zip|xml|swf)/i; This simply ignored the log line if the status code wasn’t a successful one. Having the effect that all paths output would be those that users actually took through the website, and not including attempted paths, due to user’s inputting incorrect URLs. Also if the log line was not an actual web page simply ignore the line and go to the next one. To stop additional paths being created just because they contained unique student information, all pages that contained .cgi were ‘cleaned up’ so that the student specific information was deleted. Using the following regular expressions within a condition: if ($file =~ m/\.cgi/i) #Find those files that are CGI { $file =~ m/(.+\.cgi).*/i; #Ignore everything after .cgi so that paths are rightfully equivalent. Ignores unique students ids etc. $file = $1; } All the .cgi files are found, and then a second regular expression matches the important part of the web page URL we are interested in and replaces the file with this, effectively deleting the student information which follows the remembered back reference. 5.5 Testing 5.5.1 Defect Testing, Non Functional Testing Test Plan The area numbers continue from those in the Existing techniques testing phase in section 4.5. D.10 Accurate Technique (5.0 and 5.3) Testing for requirements 5.1, 5.2 and 5.4 will not be carried out because no new code has been written since the existing techniques which could mean the presence of new defects. Results Full results for the defect testing can be found in Appendix S – New Tool Functional Testing. 100% of the tests passed successfully. scs2htd 49 Testing for requirements 6.0, 6.1, 6.2 and 6.3 will not be carried out due to the same reasons outlined in section 5.5.1. 5.6 Maintenance 5.6.1 Future Maintenance F5 – The issue of equivalent paths was discussed in section 5.4.2. Testing revealed that not all cleaning and filtering of the files had been accounted for so there was a possibility of actual equivalent paths not being found. For example some student specific information was present in not just cgi files, but those such as: /sis/Xfaces/Sid/<studentid>.jpg This particular file would have been ignored because it is a picture but some more research into the possibility of files containing student specific information in them is needed. If they are found, similar cleaning needs to be performed as described in section 5.4.2. 5.7 Evaluation 5.7.1 Evaluation criteria 1. Requirements Review The requirements laid down at the beginning of the new techniques phase were the basic functions and services that the tool should now perform. If the tool does not now meet these requirements then the wrong tool has been built. 2. Testing Results. The requirements may have been met, the test results will help reveal this, but will also tell the author how effective those requirements are that have been implemented. 3. Tool Comparison. A good way to see if what has been built is good or not is to compare it to other tools around. In particular looking at those tools surveyed in the background section of this report in section 2.6.1. 4. Project Requirements Review The new tool was built to satisfy one of the three minimum requirements of this project. It will be also useful to look at the final tool and answer the question; does this software meet the minimum requirement? 5.7.2 Evaluation Results 1. Requirements Review See Appendix T for the console dumps, you can see it meets most of its requirements. Must Have 9 5.0 The system shall display the most common paths taken through the website. 9 5.1 The system shall operate through the command line interface 9 5.2 The system shall generate and output text reports to the command line. 9 5.3 The system shall use one aspect of the new techniques. scs2htd 50 9 5.4 The system shall operate through a menu via the command line. Should Have 8 5.5 The system shall display the most common paths taken through the website in graphical form. 8 5.6 The system shall use the full range of new techniques possible. Could Have 8 5.7 The system shall display the most common paths taken through the website in two dimensional graphical forms overlaid onto the website structure. 8 5.8 The system shall operate through a Graphical User interface. Non Functional Requirements 9 6.0 The system shall inform the user what the current operation is doing so the user does not loose interest and is not confused. 9 6.1 The system should be easy to navigate and allow the user to exit or go back at any point. 9 6.2 The system should give clear prompts when it is awaiting input. 8 6.3 The generation of the reports should take no longer than 10 minutes. The new tool met all of the must have requirements and outputs the common paths taken throughout the website. All but the last non functional requirements were met. It is no known what the performance of this tool is like on larger log file sizes, as no performance testing was possible due to time restrictions. 2. Testing Results. Defect testing went very well and no errors were found. The non functional testing was not performed because the code was basically the same as that for the existing tool, and it was observed from the defect testing no new problems with the non functional requirements were present. During defect testing the author noticed that the results output by the tool may not be 100% accurate. Although all testing passed, the author surmises that the cleaning of all student specific data from files may not have been fully accounted for and only further testing would reveal this. 3. Tool Comparison. The new tool lacks considerably when compared with the other tools surveyed. All of the other tools display their information via graphical visualisations, be it two dimensional or three dimensional. However the new tool does output the common paths taken through the website in textual form and so does provide similar usage information. Most display the paths taken overlaid on website structure and with the addition of some graphical output of website structure and graphical representations of the paths, the new tool could be comparable. scs2htd 51 4. Project Requirements Review The third minimum project requirement was to build ‘a tool that can analyze the SoC website using one new technique e.g. trails’. The new tool does meet the bare minimum here. It does not tell the user which web pages are most common or give server statistics like the exiting tool does, but it shows the common paths taken through the SoC website. Overall this tool meets the minimum requirements for both software and project, but it seriously lacks the graphical representations seen throughout the other new techniques. This tool has space for a lot more functionality and on its own without the visualisations, its usability is questionable. Further defect testing and some usability testing would be needed to refine the tool for future use. 5.7.3 Future Improvements User Supplied IP Address – Allowing the user to supply and IP address to restrict the processing as done on the exiting tool would mean that you can see paths taken by individual users. This may be of use for instance if you wish to see the paths taken by the most frequent visitor (obtained from the existing tool IP report). Link Existing tool and New Tool – The frequent pages report form the existing tool could be a restriction in the processing for the new tool. If processing was restricted to finding only those paths with the frequent pages in, then the user would be able to see how people are getting to those frequent pages in contrast to the web site’s paths overall. Graphical Reports – The obvious improvement on this tool would be to display the common paths in some graphical form, possibly in a similar manner to the Visitors software outlined in section 2.5.5. This could be further improved by visualising the structure of the website, and then overlaying the common paths on this structure by say highlighting all nodes and edges of the website in a different colour. scs2htd 52 References 1 Sommerville, Ian (2001), Software Engineering, Addison Wesley, 6th Edition. 2 Handley, Mark & Crowcroft, Jon (1995), The WWW - Beneath the Surf, UCL Press. 3 Log Files, URL: http://httpd.apache.org/docs/1.3/logs.html [14/11/05] 4 Coar, Ken & Bowen,Rich (2003), Apache Cookbook, O’Reilly. 5 Logging Control in W3C httpd, URL: http://www.w3.org/Daemon/User/Config/Logging.html#common-logfile-format [05/12/05] 6 Ainsworth, Jonathan (2005), Information Systems Support Officer, School of Computing, University of Leeds. 7 Large, Shirley & Arnold, Kate (2004), Evaluating how users interact with the NHS Direct Online, URL: http://www.csc.liv.ac.uk/~floriana/UM05-eHealth/Large.pdf [30/04/06] 8 Choo, Chun Wei, Detlor, Brian & Turnbull, Don (2000), Web Work – Information Seeking and Knowledge Work on the World Wide Web, Kluwer Academic Publishers. 9 Spence, Robert (2001), Information Visualization, Addison-Wesley. 10 Haigh, Susan & Megarity, Janette (1998), Measuring Web Site Usage: Log File Analysis, URL: http://www.collectionscanada.ca/9/1/p1-256-e.html [28/01/06] 11 Linder, Doug (1994), Interpreting WWW statistics, URL: http://www.ario.ch/etc/webstats.html [28/01/06] 12 LiveStats Technology, URL: http://www.deepmetrix.com/livestats/net/our_technology/index.aspx [30/04/06] 13 Ohlson, Kathleen & Radding, Alan (2005), Web Analytics, URL: http://www.adtmag.com/article.asp?page=1&id=10995 [28/01/06] scs2htd 53 14 Swartz, Andrew (2005), Andrew’s Usability in the Real World: Who are our Users?, URL: http://www.usabilitynews.com/news/article2807.asp [28/01/06] 15 Web Analytics, URL: http://en.wikipedia.org/wiki/Web_analytics [08/12/05] 16 Analog homepage, URL: http://analog.teleglobe.net/ [08/12/05] 17 WebStats homepage, URL: http://www.columbia.edu/httpd/webstats/ [08/12/05] 18 AW Stats homepage, URL: http://awstats.sourceforge.net/ [08/12/05] 19 Webalizer homepage, URL: http://www.mrunix.net/webalizer/, [08/12/05] 20 Visitors homepage, URL: http://www.hping.org/visitors/ [08/12/05] 21 Internet Information Services, URL: http://www.microsoft.com/WindowsServer2003/iis/default.mspx [08/12/05] 22 Deep Log Analyser homepage, URL: http://www.deep-software.com/default.asp [08/12/05] 23 Web Trends homepage, URL: http://www.webtrends.com/ [08/12/05] 24 Web Analytical Tools Comparison Table, URL: http://download.101com.com/pub/adtmag/Files/SpecialReport.pdf [28/01/06] 25 HBX Analytics homepage, URL: http://www.websidestory.com/ [20/04/06] 26 Youssefi, Amir H, Duke, David, Zaki, Mohammed J & Glinert, Ephraim (2003), Visual Web Mining, Technical Report 03-16 Department of Computer Science, Rensselaer Polytechnic Institute. 27 Sobol, Stephen & Stones, Catherine (2002), DMASC A Tool for visualizing user paths through a web site, Proceedings of the DEXA2002 Workshops, IEEE Computer Society Press. 28 Visitor Ville homepage, URL: http://www.visitorville.com/ [22/04/2006] scs2htd 54 29 Cugini, J & Scholtz, J (1999), VISVIP: 3D Visualisation of Paths through Web Sites, Proceedings of the International Workshop on Web Based Information Visualisation. 30 Bourquin, Yvan (2003), Web Navigation Path Visualisation, Eduwiss Diploma Work. 31 Spahr, James (2003), Web Site Traffic Map, 2003 Information Architecture Summit. 32 Fry, Ben (2000), Organic Information Design, MIT Media Lab, Aesthetics and Computation Group. 33 Bennett, Simon, McRobb, Steve & Farmer, Ray (2001), Object-Oriented Systems Analysis and Design, Chapter 6, McGraw-Hill. 34 Stapleton, Jennifer (1997), Dynamic Systems Development Method, Addison Wesley. 35 Bennett, Simon, McRobb, Steve & Farmer, Ray (2001), Object-Oriented Systems Analysis and Design, McGraw-Hill. 36 Jesty, Peter (2004), Software Project Management, SE22 Lecture Slides, School of Computing, University of Leeds. 37 Preece, Jennifer, Rogers, Yvonne & Sharp, Helen (2002), Interaction design: beyond human computer interaction, John Wiley and Sons. 38 Callender, John (2001), Perl for Web Site Management, O’Reilly. 39 Bennett, Simon, Skelton, John & Lunn, Ken (2001), Schaum’s Outlines of UML, McGraw-Hill. 40 Faulkner, Christine (1998), The Essence of Human-Computer Interaction, Prentice Hall. 41 Jarkko Hietaniemi (2001), Comprehensive Perl Archive Network home page, URL: http://www.cpan.org/, [10/04/06] 42 Mayhew, Deborah (1999), The usability engineering lifecycle : a practioner's handbook for user interface design, Morgan Kaufmann. scs2htd 55 43 Wall, Larry, Christiansen, Tom & Orwant Jon (2000), Programming Perl, 3rd Edition, O’Reilly. 44 GoogleBot homepage, URL: http://www.google.com/webmasters/bot.html [25/04/05] scs2htd 56 Appendix A: Personal Reflection The project met its minimum requirements, and the parser phase of the project was a good introduction to the programming language chosen. Once I started using Perl, it was easier than first expected, and I now like the language. The subject area interests me greatly and this helped my motivation throughout the project. Overall I am proud of the solution produced and the report. The project plan was delayed more than once throughout the project. The initial plan was very high level and consequently when it came to doing the work things were missed that should have been done first or in different orders. This meant I had a false sense of time and the plan was unrealistic, meaning it had to be revised a number of times. Much time was spent learning how to do things in Perl, and although the parser phase went quickly, the other phases suffered from implementation overrun. It would have been nice to do the same project again, but with my current experience in Perl. I felt there was a lack of books on the subject area. Those the author did find were not available via the university library or were missing. Choose your programming language carefully I didn’t have much experience in any languages other than Java and C++ learnt in the first and second years. If you are not a confident programmer like me, ensure you can learn the language quickly, because it can be surprising how different languages can be, and how much time you can spend flipping through language reference texts. Even if you don’t have experience in any of your choices, don’t wait to find out which is best, try building some simple programs. Heed this advice especially if you have been on a year in industry where you did not program for a year Produce a detailed plan as soon as possible I know it may not be easy to think of everything you need to do during your project, so allow some degree of flexibility for additions and changes. My advice would be to produce a table of contents for your report in the very beginning. Insert all the headings you can think of, relating to background research and ones specific to your software development methodology if you’re producing some software. This will really show the magnitude of all the work you have to do and write up. Then translate these headings into tasks on a Gantt chart because this is a great visual aid. 57 27/03/2006 03/04/2006 D E F 2 2 2 2 01/05/2006 2 24/04/2006 2 17/04/2006 2 10/04/2006 2 20/03/2006 2 13/03/2006 2 06/03/2006 2 27/02/2006 2 20/02/2006 30/01/2006 2 13/02/2006 2 06/02/2006 2 23/01/2006 16/01/2006 09/01/2006 02/01/2006 B 26/12/2005 A Xmas/ Revision Break 19/12/2005 1 12/12/2005 1 05/12/2005 1 28/11/2005 1 21/11/2005 Wk Beginning 1 14/11/2005 Semester 07/11/2005 Appendix B: Schedule Research/Background Reading Previous FYP's into area Website Usage Data WWW / Internet and Websites Techniques for Analysis Parser Design, Build Test Existing Techniques Choice of Established Techniques Implementation Evaluation / Conclusion New Techniques Choice of New techniques Implementation Evaluation / Conclusion Final Eval / Conclusion Write up /Proof Read Reflection Milestones A. All background reading B. Mid project Report C. Existing techniques used and evaluated D. Implementation of trails completed E. Draft Chapter and Table of Contents to be submitted F. Progress meeting / Implementation of own ideas completed C G. Final Evaluation of tool and Conclusion H. Submission of Report (hard/soft) 58 G H Original Plan carried out Original Plan not carried out Carried out, not planned Appendix C: Software Survey Comparison Table Analog HTML Reports? Yes Summary Reports ? Text Status Code Reports ? Tabulated Text / Graphs Full Colour File Extension Reports ? Tabulated Text / Graphs Full Colour File Size Report ? Tabulated Text / Graphs Full Colour Tabulated Text / Graphs Full Colour WebStats AWStats Webalizer Visitors IIS Yes Yes Yes Text Full Colour Text Full Colour Text Full Colour Tabulated Text / Full Colour Tabulated Text / Full Colour No Tabulated Text / Graphs Full Colour No No No Tabulated Text Full Colour No Tabulated Text / Graphs Full Colour Tabulated Text / Graphs Full Colour Tabulated Text/ Graphs, Full Colour Unknown Yes No Text Full Colour Text Black and White Tabulated Text / Black White / Full Color Graphs Tabulated Text / Black White / Full Color Graphs No Unknown Tabulated Text / Graphs Full Colour Unknown Unknown Tabulated Text / Graphs Full Colour Unknown Unknown Unknown Unknown Logalyse Unknown Unknown Daily/Hourly Report ? Deep Log Analyzer Unknown 59 Unknown Tabulated Text / Graphs Full Colour Tabulated Text / Graphs Full Colour Hourly Text Tabulised Reports only Live Stats.Net HBX Analytics Web Trends 7 Unknown Unknown Unknown Unknown Unknown Unknown Unknown Unknown Unknown Unknown Unknown Unknown Unknown Unknown Unknown Unknown Unknown Unknown Search Word Reports ? Browser Report ? OS Report ? Frequent Requests Report ? Tabulated Text / Graphs Full Colour Tabulated Text / Graphs Full Colour Tabulated Text / Graphs Full Colour Tabulated Text / Graphs Full Colour Tabulated Text Full Colour Tabulated Text Full Colour Tabulated Text, Full Colour Tabulated Text Full Colour Tabulated Text Full Colour Tabulated Text / Graphs Full Colour No No Tabulated Text Full Colour Tabulated Text/ Graphs, Full Colour Tabulated Text/ Graphs, Full Colour Tabulated Text Full Colour Tabulated Text / Graphs Full Colour Tabulated Text / Graphs Full Colour Tabulated Text Full Colour Unknown Unknown Unknown Unknown Unknown Geographical Request Report ? Host / IP Report ? Robots / Spiders Report ? Tabulated Text / Graphs Full Colour Tabulated Text / Graphs Full Colour No Unknown Unknown Unknown Tabulated Text Full Colour Unknown Tabulated Text Full Colour No No Unknown Tabulated Text / Graphs Full Colour Tabulated Text Full Colour Unknown scs2htd Unknown Tabulated Text / Graphs Full Colour Tabulated Text / Graphs Full Colour Tabulated Text / Graphs Full Colour Tabulated Text / Graphs Full Colour Unknown Unknown 60 Tabulated Text / Graphs Full Colour Tabulated Text / Graphs Full Colour Tabulated Text / Graphs Full Colour No No Unknown Tabulated Text / Graphs Full Colour Unknown Unknown Unknown Unknown Unknown Unknown Unknown Unknown Tabulated Text / Graphs Full Colour Unknown Tabulated Text / Graphs Full Colour Unknown No Tabulated Text, Black White / Full Color Graphs No Unknown Tabulated Text, Black and White Unknown Unknown Unknown Unknown Unknown Unknown No Visit Duration Report ? No Frequent Pages Report ? No Authenitcated Users Report ? Tabulated Text / Graphs Full Colour No Tabulated Text Full Colour No No Tabulated Text/Graphs Full Colour No No Tabulated Text Full Colour No No Tabulated Text / Graphs Full Colour Tabulated Text Full Colour No Tabulated Text Full Colour Tabulated Text Full Colour Tabulated Text Full Colour Unknown Unknown Unknown Entry /Exit pages Report Unknown Unknown Unknown Unknown Referers Report ? scs2htd Tabulated Text / Graphs Full Colour Unknown Unknown Unknown 61 Tabulated Text / Graphs Full Colour Tabulated Text / Graphs Full Colour Tabulated Text / Graphs Full Colour Tabulated Text / Graphs Full Colour Tabulated Text / Graphs Full Colour No Tabulated Text / Graphs Full Colour Unknown Unknown Tabulated Text, Black and White Unknown Unknown Unknown Unknown Unknown Unknown Unknown Unknown Unknown Unknown Unknown Unknown No No No Appendix D: Requirements Data Gathering This script details the informal semi structured interview with Dr Jonathan Ainsworth dated Tuesday 22nd November 2005. Q: 1. Can you confirm the SoC website resides on an Apache web server, running Version 2.0.54 (fedora)? A: Correct Q: 2. Was Apache chosen purely because of the cost (free!) or were there some other considerations? A: This was not the principle consideration. The major considerations included: (1) Security (c.f. e.g. Microsoft IIS, Apache is widely considered far more secure) (2) Availability of patches and new versions (3) Support of wide variety of web technologies (SSI, CGI, PhP). (4) Ease of configuration - for both system administrator and individual users. E.g. several web sites are hosted on the School web server and Apache provides straightforward means of configuring and controlling these. Individual users have some freedom to tailor the behavior of there own parts of the web site using .htaccess files, which are allowed to override *some* centrally set configuration details. (5) Its widespread use - so that users can gain some experience of using a very widely used system. Of course, 2,3,4,5 also apply to IIS, but (1) was considered to clearly favour Apache over IIS. There may be other alternatives to IIS, but none of them were considered to deliver on 2,3,4,5. Q: 3. Currently are the log files used in any way whatsoever by someone within the department? Are they used to help identify any possible hacks? A: There is no regular analysis as regards web usage statistics or similar data mining. The logs are used to diagnose hacking attempts but this tends to be after the event. Q: 4. The format of the log file I received was the common log file, was this just left as default? Why is the combined format not in use? A: It was just left as the default. The reason is that nobody has ever requested the extra referer and agent information in the combined format. 62 Q: 5. What is the rotation of each log file? Daily? A: The rotation is weekly. scs2htd 63 Appendix E: Parser Requirements Specification Here I have combined all the functional and MoSCoW requirements into one final requirements document. Please note the reference numbers follow on from the requirements specification document in Appendix H – Existing Tool Requirements Specification for uniqueness. Some of the non functional requirements Description STAKEHOLDERS Related groups of Stakeholder Needs Description of the Stakeholder Need N/A MUST The following topics describe all the 'must have' functional requirements of the parser Functional 3.9 The system shall work with CLF log files 4.0 The system shall ‘clean’ up each log file line, such as removing unwanted characters like white space and brackets. 4.1 The system shall parse each line of the file 4.2 The system shall find and extract the ‘bytes’ information 4.3 The system shall find and extract the ‘status’ information 4.4 The system shall find and extract the ‘file’ information 4.5 scs2htd The system shall find and extract the ‘date’ information 64 N/A No. N/A Allocation Reference Number of the existing tool filtered down to the parser, but will only be included on the one document for briefness. 4.6 The following topics describe all the 'should have' functional requirements of the parser Functional 4.7 The system shall detect ‘bad’ log file lines and report on them. 4.8 The system shall find and extract the ‘IP’ information. COULD The following topics describe all the 'could have' functional requirements of the parser. Functional 4.9 scs2htd The system shall store the information from the parsed log file either within the running program for advanced processing or output the parsed ‘clean’ data to another text file. SHOULD 1. The system shall handle all log file formats. 65 Appendix F: Parser Functional Testing Functional Area Area Description D.1 This functional area is the core opertaion of the parser. It should be able to take a log file, and for every log line identify the items of interest and clean them. It should then be able to print all lines out. Test Number 1 2 D.2 This functional area refers to the parser being able to detect a bad line, for example a totally blank line. 1 2 scs2htd Input Data / Description of Test Expected Outcome Actual Outcome Pass / Fail ? Correct input. Sample text log file supplied in CLF format with 31 lines. The parser should find 11 items of information and be able to print out each lines clean output. Output contains 31 lines of clean data. Pass Correct input. Full text log file supplied in CLF format with over 200,000 lines. The parser should find 11 items of information and be able to print out each lines clean output. Output contains over 200,000 lines of clean data. Pass Incorrect input. Sample text log file supplied in CLF format with 32 lines, one of which is a totally blank line. The parser runs as normal, however the detection of the bad blank line is reported by showing the total number of bad lines. As expected. The bad lines value is one. Pass Correct input. Sample test log file supplied in CLF format with 31 lines. No lines are blank The parser runs as normal, no bad lines are detected and the bad lines value is zero As expected. The bad lines value is zero. Pass 66 D.3 scs2htd This functional area refers to the parser working with Common Log Files only. 1 Incorrect input. Supplied text log file is not CLF format and has an extra information. The parser runs as normal , however the extra information means data are stored in incorrect variables, meaning the cleaning and filtering performed cleans out potentially wanted data. Parser runs as normal. The extra information is not assigned to variables and is simply ignored. The parser runs as if it were given a CLF file. Pass 2 Correct input. Supplied text log file is in CLF formar. Parser runs normally and executions continues as normal As expected. Pass 67 Appendix G: Parser Non-Functional Testing Non Functional Area Area Description U.1 This non functional area should always inform the user via the command line that an argument they have supplied is incorrect. The correct usage should be shown. U.2 This non functional area should always inform the user if the input log file does not exist or cannot be opened. Test Number Input Data / Description of Test Expected Outcome Actual Outcome Pass / Fail ? 1 Incorrect input. No arguments are supplied when running the perl script. E.g cslin029% ./Parser.pl The program should inform the user of the correct usage and return to the command prompt Usage: Parser.pl <logfile> ' is shown on the command line and the command prompt is returned to. Pass 2 Incorrect input. More than one argument is supplied when running the perl script. E.g cslin029% ./Parser.pl foo bar The program should inform the user of the correct usage and return to the command prompt Usage: Parser.pl <logfile> ' is shown on the command line and the command prompt is returned to. Pass 3 Correct input. One argument is supplied when running the perl script. E.g cslin029% ./Parser.pl foo The program accepts the argument because there is only one. Program execution continues as normal. Pass 1 Incorrect input. One command line argument supplied but the file does not exist in the same directory as the perl script. The program should inform the user that the supplied file does not exist. Could not open file <logfile>, No such file or directory, script stopped at ./Parser.pl line <line no.> Pass Incorrect input. One command line argument supplied, file in same directory as perl script, but file is an image file. .gif The program opens the file, but no meaningful results are output because the supplied file was not a log file. Program opens file as expected and no meaningful results are output. Pass 2 scs2htd 68 3 U.3 scs2htd This non functional area refers to keeping the user informed about the programs current operation. 1 Correct input. One command line argument supplied, file in same directory as the perl script. File is a standard CLF text log file. The program runs as normal and execution continues because there were no problems opening the file. As expected Pass Test must be carried out on correct input for full test of this area. Log file in CLF format supplied. Program should inform user of its current operation as it goes. Program informs user via command line information. 'Opening Log File.' 'Log File Opened Successfully.' 'Parsing Log File.' 'Log File parsed Successfully.' As expected. Pass 69 Appendix H: Existing Tool Requirements Specification Related groups of Stakeholder Needs Description of the Stakeholder Need STAKEHOLDERS Staff (Webmaster) Description Staff (Server Admin) No. Staff Allocation Reference Number This appendix contains the final requirements document for the existing techniques phase 1.0 The system shall display the total number of requests (hits) Y Y Y 1.1 The system shall display the total number of bytes sent. Y Y 1.2 The system shall display the total number of successful requests (status code 200) Y Y 1.3 The system shall display the total number of failed requests (e.g. code 400 and 404) Y Y 1.4 The system shall display the total number of redirected requests (code 3xx) Y Y 1.5 The system shall display total number of requests per file. Y Y 1.6 The system shall display the total number of requests for pages. Y Y 1.7 The system shall display the total number of requests per page. Y Y 1.8 The system shall display the total number of requests per day (E.g. Monday – 12, Tues etc). Y 1.9 The system shall display the total number of requests for pages per day. Y MUST The following topics describe all the requirments for the 'must have' techniques. Techniques scs2htd 70 Y Y Y The following topics describe all the functional 'must have' requirments. Functional 2.0 The system shall operate through the command line interface. Y Y Y 2.1 The system shall generate and output text reports to the command line. Y Y Y 2.2 The system shall use a small selection of existing techniques. Y Y Y 2.3 The system shall operate through a menu via the command line. Y Y Y 2.4 The system shall generate and output graphical reports. SHOULD Y Y Y Y Y The following topics describe all the requirments for the 'should have' techniques. Techniques 2.5 The system shall display a file type report. (E.g. 10% .gifs, 56% .pdf etc) Y 2.6 The system shall display the total number of unique users (unique IP addresses). Y 2.7 The system shall display a status code report (E.g. 10 % 200, 70% 400 etc) Y Y 2.8 The system shall display a summary of total requests per hour. The following topics describe all the fucntional 'should have' requirments. Y Y Y 2.9 1. The system shall use the full range of existing techniques possible. COULD Y Y Y Functional Y The following topics describe all the requirments for the 'could have' techniques. Techniques 3.0 Y Y 3.1 The system shall display a report regarding file sizes served. (E.g. 10 % 1kb, 50% 10Tb etc). The following topics describe all the functional 'could have' requirments. Y Y 3.2 The system shall have a graphical user interface. WANT TO HAVE BUT NOT THIS TIME Y Y Functional scs2htd The system shall resolve all IP addresses so that their domain names become available. 71 Y The following topics describe all the requirments for the 'want to have but not this time aorund' techniques. Techniques 3.3 Functional The system shall ‘know’ which IP addresses represent those visitors which are not human i.e. they are web spiders and robots. Y Y The following topics describe all the functional 'not this time' requirments. 3.4 The system shall use log files in different formats that provide more information for analyzing such as user OS. GENERAL Y Y Y Y Y Y Y Y Y The following topics describe the general requirments of the software, including the non functional requirments. Non-Functional 3.5 The system shall inform the user what the current operation is doing so the user does not loose interest and is not confused. 3.6 The system should be easy to navigate and allow the user to exit or go back at any point. 3.7 The system should give clear prompts when it is awaiting input. Y Y Y 3.8 The generation of the reports should be as quick as possible. ADDITIONAL REQUIREMENTS Y Y Y The following topics describe the functional requirements added to the tool during implementation. Functional scs2htd 3.9 The system shall allow the user to supply a directory as an optional argument, and display usage only for that content. Y Y Y 4.0 The system shall allow the user to supply an IP address as an optional argument, and display usage only for that address. Y Y Y 72 Appendix I: Programming Language Choice This appendix documents the justification for the programming language used to produce the solution. Three different languages suitable for the task of text processing will be compared, namely Perl, C and Python. Purpose built for Text Processing? Author has recent previous experience? Author has possession of source code of other solutions? Perl Y Y C N N Python N Y Y Y N Although Perl is derived from C, it was overly obvious when reading through the literature on each that Perl was purpose built for text processing and manipulation, hence its name ‘Practical Extraction and Report Language’. The author has little experience in all languages, but most recently in his second year of study Perl was used for processing image files. The other existing techniques surveyed in the background were written in either C or Perl. The author made the decision largely based his most recent experience, and the fact the literature explicitly stated the language was ideal for text processing and manipulation. Perl was chosen. scs2htd 73 Appendix J: Existing Tool Physical Design This appendix details the design sketches that were originally hand drafted and then moved to these computer images. Initial Information cslin034% ./Logalyse <logfile> Please Wait Opening File… File Opened Please Wait Parsing File… File Parsed Summary Report ============== Summary Report ============== Total number of requests = <value> Total number of successful requests = <value> Total number of failed requests = <value> Total number of redirected requests = <value> Total number of bytes sent = <value> Total number of requests for pages = <value> Total number of requests for pages per day = <value> Total number of visitors detected = <value> scs2htd 74 Main Menu ============================================ = Main Menu = = = = 1. Status Code Report 2. File Extension Report = = 3. Files Report 4. Pages Report = = 5. IP Report 6. Hourly Request Report = = 7. Weekly Request Report 8. Summary Report = 9. Exit = = ============================================ Please select an option… Status Code Report =============== Status Code Report ============== Status Code Requests Percentage OK – 200 <value> <value> Created – 201 <value> <value> Accepted – 202 <value> <value> Not Modified – 304 <value> <value> Moved Perm – 301 <value> <value> Found – 302 <value> <value> See Other – 303 <value> <value> Bad Request – 400 <value> <value> Not Authorised – 401 <value> <value> Forbidden – 403 <value> <value> Successful Redirected Failed scs2htd 75 Not Found – 404 <value> <value> Internal Error – 500 <value> <value> HTTP Version Not <value> <value> <value> <value> Supported Other Other – xxx File Extension Report =============== File Extension Report ============== Extension Requests Percentage % .html <value> <value> .shtml <value> <value> .htm <value> <value> .jpg <value> <value> .png <value> <value> .cgi <value> <value> .gif <value> <value> .css <value> <value> .php <value> <value> .asp <value> <value> .ico <value> <value> .tif <value> <value> .bmp <value> <value> .doc <value> <value> .faq <value> <value> .jar <value> <value> .js <value> <value> .jso <value> <value> .log <value> <value> .pdf <value> <value> .pl <value> <value> .ppt <value> <value> .txt <value> <value> scs2htd 76 .xls <value> <value> .xml <value> <value> .zip <value> <value> .jsp <value> <value> Files Report =============== File Report ================= File Requests <file> <value> . . . . . . Page Report =============== Page Report ================= Page Requests <page> <value> . . . . . . IP Report (design change) ================= IP Report ================= IP Address Requests <IP> <value> . . . . scs2htd 77 Hourly Request Report ============ Hourly Request Report ============= Hour Requests 00:00:00 Æ 01:00:00 <value> 01:00:00 Æ 02:00:00 <value> 02:00:00 Æ 03:00:00 <value> . . . . . . Daily Request Report =========== Daily Request Report ========== Day Requests Monday <value> Tuesday <value> . . . . . . After each report is output Do you wish to exit now (press e) or return to the main menu (press m)? scs2htd 78 Graphics Status Code Report 200 300 404 401 File Extension Report .jpg .html .php .txt scs2htd 79 Hourly Request Report 00:00:00 --> 01:00:00 01:00:00 --> 02:00:00 02:00:00 --> 03:00:00 03:00:00 --> 04:00:00 0 5 10 15 20 25 0 5 10 15 20 25 Daily Request Report Monday Tuesday Wednesday Thursday scs2htd 80 Appendix K: Existing Tool Functional Testing Functional Area D.4 Area Description Test Input Data / Description of Number Test Pass / Expected Outcome Actual Outcome This functional area of the tool should Correct Input. File is a very provide the user with a set of accurate small CLF log file, 5 lines long. Totals and reports should processed information from the log Test ensures all functions are match the actual log file All totals and reports file. There are are number of different calculating and processing the accurately. See testing log match values in test data correctly 1 Appendix ? log 1 values which must be tested. 1 Fail ? Pass Correct Input. File is a very 2 small CLF log file, 31 lines Totals and reports should long. Test ensures all functions match the actual log file All tools and reports are calculating and processing accurately. See testing log match values in test the data correctly 2 Appendix ? log 2 Pass As expected Pass As expected Pass This area was previously tested during the D.5 parser phase. the Incorrect input. Sample text log however the detection of implementation was changed during file supplied in CLF format with the bad blank line is this phase, so the function is being 32 lines. One of which is a reported by showing the totally blank line. total number of bad lines. checked again. However The parser runs as normal, 1 The parser runs as normal, 2 scs2htd Correct input. Sample test log no bad lines are detected file supplied in CLF format with and the bad lines value is 31 lines. No lines are blank zero 81 Correct Input. File is a very small CLF log file, 5 lines long (test log 1). Test ensures all D.6 This area tests the additional function functions are calculating and The output is restricted to As expected, all of providing an IP address to the processing the data correctly. only those lines which have output(including the program. be Supplied IP address should be an IP address that match summary report) is accurate and only be related to the one of those present in the log the second argument only those lines with file supplied supplied IP address The output should supplied IP address. 1 Pass All reports except the File type and Status code report are blank. The exceptions yield 2 Incorrect Input. File is very an error 'Illegal small CLF log file, 5 lines long division by zero at (test log 1). Test ensures all The output is meanginless ./Logalyse.pl line functions are calculating and because the specified IP xxx, <STDIN> line processing the data correctly. address was not present in 6'. Graphics for all Supplied IP address is not one the file, all totals are zero reports are also of those present in the log file and reports are blank. blank. Failed As expected Pass Correct Input. File is a very small CLF log file, 5 lines long This area tests the additional function (test log 1). Test ensures all of providing a directory to the functions are calculating and The output is restricted to program. processing the data correctly. only those lines which have Supplied directory should match a directory that matches the one of those present in the log second argument supplied The output should be accurate and only be related to the D.7 scs2htd supplied directory. 1 82 file. All reports except the File type and Status code report are blank. The exceptions yield Incorrect Input. File is very an error 'Illegal small CLF log file, 5 lines long division by zero at (test log 1). Test ensures all The output is meanginless ./Logalyse.pl line functions are calculating and because the specified xxx, <STDIN> line processing the data correctly. directory was not present in 6'. Graphics for all Supplied directory is not one of the file, all totals are zero reports are also those present in the log file and reports are blank. blank. possible parts of the menu Program runs with no As expected, This area tests that the system is system and ensure all routes are errors, menu system is command line command line menu based and all retraceable and that the user can working and all reports are system works via exit. output as text menu and text reports 2 Failed Run the program on correct input. Navigate through all D.8 scs2htd reports are text output. 1 83 Pass The program runs on correct input and produces some image files in a new D.9 This area ensures that the appropriate directory under the same graphics are produced after exiting the directory as where the command line system. 1 Program is run on correct input. script is located As expected Pass As expected Pass The program runs on correct input and the images produced accurately reflect the log file, all bars and pie segments are the 2 scs2htd Program is run on correct input. 84 correct values. Appendix L: Existing Tool Non-Functional Testing Non Functional Area Test Area Description Number Input Data / Description of Test Expected Outcome This non functional area should The program should <logfile> [ip address] command line that an argument Incorrect input. No arguments are inform the user of [directory] ' is shown they have supplied is incorrect. supplied when running the perl the correct usage and on the command line The correct usage should be script. E.g cslin029% return to the and the command ./Logalyse.pl command prompt prompt is returned to. shown. Pass / Fail ? Usage: Logalyse always inform the user via the U.1 Actual Outcome 1 Pass Usage: Logalyse.pl 2 3 4 scs2htd Incorrect input. More than two The program should <logfile> [ipaddress] arguments are supplied when inform the user of [directory] ' is shown running the perl script. E.g the correct usage and on the command line cslin029% ./Parser.pl foo bar return to the and the command sheep command prompt prompt is returned to. Correct input. One argument is The program accepts supplied when running the perl the argument script. E.g cslin029% because there is only Program execution ./Logalyse.pl foo one. continues as normal. Correct input. Two arguments are The prgram accepts supplied when running the perl the input because a script. E.g cslin029% second argument is Program execution ./Logalyse.pl foo bar optionally allowed continues as normal. 85 Pass Pass Pass The program detects that the user is trying U.4 to supply an IP The program address but it is in execution continues This non-functional area should Incorrect input. Program run on the incorrect format. and all reports are always inform the user if they log file and IP address supplied is An alert is displayed blank. The invalid IP supply an IP address which is not as follows: cslin045% to the user informing address is NOT ./Logalyse.pl <log> a.b.c.d them of this. detected in the correct format 1 Failed The program detects that the user is trying to supply an IP The program address but it is in execution continues log file and IP address supplied is the incorrect format. and all reports are invalid because host IP cant be 0: An alert is displayed blank. The invalid IP cslin098% to the user informing address is NOT them of this. detected Failed As expected Pass Incorrect Input. Program run on 2 ./Logalyse.pl <log> 10.1.0.0 The program detects that the user is trying 3 scs2htd Correct Input. Program run to supply an IP on log file and IP address supplied address and the is valid: cslin86% ./Logalyse.pl address is valid so <log> <valid IP in file> 86 execution continues U.5 The program detects The following is that neither a displayed to the user This non-functional area should Incorrect Input. Program run on directory or an IP via the command line always inform the user if they log file and directory supplied is address has been 'The variable must supply a directory which is not not valid: cslin76% ./Logalyse.pl specified and the contain alphanumeric <log> #$%^ user is informed characters'. valid 1 Failed The program detects that the user 2 scs2htd Correct input. Program run on log supplied a directory file and directory supplied is valid: and not an IP cslin45% address and so ./Logalyse.pl <valid directory in log file> 87 <log> execution continues As expected Pass Appendix M: Existing Tool Testing Logs Testing Log 1 – 5 lines 129.11.147.71 - - [22/Sep/2005:14:09:40 +0100] "GET /sis/Xfaces/Sid/<studentid>.jpg HTTP/1.1" 200 3320 129.11.147.71 - - [22/Sep/2005:14:09:37 +0100] "GET /cgi-bin/sis/ts/student.cgi?student=surname HTTP/1.1" 200 7195 129.11.110.200 - - [22/Sep/2005:14:09:42 +0100] "GET /llau/badminton/ HTTP/1.1" 200 1339 129.11.110.200 - - [22/Sep/2005:14:09:42 +0100] "GET /llau/badminton/badminton.css HTTP/1.1" 200 922 129.11.110.200 - - [22/Sep/2005:14:09:42 +0100] "GET /favicon.ico HTTP/1.1" 200 3638 Total Requests = 5 Total bytes = 16414 Total successful requests = 5 Total failed requests = 0 Total redirected requests = 0 Total requests Per File – 1 for each of the files above all files distinct Total number of requests for pages = 2 Total number of requests per page – 1 for each of the 2 pages above, File type report – (1 .jpg, 1.cgi, 1 .css, 1 .ico 1 no extension so 1 .html ?? All 20 %) Total number of visitors = 2 Status Code Report – 5 200’s so 100 % code 200 Total requests per hour – report should read all in 14:00:00 period scs2htd 88 Total bad lines = 0 IP Report – 2 for IP 129.11.147.71, 3 for the other IP. Testing Log 2 – 31 lines 129.11.147.71 - - [22/Sep/2005:14:09:40 +0100] "GET /sis/Xfaces/Sid/<studentid>.jpg HTTP/1.1" 200 3320 129.11.147.71 - - [22/Sep/2005:14:09:37 +0100] "GET /cgi-bin/sis/ts/student.cgi?student=surname HTTP/1.1" 200 7195 129.11.110.200 - - [22/Sep/2005:14:09:42 +0100] "GET /llau/badminton/ HTTP/1.1" 200 1339 129.11.110.200 - - [22/Sep/2005:14:09:42 +0100] "GET /llau/badminton/badminton.css HTTP/1.1" 200 922 129.11.110.200 - - [22/Sep/2005:14:09:42 +0100] "GET /favicon.ico HTTP/1.1" 200 3638 129.11.146.199 - - [22/Sep/2005:14:09:44 +0100] "GET /gph/linux HTTP/1.1" 301 323 129.11.146.199 - - [22/Sep/2005:14:09:44 +0100] "GET /gph/linux/ HTTP/1.1" 200 1009 129.11.146.199 - - [22/Sep/2005:14:09:44 +0100] "GET /gph/style/yfos.css HTTP/1.1" 200 1217 86.130.71.220 - - [22/Sep/2005:14:09:35 +0100] "GET /internal/undergrad/ HTTP/1.1" 200 19026 129.11.146.199 - - [22/Sep/2005:14:09:44 +0100] "GET /gph/images/linuxbanner.jpg HTTP/1.1" 404 5648 129.11.146.199 - - [22/Sep/2005:14:09:44 +0100] "GET /gph/images/nav_header.png HTTP/1.1" 404 5647 86.130.71.220 - - [22/Sep/2005:14:09:44 +0100] "GET /internal/undergrad/ HTTP/1.1" 200 19026 129.11.146.28 - - [22/Sep/2005:14:09:45 +0100] "GET /cgi-bin/sis/ts/index.cgi HTTP/1.1" 401 478 129.11.146.28 - - [22/Sep/2005:14:09:45 +0100] "GET /cgi-bin/sis/ts/index.cgi HTTP/1.1" 200 3699 86.130.71.220 - - [22/Sep/2005:14:09:48 +0100] "GET /cgi-bin/sis/ts/index.cgi HTTP/1.1" 401 478 153.96.175.247 - - [22/Sep/2005:14:09:49 +0100] "GET /Perl/Images/icon_perl_left.gif HTTP/1.1" 200 179 129.11.110.200 - - [22/Sep/2005:14:09:49 +0100] "GET /llau/badminton/fees.html HTTP/1.1" 200 1769 129.11.146.199 - - [22/Sep/2005:14:09:50 +0100] "GET /gph/hello.php HTTP/1.1" 200 94 129.11.110.200 - - [22/Sep/2005:14:09:53 +0100] "GET /llau/badminton/bookings.html HTTP/1.1" 200 3149 scs2htd 89 203.199.231.42 - - [22/Sep/2005:00:09:56 +0100] "GET /Perl/associative.html HTTP/1.1" 200 4292 129.11.147.71 - - [22/Sep/2005:14:10:00 +0100] "GET /styles/sis.css HTTP/1.1" 304 129.11.146.12 - - [22/Sep/2005:14:10:07 +0100] "GET /induct/index.shtml HTTP/1.1" 200 643 129.11.146.12 - - [22/Sep/2005:14:10:07 +0100] "GET /induct/2005/index.shtml HTTP/1.1" 200 8853 194.201.98.198 - - [22/Sep/2005:14:10:08 +0100] "GET /Perl/running.html HTTP/1.1" 200 2113 86.130.71.220 - - [22/Sep/2005:14:10:06 +0100] "GET /cgi-bin/sis/ts/index.cgi HTTP/1.1" 200 3699 129.11.146.12 - - [22/Sep/2005:14:10:12 +0100] "GET /induct/2005/labsessions.shtml HTTP/1.1" 200 7602 81.109.164.2 - - [22/Sep/2005:14:10:14 +0100] "GET /summer/summer2004/task/designExamples/conjoined/ HTTP/1.1" 200 10218 81.109.164.2 - - [22/Sep/2005:14:10:14 +0100] "GET /summer/summer2004/task/designExamples/conjoined/imageBNC.JPG HTTP/1.1" 200 13178 81.109.164.2 - - [22/Sep/2005:14:10:14 +0100] "GET /summer/summer2004/task/designExamples/conjoined/image3UR.JPG HTTP/1.1" 200 9024 81.109.164.2 - - [22/Sep/2005:14:10:14 +0100] "GET /summer/summer2004/task/designExamples/conjoined/imageO05.JPG HTTP/1.1" 200 26958 86.130.71.220 - - [22/Sep/2005:14:10:13 +0100] "GET /cgi-bin/sis/ts/timetable.cgi?cmd=showtimetable&student=<studentid>&semester=1&year=2005 HTTP/1.1" 200 6383 Total Requests = 31 Total bytes = 171119 Total successful requests = 26 (25 200’s, 1 304) Total failed requests = 4 Total redirected requests = 1 Total requests Per File – find in test log 2 Total number of requests for pages = 20 Total number of requests per page – find in test log 2 File type report – (.html 12.9%, .shtml 9.67%, .jpg 16.1%, .png 3.22%, .cgi 19.3%, .gif 3.22%, .css 9.67%, .php 3.22%, .ico 3.22%, No extension 19.3) scs2htd 90 Total number of visitors = 10 Status Code Report – (200 80.6%, 304 3.22%, 301 3.22%, 401 6.45%, 404 6.45%) Total requests per hour – report should read thirty in 14:00:00 period, one in the midnight hour Total bad lines = 1 IP Report – find in test log 2 scs2htd 91 Appendix N: Existing Tool Performance Testing Results A graph to show Performance run times for Logalyse 600 500 Run Time (seconds) 400 Test 1 - Normal Test 2 - Supply IP (202.58.86.5) Test 3 - Supply directory (fyproj) 300 200 100 0 0 50 100 150 200 Log Size (Mb) scs2htd 92 250 300 Appendix O: Existing Tool Usability Testing Consent form I state I am over 18 years of age and wish to participate in the user testing conducted by Howard Dobson at the University of Leeds. The purpose of the user testing is to assess the usability of Logalyse, a tool developed to analyse the School of Computing web site access log. I will be asked to perform specific tasks using Logalyse. I will also be given a questionnaire to fill out and may be asked questions during an informal unstructured interview. I understand that my name will be identified and that the information collected will be publicised. I understand that I am free to ask questions or to withdraw from participation at any time without penalty. ___________________ _______ Signature of Participant Date Usability Satisfaction Questionnaire Welcome to the Logalyse Usability Testing Session Thank you for taking your time to participate in this study. The purpose of this study is to gain some understanding into the use of the tool and any problems that arise. The following pages contain tasks for you to complete. During and after each task please ensure you fill in the questionnaire. Please feel free to ask any questions at any time during the testing. Firstly please provide some details regarding yourself and your previous background. __________________________________________________________________________________ ___ Name: ……………………………………………… scs2htd 93 Sex: Male F Age: under 21 F Female F 21-30 F 31-40 F 41-60 F 60+ F Yes F No F Have you ever used a web analytics tool before? If yes please give details: …………………………………………………………………………………………………………… …………………………………………………………………………………………………………… …………………………………………………………………………………………………………… ……… How would you rate your IT literacy? No experience F Beginner F Intermediate F Expert F __________________________________________________________________________________ ___ Please rate the following tasks in the range below or answer Yes/No by circling the answer. Where appropriate give details. 1 = hard, 2 = average, 3 = easy Task 1 - Familiarise yourself with basic operation of the software Your first task is to spend a while exploring the software and getting used to its operations and viewing its reports. 1) Run the Perl script (using ./<script>.pl) 1 2) Did the program help you to ascertain its usage? Yes/No 3) Does the program tell you what is happening after you Yes/No initially run it? scs2htd 94 2 3 4) View the summary report and main menu, with this initial 1 2 3 look at the system, how difficult do you think it would be to use the software? 5) Do you understand how to continue once the main menu has Yes/No been displayed ? 6) Navigate to each of the reports in turn, for each please state if you understood what each report is presenting. Status Code report Yes/No File Extension report Yes/No Hourly Request report Yes/No Frequent Objects report Yes/No Frequent Pages report Yes/No Summary Report Yes/No IP report Yes/No If you answered no, please give details: …………………………………………………………………………………………………………… …………………………………………………………………………………………………………… …………………………………………………………………………………………………………… …………………………………………………………………………………………………………… …………………………………………………………………………………………………………… …………………………………………………………………………………………………………… …………………………………………………………………………………………………………… ………………… 7) Exit the program 1 2 3 8) Change directory to ‘ReportGraphics’ and view the 1 2 3 1 2 3 images created. 9) How easy was it to understand the statistics the images were presenting? scs2htd 95 Please answer the following questions regarding Task 1 a) Did you at any time not know what was happening? Yes/No If you answered yes please give details: …………………………………………………………………………………………………………… …………………………………………………………………………………………………………… …………………………………………………………………………………………………………… …………………………………………………………………………………………………………… ………… b) Did you at any time not know what to do? Yes/No If you answered yes please give details: …………………………………………………………………………………………………………… …………………………………………………………………………………………………………… …………………………………………………………………………………………………………… …………………………………………………………………………………………………………… ………… c) How easy to use did you find the menu system? 1 2 3 d) In comparison with the textual reports, were the images: Easier to understand F The same F Harder to understand F Task 2 – Running the program using the optional arguments Your second task is to repeat steps 1-5 in Task 1 but this time supply an IP address or directory that is present within the log file. You may need to open the file and choose one to do this. Or pick one from the normal operation output in Task 1. 1) Navigate to each of the reports in turn, for each please state if you understood what each report is presenting. Status Code report scs2htd 96 Yes/No File Extension report Yes/No Hourly Request report Yes/No Frequent Objects report Yes/No Frequent Pages report Yes/No Summary Report Yes/No IP report Yes/No If you answered no, please give details: …………………………………………………………………………………………………………… …………………………………………………………………………………………………………… …………………………………………………………………………………………………………… …………………………………………………………………………………………………………… …………………………………………………………………………………………………………… …………………………………………………………………………………………………………… …………………………………………………………………………………………………………… ………………… Task 3 – User Testing Log 1 Your next task is to use the tool to ascertain the usage within the log file provided. 1) Run the program 2) View all the reports and for each note down your observations, and any significant or interesting points you can make regards the software itself and the usage you are presented with. Status Code Report …………………………………………………………………………………………………………… …………………………………………………………………………………………………………… …………………………………………………………………………………………………………… scs2htd 97 …………………………………………………………………………………………………………… …………………………………………………………………………………………………………… …………………………………………………………………………………………………………… …………………………………………………………………………………………………………… ………………… File Extension Report …………………………………………………………………………………………………………… …………………………………………………………………………………………………………… …………………………………………………………………………………………………………… …………………………………………………………………………………………………………… …………………………………………………………………………………………………………… …………………………………………………………………………………………………………… …………………………………………………………………………………………………………… ………………… Hourly Request Report …………………………………………………………………………………………………………… …………………………………………………………………………………………………………… …………………………………………………………………………………………………………… …………………………………………………………………………………………………………… …………………………………………………………………………………………………………… …………………………………………………………………………………………………………… …………………………………………………………………………………………………………… ………………… Frequent Objects Report …………………………………………………………………………………………………………… …………………………………………………………………………………………………………… …………………………………………………………………………………………………………… …………………………………………………………………………………………………………… …………………………………………………………………………………………………………… …………………………………………………………………………………………………………… scs2htd 98 …………………………………………………………………………………………………………… ………………… Frequent Pages Report …………………………………………………………………………………………………………… …………………………………………………………………………………………………………… …………………………………………………………………………………………………………… …………………………………………………………………………………………………………… …………………………………………………………………………………………………………… …………………………………………………………………………………………………………… …………………………………………………………………………………………………………… ………………… Summary Report …………………………………………………………………………………………………………… …………………………………………………………………………………………………………… …………………………………………………………………………………………………………… …………………………………………………………………………………………………………… …………………………………………………………………………………………………………… …………………………………………………………………………………………………………… …………………………………………………………………………………………………………… ………………… IP Report …………………………………………………………………………………………………………… …………………………………………………………………………………………………………… …………………………………………………………………………………………………………… …………………………………………………………………………………………………………… …………………………………………………………………………………………………………… …………………………………………………………………………………………………………… …………………………………………………………………………………………………………… ………………… Task 4 – User Testing Log 2 Your next task is to use the tool to ascertain the usage within the log file provided. 1) Run the program scs2htd 99 2) View all the reports and for each note down your observations, and any significant or interesting points you can make regards the software itself and the usage you are presented with. Status Code Report …………………………………………………………………………………………………………… …………………………………………………………………………………………………………… …………………………………………………………………………………………………………… …………………………………………………………………………………………………………… …………………………………………………………………………………………………………… …………………………………………………………………………………………………………… …………………………………………………………………………………………………………… ………………… File Extension Report …………………………………………………………………………………………………………… …………………………………………………………………………………………………………… …………………………………………………………………………………………………………… …………………………………………………………………………………………………………… …………………………………………………………………………………………………………… …………………………………………………………………………………………………………… …………………………………………………………………………………………………………… ……………….. Hourly Request Report …………………………………………………………………………………………………………… …………………………………………………………………………………………………………… …………………………………………………………………………………………………………… …………………………………………………………………………………………………………… …………………………………………………………………………………………………………… …………………………………………………………………………………………………………… …………………………………………………………………………………………………………… ………………… Frequent Objects Report …………………………………………………………………………………………………………… …………………………………………………………………………………………………………… …………………………………………………………………………………………………………… …………………………………………………………………………………………………………… scs2htd 100 …………………………………………………………………………………………………………… …………………………………………………………………………………………………………… …………………………………………………………………………………………………………… ………………… Frequent Pages Report …………………………………………………………………………………………………………… …………………………………………………………………………………………………………… …………………………………………………………………………………………………………… …………………………………………………………………………………………………………… …………………………………………………………………………………………………………… …………………………………………………………………………………………………………… …………………………………………………………………………………………………………… ………………… Summary Report …………………………………………………………………………………………………………… …………………………………………………………………………………………………………… …………………………………………………………………………………………………………… …………………………………………………………………………………………………………… …………………………………………………………………………………………………………… …………………………………………………………………………………………………………… …………………………………………………………………………………………………………… ………………… IP Report …………………………………………………………………………………………………………… …………………………………………………………………………………………………………… …………………………………………………………………………………………………………… …………………………………………………………………………………………………………… …………………………………………………………………………………………………………… …………………………………………………………………………………………………………… …………………………………………………………………………………………………………… ………………… Thank you for completing the tasks. Please answer the concluding questions. scs2htd 101 What did you like about Logalyse? …………………………………………………………………………………………………………… …………………………………………………………………………………………………………… …………………………………………………………………………………………………………… …………………………………………………………………………………………………………… …………………………………………………………………………………………………………… …………………………………………………………………………………………………………… …………………………………………………………………………………………………………… ………………… What did you dislike about Logalyse? …………………………………………………………………………………………………………… …………………………………………………………………………………………………………… …………………………………………………………………………………………………………… …………………………………………………………………………………………………………… …………………………………………………………………………………………………………… …………………………………………………………………………………………………………… …………………………………………………………………………………………………………… ………………… Did any errors occur while using Logalyse, if so please give details: …………………………………………………………………………………………………………… …………………………………………………………………………………………………………… …………………………………………………………………………………………………………… …………………………………………………………………………………………………………… …………………………………………………………………………………………………………… …………………………………………………………………………………………………………… …………………………………………………………………………………………………………… ………………… How would you suggest improving Logalyse? …………………………………………………………………………………………………………… …………………………………………………………………………………………………………… …………………………………………………………………………………………………………… …………………………………………………………………………………………………………… …………………………………………………………………………………………………………… …………………………………………………………………………………………………………… …………………………………………………………………………………………………………… ………………… scs2htd 102 Thank you for completing the Logalyse Usability Testing Usability Results Participant: Background Info Sex Age Used Web Analyser before ? IT Literacy? Task 1 - Familiarisation Run Script Usage Shown ? Program keep you informed ? How difficult on first look ? Understand how to continue ? Understand Reports ? : Status Code File Extension Hourly Request Frequent Objects Frequent Pages Summary Report IP Report Exit Program View Images Easy to understand images ? Not know what was happneing? Not know what to do ? Easy to use Menu System ? 2 3 4 Average M 21-30 M 21-30 F < 21 M 21-30 M N/A Y Expert N Expert N Intermediate Y Expert 2Y, 2N N/A 3 Y 3 Y 3 Y 3 N 3 3Y, 1N Y 3 N 2 Y 2 Y 3 3Y, 1N 2.5 Y Y Y Y 4Y Y Y Y Y Y Y Y 3 3 N Y Y N Y Y Y 3 3 N Y Y Y Y Y Y 3 3 N Y Y Y Y Y Y 3 3 1Y, 3N 4Y 4Y 3Y, 1N 4Y 4Y 4Y 3 3 3 3 3 3 3 N N N N N N N N 4N 4N 3 2 3 3 2.75 How were images better than text ? Easier Easier Easier Same N/A Task 2 Optional Arguments Understand Reports ? : Status Code File Extension Hourly Request Frequent Objects Frequent Pages Summary Report IP Report Y Y Y Y Y Y Y Y Y Y Y Y Y Y N Y Y Y Y Y Y N Y Y Y Y Y Y 2Y, 2N 4Y 4Y 4Y 4Y 4Y 4Y 3.0 2.7 2.8 3.0 2.9 Participant Average scs2htd 1 103 Discussion of Answers to Open Questions and other observations: Positives 1. Simple interface can’t go wrong with menu implemented, easy to use it. Negatives 1. Users found it hard to comment on the doctored log files which should have been easy to spot the intentional usage. They all commented that without any context or history of the previous and/or different usage side by side it was hard to talk about the values in the reports. 2. Users felt the need small amounts of help or the menu option to view a simple manual or ‘ReadMe’. They all wanted extra information regards what each report meant and how it was produced. Not so much a software problem because a hardcopy manual is to be provided. 3. IP Report not very useful in dotted form, need to resolve or know which countries they come from. 4. Reports not graphical enough to keep the user interested. Many users got bored of all the text reports in just this testing session. A web based HTML report was requested by most, and a graphical user interface by one. 5. Pie charts could be ordered in ascending. 6. Would be nice to have a percentage on the status code report for each of the areas e.g. % Successful. 7. Users had to enlarge the default console size because the length of the initial output was too big. Those that didn’t had to scroll for a while to understand what had happened. 8. Would be nice to have extensions grouped by their types in the extension report. E.g. all image files grouped under a section heading. Similarly for an additional pie chart. scs2htd 104 Appendix P: Existing Tool Console Dumps and Graphics This section shows the final command line output from the existing tool, some formatting is not the same due to the word processor. cslin097% ./Logalyse.pl sample-access-log-05-10-11.txt Please Wait Opening File..... File Opened Successfully! Please Wait Parsing File...... File Parsed Successfully! --------------------- SUMMARY REPORT --------------------- Total number of bytes sent = 171119 Total number of requests = 31 Total number of Successful Requests = 26 Total number of Failed Requests = 4 Total number of Redirected Requests = 1 Total number of Requests for Pages = 20 Total number of bad lines = 1 Total number of visitors to site = 10 **************************************************** Logalyse v1.0 MAIN MENU 1.Status Code Report 2.File Extension Report 3.Summary Report 4.Frequent Objects Report 5.Hourly Request Report 6.Frequent Pages Report 7.IP Report e.Exit **************************************************** Please select an option... 1 scs2htd 105 ---------------------- STATUS CODE REPORT ---------------------------- Status Code Requests Percentage Succesful ---------------------------------------------------------OK - 200 25 Created - 201 80.6 0 Accepted - 202 0 0 0 Not Modified - 304 1 3.22 Redirected ---------------------------------------------------------Moved Permamently - 301 Found - 302 1 3.22 0 See Other - 303 0 0 0 Failed ---------------------------------------------------------Bad Request - 400 0 Not Authorised - 401 0 2 6.45 Forbidden - 403 0 0 Not Found - 404 2 6.45 Internal Server Error - 500 0 0 HTTP Version Not Supported - 505 0 0 Other ---------------------------------------------------------Other - xxx 0 0 --------------------- FILE EXTENSION REPORT -------------------scs2htd 106 File Extension Requests Percentage .html 4 12.9 .shtml 3 9.67 .htm 0 0 .jpg 5 16.1 .png 1 3.22 .cgi 6 19.3 .gif 1 3.22 .css 3 9.67 .php 1 3.22 .asp 0 0 .ico 1 3.22 .tif 0 0 .bmp 0 0 .doc 0 0 .faq 0 0 .jar 0 0 .js 0 0 .jso 0 0 .log 0 0 .pdf 0 0 .pl 0 0 .ppt 0 0 .txt 0 0 .xls 0 0 .xml 0 0 .zip 0 0 .jsp 0 0 No Extension 6 19.3 4 ------------------- FREQUENT OBJECTS REPORT -------------------- Object Requests /cgi-bin/sis/ts/index.cgi 4 /internal/undergrad/ 2 /Perl/Images/icon_perl_left.gif scs2htd 1 107 /Perl/associative.html 1 /Perl/running.html 1 /cgi-bin/sis/ts/student.cgi?student=surname 1 /cgi-bin/sis/ts/timetable.cgi?cmd=showtimetable&student=<studentid>&semest 1 /favicon.ico 1 /gph/hello.php 1 /gph/images/linuxbanner.jpg 1 /gph/images/nav_header.png 1 /gph/linux 1 /gph/linux/ 1 /gph/style/yfos.css 1 /induct/2005/index.shtml 1 /induct/2005/labsessions.shtml 1 /induct/index.shtml 1 /llau/badminton/ 1 /llau/badminton/badminton.css 1 /llau/badminton/bookings.html 1 /llau/badminton/fees.html 1 /sis/Xfaces/Sid/<studentid>.jpg 1 /styles/sis.css 1 /summer/summer2004/task/designExamples/conjoined/ 1 /summer/summer2004/task/designExamples/conjoined/image3UR.JPG 1 /summer/summer2004/task/designExamples/conjoined/imageBNC.JPG 1 /summer/summer2004/task/designExamples/conjoined/imageO05.JPG 1 6 -------------------FREQUENT PAGES REPORT ---------------------- Page Requests /cgi-bin/sis/ts/index.cgi 4 /internal/undergrad/ 2 /Perl/associative.html 1 /Perl/running.html 1 /cgi-bin/sis/ts/student.cgi?student=surname 1 /cgi-bin/sis/ts/timetable.cgi?cmd=showtimetable&student=<studentid>&semest 1 /gph/hello.php /gph/linux scs2htd 1 1 108 /gph/linux/ 1 /induct/2005/index.shtml 1 /induct/2005/labsessions.shtml 1 /induct/index.shtml 1 /llau/badminton/ 1 /llau/badminton/bookings.html 1 /llau/badminton/fees.html 1 /summer/summer2004/task/designExamples/conjoined/ 5 ---------------- HOURLY REQUEST REPORT ---------------------- Time Requests 00:00:00 --> 01:00:00 0 01:00:00 --> 02:00:00 0 02:00:00 --> 03:00:00 0 03:00:00 --> 04:00:00 0 04:00:00 --> 05:00:00 0 05:00:00 --> 06:00:00 0 06:00:00 --> 07:00:00 0 07:00:00 --> 08:00:00 0 08:00:00 --> 09:00:00 0 09:00:00 --> 10:00:00 0 10:00:00 --> 11:00:00 0 11:00:00 --> 12:00:00 0 12:00:00 --> 13:00:00 0 13:00:00 --> 14:00:00 0 14:00:00 --> 15:00:00 31 15:00:00 --> 16:00:00 0 16:00:00 --> 17:00:00 0 17:00:00 --> 18:00:00 0 18:00:00 --> 19:00:00 0 19:00:00 --> 20:00:00 0 20:00:00 --> 21:00:00 0 21:00:00 --> 22:00:00 0 22:00:00 --> 23:00:00 0 scs2htd 109 1 23:00:00 --> 24:00:00 0 7 ------------------------ IP REPORT --------------------IP Requests 129.11.146.199 6 129.11.110.200 5 86.130.71.220 5 81.109.164.2 4 129.11.147.71 3 129.11.146.12 3 129.11.146.28 2 194.201.98.198 1 203.199.231.42 1 153.96.175.247 1 scs2htd 110 scs2htd 111 Related groups of Stakeholder Needs Description of the Stakeholder Need STAKEHOLDERS Staff (Webmaster) Description Staff (Server Admin) No. Staff Allocation Reference Number Appendix Q: New Tool Requirements Specification MUST The following describe all the 'must have' techniques. Techniques 5.0 The system shall display the most common paths taken through the website. The following topics describe all the 'must have' functional requirements of the new tool. Y Y 5.1 The system shall operate through the command line interface Y Y 5.2 The system shall generate and output text reports to the command line. Y Y 5.3 The system shall use one aspect of the new techniques. Y Y 5.4 The system shall operate through a menu via the command line. SHOULD Y Y Functional The following describe all the 'should have' techniques. Techniques 5.5 The system shall display the most common paths taken through the website in graphical form. The following topics describe all the 'should have' functional requirements of the new tool. Y Y 5.6 The system shall use the full range of new techniques possible. Y Y Functional COULD scs2htd 112 
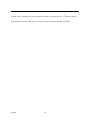
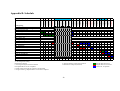
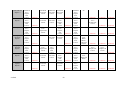
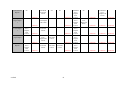
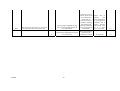
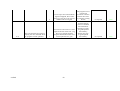
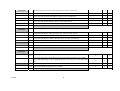
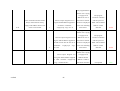
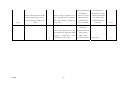
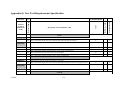
The following describe all the 'could have' techniques. Techniques 5.7 The system shall display the most common paths taken through the website in two dimensional graphical forms overlaid onto the website structure. The following topics describe all the 'could have' functional requirements of the new tool. Y Y 5.8 The system shall operate through a Graphical User interface. WANT TO HAVE BUT NOT THIS TIME Y Y Y Y Functional The following topics describe all the 'want to have but not this time around' techniques. Techniques 5.9 The following topics describe the general requirements of the software, including the non functional requirements. NonFunctional scs2htd The system shall display the most common paths taken through the website in three dimensional graphical forms overlaid onto the website structure. GENERAL 6.0 The system shall inform the user what the current operation is doing so the user does not loose interest and is not confused. Y Y 6.1 The system should be easy to navigate and allow the user to exit or go back at any point. Y Y 6.2 The system should give clear prompts when it is awaiting input. Y Y 6.3 The generation of the reports should take no longer than 10 minutes. Y Y 113 Appendix R: New Tool Physical Design Initial Information cslin034% ./PathFinder <logfile> Please Wait Opening File… File Opened Please Wait Parsing File… File Parsed Main Menu ============================================ = Main Menu = 1. Bad Lines Report = 3. Exit = 2. Common Paths = = ============================================ Please select an option… Bad lines Report Number of Badlines = <value> Common Paths Report ============= Common Paths ============== Path 1 = <path> Frequency = <value> Path 2 = <path> Frequency = <value> . . scs2htd 114 Appendix S: New Tool Functional Testing Functional Area D.10 Area Description This area tests that the processing performed works. The paths found must be correct based on the session paradigm. Test Number Input Data / Description of Test Expected Outcome Actual Outcome Pass / Fail ? 1 Correct input. A very small sample log file (testing log 3) is supplied. It contains a one session only for each visitor. Also contains lines with non successful status codes, and image files. Program runs error free, common paths report shows same frequency for each path. No non page, non successful files should be present in the paths. As expected, only three paths are found and files are only those for web pages and sucessful status codes. Pass Correct input. A very small sample log file (testing log 4) is supplied. It contains multiple sessions for each visitor, but all paths vary. Program runs error free, common paths report still shows same frequency for each path but this time there are more paths than there are visitors. As expected, 6 paths found, while there are only 3 visitors in the log file. Each path has frequency of one. Pass Correct input. Testing log 5 is supplied. It contains multiple sessions each with multiple paths. Only two of the paths match. Program runs error free, common paths report shows one path with a frequency of two, others still have frequency of one. As expected Pass 2 3 scs2htd 115 4 scs2htd Correct Input. Testing log 6 is supplied. Files present are cgi with student specific info. Test ensures files are cleaned. 116 Program runs error free, common paths report shows one path with a frequency of two, others still have frequency of one. No student specific information is still present. As expected, files entered have no characters after the cgi file extension. Pass Appendix T: New Tool Console Dumps cslin095% ./PathFinder.pl sample-access-log-05-10-11Paths.txt Please Wait Opening File..... File Opened Sucessfully! Please Wait Parsing File...... File Parsed Successfully! Total number of paths found = 11 Total number of unique paths found = 10 ================================================================ PathFinder v1.0 MAIN MENU 1. Bad Lines Report 3. Bottom Paths Report 2. Top Paths Report e.Exit ================================================================ Please select an option... Bad Lines Report Number of bad lines detected = 0 Common Paths Report Path = /llau/badminton/ ---> /llau/badminton/fees.html ---> /llau/badminton/bookings.html Frequency = 2 Path = /internal/undergrad/ ---> /internal/undergrad/ ---> /cgi-bin/sis/ts/index.cgi ---> /cgi- bin/sis/ts/timetable.cgi Frequency = 1 Path = /induct/index.shtml ---> /induct/2005/index.shtml ---> /induct/2005/labsessions.shtml Frequency = 1 Path = /gph/linux/ ---> /gph/hello.php ---> /gphCopy/linux/ Frequency = 1 Uncommon Paths Report scs2htd 117 Path = /internal/undergrad/ ---> /internal/undergrad/ ---> /cgi-bin/sis/ts/index.cgi ---> /cgi- bin/sis/ts/timetable.cgi Frequency = 1 Path = /induct/index.shtml ---> /induct/2005/index.shtml ---> /induct/2005/labsessions.shtml Frequency = 1 Path = /gph/linux/ ---> /gph/hello.php ---> /gphCopy/linux/ Frequency = 1 Path = /llau/badminton/ ---> /llau/badminton/fees.html ---> /llau/badminton/bookings.html Frequency = 2 scs2htd 118