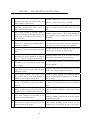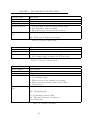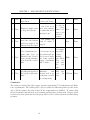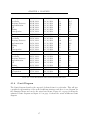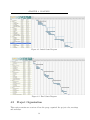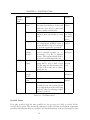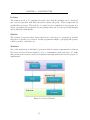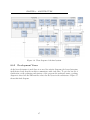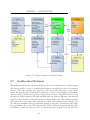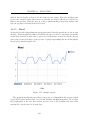
1
Event Log Visualizer
A tool for analyzing and extracting key information from event logs
Tonje Svepstad
Alma Valencia
Juul Arthur Ribe Rudihagen
Christopher Tannum
Jonas Hildershavn
Rune Abrahamsen
Jonas Kirkemyr
Customer Driven Project Final Report
Abstract
This report contains the presentation of the product and the documentation for the development process of Group 2’s collaboration with Autronica Fire and Security AS, in
TDT4290: Customer Driven Project, Autumn 2014 at NTNU.
Autronica Fire and Security AS, from now on Autronica, is an international company
that specializes in development, manufactoring and marketing of fire security equipment.
Autronica wants a program that can visualise logfiles that the control-panels from their
fire security systems produce. These log files can consists of up to 20.000 log entries, with
up to 400.000 lines of text. The project done in TDT4290 in collaboration with Autronica
consists of making a prototype of this program, were the goal for the project is to increase
the efficency of the log-analysing process done by Autronica’s workers by visualising the
log files.
The result of this project is now a functional prototype of the log visualizing tool, and
this final report which presents the program and the development process.
1
Contents
List of Figures
8
List of Tables
10
1 Introduction
1.1 Project Description .
1.2 Project task . . . . .
1.3 Project Name . . . .
1.4 Customer . . . . . .
1.5 Project Stakeholders
1.6 Current Solution . .
1.7 Report Outline . . .
.
.
.
.
.
.
.
11
11
11
11
11
12
13
13
.
.
.
.
.
.
.
.
.
.
.
14
14
14
15
18
18
19
19
20
20
20
21
.
.
.
.
.
.
23
23
23
25
30
30
30
.
.
.
.
.
.
.
.
.
.
.
.
.
.
.
.
.
.
.
.
.
.
.
.
.
.
.
.
.
.
.
.
.
.
.
.
.
.
.
.
.
.
2 Preliminary Studies
2.1 Development Methodology . . .
2.1.1 Waterfall . . . . . . . . .
2.1.2 SCRUM . . . . . . . . .
2.1.3 Choosing a Development
2.2 Assumptions . . . . . . . . . . .
2.3 Limitations . . . . . . . . . . .
2.4 Existing Solutions . . . . . . . .
2.4.1 Current Solution . . . .
2.4.2 Wanted Solution . . . .
2.4.3 Possible Solution . . . .
2.4.4 Existing Solutions . . . .
3 Requirement Specifications
3.1 Use-cases and User-stories . . .
3.1.1 User stories . . . . . . .
3.1.2 Use-cases . . . . . . . .
3.2 Requirements analysis . . . . .
3.2.1 Requirements gathering
3.2.2 Analysis . . . . . . . . .
.
.
.
.
.
.
.
.
.
.
.
.
.
.
.
.
.
.
.
.
.
.
.
.
.
.
.
.
.
.
.
.
.
.
.
.
.
.
.
.
.
.
.
.
.
.
.
.
.
.
.
.
.
.
.
.
. . . . . . . .
. . . . . . . .
. . . . . . . .
Methodology
. . . . . . . .
. . . . . . . .
. . . . . . . .
. . . . . . . .
. . . . . . . .
. . . . . . . .
. . . . . . . .
.
.
.
.
.
.
.
.
.
.
.
.
2
.
.
.
.
.
.
.
.
.
.
.
.
.
.
.
.
.
.
.
.
.
.
.
.
.
.
.
.
.
.
.
.
.
.
.
.
.
.
.
.
.
.
.
.
.
.
.
.
.
.
.
.
.
.
.
.
.
.
.
.
.
.
.
.
.
.
.
.
.
.
.
.
.
.
.
.
.
.
.
.
.
.
.
.
.
.
.
.
.
.
.
.
.
.
.
.
.
.
.
.
.
.
.
.
.
.
.
.
.
.
.
.
.
.
.
.
.
.
.
.
.
.
.
.
.
.
.
.
.
.
.
.
.
.
.
.
.
.
.
.
.
.
.
.
.
.
.
.
.
.
.
.
.
.
.
.
.
.
.
.
.
.
.
.
.
.
.
.
.
.
.
.
.
.
.
.
.
.
.
.
.
.
.
.
.
.
.
.
.
.
.
.
.
.
.
.
.
.
.
.
.
.
.
.
.
.
.
.
.
.
.
.
.
.
.
.
.
.
.
.
.
.
.
.
.
.
.
.
.
.
.
.
.
.
.
.
.
.
.
.
.
.
.
.
.
.
.
.
.
.
.
.
.
.
.
.
.
.
.
.
.
.
.
.
.
.
.
.
.
.
.
.
.
.
.
.
.
.
.
.
.
.
.
.
.
.
.
.
.
.
.
.
.
.
.
.
.
.
.
.
.
.
.
.
.
.
.
.
.
.
.
.
.
.
.
.
.
.
.
.
.
.
.
.
.
.
.
.
.
.
.
.
.
.
.
.
.
.
.
.
.
.
.
.
.
.
.
.
.
.
.
.
.
.
.
.
.
.
.
.
.
.
.
.
.
.
.
.
.
.
.
.
.
.
.
.
.
.
.
.
.
.
.
.
.
.
.
.
.
.
.
.
.
.
.
.
CONTENTS
3.3
Scrum
3.3.1
3.3.2
3.3.3
Backlog . . . . . . . . . .
Making of . . . . . . . . .
Product Backlog . . . . .
Tasks and estimated effort
.
.
.
.
.
.
.
.
.
.
.
.
4 Planning
4.1 Project Plan . . . . . . . . . . . . . . .
4.1.1 Planned project results . . . . .
4.1.2 Planned Project Workload . . .
4.1.3 Project Phases . . . . . . . . .
4.1.4 Milestones . . . . . . . . . . . .
4.1.5 Project Workload . . . . . . . .
4.1.6 Gantt Diagram . . . . . . . . .
4.2 Project Organization . . . . . . . . . .
4.2.1 Meeting Times . . . . . . . . .
4.2.2 Project Roles . . . . . . . . . .
4.2.3 Meeting Templates . . . . . . .
4.2.4 Documentation of Project Work
.
.
.
.
.
.
.
.
.
.
.
.
.
.
.
.
5 Quality Assurance and Risk Assessment
5.1 Quality assurance . . . . . . . . . . . . .
5.1.1 Tactics for quality assurance . . .
5.1.2 Quality attributes . . . . . . . . .
5.1.3 Regular meetings . . . . . . . . .
5.1.4 Meetings invites and minutes . .
5.1.5 Material organization . . . . . . .
5.1.6 GUI guidelines . . . . . . . . . .
5.2 Risk Management . . . . . . . . . . . . .
5.2.1 Handling risks . . . . . . . . . . .
5.2.2 Risk assessment . . . . . . . . . .
.
.
.
.
.
.
.
.
.
.
.
.
.
.
.
.
.
.
.
.
.
.
.
.
.
.
.
.
.
.
.
.
.
.
.
.
.
.
.
.
.
.
.
.
.
.
.
.
.
.
.
.
.
.
.
.
.
.
.
.
.
.
.
.
.
.
.
.
.
.
.
.
.
.
.
.
.
.
.
.
.
.
.
.
.
.
.
.
.
.
.
.
.
.
.
.
.
.
.
.
.
.
.
.
.
.
.
.
.
.
.
.
.
.
.
.
.
.
.
.
.
.
.
.
.
.
.
.
.
.
.
.
.
.
.
.
.
.
.
.
.
.
.
.
.
.
.
.
.
.
.
.
.
.
.
.
.
.
.
.
.
.
.
.
.
.
.
.
.
.
.
.
.
.
.
.
.
.
.
.
.
.
.
.
.
.
.
.
.
.
.
.
.
.
.
.
.
.
.
.
.
.
.
.
.
.
.
.
.
.
.
.
.
.
.
.
.
.
.
.
.
.
.
.
.
.
.
.
.
.
.
.
.
.
.
.
.
.
.
.
.
.
.
.
.
.
.
.
.
.
.
.
.
.
.
.
.
.
.
.
.
.
.
.
.
.
.
.
.
.
.
.
.
.
.
.
.
.
.
.
.
.
.
.
.
.
.
.
.
.
.
.
30
30
31
33
.
.
.
.
.
.
.
.
.
.
.
.
35
35
35
35
36
36
36
37
38
39
39
40
40
.
.
.
.
.
.
.
.
.
.
.
.
.
.
.
.
.
.
.
.
.
.
.
.
.
.
.
.
.
.
.
.
.
.
.
.
.
.
.
.
.
.
.
.
.
.
.
.
.
.
.
.
.
.
.
.
.
.
.
.
.
.
.
.
.
.
.
.
.
.
.
.
.
.
.
.
.
.
.
.
.
.
.
.
.
.
.
.
.
.
.
.
.
.
.
.
.
.
.
.
42
42
42
43
44
44
46
48
52
52
52
6 Test Plan
6.1 Functional tests . . . . . . . . . . . . . . . . . . . . . . . .
6.1.1 Unit tests . . . . . . . . . . . . . . . . . . . . . . .
6.1.2 Integration testing and component interface testing
6.1.3 System test . . . . . . . . . . . . . . . . . . . . . .
6.1.4 Acceptance test . . . . . . . . . . . . . . . . . . . .
6.2 Non-functional tests . . . . . . . . . . . . . . . . . . . . .
6.3 Test Criteria . . . . . . . . . . . . . . . . . . . . . . . . . .
6.4 Test responsibilities . . . . . . . . . . . . . . . . . . . . . .
6.5 Changelog . . . . . . . . . . . . . . . . . . . . . . . . . . .
6.5.1 Sprint 1 . . . . . . . . . . . . . . . . . . . . . . . .
6.5.2 Sprint 2 . . . . . . . . . . . . . . . . . . . . . . . .
.
.
.
.
.
.
.
.
.
.
.
.
.
.
.
.
.
.
.
.
.
.
.
.
.
.
.
.
.
.
.
.
.
.
.
.
.
.
.
.
.
.
.
.
.
.
.
.
.
.
.
.
.
.
.
.
.
.
.
.
.
.
.
.
.
.
.
.
.
.
.
.
.
.
.
.
.
.
.
.
.
.
.
.
.
.
.
.
.
.
.
.
.
.
.
.
.
.
.
59
59
59
60
60
60
61
62
62
62
62
63
3
.
.
.
.
.
.
.
.
.
.
.
.
.
.
.
.
.
.
.
.
.
.
.
.
.
.
.
.
.
.
.
.
.
.
.
.
.
.
.
.
.
.
.
.
.
.
.
.
.
.
.
.
.
.
.
.
.
.
.
.
.
.
.
.
.
.
.
.
.
.
.
.
.
.
.
.
.
.
.
.
.
.
.
.
.
.
.
.
.
.
CONTENTS
6.5.3
6.5.4
7 Tools
7.1 Tools
7.1.1
7.1.2
7.1.3
7.1.4
7.1.5
7.1.6
7.1.7
7.1.8
Sprint 3 . . . . . . . . . . . . . . . . . . . . . . . . . . . . . . . . .
Sprint 4 . . . . . . . . . . . . . . . . . . . . . . . . . . . . . . . . .
and Programs . . . . . . . . . . .
Git . . . . . . . . . . . . . . . .
Google Drive . . . . . . . . . .
Facebook . . . . . . . . . . . .
Trello . . . . . . . . . . . . . .
Latex . . . . . . . . . . . . . .
Java 8 . . . . . . . . . . . . . .
JavaFX 8 and Scenebuilder 2.0
Version Control Procedures . .
8 Architecture
8.1 Architectural Dependencies . . . . . .
8.1.1 Java and JavaFX . . . . . . . .
8.1.2 SCRUM . . . . . . . . . . . . .
8.2 Architectural Drivers . . . . . . . . . .
8.2.1 Modifiability . . . . . . . . . . .
8.2.2 Performance . . . . . . . . . . .
8.2.3 Usability . . . . . . . . . . . . .
8.2.4 Testability . . . . . . . . . . . .
8.3 Architectural Significant Requirements
8.4 Architectural Patterns . . . . . . . . .
8.4.1 Layered Pattern . . . . . . . . .
8.4.2 Model-View-Controller Pattern
8.4.3 Factory Method Pattern . . . .
8.4.4 Abstract Factory Pattern . . . .
8.4.5 Facade Pattern . . . . . . . . .
8.4.6 Singleton Pattern . . . . . . . .
8.4.7 Pipe and Filters Pattern . . . .
8.5 Development Process . . . . . . . . . .
8.6 Architectural Views . . . . . . . . . . .
8.6.1 Logical Views . . . . . . . . . .
8.6.2 Development Views . . . . . . .
8.7 Architectural Rational . . . . . . . . .
8.8 Changes . . . . . . . . . . . . . . . . .
9 Sprints
.
.
.
.
.
.
.
.
.
.
.
.
.
.
.
.
.
.
.
.
.
.
.
.
.
.
.
.
.
.
.
.
.
.
.
.
.
.
.
.
.
.
.
.
.
.
.
.
.
.
.
.
.
.
.
.
.
.
.
.
.
.
.
.
.
.
.
.
.
.
.
.
.
.
.
.
.
.
.
.
.
.
.
.
.
.
.
.
.
.
.
.
.
.
.
.
.
.
.
.
.
.
.
.
.
.
.
.
.
.
.
.
.
.
.
.
.
.
.
.
.
.
.
.
.
.
.
.
.
.
.
.
.
.
.
.
.
.
.
.
.
.
.
.
.
.
.
.
.
.
.
.
.
.
.
.
.
.
.
.
.
.
.
.
.
.
.
.
.
.
.
.
.
.
.
.
.
.
.
.
.
.
.
.
.
.
.
.
.
.
.
.
.
.
.
.
.
.
.
.
.
.
.
.
.
.
.
.
.
.
.
.
.
.
.
.
.
.
.
.
.
.
.
.
.
.
.
.
.
.
.
.
.
.
.
.
.
.
.
.
.
.
.
.
.
.
.
.
.
.
.
.
.
.
.
.
.
.
.
.
.
.
.
.
.
.
.
.
.
.
.
.
.
.
.
.
.
.
.
.
.
.
.
.
.
.
.
.
.
.
.
.
.
.
.
.
.
.
.
.
.
.
.
.
.
.
.
.
.
.
.
.
.
.
.
.
.
.
.
.
.
.
.
.
.
.
.
.
.
.
.
.
.
.
.
.
.
.
.
.
.
.
.
.
.
.
.
.
.
.
.
.
.
.
.
.
.
.
.
.
.
.
.
.
.
.
.
.
.
.
.
.
.
.
.
.
.
.
.
.
.
.
.
.
.
.
.
.
.
.
.
.
.
.
.
.
.
.
.
.
.
.
.
.
.
.
.
.
.
.
.
.
.
.
.
.
.
.
.
.
.
.
.
.
.
.
.
.
.
.
.
.
.
.
.
.
.
.
.
.
.
.
.
.
.
.
.
.
.
.
.
.
.
.
.
.
.
.
.
.
.
.
.
.
.
.
.
.
.
.
.
.
.
.
.
.
.
.
.
.
.
.
.
.
.
.
.
.
.
.
.
.
.
.
.
.
.
.
.
.
.
.
.
.
.
.
.
.
.
.
.
.
.
.
.
.
.
.
.
.
.
.
.
.
.
.
.
.
.
.
.
.
.
.
.
.
.
.
.
.
.
.
.
.
.
.
.
.
.
.
.
.
.
.
.
.
.
.
.
.
.
.
.
.
.
.
.
.
.
.
.
.
.
.
.
.
.
.
.
.
.
.
.
.
.
.
.
.
.
.
.
.
.
.
.
.
.
.
.
.
.
.
.
.
.
.
.
.
63
63
.
.
.
.
.
.
.
.
.
64
64
65
65
65
65
66
66
66
67
.
.
.
.
.
.
.
.
.
.
.
.
.
.
.
.
.
.
.
.
.
.
.
68
68
68
68
68
69
70
72
75
76
77
77
79
80
80
80
81
81
82
85
85
87
88
89
90
4
CONTENTS
10 Sprint 1
10.1 Sprint Planning . . . . . .
10.1.1 Duration . . . . . .
10.1.2 Sprint Goal . . . .
10.1.3 Sprint Backlog . .
10.1.4 GUI: Concept . . .
10.2 Create Initial Architecture
10.3 Sprint Review . . . . . . .
10.4 Sprint Retrospective . . .
.
.
.
.
.
.
.
.
.
.
.
.
.
.
.
.
.
.
.
.
.
.
.
.
.
.
.
.
.
.
.
.
11 Sprint 2
11.1 Sprint Planning . . . . . . . . . .
11.1.1 Duration . . . . . . . . . .
11.1.2 Sprint Goal . . . . . . . .
11.1.3 Sprint Backlog . . . . . .
11.2 Packaging, structure and program
11.3 Program loader and parser . . . .
11.3.1 Program loader . . . . . .
11.3.2 Parsers . . . . . . . . . . .
11.4 Implementing a GUI prototype .
11.4.1 Process . . . . . . . . . .
11.4.2 Result . . . . . . . . . . .
11.5 Sprint Review . . . . . . . . . . .
11.6 Sprint Retrospective . . . . . . .
.
.
.
.
.
.
.
.
.
.
.
.
.
.
.
.
.
.
.
.
.
.
.
.
.
.
.
.
.
.
.
.
.
.
.
.
.
.
.
.
.
.
.
.
.
.
.
.
.
.
.
.
.
.
.
.
.
.
.
.
.
.
.
.
.
.
.
.
.
.
.
.
.
.
.
.
.
.
.
.
.
.
.
.
.
.
.
.
.
.
.
.
.
.
.
.
.
.
.
.
.
.
.
.
.
.
.
.
.
.
.
.
.
.
.
.
.
.
.
.
.
.
.
.
.
.
.
.
.
.
.
.
.
.
.
.
.
.
.
.
.
.
.
.
.
.
.
.
.
.
.
.
.
.
.
.
.
.
.
.
.
.
.
.
.
.
.
.
.
.
.
.
.
.
.
.
.
.
.
.
.
.
.
.
91
91
91
91
92
92
95
96
96
.
.
.
.
.
.
.
.
.
.
.
.
.
.
.
.
.
.
.
.
.
.
.
.
.
.
.
.
.
.
.
.
.
.
.
.
.
.
.
.
.
.
.
.
.
.
.
.
.
.
.
.
.
.
.
.
.
.
.
.
.
.
.
.
.
.
.
.
.
.
.
.
.
.
.
.
.
.
.
.
.
.
.
.
.
.
.
.
.
.
.
.
.
.
.
.
.
.
.
.
.
.
.
.
.
.
.
.
.
.
.
.
.
.
.
.
.
.
.
.
.
.
.
.
.
.
.
.
.
.
.
.
.
.
.
.
.
.
.
.
.
.
.
.
.
.
.
.
.
.
.
.
.
.
.
.
98
98
98
98
98
99
99
99
99
100
100
101
101
101
12 Sprint 3
12.1 Sprint Planning . . . . . . . . . . . . . . . . . . . . . .
12.1.1 Duration . . . . . . . . . . . . . . . . . . . . . .
12.1.2 Sprint Goal . . . . . . . . . . . . . . . . . . . .
12.1.3 Sprint Backlog . . . . . . . . . . . . . . . . . .
12.2 GUI - Reviewing and Changes . . . . . . . . . . . . . .
12.3 Functionality to search for keywords in the log file . . .
12.4 Functionality to save and load projects . . . . . . . . .
12.5 Functionality to view information about a single event
12.6 Usability testing . . . . . . . . . . . . . . . . . . . . . .
12.6.1 Results . . . . . . . . . . . . . . . . . . . . . . .
12.6.2 Evaluation . . . . . . . . . . . . . . . . . . . . .
12.7 Sprint Review . . . . . . . . . . . . . . . . . . . . . . .
12.8 Sprint Retrospective . . . . . . . . . . . . . . . . . . .
.
.
.
.
.
.
.
.
.
.
.
.
.
.
.
.
.
.
.
.
.
.
.
.
.
.
.
.
.
.
.
.
.
.
.
.
.
.
.
.
.
.
.
.
.
.
.
.
.
.
.
.
.
.
.
.
.
.
.
.
.
.
.
.
.
.
.
.
.
.
.
.
.
.
.
.
.
.
.
.
.
.
.
.
.
.
.
.
.
.
.
.
.
.
.
.
.
.
.
.
.
.
.
.
.
.
.
.
.
.
.
.
.
.
.
.
.
.
.
.
.
.
.
.
.
.
.
.
.
.
.
.
.
.
.
.
.
.
.
.
.
.
.
103
103
103
103
103
104
106
106
106
107
107
109
110
111
5
. . . . .
. . . . .
. . . . .
. . . . .
skeletion
. . . . .
. . . . .
. . . . .
. . . . .
. . . . .
. . . . .
. . . . .
. . . . .
.
.
.
.
.
.
.
.
.
.
.
.
.
.
.
.
.
.
.
.
.
.
.
.
.
.
.
.
.
.
.
.
.
.
.
.
.
.
.
.
.
.
.
.
.
.
.
.
.
.
.
.
.
.
.
.
.
.
.
.
.
.
.
.
.
.
.
.
.
.
.
.
.
.
.
.
.
.
CONTENTS
13 Sprint 4
13.1 Sprint Planning . . . . . . . . . . . . . . . . . . . . .
13.1.1 Duration . . . . . . . . . . . . . . . . . . . . .
13.1.2 Sprint Goal . . . . . . . . . . . . . . . . . . .
13.1.3 Sprint Backlog . . . . . . . . . . . . . . . . .
13.2 GUI - Final Review . . . . . . . . . . . . . . . . . . .
13.2.1 Review of GUI in respect to design guidelines
13.3 Testing . . . . . . . . . . . . . . . . . . . . . . . . . .
13.4 Usability testing . . . . . . . . . . . . . . . . . . . . .
13.4.1 Results . . . . . . . . . . . . . . . . . . . . . .
13.4.2 Evaluation . . . . . . . . . . . . . . . . . . . .
13.5 Sprint Review . . . . . . . . . . . . . . . . . . . . . .
13.6 Sprint Retrospective . . . . . . . . . . . . . . . . . .
13.6.1 We should continue... . . . . . . . . . . . . . .
13.6.2 We should start... . . . . . . . . . . . . . . . .
.
.
.
.
.
.
.
.
.
.
.
.
.
.
.
.
.
.
.
.
.
.
.
.
.
.
.
.
.
.
.
.
.
.
.
.
.
.
.
.
.
.
.
.
.
.
.
.
.
.
.
.
.
.
.
.
.
.
.
.
.
.
.
.
.
.
.
.
.
.
.
.
.
.
.
.
.
.
.
.
.
.
.
.
.
.
.
.
.
.
.
.
.
.
.
.
.
.
.
.
.
.
.
.
.
.
.
.
.
.
.
.
.
.
.
.
.
.
.
.
.
.
.
.
.
.
.
.
.
.
.
.
.
.
.
.
.
.
.
.
.
.
.
.
.
.
.
.
.
.
.
.
.
.
.
.
.
.
.
.
.
.
.
.
.
.
.
.
112
112
113
113
113
114
114
118
118
119
120
120
121
121
121
14 Evaluation
14.1 The process . . . . . . . .
14.1.1 The team . . . . .
14.1.2 Scrum . . . . . . .
14.1.3 Workflow . . . . .
14.1.4 Communication . .
14.1.5 Mood . . . . . . .
14.2 The customer . . . . . . .
14.3 The task . . . . . . . . . .
14.4 The advisor . . . . . . . .
14.5 Further work . . . . . . .
14.6 Suggestions for the course
14.7 Summary . . . . . . . . .
.
.
.
.
.
.
.
.
.
.
.
.
.
.
.
.
.
.
.
.
.
.
.
.
.
.
.
.
.
.
.
.
.
.
.
.
.
.
.
.
.
.
.
.
.
.
.
.
.
.
.
.
.
.
.
.
.
.
.
.
.
.
.
.
.
.
.
.
.
.
.
.
.
.
.
.
.
.
.
.
.
.
.
.
.
.
.
.
.
.
.
.
.
.
.
.
.
.
.
.
.
.
.
.
.
.
.
.
.
.
.
.
.
.
.
.
.
.
.
.
.
.
.
.
.
.
.
.
.
.
.
.
.
.
.
.
.
.
.
.
.
.
.
.
122
122
122
122
123
123
124
125
125
125
126
126
126
.
.
.
.
.
.
.
.
.
.
.
.
.
.
.
.
.
.
.
.
.
.
.
.
.
.
.
.
.
.
.
.
.
.
.
.
.
.
.
.
.
.
.
.
.
.
.
.
.
.
.
.
.
.
.
.
.
.
.
.
.
.
.
.
.
.
.
.
.
.
.
.
.
.
.
.
.
.
.
.
.
.
.
.
.
.
.
.
.
.
.
.
.
.
.
.
.
.
.
.
.
.
.
.
.
.
.
.
.
.
.
.
.
.
.
.
.
.
.
.
.
.
.
.
.
.
.
.
.
.
.
.
.
.
.
.
.
.
.
.
.
.
.
.
.
.
.
.
.
.
.
.
.
.
.
.
.
.
.
.
.
.
.
.
.
.
.
.
.
.
.
.
.
.
.
.
.
.
.
.
15 Conclusion
128
15.1 The Process . . . . . . . . . . . . . . . . . . . . . . . . . . . . . . . . . . . 128
15.2 Product Overview . . . . . . . . . . . . . . . . . . . . . . . . . . . . . . . . 128
15.2.1 Architecture . . . . . . . . . . . . . . . . . . . . . . . . . . . . . . . 129
Bibliography
A User Manual
A.1 User Manual . . . .
A.2 Start the program .
A.3 User interface . . .
A.4 Filter screen . . . .
A.5 Filter and Tab bars
130
.
.
.
.
.
.
.
.
.
.
.
.
.
.
.
.
.
.
.
.
.
.
.
.
.
.
.
.
.
.
6
.
.
.
.
.
.
.
.
.
.
.
.
.
.
.
.
.
.
.
.
.
.
.
.
.
.
.
.
.
.
.
.
.
.
.
.
.
.
.
.
.
.
.
.
.
.
.
.
.
.
.
.
.
.
.
.
.
.
.
.
.
.
.
.
.
.
.
.
.
.
.
.
.
.
.
.
.
.
.
.
.
.
.
.
.
.
.
.
.
.
.
.
.
.
.
.
.
.
.
.
.
.
.
.
.
.
.
.
.
.
.
.
.
.
.
.
.
.
.
.
.
.
.
.
.
132
133
133
134
135
136
CONTENTS
A.6
A.7
A.8
A.9
A.5.1 Tab bar .
A.5.2 Filter bar
Search . . . . . .
Views . . . . . .
Zoom . . . . . . .
Important Events
.
.
.
.
.
.
.
.
.
.
.
.
.
.
.
.
.
.
.
.
.
.
.
.
.
.
.
.
.
.
.
.
.
.
.
.
B Meeting Minutes
B.1 Advisor Meeting minutes . .
B.2 Customer Meeting Minutes .
B.3 Group Meeting Minutes . .
B.3.1 Sprint 1 . . . . . . .
B.3.2 Sprint 2 . . . . . . .
B.3.3 Sprint 3 . . . . . . .
B.3.4 Sprint 4 . . . . . . .
.
.
.
.
.
.
.
.
.
.
.
.
.
7
.
.
.
.
.
.
.
.
.
.
.
.
.
.
.
.
.
.
.
.
.
.
.
.
.
.
.
.
.
.
.
.
.
.
.
.
.
.
.
.
.
.
.
.
.
.
.
.
.
.
.
.
.
.
.
.
.
.
.
.
.
.
.
.
.
.
.
.
.
.
.
.
.
.
.
.
.
.
.
.
.
.
.
.
.
.
.
.
.
.
.
.
.
.
.
.
.
.
.
.
.
.
.
.
.
.
.
.
.
.
.
.
.
.
.
.
.
.
.
.
.
.
.
.
.
.
.
.
.
.
.
.
.
.
.
.
.
.
.
.
.
.
.
.
.
.
.
.
.
.
.
.
.
.
.
.
.
.
.
.
.
.
.
.
.
.
.
.
.
.
.
.
.
.
.
.
.
.
.
.
.
.
.
.
.
.
.
.
.
.
.
.
.
.
.
.
.
.
.
.
.
.
.
.
.
.
.
.
.
.
.
.
.
.
.
.
.
.
.
.
.
.
.
.
.
.
.
.
.
.
.
.
.
.
.
.
.
.
.
.
.
.
.
.
.
.
.
.
.
.
.
.
.
.
.
.
.
.
.
.
.
.
.
.
.
.
.
.
.
.
.
.
.
.
.
.
.
.
.
.
.
.
.
.
.
.
.
.
.
.
.
.
.
.
.
.
.
.
.
.
.
.
.
.
.
.
.
.
.
.
.
.
.
.
.
.
.
.
136
137
137
137
138
138
.
.
.
.
.
.
.
139
140
151
160
160
181
197
210
List of Figures
2.1
2.2
A scrum board example . . . . . . . . . . . . . . . . . . . . . . . . . . . .
Log Parser 2.2 Preview . . . . . . . . . . . . . . . . . . . . . . . . . . . . .
17
22
4.1
4.2
Initial Gantt Diagram . . . . . . . . . . . . . . . . . . . . . . . . . . . . .
Final Gantt Diagram . . . . . . . . . . . . . . . . . . . . . . . . . . . . . .
38
38
5.1
Risk assessment . . . . . . . . . . . . . . . . . . . . . . . . . . . . . . . . .
53
8.1
8.2
8.3
8.4
8.5
8.6
8.7
Layered Pattern . . . . . . . . . . .
MVC Pattern . . . . . . . . . . . .
MVC Pattern . . . . . . . . . . . .
Old architecture . . . . . . . . . . .
The final architecture . . . . . . . .
Class diagram of the final system .
Package diagram of the final system
.
.
.
.
.
.
.
78
79
82
85
86
87
88
10.1 Line chart view for a general overview . . . . . . . . . . . . . . . . . . . .
10.2 Paper mock-up for bar chart view . . . . . . . . . . . . . . . . . . . . . . .
10.3 Paper mock-up for node chart view . . . . . . . . . . . . . . . . . . . . . .
93
94
95
.
.
.
.
.
.
.
.
.
.
.
.
.
.
.
.
.
.
.
.
.
.
.
.
.
.
.
.
.
.
.
.
.
.
.
.
.
.
.
.
.
.
.
.
.
.
.
.
.
.
.
.
.
.
.
.
.
.
.
.
.
.
.
.
.
.
.
.
.
.
.
.
.
.
.
.
.
.
.
.
.
.
.
.
.
.
.
.
.
.
.
.
.
.
.
.
.
.
.
.
.
.
.
.
.
.
.
.
.
.
.
.
.
.
.
.
.
.
.
.
.
.
.
.
.
.
.
.
.
.
.
.
.
.
.
.
.
.
.
.
.
.
.
.
.
.
.
11.1 GUI elements of the user interface . . . . . . . . . . . . . . . . . . . . . . . 100
12.1 Bar chart for added level of detail . . . . . . . . . . . . . . . . . . . . . . . 104
12.2 Panel for filtering log entries . . . . . . . . . . . . . . . . . . . . . . . . . . 105
12.3 List view for a detailed look of log entries . . . . . . . . . . . . . . . . . . . 106
13.1
13.2
13.3
13.4
Final
Final
Final
Final
layout
layout
layout
layout
of main screen . .
with filter panel .
with filter panel .
of bar chart view
.
.
.
.
.
.
.
.
.
.
.
.
.
.
.
.
.
.
.
.
.
.
.
.
.
.
.
.
.
.
.
.
.
.
.
.
.
.
.
.
.
.
.
.
.
.
.
.
.
.
.
.
.
.
.
.
.
.
.
.
.
.
.
.
.
.
.
.
.
.
.
.
.
.
.
.
.
.
.
.
.
.
.
.
.
.
.
.
.
.
.
.
.
.
.
.
.
.
.
.
114
116
117
118
14.1 example caption . . . . . . . . . . . . . . . . . . . . . . . . . . . . . . . . . 124
A.1 Start screen of the program . . . . . . . . . . . . . . . . . . . . . . . . . . 133
A.2 Main screen of the program . . . . . . . . . . . . . . . . . . . . . . . . . . 135
8
LIST OF FIGURES
A.3 The filter screen . . . . . . . . . . . . . . . . . . . . . . . . . . . . . . . . . 136
9
List of Tables
1.1
1.2
Group 2: TDT4290 Customer Driven Project . . . . . . . . . . . . . . . .
Representative: Autronica Fire and Security AS . . . . . . . . . . . . . . .
13
13
3.1
3.2
3.3
3.4
3.5
3.6
3.7
3.8
3.9
3.10
3.12
User Stories for end-users
Actor A1 - User . . . . . .
Actor A2 - System . . . .
Use-case - Open files . . .
Use-case - Search event . .
Use-case - Save event . . .
Use-case - Choose mode .
Use-case - Set filter . . . .
Use-case - Load event . . .
Use-case - Sort event . . .
Tasks and estimated effort
.
.
.
.
.
.
.
.
.
.
.
.
.
.
.
.
.
.
.
.
.
.
.
.
.
.
.
.
.
.
.
.
.
.
.
.
.
.
.
.
.
.
.
.
.
.
.
.
.
.
.
.
.
.
.
.
.
.
.
.
.
.
.
.
.
.
.
.
.
.
.
.
.
.
.
.
.
.
.
.
.
.
.
.
.
.
.
.
.
.
.
.
.
.
.
.
.
.
.
.
.
.
.
.
.
.
.
.
.
.
.
.
.
.
.
.
.
.
.
.
.
.
.
.
.
.
.
.
.
.
.
.
.
.
.
.
.
.
.
.
.
.
.
.
.
.
.
.
.
.
.
.
.
.
.
.
.
.
.
.
.
.
.
.
.
.
.
.
.
.
.
.
.
.
.
.
.
.
.
.
.
.
.
.
.
.
.
25
26
26
27
27
28
28
28
29
29
34
4.1
4.2
4.3
4.4
Milestones . . . . . . . . . . . . . . . . . . . .
Work Breakdown table with actual work hours
Meetings . . . . . . . . . . . . . . . . . . . . .
Responsibility Areas . . . . . . . . . . . . . .
.
.
.
.
.
.
.
.
.
.
.
.
.
.
.
.
.
.
.
.
.
.
.
.
.
.
.
.
.
.
.
.
.
.
.
.
.
.
.
.
.
.
.
.
.
.
.
.
.
.
.
.
.
.
.
.
.
.
.
.
.
.
.
.
36
37
39
40
5.1
Risk description table . . . . . . . . . . . . . . . . . . . . . . . . . . . . . .
58
6.1
Acceptance tests . . . . . . . . . . . . . . . . . . . . . . . . . . . . . . . .
61
8.1
8.2
8.3
8.4
8.5
Modifiability tactics . . . . . . . . . . .
Performance tactics . . . . . . . . . . .
Usability tactics . . . . . . . . . . . . .
Testability tactics . . . . . . . . . . . .
Architectural Significant Requirements
70
71
74
76
77
.
.
.
.
.
.
.
.
.
.
.
.
.
.
.
.
.
.
.
.
.
.
.
.
.
.
.
.
.
.
.
.
.
.
.
.
.
.
.
.
.
.
.
.
.
.
.
.
.
.
.
.
.
.
.
.
.
.
.
.
.
.
.
.
.
.
10
.
.
.
.
.
.
.
.
.
.
.
.
.
.
.
.
.
.
.
.
.
.
.
.
.
.
.
.
.
.
.
.
.
.
.
.
.
.
.
.
.
.
.
.
.
.
.
.
.
.
.
.
.
.
.
.
.
.
.
.
.
.
.
.
.
.
.
.
.
.
.
.
.
.
.
.
.
.
.
.
.
.
.
.
.
.
.
.
.
.
.
.
.
.
.
.
.
.
.
.
.
.
.
.
.
.
.
.
.
.
.
.
.
.
.
.
.
.
.
.
.
.
.
.
.
.
.
.
.
.
.
.
.
.
.
.
.
.
.
.
.
.
.
.
1 | Introduction
1.1
Project Description
Autronica Fire and Security AS, hereby referred to as Autronica, is an international company, headquartered in Trondheim. Part of the company’s area of expertise consists of
developing and manufacturing fire safety equipment. These systems typically create log
files which contains information about any events that has occurred within the system.
When something goes wrong, Autronica has to manually look through the lines in the
log file to see what, why, and how the log events were produced. Since one such log file
can contain as many as 20 000 events, and over 400 000 lines of text, this process quickly
becomes tedious and time-consuming. This is therefore a problem in Autronica’s eyes and
something they want to do something about.
1.2
Project task
In hopes of making the process of log analyzing more efficient, Autronica has requested a
program that presents the log from their firesystem’s control panels in a more graphical and
user-friendly way. Therefore the goal of this project is to develop, document and present
a functional prototype that can help Autronica analyze these logfiles in a more effective
way.
1.3
Project Name
The project name is "Autronica Log Visualizer". It was important for us to have a descriptive working title for the project, and since the customer emphasized that the software
should visualize event log files in a user friendly way, "Autronica Log Visualizer" became
the name for the project.
1.4
Customer
Autronica Fire and Security AS is an international company which manufactures and
supplies fire safety equipment. The company is owned by United Technologies Corporation
11
CHAPTER 1. INTRODUCTION
(UTC) and employs more than 380 employees. Their offices are situated in Trondheim.
Autronica deliver total solutions to ensure physical safety. Contrary to most fire alarm
manufacturers, they develop, produce and distribute themselves, ensuring the optimal
utilization of, and interaction between detectors, interfaces and fire alarm control panels.
Their systems are applicable anywhere fire safety is needed, and their customers range
from hospitals and airports to power plants, offshore installations and cruise-ships worldwide.
1.5
Project Stakeholders
Project stakeholders are individuals or organizations that are actively involved in the
project, or whose interests may be affected by the project execution or project completion. This project’s stakeholders include the user group, the customer, the development
team and the customer driven project staff.
The User Group
The user group is Autronica employees. The product’s purpose is to reduce the amount of
time it takes for Autronica employees to analyze and make reports on fire panel event logs.
A possible other user-group is Autronica’s customers, they could learn to do the analysis
themselves if given the right tools for the job. The usergroup’s interest is that a program
that helps them analyze the log files more effectively is developed.
The Customer
The customer in this project is Autronica. They are the ones asking for the program and
will be the owner of it when its done. Their interest is that a good program is made and
that the program prototype meets the requirements that are set. The contact information
to Autronica can be found in table 1.2 on page 13.
The Course Staff
The course staff are stakeholder in the project too. They are interested in the results of
the project and wants the development team to do their job as good as possible. They’re
also interested in that the development team follows their instructions and guidelines, and
that the customer gets what they asked for.
The development team
The development team consists of the students listed in table 1.1 on page 13. The interest
for the development team in this project is to satisfy the demands of the customer and
course staff to their best ability. This is important as they are rewared by how good they
do their jobs.
12
CHAPTER 1. INTRODUCTION
Alma Valencia
Tonje Svepstad
Juul Arthur Ribe Rudihagen
Christopher Tannum
Jonas Kirkemyr
Rune Abrahamsen
Jonas Hildershavn
[email protected]
[email protected]
[email protected]
[email protected]
[email protected]
[email protected]
[email protected]
Table 1.1: Group 2: TDT4290 Customer Driven Project
Morten Solli
[email protected]
Table 1.2: Representative: Autronica Fire and Security AS
1.6
Current Solution
Autronica analyzes log files from their fire security panels whenever one of their customers
request to know what has happened. Typically, if there’s been a fire, or if alarms and
events does not match in their customer’s eyes, Autronica tries to provide them with the
necessary information through analysis of the log file produced in the main fire security
panel.
Their current solution to analyze the log files is to do so manually. They open the log
files in a text editor, makes use of keyboard shortcuts such as search(Ctrl + F) and take
notes on the side whenever they see something that might be of importance. It typically
takes an employee, that is experienced in analyzing these logs, around 8 hours to complete
such a task.
1.7
Report Outline
This report is meant to give a overview of how the development team developed the program
and the results of this process. Chapter 2 looks at the preliminary studies done by the
group before development started. Chapter 3 looks at the requirements specification for
the program. Chapter 4 looks at planning the group did to make sure the program would
be finished in time for the deadline. Chapter 5 looks at the Quality Assurances and Risk
Assessments the group had for the project. Chapter 6 looks at the testing the group did
to make sure the quality was upheld. Chapter 7 looks at the tools used to develop the
program. Chapter 8 looks at the architecture and structure of the program. Chapter 9
looks at the scrum sprints completed in the project. Chapter 14 looks at the evaluation
done by the development team at the end of the project. And at the end chapter 15 looks
at the final conclusion done by the group about how the project went.
13
2 | Preliminary Studies
This chapter will present the preliminary studies the group did at the start of the project.
This includes assumptions the group had to do at the start of the project, limitations set
by various items and a closer look at all the decisions the group had to do before starting
the development of the product.
2.1
Development Methodology
This section will discuss the development methodologies researched by the group, and
present the arguments for the methodology chosen.
2.1.1
Waterfall
Waterfall, often regarded the most traditional and a broadly used methodology, is a sequential process model that can be described as a flowing downwards stream, like a waterfall.
The phases
The waterfall model includes seven phases which should always follow each other in the
right order. Each phase is a separate part of the development process, and every part of
the phase should be finished before starting on a new phase. The phases are arranged
in such a way that following phases in the waterfall shape should not be conflicting or in
any way change the preliminary phases. This ensures that the process always build on
decisions made, and that the project plan does not change. Developers and customers
therefore have to make decisions and agree upon all requirements and all project parts,
and there us usually a reviewing between each phase to make sure the customer is satisfied.
If the requirements change throughout the project this often means a lot of work has to be
redone, and much of the work done so far is often left useless. The main steps of waterfall
can be found in this list:
1. Requirement specification, defining requirements and use cases
2. Design specification, choice of architecture and tools
3. Construction, implementing the software
14
CHAPTER 2. PRELIMINARY STUDIES
4. Integration, integrating the system to use
5. Testing and debugging
6. Installation
7. Maintenance
The main reason for using the waterfall methodology is because it supports spending
time on necessary planning and organizing the project before starting to code. This is
especially important in some development areas like software security, but also for educational purposes since group projects tend to get messy without a clear structure. Another
important advantage to this methodology is that the development team is not required to
have close contact with the customer at all phases of the development since the requirements and plan should be agreed upon before the implementation phase starts. This is a
very important benefit to keep in mind in projects where the development team and the
customer are not able to meet often.
2.1.2
SCRUM
Scrum is a well known methodology following the principles of agile development. It follows
an empirical approach - adapting to change instead of following a strict plan - to reach the
final goal that is delivering a working, high quality, end product. The methodology has
several laid out rules, but most teams uses a scrum like approach to making some plans as
to how they want the development process to work, and then reevaluating the plan after
each sprint. This section describes the Scrum methodology.
Sprints
A sprint is a work period with a defined start, end and goal. Usually a sprint can be from
one to five weeks long, and contains several tasks that should be done at the end of the
sprint. The sprint, with its end and goal, is defined by the project owner in the start of
the sprint. During the sprint the team will use certain artifacts to support their workflow,
and regular meetings are important to keep track of who is doing what.
The roles
In Scrum, the team members are often assigned a role that defines some responsibility
and some required activities. The Scrum master is the person in the group responsible
for ensuring that the Scrum process is used as intended. The Scrum master facilitates the
Scrum, removing all obstacles so that the development team can focus on completing their
goals. The main goal of a scrum master is to highlight productivity, and that includes
making sure every team member is working in a good environment, is satisfied with the
job situation, and is aware of which assignment to work on and how. The Scrum master
15
CHAPTER 2. PRELIMINARY STUDIES
often uses team meetings and the sprint retrospective efficiently to increase the amount of
work completed.
In a Scrum environment the project owner has the most demanding role. It is the
responsibility of the project owner to outline requirements, update the backlog, define
sprints, and give directions to the development team. For these tasks, the project owner
must keep the stakeholders in mind, and evaluate the abilities of the team members. The
project owner holds the responsibility for the finished product - if the project goals is not
completed in time, or the development team is unsure about how to embrace a problem, it
is the project owner’s fault. The project owner is usually the one to present the completed
product to the customer.
The development team consists of every team member that is not a scrum master or
project owner. In Scrum, each team member is responsible for knowing which assignments
needs to be done, and to inform other members of how the work process is going. In Scrum,
a project leader or manager is not used, but the team as a whole acts as a leader instead.
Every necessary discussion or decision to be made should be done by the group as a whole.
The artifacts
The most important artifact in a Scrum environment is the backlog. The backlog is a
detailed document that defines the requirements and functionality of the product. In
every sprint, the project owner chooses some of the entries in the backlog to focus on.
The project owner adds, removes or edits entries in the backlog, and may also prioritize
important requirements if needed. The development team can, if needed, discuss some of
the entries with the project owner to make them change their mind, but the owner is the
only one allowed to make changes to the backlog. The backlog entries are often written as
user stories, describing which stakeholder needs what for which reason.
On the start of every sprint some of the entries in the backlog are chosen as a focus.
These requirements are put up on the scrum board, and are divided or given more detail.
The goal of the sprint is to complete these assignments.
A Scrum board is an important tool to make sure every assignment in the sprint log is
completed in time. When the Scrum team is working in the same area, the scrum board
is often a physical blackboard with post-it notes containing written assignments from the
sprint log. The blackboard is often divided in several sections, like “to do”, “working”,
“testing”, “QA”, “done”. When a developer starts working on one of the assignments, he
moves the post-it to the “working” section. This way the rest of the team knows that this
assignment is already being completed. When all post-it are moved all the way to the
“done” section, the sprint goal is reached.
For Scrum teams not working in the same area, one has to use a software tool representing the Scrum board and the post-its.
16
CHAPTER 2. PRELIMINARY STUDIES
Figure 2.1: A scrum board example
Meetings
Every day usually starts with a stand-up meeting where every team member stands up
in front of everyone and answers the following: What did you do yesterday? What are
you going to do today? Is there anything keeping you from completing your work today?
After the stand-up the team members can discuss the work being done, and if someone
has something keeping them from completing the work the team may need to restructure
or reassign some of the work.
Each sprint starts with a sprint start meeting where all team members discuss the sprint,
and are informed about the goals for the sprint, look at the backlog and plan the sprint
log. During this meeting all necessary discussions regarding the assignments and their
completion should be held. In the end of the sprint the team present the completed work
to the project owner in a sprint end meeting, discuss what is missing on the scrum board
and the completed work. The new sprint is always planned after a sprint is completed,
allowing the team to decide a focus for the sprint depending on what is important at that
point. This agile approach to planning the project greatly improves flexibility and the
ability to handle change, and allows the team to change directions in the implementation
if requirements change.
The retrospective is often regarded as the most important meeting in the sprint, and
is held after the sprint end meeting. The Scrum master and the development team here
discuss how the sprint process was, what they did right, what they did wrong, and problems
17
CHAPTER 2. PRELIMINARY STUDIES
that arose during the sprint. The retrospective may be completed in several ways, but
a method often used is every team member taking a couple of minutes to think about
the sprint, and then writes comments on both bad and good stuff that happened in the
sprint. The Scrum master then reads every comment, and the team discuss the point. The
Scrum master often use the results of the retrospective to enhance the working process and
evaluate how well the team works.
2.1.3
Choosing a Development Methodology
When the team was discussing what methodology to follow, it became clear that we wanted
to use an agile approach. The focus on dividing the work into small tasks, and then
completing them as easy as possible seemed like a good idea for completing this big project
in the assigned time. The customer for our project let us choose freely, but strongly
suggested we follow the Scrum methodology. Every team member had some knowledge
about Scrum from earlier courses, and because everyone is interested in using modern
technology and approaches, the choice was easy. The only downside of choosing to work
by Scrum in this project, is that while the Scrum methodology focuses on finishing a
high quality product quick and easy, the course wants us to document and plan the whole
development process. We will manage this by choosing a Scrum like approach; using scrum
to organize the team, using the roles and meetings in scrum, using all the artifacts, and
then having two scrum boards, one for the project and then another one for the report.
In this way we will keep an agile approach to both the implementation and code, but
also to the report and other written material. Further, to allow several team members to
investigate and learn more about different sides of the Scrum process, we chose to rotate
the role of Scrum master. The contact person for the customer of this project is also a
certified Scrum project owner, so inviting him to be the project owner on this project
allows the team to work close to the customer in every stage of the project.
2.2
Assumptions
Assumptions to the development process:
• The work-break down of estimated task and activities will allow to deliver the milestones in time.
• The customer will provide the necessary information about the system and the current log reading process.
• The customer will initially use the given solution in Windows platform.
• The customer will agree on update their current java version to 8.0+.
• The group will deliver a working solution by the end of the semester.
18
CHAPTER 2. PRELIMINARY STUDIES
• The customer won’t change the scope of the project once defined.
• All decisions will be agree in the group meetings.
• Each group member will dedicate as many hours as possible to complete the tasks
or deliverables.
Assumptions to the program:
• The graphical presentation of the log can be done in any way we want.
• What tools we use don’t matter as long as its easy to install the program in the end
• The customer will give feedback depending on what progress we make to the program
2.3
Limitations
• Current system used by the customer:
– The existing system is time consuming and not very effective
– The error search is done manually
– The log files contain a large amount of data which is difficult to map.
– The current process is difficult to execute even for experience analyst.
• Project limitations:
– Short delivery time of the final solution.
– Limited resources to code and write the report.
– Different levels of tools and programming languages knowledge
– Different schedules does not allow the team to work together more than one day
per week.
2.4
Existing Solutions
This section will describe and evaluate all the possibles and existing solutions that are
currently available, and will also picture the customer’s wanted solution.
19
CHAPTER 2. PRELIMINARY STUDIES
2.4.1
Current Solution
Every time a problem or a fault occurs, Autronica’s clients send for analysis one text file
with all the log events and two XML files, one containing only the faults and other with
descriptions of all the fault reasons.
In order for our customer to know and track issues, they currently use a Pearl script to
merge the two XML files into the log file to have all the data together. This modified log
file is then open using a text editor to manually search and analyze events.
They also have a Pearl script that extracts log entries based on certain criteria, these
criteria are modified each time to match what they are looking for. Unfortunately the
output of this script is also a text file that has to be reviewed manually making this task
tedious, slow and complicated for anyone even if they are familiar with the files as they
could contain more than 20.000 different events.
At the end of the day, they spend a lot of man-hours trying to answer what, why, how
and when an event fault occurred.
2.4.2
Wanted Solution
The customer wanted a graphical representation of the log files, preferably merged together
with the XML files. The program was to be easy to install, learn and use, and should
increase the efficiency of analyzing the log files by around 50%. They had no requirements
regarding what platform was used or how this graphical representation was going to look
like, as long as the above requirements were meet and that all the information in the logand XML-files were represented in the program. They also wanted a way to filter on events
to only show events relevant to the filters applied.
2.4.3
Possible Solution
. The proposed solution consist in three main views: a linegraph which will show a general
glimpse of all the events in the log file against time, a bargraph displaying all the events
happening in the same date in color-coded bars and finally, an expandable tree-list showing
all events with more detailed information such as unit and entry type. The main goal of
this views is display graphically all the necessary and relevant data in one place in order
to avoid opening different files to look for definitions. For all of these views there should
be possible to apply filters to remove the unwanted events to help the analysis process.
As this will be a tailored solution, the final product will have the ability to parse the
three different files provided by the customer: One text file with all the log entries, and
two XML files with descriptive information about the faults, units and event codes of the
log entries.
20
CHAPTER 2. PRELIMINARY STUDIES
2.4.4
Existing Solutions
Log Parser 2.2
"Log Parser 2.2 is a powerful, versatile tool that provides universal query access to textbased data such as log files, XML files and CSV files, as well as key data sources on the
Windows operating system such as the Event Log, the Registry, the file system, and Active
Directory. You tell Log Parser what information you need and how you want it processed.
The results of your query can be custom-formatted in text based output, or they can be
persisted to more specialty targets like SQL, SYSLOG, or a chart." [5]
Usability This tool supports the type of files that the customer uses and allows to run
SQL queries on the data files, however, the command line interface makes it harder to read,
the charts are only available after exporting the results of the queries, and the user must
have basic knowledge of SQL syntax and for a more graphical experience the user must
install another tool on top of it.
Conclusion While this tools might help the customer to some extent to query the files,
it will not help with visualisation of the log. As this is what the customer wants the most
this tool will not help. It might however give some ideas on how the log files should be
read, and give some help displaying the information in the logs more easily.
21
CHAPTER 2. PRELIMINARY STUDIES
Figure 2.2: Log Parser 2.2 Preview
Other solutions
There is many other partial solutions to what the customer wants, but since the log files
provided by the customer to Autronica is one of a kind, and they want to combine these
with one of a kind XML files there are not finished custom solutions.
Overall Conclusion
While some of the solutions that exists solves some of the problems the customer have, they
are not good enough to solve all of them. This is mainly because they want to combine
three different files into a graphical UI, and show this as something else than just a new
text file. Therefore the group found it easier to just make a whole custom solution to
the problem. This makes it easier for the group to know what they are working with,
and gives much more flexibility to the final results. This also means that there is little
non competition for the program the group are going to make, and that the solution the
customer gets at the end of the project is the only solution in existence that can solve the
problem they got.
22
3 | Requirement Specifications
This chapter will take a closer look at the requirements for the project. The requirements
was specified together with the customer, and formed the contract between the developers
and the customer. To start with this chapter will look at use-cases and user-stories gathered
from the stakeholders, followed by a requirements analysis and the making of the Scrum
backlog.
3.1
Use-cases and User-stories
This section describes user stories and use cases gathered from the different stakeholders
during meetings, interviews and discussions. This gives an alternative representation for
the functionality wanted for the program. These scenarios are to simplify the requirements to make sure the developers and stakeholders have the same understanding of the
requirements.
3.1.1
User stories
User stories describe what the different stakeholders want, and give the basis for the architecture and general program functionality. The group have gathered the following user
stories for the system given in table 3.1
No. User Story
As a user I want a software capable of
1
load files so I can use it in my everyday
work
As a user I want a software where I can
2
load only the txt file so I can review
only the events
As a user I want a software with a
3
graphical interface so I can easily identify events
23
Acceptance criteria
Software must be able to process tailored txt
and xml files
Software must not have file dependencies and
must allow to load only the Log File.
Software must have different views for the
user to get different details of information
from the log files.
CHAPTER 3. REQUIREMENT SPECIFICATIONS
4
5
6
7
8
9
10
11
12
13
14
As a user I want a software with a
graphical interface showing events and
time within a Line chart
As a user I want a software showing
different events in the same period of
time within a Bar chart
As a user I want a software with a
graphical interface showing detailed information of all the nodes available in
the text file
As a user I want to create notes to
nodes so I can add meaningful information to each one.
As a user I want to mark nodes as important so I can review them in a later
time
As a user I want a section in the screen
showing the nodes marked as important so I can go back to them easily
As a user I want all the events order by
EventID so I can easily read through
the graphs
As a user I want a colour coding in the
bar chart views so I can easily identify
different events
As a user I want to see a list of all
the possible filters in an understandable
language for inexperienced users.
As a user I want to apply filters in the
views so I can filter on relevant information
As a user I want to remove the applied
filters in the views so I can reset the
graphs to the original representation.
15
As a user I want to zoom views to get
more detailed information
16
As a user I want to have the same
zoomed area across views so I get the
same events in all views
24
Software must have a Line Chart view showing the events ordered by event ID
Software must have a Bar Chart view showing the events in the log file sorted by event
ID.
Software must have a Tree View listing all
the available nodes in the Log File order by
EventID.
Software must have a textarea to write and
save notes in each node, software must display the note when the node is expanded.
Software must have an indicator in each node
for the user to mark as “Important”
Software must have a Node panel showing
only the nodes marked as important.
Software must always sort by EvenID across
all the graphs
Software must show the different event types
in the bar chart in different colours
Software must display the different filters
in an understandable language for inexperienced users.
Software must allow to have several filters in
a single tab without affecting the remaining
tabs
Software must allow to remove the applied
filter by double clicking on the name of the
filter.
Software must allow to select an initial and
ending zooming point and re-draw the graph
adjusting the axis
Software must maintain the selected initial
and ending zooming point across all the
graphs once it is applied in one of the views
CHAPTER 3. REQUIREMENT SPECIFICATIONS
17
18
19
20
21
22
As a user I want to apply filters to
zoomed graphs so I can get different
data representations with the same detail.
As a user I want to add new tabs so I
can have more than one work area.
As a user I want to close tabs so I remove unneeded workspaces.
As a user I want to save the current
state of the views so I can a backup in
case of a failure
As a user I want to search for specifics
properties so I can get nodes only
matching the specified requirements.
As a user I want a standalone program I
can launch without additional software
Software must allow to apply filters in the
views even with the zoom applied
Software must allow to create new tabs that
represent the log file.
Software must allow to close tabs, keeping
always only one.
Software must have the option of save filters,
applied zoom, nodes and tabs all together in
a text file for later loading
Software must have a search functionality
and apply filters matching the criteria
Software must be packed and deliver as an
executable file containing all the necessary
files to run
Table 3.1: User Stories for end-users
Comments
These user stories gives us a look at what the end-users wants from the program. Most of
these stories will later in this chapter be refined into requirements for the backlog in section
3.3.2. These stories will also in chapter 8 be used to make part of the architecture, and can
therefore have a major impact on how the program is structured and developed. Section
3.1.2 will cover the use-cases, compared to user stories these provide a more structured
description of events that happens in the program.
3.1.2
Use-cases
This section looks at use-cases and will help the developers and testers to do their work.
Use-cases will take a closer look at how different event should function in the program.
Both use-cases from the users and to systems perspective will be looked at. Tables 3.2 and
3.3 will describe the different actors, followed by the use-cases themselves.
25
CHAPTER 3. REQUIREMENT SPECIFICATIONS
Actor ID
Description
Example
of action
A1 User
Wants to analyze a log file, and is the main user of the system
Has a full graphical interface, to help analyzing log files which is
selected by the user. After opening the log files, the user can filter
and search on events. The modes the user can choose between is
a different graphical interfaces which will have different views for
showing relevant events.
Table 3.2: Actor A1 - User
Actor ID
Description
Example
of action
A2 System
Behind the scene system, helping the user with inputs provided
The actual backbone, handling reading and parsing of files provided
by user. The system loads events and sort them based on the users
input, filters or search.
Table 3.3: Actor A2 - System
Once the actors are defined lets look at the use-cases themselves. The use-cases for the
users will be in tables 3.4, 3.5, 3.6, 3.7 and 3.8. And the use-cases for the system are in
tables 3.9 and 3.10
26
CHAPTER 3. REQUIREMENT SPECIFICATIONS
Use-case Name
Actors Related
Trigger
Normal event flow
Variations in the event
flow
Open Files
User, System
Files chosen in file browser
1. User chooses what type of file he/she wants to open
2. User needs to select file from the file browser.
3. The user clicks a button for execution/opening files
4. The files are passed to the actor System, which needs to read
and verify the files
2a. File browser fails to open.
2a1. The user needs to try opening file browser again. Start at
point 2
3a. Not all files chosen
3a1. User is notified all files needs to be chosen before proceeding.
Start at point 1
4a. The user have chosen the wrong file types, so the files can’t be
verified by the system.
4a1. The system notify user of the error and asks user to select
correct format.
4a2. Use case start at point 1.
Table 3.4: Use-case - Open files
Use-case Name
Actors Related
Trigger
Pre-condition
Normal event flow
Variations in the event
flow
Search Event
User, System
User typed in search box and hit enter/submit button
Files are opened and parsed by system
1. User inputs what he/she would like to search for
2. Search string is submitted to the system.
3. System returns relevant events matching users criteria
3a. Search string don’t match any events
3a1. Notify user of empty result
3a2. Ask/Show user link to how to use the systems search syntax
3a3. Start at point 1
Table 3.5: Use-case - Search event
27
CHAPTER 3. REQUIREMENT SPECIFICATIONS
Use-case Name
Actors Related
Trigger
Pre-conditions
Normal event flow
Variations in the event
flow
Save Event
User
Save button clicked on event
Event selected, and full info is showing
1. User is looking at full info about a picked event
2. Save/Remember button is clicked
3. Event shows up in save state box in sidebar
2a. Event is already saved
2a1. Notify user of incident stop saving
Table 3.6: Use-case - Save event
Use-case Name
Actors Related
Trigger
Normal event flow
Choose Mode
User
Mode button clicked
1. Choose a mode or open a new tab
2. Mode change trigger an update for GUI and view
Table 3.7: Use-case - Choose mode
Use-case Name
Actors Related
Trigger
Pre-condition
Normal event flow
Variations in the event
flow
Set Filter
User, System
Filter selected
Filter is selected
1. Filter selected
2. User submits change
3. Filters are sent to the system for processing
4. System retrieves relevant events based on filter
5. View updated
2a. No filters selected
2a1. Nothing happens
3a. No matching events for filter
3a1. The system retrieves an empty set
3a2. Notifies user
Table 3.8: Use-case - Set filter
28
CHAPTER 3. REQUIREMENT SPECIFICATIONS
Use-case Name
Actors Related
Trigger
Pre-condition
Normal event flow
Variations in the event
flow
Load event
System
User trigger open file
File is opened, read and parsed
1. File opened by user
2. System reads file
3. Files are parsed
4. Log entries put into objects of events
5.Optional: Events saved to file for faster access
2a. Wrong file format or extension
2a1. System can’t read files
2a2. Notify user
2a3. Cancel flow
3a. Overflow error - not able to read all events
3a1. Start writing events to file, and free the memory as events get
written
Table 3.9: Use-case - Load event
Use-case Name
Actors Related
Trigger
Pre-condition
Normal event flow
Variations in the event
flow
Sort event
System
Events loaded
File is opened and parsed successfully, and events loaded into system/written file
1.Read events from file/system memory
2.Sort on a given attribute
3. Send result to user to be shown in the View
2a.No events found or loaded
2a1. Notify user
2a2. Cancel operation
3a. Sort attribute not set
3a1.Use standard sorting attribute, which is time
3a2. Continue steps
Table 3.10: Use-case - Sort event
29
CHAPTER 3. REQUIREMENT SPECIFICATIONS
Comments:
The use-cases will play a major role in deciding how to program shall look like and be
developed. Section 3.2 will look at how these user-stories and use-cases are used to make
system requirements and eventually the Scrum backlog.
3.2
Requirements analysis
This section will describe how the group use the data gathered to make requirements,
followed by an analysis of the major requirements in section 3.2.2. The conclusions reached
here will later be used to make tests and play a major role in the design of the architecture.
3.2.1
Requirements gathering
The group had several meetings with the stakeholders to gather all the user-stories, usecases and other requirements. The group then had a meeting where the program and
requirements where discussed and the different types of solution were made. This lead to
the making of the Scrum backlog.
3.2.2
Analysis
The gathered requirements gives the group enough information to proceed in the development process and can start to work on the goal of sprint 1. The architecture should also
be possible to make and the scrum backlog should include all the major requirements so
far. If for some reason some requirements are missing this will not be a problem as Scrum
is used for development and new requirements can be added as needed later.
3.3
Scrum Backlog
This section describes how the scrum backlog was made, followed by the backlog itself.
3.3.1
Making of
Using Google Drive the group started to add all the different requirements that was gathered, then later in the first week of sprint 1 other requirements were added as they came
up or the group saw that they where missing. This lead to the Scrum backlog being done
around the end of the first week of Sprint 1.
30
CHAPTER 3. REQUIREMENT SPECIFICATIONS
3.3.2
ID
1
2
3
4
5
6
7
8
9
Product Backlog
As
a/an
I want to...
So that...
User
Run the program
without being dependant on additional
software
The software becomes portable and
easy to use
User
Load in files to the
system and extract all
of its information
User
Get
a
graphical
overview of the events
in the log file
User
Have different graphical overviews of the
extracted events
User
See what units and
faults are registered
on a given event
User
Filter out events from
the view
User
See events in a certain
timeframe, by inserting a time frame
User
See events for a specific unit by search
User
I want the analyzing
tool to be intuitive
and well presented
Notes
I can get an
overview of all the
events registered in
the files
It’s easier for me
to see exactly what
have happened and
extract as much information as possible in the least
amount of time
I can get a better overview of the
events registered in
the log file.
I’ll get a better understanding of a log
entry if an error
took place
High
Done
Required Done
Done
Medium
Done
High
Done
High
Done
see
of
High
Done
see
of
High
Done
I can work more efficiently
31
Important
with prototyping
before implementing
Status
High
I can only see
events that is of
interest to me
I can only
events that is
interest to me
I can only
events that is
interest to me
Should
be
run
in
both
Windows
and Linux
Make
parsers for
all
three
files
Priority
As much
filtering
should be
prioritized
Medium
CHAPTER 3. REQUIREMENT SPECIFICATIONS
10
11
12
13
14
User
Save the current state
that I’m in
I can easily go back
to the point I were
User
Extract a single event
to keep for later use
I can look at it
later and compare
to others that are of
interest to me
User
Load an already saved
state into the system
and keep track of all
changes and files used
I can quickly get
back to where I
stopped
Should
be put in
a
place
where it’s
easy to see
selected
events
User
Use a functional program that does as
intended and doesn’t
leave out any information from the loaded
files
I feel secure about
the system and are
able to use it without being worried
wrong conclusions
will be made
Do a lot
of testing,
especially
parsers
making
sure whole
files
are
read into
the
system.
User
See different aspects of
the log file at the same
time
I can work more
efficiently,
and
doesn’t need to go
back from a view I
see as important
Add
port
tabs
supfor
Low
Done
Low
Done
Low
Done
High
Done
Medium
Done
Comments:
The backlog is divided into three parts, general requirements, UI requirements and Backbone requirements. The backlog will be used to make the different sprint logs and at the
end of all the sprints, the plan is that all the requirements are fulfilled. To achieve this
the development team will need good planning and structure of their work. Chapter 4 will
look closer at these plans and how the group will be able to deliver what the scrum backlog
promises.
32
CHAPTER 3. REQUIREMENT SPECIFICATIONS
3.3.3
Req
FR 1
FR 2
FR 2a
FR 2b
FR 2c
FR 2d
FR 2e
FR 2f
FR 2g
FR 3
FR 3a
FR 3b
FR 3c
FR 3d
FR 3e
FR 4
FR 4a
FR 4b
FR 4c
FR 4d
FR 4e
FR 4f
FR 4g
FR 5
FR 6
FR 7
FR 8
FR 8a
FR 9
FR 9a
FR 9b
FR 9c
FR 9d
FR 9e
FR 9f
FR 10
FR 11
Tasks and estimated effort
Description
Make program skeleton and structure
Make parsers
Make parser for unit file
Make parser for fault file
Make parser for log file
Fixing minor faults in all parsers
Add support for more events
Combine nodes
Bug fixing and print info
Filtering
Add TimeFilter
Add Method Filter
Add UnitFilter
Add tab for each filter added
View for adding filters
Develop GUI
Prototyping and Design
Implement proposed design
Improve implemented design
Improve further after user test
LineChart
NodeView
Update NodeView to list
Add support for saving state
Support tabbing with multiple views
Masterlist
Make program loader
Add new functionality
Testing
Test writing
Usability test
User test
User test for new functionality
Further testing
JUnit test code
Transition between views
Zoom in views
33
Hours
Sprint Estimated Actual
1
15
12
2
2
2
3
3
3
4
3
4
4
4
4
4
15
15
18
5
10
25
3
12
10
10
10
2
20
9
18
27
5
8
20
9
9.5
10
3
10
2
12
1
2
3
4
4
3
4
4
4
3
2
3
2
2
3
4
4
4
4
4
3
19
29
15
25
20
8
20
40
10
5
10
12
20
32
9
36
33,5
4
42
31
5
6
6
9
24
12
14
14
20
20
25
20
8
12
10
5
31
37
15
16
|
CHAPTER 3. REQUIREMENT SPECIFICATIONS
FR 11a
FR 12
Zoom by adding filter
Important events sidebar
Total
4
4
Table 3.12: Tasks and estimated effort
34
20
10
562
6
19
547
4 | Planning
This chapter looks at the project plan made by the development team for the whole project.
It look at work hours, roles, templates and other decisions taken to make sure the project
would be a success.
4.1
Project Plan
This section looks at the plans specific to the project. What were the planned project
results, the planned workhours and the plan for the scrum sprints.
4.1.1
Planned project results
This is the project result measurments the customer wanted at the start of the project.
The plan for the project will be based around these and if not the requirements change a
lot this is how success is messured at the end of the project.
• Improve the time it takes to analyze a logfile by 50%. Currently it take from 5-8
hours to analyze a logfile.
• Make it easier to analyze the log files. It should no longer be necessary to know
programming to be able to analyze the log files.
• A user-friendly program that can be used by new and experienced log analysers. It
shoudl be easy to learn for new users. This is important as Autronica want to expand
the analyser team from two to six users with varying knowledge of the current log
files.
4.1.2
Planned Project Workload
The planned workload is that each person on the development team should work 25 hours
a week. This summarize to around 350 hours each person during the whole project or
around 2500 workhours total. These workhours are to be spent equally over all the scrum
sprints in the project, which gives around 525 hours for each sprint. For a more detailed
workload estimate see table 4.2
35
CHAPTER 4. PLANNING
4.1.3
Project Phases
The plan is to divide the project into five phases. The first phase lasts from week 35 to
36 and consisted of getting organized, starting the pre-planning and understanding the
project. Phase 2-4 are scrum sprints discussed in detail in chapter 10, 11, 12 and 13. The
last phase was finalizing the report and preparing the presentation.
4.1.4
Milestones
Milestones are in the context of this project considered goals or end points that marks the
end and completion of a project phase or a high priority work packet. The group considers
deadlines and the end of sprints milestones. Table 4.1 gives an overview of what milestones
we expect for the project.
Milestone
Planning phase
Sprint 1 done
Sprint 2 done
Sprint 3 done
Sprint 4 done
Report and System completed
Report Delivered
End date
01.09.2014
15.09.2014
06.10.2014
27.10.2014
17.11.2014
19.11.2014
19.11.2014
Time Available
175
525 hours
525 hours
525 hours
525 hours
2 days after Sprint 4 is complete
2 days after Spintt 4 is complete
Table 4.1: Milestones
4.1.5
Project Workload
It is important to have a work breakdown table for the project. These will go into detail
about how the group distribute the workload during each sprint. Table 4.2 goes into detail
how the work was broken down for each sprint. This was not done in the start of the
project, this table summarizes the workbreakdown for each sprint and makes a comparison
of the actual workhours used.
Task
Pre-Planning
Management
Sprint 1
Planning
Meetings/Lectures
Pre-Study
Retrospective
Sprint 2
From
28/08/2014
28/08/2014
01/09/2014
01/09/2014
02/09/2014
02/09/2014
22/09/2014
22/09/2014
36
To
01/09/2014
20/11/2014
19/09/2014
01/09/2014
19/09/2014
19/09/2014
22/09/2014
10/10/2014
Expected
15
200
313
10
250
50
3
343
Actual
12
58
261
14
205
52
14
218
CHAPTER 4. PLANNING
Planning
Pre-Study
Meetings/Lectures
Implementation
QA
Testing
Retrospective
Sprint 3
Planning
Pre-Study
Meetings/Lectures
Implementation
Testing
QA
Retrospective
Sprint 4
Planning
Pre-Study
Meetings/Lectures
Implementation
QA
Testing
Report/Presentation
Report
Presentation
Total
22/09/2014
22/09/2014
22/09/2014
23/09/2014
23/09/2014
23/09/2014
13/10/2014
13/10/2014
13/10/2014
14/10/2014
14/10/2014
14/10/2014
23/10/2014
23/10/2014
03/11/2014
03/11/2014
03/11/2014
04/11/2014
04/11/2014
04/11/2014
04/11/2014
03/11/2014
01/09/2014
01/09/2014
17/11/2014
28/08/2014
22/09/2014
10/10/2014
10/10/2014
10/10/2014
10/10/2014
10/10/2014
13/10/2014
31/10/2014
13/10/2014
31/10/2014
31/10/2014
31/10/2014
30/10/2014
30/10/2014
03/11/2014
20/11/2014
03/11/2014
20/11/2014
20/11/2014
20/11/2014
20/11/2014
14/11/2014
20/11/2014
17/11/2014
20/11/2014
20/11/2014
10
10
100
200
10
10
3
723
10
10
100
500
50
50
3
520
10
50
100
300
10
50
290
250
40
2404
14
28,5
154
217
6,5
8
14
240,5
14
13
64,5
420
12
25
14
353
14
29
52
213
6
48
203
365
82
2143,5
Table 4.2: Work Breakdown table with actual work hours
4.1.6
Gantt Diagram
The Gantt diagram describes the expected dedicated time for each tasks. This will give
a graphical representation of the work breakdown structure and there is one diagram for
the estimatted hours and one for the actual used hours. Figure 4.1 on page 38 shows the
estimated Gantt diagram and figure 4.2 on page 38 shows the actual workhours Gantt
diagram.
37
CHAPTER 4. PLANNING
Figure 4.1: Initial Gantt Diagram
Figure 4.2: Final Gantt Diagram
4.2
Project Organization
This section contains an overview of how the group organized the project roles, meetings
and workdays.
38
CHAPTER 4. PLANNING
4.2.1
Meeting Times
Due to other courses and lecture the group wants two weekly group meetings, as well as a
weekly meeting with our advisor. There should also be meetings with the customer when
needed, with a minimum of one meeting each sprint. Even though the group wanted more
meetings that this and that Scrum meetings should be held each day, this is what the group
ahd time for and the planning is done with this in mind. Table 4.3 gives an overview of
the normal meetings that are planned.
Meeting Day
Monday 13.15
Monday 16.15
Thursday 08.00
Who are meeting
The group
The group and Assistant
The group
End of sprints
The group and customer
What is the meeting about
Scrum meeting
Status update
Scrum meeting, discussions and working
Sprint end meeting
Table 4.3: Meetings
4.2.2
Project Roles
The group divided the total responsibility equally into roles. Table 4.4 presents the roles
and what their responsibilities are. The role of scrum master was changed each sprint, this
was due to the group wanting to get more experience with scrum.
39
CHAPTER 4. PLANNING
Role
Scrum Master
Name
Sprint 1: Alma
GUI-Designer
Sprint 2: Christopher
Sprint 3: Juul
Sprint 4: Jonas
Christopher
System Architect
Document responsible
Rune
Jonas Hildershavn
Test Leader
QA responsible
Implementation Coordinator
Email-Master
RoomMaster
Social Master
Scrum Board Master
Alma
Juul
Jonas Kirkemyr
Rune
Tonje
Tonje
Juul
Responsibility
Organize Meetings and Status Report and
ensure proper use of Scrum
Responsible for creating a good design for the
system
Ensures a good architecture
Ensures a high quality report and good documentation
Plan the test phase and executes the testing
Ensures a high quality overall product
Coordinates the implementation
Resposible for e-mail communication
Books Rooms
Makes sure we’re all friends
Makes sure everything on the board is correct.
Table 4.4: Responsibility Areas
4.2.3
Meeting Templates
To keep the meetings and reports organized the group made templates that were goind to
be used at each meeting. There was templates for all the events in the list below.
• Weekly Assistant Report
• Assistant Meeting Minutes
• Group Meeting Minutes
• Customer Meeting Minutes
4.2.4
Documentation of Project Work
Scrum meetings
The two scrum meetings each week will be use to make a progress report from the group
and to make sure everything is on track. Meeting minutes will be made for each of the
meetings to document the progress of the whole project.
40
CHAPTER 4. PLANNING
Internal Report
An internal report should be sent to the scrummaster each Thursday before 16:00. This
report should contain the work hours for the the past week. What did you work on, how
much time did you work on it and how much time were you supposed to work on it.
Weekly Status Report
The internal reports will be used by the scrummaster to make a weekly report that will
be sent to the project assistant before Friday at 12:00 . This report should contain the
summarized work hours for the team the past week and a progress report describing what
was done and what was supposed to be done. This should also include an updated version
of the project report.
41
5 | Quality Assurance and Risk Assessment
For the program to be usable after the end of the project, all its contents, including the
report and documentation, should hold a high standard. This chapter will discuss how we
ensure we reach our goal of a top quality, usable program by the end of the project, and a
presentation of what threats the group may encounter during the project.
5.1
Quality assurance
To ensure a high quality end product, the group has decided on several tactics that should
be used. This section will include a detail on these tactics, along with why they ensure
good quality and why we chose these approaches.
5.1.1
Tactics for quality assurance
The group has defined tactics for quality assurance. During the project, all material
produced should go trough these procedures before the group is satisfied with the result.
Ensure high quality during the development process To avoid having several issues
to be solved in the end of the project, the group decided to actively do quality assurance on
work completed throughout the project. When an assignment is complete, either written
material for the report or code for the program, it should be quality checked before it
is accepted as a part of our solution. This is done by using the Scrum board. When a
group member completes an assignment, they also adds the assignment from the "Working"
section of the board to the "QA" section. Here, they assign some other group member to
review the work done. This way, when a task is moved to the "Finished" section of the
Scrum board by the reviewer, the group is certain that at least two group members are
pleased by the results.
Ensure high quality of the final product The final version of the product and the
report should have a very high standard. This is done by reviewing the finished product as
a whole and editing it if needed. The group has decided to finish the program two weeks
42
CHAPTER 5. QUALITY ASSURANCE AND RISK ASSESSMENT
before the due date and to finish the report five days before it is due. After these deadlines
the program and report should be reviewed by all group members, and revisions should be
discussed. This way, all can join in on ensuring no errors are included in the final delivery.
Tests for quality, non functional requirements and quality attributes should be written and
conducted at the end of the project to evaluate total quality.
5.1.2
Quality attributes
The quality attributes are used as measurements as to how high our quality is. The choice
of quality attributes is discussed in the requirement specifications chapter.
Usability To ensure that the goal of high usability and learnability is reached, the group
will run two iterations of usability testing and redesign. Each iteration will hopefully
provide some feedback from employees from Autronica and will be used for improving the
usability state of the program. During the development the group will also have several
meetings with the customer representative to discuss our solution, where we will welcome
opinions on design and front end functionality.
The group bases its user tests on the research of Jacob Nielsen[6], which states that the
most efficient way of usability testing is to have several iterations of user tests and system
redesign during the development process. Three to five users are recommended to get a
good idea of the user diversity.
In the end, the group will also have an acceptance test to allow the customer to comment
on the final state of the program. Feedback received during this test will be taken into
consideration and discussed in a separate part of the evaluation chapter. The group will
use the results of the acceptance test as a basis when evaluating the final usability state of
the program.
Testability The group wants to enhance testability to provide as high test coverage as
possible. Test coverage is the percentage value of the program that is tested, and we aim
for at least 85% test coverage. Tests will be written for each program unit during the
implementation phase. For a unit to be testable, it should be complete and consistent.
Ensuring high testability will be done in two stages: first when creating the architecture
and packaging, where we will make sure as much of the code as possible is separated in
individual units, and second when writing the tests. With high testability writing and
completing tests should be simple and time efficient. The testability state of the program
will be evaluated in the end of the project by comparing amount of testing with time and
resources spent.
Performance Performance is an issue for the group, as the project has some requirements regarding loading time and capacity. To ensure high performance there will be
performance testing in the end of the project. Performance tests will only be conducted
on the system as a whole, as performance on individual units are hard to evaluate.
43
CHAPTER 5. QUALITY ASSURANCE AND RISK ASSESSMENT
Modifiability For the implementation to be as simple as possible, high modifiability will
be important. Modifiability will be enhanced when creating the initial architecture, and
further it will be a focus throughout the implementation phase because it will drastically
decrease the difficulty and time spent implementing the various functionality. Modifiability
tests will be written, and will in large parts be conducted during the development phase.
To ensure high modifiability, as much as possible of the program should be written as
individual units.
5.1.3
Regular meetings
The group has chosen to schedule regular hours for meetings within the group, with the
customer and with the advisor. This is to make communication easier, which is very
important to avoid assignments being neglected.
Group meetings The group should meet at two scheduled hours ever week. Ideally we
would want to have one meeting every day, as is the usual Scrum convention, but different
schedules prevent this. These are the hours the group will meet up every week.
• Mondays 13.00 - 14.00
• Thursdays 08.00 - 12.00
Advisor meetings The group will meet with the advisor once a week to discuss progress.
The advisor will book the same room every week.
• Mondays 14.00 - 14.30
Customer meetings The group will meet with the customer at the end of each sprint.
Since our customer representative is also the project owner, this meeting will be a sprint
review meetings to discuss the progress made during the sprint, with acceptance of the
sprint and also the sprint log for the next sprint. These meetings will usually be held the
last day of a sprint if possible.
5.1.4
Meetings invites and minutes
The group will write meeting invites with an agenda before each meeting. Meeting minutes
should also be written to keep track of decisions made.
Group meeting agenda and minutes The group meeting agenda should be distributed
latest at 20.00 the night before meeting. The Scrum master is responsible for writing the
agenda, and other group members can add items they want to discuss. The agenda is
also used to create meeting minutes, which should be read by everyone not attending the
meeting. A scribe is chose at random by the Scrum master, and the scribe should be at
44
CHAPTER 5. QUALITY ASSURANCE AND RISK ASSESSMENT
least five minutes early to be able to start the meeting right on schedule. The agenda
should include the following items.
• Date
• Time
• Place
• Scribe
• Attendees (people expected to be there)
• Project update, what have everyone been doing and what are they going to work on
after the meeting
• Additional items
Advisor meeting agenda and minutes The advisor meeting agenda should be sent
together with the latest version of the report each Friday by 12.00. The agenda should be
used for defining issues that needs to be discussed on the meeting, along with questions
that needs answering. The following items should be included in the agenda
• Date
• Time
• Place
• Scribe
• Attendees (people expected to be there)
• Hours worked for the last week
• Status update on the report, what have been done the last week
• Status update on the programming, what have been done the last week
• Additional items or questions
45
CHAPTER 5. QUALITY ASSURANCE AND RISK ASSESSMENT
Customer meeting agenda and minutes Customer meeting agenda should be sent
approximately one week before the end of a sprint, and should be answered within 48
minutes. The agenda must be accepted for the meetings to be scheduled. The agenda
should include the following items
• Date
• Time
• Place
• Scribe
• Attendees (people expected to be there)
• Status update on the program, what has changed
• Status update on the project as a whole, how is the team doing
• Questions or requests
• Additional items
5.1.5
Material organization
To ease the process of finding correct files and code brackets the group decided on some
regulations of version control and folder management. All produced material should follow
these conventions.
GitHub quality assurance GitHub has a lot of built in tools to enhance quality assurance. All code and written material should be created in a separate branch, named
logically with what is being worked on. For example a branch containing the introduction
to the report should be called "introduction". When a branch is ready to be merged with
the final version, a pull request is to be set up, and an other group member assigned.
The assigned group member should then look over changes made, and make comments or
suggestions for change. If the material is acceptable, and can be run without errors, it
should be merged.
GitHub should also be used for notifying other group members of issues in the code or
the report, by using the inbuilt issue functionality. Issues should be defined and connected
to a chapter or a code bracket, and should give a good enough description of the issue
that someone can fix it. Issues could report bugs, poor language, missing material or other
issue the group needs to be aware of. Following are examples of issue for the report and
issue for the program
• Bug: Exit button in menu not working. Button onClick method not implemented.
• FaultyInformation: Milestones in planning chapter saying presentation is 20.12. Should
be 20.11
46
CHAPTER 5. QUALITY ASSURANCE AND RISK ASSESSMENT
Code standards To allow seven people working on the code together, the group needs
some guidelines. The most important ones are making clear what attributes, methods and
classes in the code does. Each class should have a top comment describing what the class
should do, who created it and on what date. An example of such a comment is included
• /* Includes all information about the event nodes, and methods to get and set this
information. Created by Rune on 01.10.2014*/
Additionally, all methods and attributes should have names that describes what information are stored here. Camel case writing should be used for both method and attribute
names. Names should be as long and descriptive as needed, and if there is any unclarity,
comments should be added.
Google Drive folder management Folders on Google Drive should be structured in
a way that allows for easy use, and all documents should be sorted by the following rules.
• Files from customer - should include all files received from the customer
• GitHub - should include documents related to GitHub use
• Meeting and status updates - should hold all meeting minutes, agendas and status
updates as well as templates for these documents
• Personal folder - should include sub folders for every group member to hold documentation that is not yet included in the final report
• Presentation files - all files related to the presentation
• Report - all files related to the report
• Usability test - all files related to usability tests
• Workshops - all files related to work
Report folder management Documents for the report should be added in the GitHub
repository FinalReport following these guidelines.
• Images - includes all figures used in the report
• Chapters - includes all chapters of the report
• Additionalfiles - includes all .pdf files added to the appendix of the report
47
CHAPTER 5. QUALITY ASSURANCE AND RISK ASSESSMENT
5.1.6
GUI guidelines
A crucial part to any computer application which will be used by people is its user interface.
Whether you are using the application casually on occasion or in a hectic work environment,
the look, feel and user friendliness of the application will have a grave impact on the user
experience. It is especially important to have sound user friendliness in the application that
is to be developed during this project. In fact, the user interface is one of the main tasks.
The problem of the project states that the log file should be presented in a graphical, user
friendly way. The GUI(Graphical User Interface) chapter in this will describe the processes
and procedures that were conducted for come up with a concept.
Guidelines and Theory
Creating and/or following previously created guidelines is often a very efficient way to
develop a user interface and helps ensuring usability. These guidelines can tackle problems
from how to structure the display to how we should analyze the user of the application.
The guidelines that are set for user interface of this application is based on the works by
Ben Shneiderman and Cathrine Plaisant[1].
The first set of guidelines that are appropriate for a user interface are guidelines for
requirement analysis. Goals for any requirements analysis for a user interface is to assert
what the users’ needs, ensure reliability, implement appropriate standards, integration,
consistency and portability as well as complete projects on schedule and within budget.
After a thorough requirement analysis, we need to develop guidelines for the interface
itself. These guidelines will be based on what is known as the golden rules of user interface
design.
Rule One
The first golden rule states that the user interface should put the user in control. This
rule stems from the notion of making a user feel in control of whatever application they
are using. When a user becomes experienced with a certain application, the user may find
it unpleasant to follow a certain work flow and would often rather use the application in
a way that is more suited to their own preferences. A set of principles are constructed to
conform to this golden rule:
• Be wary of using different modes of a user interface. One of the problems
that may arise from using modes is that functionality may differ depending on which
mode the user interface is in. This will often lead to users being confused, especially
when a user is less experienced with using the user interface. One should hence strive
to accomplish consistent functionality throughout the application.
• Allow users to choose between different input methods. A user should be
able to use the keyboard instead of the mouse. It is important to realize that users
have different use habits even though the users way of controlling an interface is
48
CHAPTER 5. QUALITY ASSURANCE AND RISK ASSESSMENT
inefficient. One should therefore strive to offer different ways for a user to interact
with the application, unless there are very compelling reasons not to.
• Allow for users to take a break from using an application.This principle has
to do with users not having to retain a lot of information to use an application. A
user may be distracted when using the application in the middle of some process.
When the user decides to continue, there should be some guidance as to what the
next appropriate step is.
• Display appropriate messages and text. When a user fails to input correct
data, an appropriate message should appear. It is important to keep in mind that it
is more important that the user fully understands this message versus the message
being descriptive and accurate. In addition, it is important to convey that blame is
not assigned to the user so that users do not blame themselves for any errors as this
will surely reduce their willingness to use the application.
• The user interface should provide feedback. The user should get some sort of
feedback if the application, for any reason, needs some time to perform a task. If the
application needs to load some large files, then a progress bar for example, will add
value to comfort and enjoyment of users. If no feedback is given, the user will often
grow impatient and may cancel and avoid the given process.
• Provide ease of navigation. Allow for users to easily navigate the interface so
that they are able to get to any part of the application with ease. Users should be
able to navigate with comfort. Difficult and large navigational systems could easily
intimidate a user.
• The user interface should be usable for users with differing skill levels. It is
important not to sacrifice usability for expert level users to accommodate for ease of
use for new users. Making expert level users go through tedious steps to perform an
action they have done many times before will greatly reduce the potential efficiency
of that user. Strive to implement one click actions as well as macros if necessary.
• Make the user interface transparent. The best user interfaces are often not
even noticeable for the user. Making a transparent user interface can give the user
the perception of accessing and modifying objects directly. It is important that the
user can focus on what task he or she wants to perform instead of trying to convert
the task into actions which the user must perform to achieve results.
Rule Two
The second golden rule of designing user interfaces is to reduce a user’s memory load. In
general, people are not very good at remembering information while using a computer. A
good user interface should therefore help the user when performing certain actions. A set
of principles are employed to conform to this rule:
49
CHAPTER 5. QUALITY ASSURANCE AND RISK ASSESSMENT
• The interface should relieve the user of short-term memory. As mentioned
earlier, users should not have to retain a lot of information to use an application.
The user should not have to remember preceding tasks to perform the next one. In
addition the user should not have to write the same information multiple times; this
is a task the program can and should do for the user.
• Rely on people recognizing instead of recalling. Strive to give users visual
assistance in form of design components such as lists, menus, combo boxes and so
on. Users will often recognize these components and know how to use them instead
of having to write into text fields with no assistance. Even if the data set is too large
and needs the user to manually input data, there should be some form of assistance,
for example, most recently used or most frequently used input.
• Provide visual clues. One of the principals of the earlier rule talked about being
wary of using different modes for the user interface. If however, one decided to
implement this, it is important that the user gets some sort of visual assistance as to
give them the impression that the user interface is in a different state. With visual
clues, we can mask the fact that the user interface behaves differently in different
modes.
• Give the user an option to save. Computers have the ability to easily store and
retrieve data. This should be taken advantage of in almost any situation. Being able
to save work can and often will be, an essential part of the application. Having to
redo all work done each time you open an application would in most cases make the
application very inefficient to use. Being able to save also gives the user confidence to
explore the user interface knowing that that he or she could always load a previous
saved state.
• Provide shortcuts. When users become familiar with the user interface they often
seek to improve their efficiency in using the program. Providing shortcuts in the
form of keyboard shortcuts and mouse operations with industry standards is often a
good way to achieve this.
• Incorporate real world objects. Using objects and interfaces that users are used
to in their everyday life in the user interface for an application will promote the
semantics of the actions. If the user is already familiar with a certain interface,
then a lot of training and learning can be spared. We see this used very often in
computer applications, even when we do not think about it. The notion of the
computer desktop, for example, stems from the desktop of an ordinary desk used
before computers become main stream.
• Provide easy access to common features. A common implementation is to hide
less frequently used functionality and highlight more frequently used functionality. It
is important not to clutter the interface with all possible actions as this may confuse
50
CHAPTER 5. QUALITY ASSURANCE AND RISK ASSESSMENT
and misdirect the user. Rather use secondary windows or hide side panels to hide
lesser used functions.
• Organize information presentation. Keeping a well defined structure for presenting data is essential for how the user obtains information. A cluttered presentation
may lead to users not being able to perceive the data as intended or even worse, draw
wrong conclusions. Chose a medium which is well suited for the data to ensure that
data is presented correctly and obtained as intended.
Rule Three
The last golden rule is making the interface consistent. Keeping the interface consistent
with current standards of user interfaces will allow pre existing knowledge to be transferred
from a previously used interface. Having a user interface which is easily understood by
a new user will greatly encourage usage. As the other golden rules, making the interface
consistent also comes with a set of principles:
• Keep the context of the user’s task. The user should always be provided with
visual clues for the current navigation, as it helps the user determine the structure
of the navigation. The user should be presented with a dynamic view to show where
the user has been and where he or she can go. Another point to this principle is
that a user should not have to switch the input method that the user used to start
performing a task. If a user initiated a task sequence using the keyboard, the user
should be able to perform the task in its entirety with the keyboard.
• Make sure results from actions are consistent. The results from an action
should be the same every time if the user performs the same action sequence. If this
principle is not followed, then the users might question their own behavior instead of
questioning the programs behavior. If for whatever reason, a difference in results of
the same action sequence is intended, then it is necessary to let the user know. The
user should be given a choice as to if he or she wants to complete this action given
that the action might produce different results than intended.
• Provide aesthetic appeal with focus on product functionality. It is important
to keep a consistent look throughout the application. The application should have a
consistent feel which includes consistency for the color scheme, fonts, icons, window
layout and so on. The integrity of the product can be greatly diminished if these
standards are not met. Even though the aesthetic appeal of the product is important,
the main focus should still be on the functionality that the product provides.
• Strive towards encouraging exploration. Making a user interface that is user
friendly will encourage users to explore your product. Some of the previous principles
have talked about the importance of not inducing fear into the user when using the
application.
51
CHAPTER 5. QUALITY ASSURANCE AND RISK ASSESSMENT
Having a set of guidelines and principles can be a good way to ensure qualities to a user
interface. It is however, important that you do not get restricted by these limitations. Some
of the principles that have been introduced may not be applicable to a specific project or
even in some cases wrong. It is therefore important to view these concepts as guidelines
and not as a standard which must be met under any circumstance. The group will try and
follow these guidelines when creating the GUI, and how we progress will be explained in
each sprint chapter.
5.2
Risk Management
Identifying the risks that could threaten the project is necessary to be able to avoid them
if they should arise. This chapter will include risks identified by the group as well as a
plan of how to manage them in table 5.1.
5.2.1
Handling risks
Risks are a natural part of life, and a natural part of projects. Avoiding all possible risks is
not achievable, and though no risks occurring would be favorable, it is not a goal for this
project. Risks are defined as the probability of an event occurring times its consequence,
with the consequences being negative. The group have identified some risks that could
occur during this project, and a strategic plan as how to handle them. We decided to plan
for risks to appear to avoid threats having destructional effects on the project as a whole.
5.2.2
Risk assessment
The value of a risk is identified as the probability P times the consequence C of a recognized
threat in a concrete situation. The group has created a risk assessment table identifying
these risks with a value of low (L), medium (M) og high (H). The total risk value will
be evaluated based on the risk values of the probability and consequence, following a
predefined risk assessment table.
Low risk Threats given a low risk value are not very likely to appear in the project,
and the project is not expected to suffer from these risks. To avoid the risks evolving into
bigger issues however, the threats should be identified and managed as soon as possible
before the deadline.
Medium risk A medium risk can be expected to appear in the project and could be
damaging for the project. These threats should be identified and resolved as soon as
possible to lower consequences.
52
CHAPTER 5. QUALITY ASSURANCE AND RISK ASSESSMENT
Figure 5.1: Risk assessment
High risk Threats with a high risk value would be very damaging to the project, and
should be avoided. These risks have a first priority to be resolved and must be handled as
soon as they arise.
R1- Short time illness: A group member suffer from short term illness, being hindered
from working on the project or attending meetings.
R2 - Long term illness: A group member suffer from long term illness, not being able
to work on the project for a while. We count illness duration of over one week being long
term.
R3 - Loss of group member: A group member quits the course and project permanently.
R4 - Toolkit and technical problems: Issues installing, using, finding or understanding the tools we use.
R5 - Interfering work: A group member having a lot of interfering work from external
sources, being hindered from working enough on the project.
R6 - Late arrival for meetings: Group members being late for meetings.
R7 - External misunderstandings: Misunderstandings between the group and the
customer or advisor.
R8 - Internal misunderstandings: Misunderstandings between group members.
R9 - Internal conflicts: Group members disagreeing.
53
CHAPTER 5. QUALITY ASSURANCE AND RISK ASSESSMENT
R10 - Lack of technical knowledge: Group members lacking technical knowledge and
experience.
R11 - Language problems: Group members not using a common known language.
R12 - Lack of motivation: Group members not being motivated to do a good job.
R13 - Lack of documentation: Inadequate amounts of documentation of work done.
R14 - Lack of testing: Not enough testing being done while implementing.
R15 - Lack of communication: Group members not communication their work and
issues.
R16 - Change of requirement specification: Requirements being changed or added
during the project.
Risk ID
Consequences
Probability
Risk factor
Strategy and actions
Deadline
Responsible
Risk ID
Consequences
Probability
Risk factor
Strategy and actions
Deadline
Responsible
Risk ID
Consequences
Probability
Risk factor
ID number
What are the consequences
What are the probabilities
What is the risk
What are the strategy for dealing with the risk
The deadline for handling the risk
Who is responsible for managing the risk
R1
M
L
L: Short term illness will usually mean a group member not being
able to work for a couple of days.
Ill group members should notify the group as soon as possible. If
the group members is not able to complete given assignments, they
should be reassigned to someone else.
One day after the group member getting ill.
The group member being ill
R2
M
M
M: Long term illness is often experienced during the fall, and could
give damaging consequences depending on how many group members getting ill and how little they are able to produce during illness
54
CHAPTER 5. QUALITY ASSURANCE AND RISK ASSESSMENT
Strategy and actions
Deadline
Responsible
Risk ID
Consequences
Probability
Risk factor
Strategy and actions
Deadline
Responsible
Risk ID
Consequences
Probability
Risk factor
Strategy and actions
Deadline
Responsible
Risk ID
Consequences
Probability
Risk factor
Strategy and actions
Deadline
Responsible
Risk ID
Consequences
Probability
Risk factor
Long term illness should be communicated to the group as soon as
possible, and the person being ill should give a regular update on
how they are feeling. Assignments should be reassigned if possible.
One day after the group member getting ill
The group member being ill
R3
H
L
M: No group member is planning on quitting the group, but the
consequences if it happens would be very damaging as the workload
on every group member would increase drastically
If someone is planning on leaving the group, this must be communicated immediately. The group should reorganize the project plan,
with the help of the customer and advisor, to fit the number of
remaining group members.
As soon as possible
Everyone
R4
L
M
L: Tool issues happens often when using new tools, but are usually
not persistent throughout the whole project
If a group members are having any issues with the tools, they should
have Juul help them, since he knows them well.
As soon as possible
The group member experiencing the issues
R5
M
H
H: Interfering work is almost bound to happen since all group members have several other courses, and could keep the group member
from completing assignments on time
Issues with the schedule and upcoming deadlines for other subjects
should be communicated to the group. Group members should
prepare to help each other out in order to complete assignments
As soon as possible
Scrum master
R6
L
H
M: Lateness will result in other group members wasting their time
waiting and create a bad mood
55
CHAPTER 5. QUALITY ASSURANCE AND RISK ASSESSMENT
Strategy and actions
Deadline
Responsible
Risk ID
Consequences
Probability
Risk factor
Strategy and actions
Deadline
Responsible
Risk ID
Consequences
Probability
Risk factor
Strategy and actions
Deadline
Responsible
Risk ID
Consequences
Probability
Risk factor
Strategy and actions
Deadline
Responsible
Risk ID
Consequences
This risk will definitely arise at several occasions, but should be
avoided. Expected lateness due to external responsibilities must
be communicated in advance. The group will only wait for late
members for five minutes after the scheduled start of the meeting
Five minutes
Scrum master
R7
H
M
H: Misunderstandings between the group and the advisor or customer could result in work not being completed in time or as expected
This risk should be avoided by communicating decisions and work
done regularly. If the risk occurs the group and customer or advisor
should meet and solve the issues together, and the group should
immediately change focus to correcting the misunderstandings.
As soon as possible
Everyone
R8
M
M
M: Misunderstandings could result in assignments not being completed, or not being completed correctly, the latter meaning time
wasted
This risk should ideally be avoided by practicing good communication. If the risk arises the issues should be discussed and solved
between the Scrum master and the relevant group member
As soon as possible
Scrum master
R9
M
M
M: Conflicts could result in using more time than expected on tasks
and a bad mood in the group
The disagreeing group members should both present their opinions
to the rest of the group, which will help them resolve the disagreement. If the group as a whole is disagreeing on a task, the majority
opinion should be elected
The first group meeting after conflict arises
Everyone
R10
H
56
CHAPTER 5. QUALITY ASSURANCE AND RISK ASSESSMENT
Probability
Risk factor
Strategy and actions
Deadline
Responsible
Risk ID
Consequences
Probability
Risk factor
Strategy and actions
Deadline
Responsible
Risk ID
Consequences
Probability
Risk factor
Strategy and actions
Deadline
Responsible
Risk ID
Consequences
Probability
Risk factor
M
H: Group members that are not experienced with programming
or other technical assignments could end up spending more time
completing assignments than planned
Technical issues should be communicated to other group members.
All group members should provide help if someone is having trouble,
and pair programming is to be used if needed. Technical tasks
should be assigned to the group member most experienced with
the particular area
As soon as possible
Everyone
R11
M
L
L: Language problems could result in group members not understanding each other or not being able to participate in writing of
documents, but is unlikely to occur
All communication, oral and written, should be conducted in English, which everyone can read and write. Problems writing technical English should be solved by assigning tasks regarding documentation and report writing to group members that feel more
comfortable doing it.
As soon as possible
Scrum master
R12
H
L
M: Low motivation could result in poor quality work done, or even
no work completed. The group’s initial motivation was very high
however.
The group should continuously communicate work done, positive
progress and mood to prevent this to be an issue. Lack of motivation should be communicated to the rest of the group, which in
return should help lift the spirit up
As soon as possible
Everyone
R13
M
M
M: Lack of documentation would require all group members to
spend large amounts of time trying to learn what have been done
by others
57
CHAPTER 5. QUALITY ASSURANCE AND RISK ASSESSMENT
Strategy and actions
Deadline
Responsible
Risk ID
Consequences
Probability
Risk factor
Strategy and actions
Deadline
Responsible
Risk ID
Consequences
Probability
Risk factor
Strategy and actions
Deadline
Responsible
Risk ID
Consequences
Probability
Risk factor
Strategy and actions
Deadline
Responsible
If lacking documentation of work done is discovered, the person
who completed the work should be notified so that they can provide
more documentation or information
As soon as possible
The person who completed the undocumented assignment
R14
H
M
H: Lack of testing could result in a lot of bugs and unfinished functionality in the end of the project, which would make the program
unusable for the customer
Unit testing should be conducted during the project, and testes
for the program as a whole should be conducted in the end of the
project. If testing is not completed for a unit or functionality, it
should be done by the test leader.
As soon as possible
Alma
R15
H
M
H: Lack of communication would result in bad group dynamics,
assignments not being completed in time and the quality of the
final product would suffer greatly
Communication issues should be handled by the group in meetings
or sprint retrospective. If someone has issues regarding communication they can either bring it up on meetings themselves, or ask
the Scrum master to do it
As soon as possible
Everyone
R16
H
M
H: Changing or adding new requirements late in the project could
result in functionality not being implemented or
Requirements added later in the project must be approved by both
the project owner and the group. New requirements should not be
added after November 11th to allow reasonable time for implementation. Requirement changes should be communicated early and
discussed in detail before they are added to the project
As soon as possible
Customer and the group
Table 5.1: Risk description table
58
6 | Test Plan
Testing is important to ensure a high quality product and to see that the program has the
desired functionality. The tests are used both by the programmers during development to
make sure the program does what they expect, but also as an ensurement for the customer
that the program performs as they have demanded. In this chapter it will be discussed how
tests were used during the project, and what tests were performed.
6.1
Functional tests
The functional requirements define the set of functions the system is expected to have. This
is what the system is supposed to do opposed to how the system does it. The functional test
is testing this behavior and that the different functions of the program works as expected.
6.1.1
Unit tests
Unit tests are used to test and verify a specific section of code. Here we try to test different
functions independent from each other, to check that every function works separately. This
is the lowest level of tests and also the ones we have decided to work the most with. To
create unit test we use the framework JUnit.
It is important in unit tests to isolate the test as much as possible. Because many
functions and classes are dependent on each other this can sometimes be difficult. The
way we solve this is to mock the objects and functions that the test depend on, so that
even though other parts of the code might not work, the unit test will still be able to run
green if the code tested works fine. In order to do this we use a library called mockito.
The team has decided that our test leader will write a skeleton for the tests to each class
we create. The developer will then have the job with implementing the given class and
keep the test up to date for the current design. The developer also has the responsibility
that their class is well tested and that their test always run with expected results. We
will create the skeleton for the tests before the class is started on as a template for how
the class should be implemented, but the tests will usually be rewritten after the class is
done to test the class more specific and more directed to the implementation. The reason
we don’t create the tests more specific before the class is created is because we don’t have
enough experience with testing to create them beforehand.
59
CHAPTER 6. TEST PLAN
The unit test will later be used to check that every time changes are done to the project
it doesn’t break old functionality, whether it is refactoring or adding new functionality. It
also makes it easier for the rest of the team to see what the different functions are supposed
to do and will make it easier for the group to work with other peoples code. Before any
code can be merged in to master, all tests have to run green.
6.1.2
Integration testing and component interface testing
Even though it is important to test for the interaction between different components, we
have chose not to focus on these kinds of tests. The program we are to create will not be
very large and good unit tests should be sufficient. As long as we now all units work by
themselves it shouldn’t be hard to connect them together.
6.1.3
System test
System test are end-to-end tests that test the whole system. This is largest scale test,
and is used to check the entire program. This will test that new functionality works as
expected, and performs what the customer wants. We will also see if all components work
together as they are supposed to. To perform system test we will create different scenarios
for the different functions, and see if they are possible to perform without any bugs. These
scenarios will be some fictitious scenarios created by the team, but also real scenarios
created by the user. Here we will try to test for the edge cases since they are the most
likely to generate bugs.
The system tests will be performed both by the team and the customer. The team
will continuously check that the system does what it is supposed to. This will be done
every time before new functionality is added, and also before the customer will perform
system test. By performing system tests before we show it to the customer we will be more
prepared, and have a bigger understanding of what the system is able to and not able to do.
The system tests performed by the customer will tell whether the system performs as they
want to. This will help us to see if the team as the correct understanding of the program
and the requirements, or if there are some changes that need to be made. This will also
see whether the customer think the solution created is good or if a completely different
approach is needed to meet their needs. The team plan to have continuously system tests
with the customer for the different stages of the program to always make sure we are on
the right track.
6.1.4
Acceptance test
Acceptance test is the last test performed in the project. Here the customer tests whether
or not the system meets their requirements. This tests can both be looked at as a functional
and non-functional. Here it will be tested that all the functional requirements are implemented and perform as expected, but we will also test that the non-functional requirements
are met like the loading time.
60
CHAPTER 6. TEST PLAN
The acceptance tests are created together with the customer and is sort of our contract
telling what we have promised to do. In order for the contract to be fulfilled our system
have to do everything in the acceptance test. This acceptance test is a list of all the
functional requirements with scenarios on how to test them. We will also check that all
the non functional requirements are met. The acceptance test will either be approved or
disapproved by the customer.
We will have the acceptance test about one week before the end of the project, so that
we have some time to make small changes if the acceptance test should not be approved.
The acceptance test is given in table 6.1.
#
1
2
3
4
5
6
7
8
9
10
11
12
13
14
15
16
17
18
19
20
21
Functionality
User is able to load customer’s txt and xml files
User is able to load only the Log File (no file dependency)
User is able to view events in a line chart (Line Chart View)
User is able to view events in a barchart (Bar Chart View)
User is able to view a list of nodes (Tree View)
User is able to write and save notes in an specific node within the node
view
User is able to mark nodes as important
User is able to view the nodes marked as important in another view
User is able to view the events sorted by entryID across all the views
User is able to view a color coding for events applied to all views
User is able to view all the available filters in human language
User is able to apply filters in all the views
User is able to remove filters in all the views
User is able to zoom graphs
User is able to have the applied zoom across charts
User is able to apply filters to zoomed graphs
User is able to add new tabs
User is able to close tabs
User is able to save system current state (filters, zoom, nodes and tabs)
in a text file
User is able to search and apply filters when matching the search
User is able easy installed without additional software
Critical
Y
Y
Y
Y
Y
Y
Y
Y
Y
Y
Y
Y
Y
Y
Y
Y
Y
Y
Y
Y
Y
Table 6.1: Acceptance tests
6.2
Non-functional tests
The non-functional tests are to make sure the program is safe, have a low response time
and is easy to use. This tests whether or not the program is intuitive, the response time
61
CHAPTER 6. TEST PLAN
is low enough, the security is high enough, the user interface looks good and other aspects
like this.
This is the most demanding aspect to test, and requires help from the customer or
other students. We have chose to have user tests with employees from the customer to
check that we meet the non-functional requirements. Here they will perform scenarios that
mimic their usual work scenarios and check how the system performs. Here we will test
if they can use the program without any help, and see what is intuitive and not. We will
also get feedback on the GUI to see if the colour and layout works good. These tests are
described more thoroughly in section 13.4.
6.3
Test Criteria
: The tests will be considered passed if the expected result we get, is the same as the actual
output. It is important that this is the case for all tests before the given functionality can
be merged into the codebase. Also if a test doesn’t return the expected result or give the
expected exception the test will not be passed an either the test or the function will need
to be rewritten.
The customer didn’t have any request for test coverage, but we will also try to have a
50% test coverage. As this is not a critical system, some bugs will be accepted, but major
functionality and methods should have tests to show that they perform as expected.
6.4
Test responsibilities
One team member is the test leader, and have the overall responsibility for the tests.
This person will create the skeleton for all the tests, and also make sure that we test the
different functionalities. This person also has the responsibility to follow up that the other
team members test their code. Even though the test leader have the overall responsibility,
each team member is responsible for testing their own code as they know it best. It will
therefore save us time if team members write their own tests, as they don’t have to spend
a lot of time understanding the code before writing tests, and these test will make it easier
for others to understand the code.
6.5
6.5.1
Changelog
Sprint 1
Since sprint 1 was all about planning and sketching different solutions for the customer,
there were no implementation of functionality and also no unit tests created. We did work
out the acceptance tests though, and agreed upon what the criteria for a successful project
should be. The acceptance tests contained both functional and non-functional requirements
as planned.
62
CHAPTER 6. TEST PLAN
6.5.2
Sprint 2
The test skeleton for the main classes were created before we started implementing, but
smaller classes were made before the tests. We think this is the best solution as we don’t
know how the class will be fully implemented before we start. We also add tests as the
functions are implemented, and make sure all tests are green before they are merged into
the code base.
6.5.3
Sprint 3
As the different team members have become more experienced with writing tests, and the
different classes have become more complex, we decided that the team members will write
their own tests without a skeleton being created by the test leader. The test leader will
still supervise the tests to make sure things are done correctly.
6.5.4
Sprint 4
As we had to implement a lot of different fixes in a short amount of time, the tests weren’t
prioritized as much as they should. We wrote all the test for this sprint at the end, and
made sure it worked as expected.
63
7 | Tools
This chapter discusses what tools were used during the project. This is important as it
makes it easier to understand how the program was made and how the project was managed.
This chapter therefore helps the user more easily understand how the program works and
how they can start developing the program further.
7.1
Tools and Programs
The project will be developed using a set of given tools and programs. This section looks
closer at these programs and how they will be used.
The following tools and programs will be used to develop this project:
• Git and GitHub (Code sharing)
• Facebook (Informal communication within the group)
• Google Drive (General file sharing and documentation)
• Trello- used as a scrum board and discussion forum
• Java 8 - Programming language used
• JavaFX 8 and Scenebuilder 2.0 - GUi development tools
• Latex - Program to write the report
64
CHAPTER 7. TOOLS
7.1.1
Git
The group have decided to use git for code sharing together with Github. Git is a version
control program that makes it easy to work together on the same code base. The reason
Git was chosen was because the group have a lot of knowledge about it, git is very efficient
and easy to use when you are working together as a group.
Another tool we also considered was using SVN. SVN (Subversion) is another version
control system that makes it easy to share code and keep track of different version. There
are two main reasons why we chose git over SVN. One is that it’s much easier to work
on separate branches with git, which again makes it easier to work together on different
parts of the code. This is also important for us to follow the workflow we planned to create
separate branches and QA them before merging the code to the code base. The second
important thing is that git enables us to use Github and makes it easier to keep track of
what people are working on and issues we need to fix. It also has a nice interface to do
QA on the code before merging it into the code base. Git was also the tool the group was
most familiar with from before.
7.1.2
Google Drive
Google Drive will be used by the group for document sharing. Google Drive let’s you store
files togheter in shared folders and work simultaneously when writing them.
Another alternative we though about was using Dropbox for file sharing. One of the
main response we chose Google Drive instead is because the integration with Google Docs
where one can write simultaneously to documents and see live updates. Another positive
thing about Google Drive is that Google has program to open the different files, that way
the group members don’t have to install separate programs to open these files.
7.1.3
Facebook
Facebook is the tool being used for communication with the group.
There are a lot of other communication programs like IRC, Skype, Slack, Appear.in
and Google Plus that was discussed. The reason Facebook is chosen is because everyone
on the group already have accounts to Facebook and use it actively.
7.1.4
Trello
"Trello is a collaboration tool that organises your projects into boards. In one glance,
Trello tells you what’s being worked on, who’s working on what, and where something is
in a process." [2]
The board is also used to keep track of what the status for each task is, and let’s people
comment on the different things that has to be done.
The reason Trello has been chosen is because the group need some sort of scrum-board,
and since the group meetings happens in different rooms a physical board can’t be used.
65
CHAPTER 7. TOOLS
We also looked at different scrum boards online like Scrumdo and Scrumdesk. The reason
Trello was chosen over these is because some group members had knowledge with it from
before and knew it had all the functionality needed for the project. Trello is also free and
easy to use.
7.1.5
Latex
Latex is a document markup language and document preparation system. Other tools
that were suggested was Doogle Docs and word. For some things it would have been easier
to use Google Docs when we were to share the text, and for creating the layout. The
main reason for choosing Latex is that it keeps track of all the figure, citations, tables and
appendixes so that if you change some references it will update all the others automatically,
which is really important for a bigger scale report like this. It also helped that the group
have some experience with it and the fact that It is easy to use with Git.
7.1.6
Java 8
"The Java programming language is a general-purpose concurrent class-based objectoriented programming language, specifically designed to have as few implementation dependencies as possible." [3]
Other suggestion that were presented was using Python or a web framework like node.
The reason we didn’t go for a web framework is that the customer specifically wanted the
program to be an offline solution. We then thought it would be extra work to make it in a
web framework when we would ’t use any online functionality anyways. When comparing
Python to Java we see that Python code is often easier and shorter than Java, but one of
the main reason we still chose Java is because Java i usually faster and the program should
be able to handle large files and chunks of information as fast as possible. Also the group
didn’t have any knowledge about good GUI frameworks to help create GUI in Python.
Java is the programming language the team had the most experience with and the team
wanted to use as little time as possible learning a new language so that the maximum
amount of time could be used for implementation. Java version 8 was chosen as this is the
latest version of the program and it comes with build in support for JavaFX 8 which we
discuss in the next section.
7.1.7
JavaFX 8 and Scenebuilder 2.0
"JavaFX is a set of graphics and media packages that enables developers to design, create,
test, debug, and deploy rich client applications that operate consistently across diverse
platforms."[7]
To develop a GUI for the program the group decided to use the official GUI program
that comes with Java 8, JavaFX 8. This library gives us all the GUI elements we might
need to develop the program as well as easy implementation with Java. This was chosen
over Swing because JavaFX makes it easier to structure the code in the MVC manner
66
CHAPTER 7. TOOLS
we wanted for the architecture. It also have some neat functionality like it works with
CSS styling and Scenebuilder for quicker creation of the GUI. Scenebuild 2.0 is the official
program used by JavaFX 8 to generate a GUI. This program will be used to easily make
a GUI and save the group a lot of time during development.
7.1.8
Version Control Procedures
GIT
Every member of the group should be working on its own branch writing code, which will be
pushed to the master branch when fully tested. The master branch will be having version
numbering, which will increment depending on changes pushed to the master branch.
Minor changes should increment the version number by 0.01, and major changes by 0.1
Google Docs
Each document going through major changes should be saved in a pdf before changes
will be written. This to keep both the old version and the new available. Naming of the
documents will have an incremental numbering at the end of filename e.g. filenamei.ext
where i is the version number.
67
8 | Architecture
This chapter introduces the final architectural documents for the project. The initial architecture with its changelog can be found in section 8.8 For the development of the architecture
the group have used the methods described in Software Architecture in Practice [4]. The
purpose of this chapter is to describe the architecture in an organized way so the reader can
understand how the program is made, and also get a better understanding of the underlaying
structure of the program to make further development easier.
8.1
Architectural Dependencies
The programs that will affect the architecture in any significant way is Java and JavaFX.
The architecture will also be affected by the development method used (SCRUM). This
section describes how the architecture will be affected by these.
8.1.1
Java and JavaFX
Java is an object-oriented language and to make best use of its features the architecture
should be developed with this in mind. JavaFX will handle the GUI elements in a specific
way, so the architecture for the GUI will follow is predefined structure for ease of use.
8.1.2
SCRUM
The project will be developed using SCRUM, for a closer look at SCRUM check chapter
2. Using SCRUM means that the project will be developed in steps and often in smaller
packages. The architecture should take this into consideration to make it easier to develop
the program. As discussed in an earlier chapter the development group don’t got access to
each other at all times, this makes it even more important for the architecture to work in
such a way that parallel development is easy.
8.2
Architectural Drivers
This section describes the architectural drivers related to the project. The group have
focused on Performance, Modifiability, Testability and Usability. The reason the group
68
CHAPTER 8. ARCHITECTURE
chose there qualities will be discussed in sections 8.2.1, 8.2.2, 8.2.3 and 8.2.4, as well as
what tactics will be used and how requirements affect each quality.
8.2.1
Modifiability
Modifiability was chosen as a quality as the program the group will make is a prototype
and it should be possible to develop it further in the future. The group also wanted this
quality to make it easier to add new elements to the program as new requirements came
in form the customer or as they were developed in a scrum sprint and to make it easier to
change the GUI when needed.
M1.
Modify UI when needed. It should be easy to make another UI and change the looks of the
system. This means that we need to make the UI part of the program with modifiability
in mind.
M2.
Adding new functionality to the system. Adding new functionality to the system should be
a concern for the group, and shouldn’t be too time consuming to do. Changes may need to
happen because of changing requirements, and the system should be able to handle this.
Possible Issues
• Getting modifiability right is a time consuming task. Parts of the system with a high
likelihood of change should be prioritized. Under development, the system should be
easy to change and this should also be the case when the system is done.
• Changes in models and back-structure is less likely, so to prevent changes a good
architecture should be as good as possible from the start.
The tactics used to achieve modifiability is listed in table 8.1.
69
CHAPTER 8. ARCHITECTURE
Quality
Requirement
M1
M2
Tactic
How?
Result
Increase
semantic
coherence
Encapsulate
Separate frontend and backend.
Increase
sion
The
interface
itself
shouldn’t directly communicate with the models,
but rather an explicit
interface.
Introduce inheritance. Factor out common code used
by several modules/ classes.
Modules should be split up,
by dividing them on what
type of work they do.
Make abstract classes, so a
change in a class affects all
of its sub-classes. Should be
done for opening file class,
and the parsers.
Reduce coupling
Refactor
Split module
Abstract
common
services*
cohe-
Reduce coupling
Reduced size of
module
Reduce coupling
Table 8.1: Modifiability tactics
8.2.2
Performance
Performance was chosen as a quality as the group was unsure how fast the program needed
to be, so to make sure there wasn’t any problems later on a focus on perforamce was
neccessary. Some of the issues that was discovered early in planning was that no one in
the group had any experience with large scale programs, so if the architecture is set up in
the right way this doesn’t have to be a problem.
P1.
Incoming user events should be processed when performed/triggered.
P2.
Processing log files is a time-critical and a high priority task. Analyzing and sorting
needs to be done after loading the files and processing them shouldn’t make the system
unavailable.
70
CHAPTER 8. ARCHITECTURE
P3.
Searching in log events. When the user want to search for events, the system needs to
process the search and retrieve and analyze events. The system should still be functional
for other user events when doing heavy work.
P4.
Already processed events should have a fast loading time
The tactics used to get the wanted performance is listed in table 8.2.
Quality Tactic
Requirement
P1
Prioritize
events
P2
P3
Introduce
concurrency
Introduce
concurrency
Reduce computational
overhead
Data replication*
Reduce computation
overhead
Introduce
concurrency
P4
Data replication
Reduce computational
overhead
How?
Result
Process user evetns first, then other
events
Control
Resource
Demand
Manage
resources
Manage
resources
Control
resource
demand
Manage
resources
Events can be processed in parallel
to increase performance.
See line above
Free recourses when possible during
processing
Don’t make more copies of data then
necassary, use pointers and keys instead
Cleanup events that isn’t relevant to
the search. By freeing memory less
RAM needs to be used.
Threads should be created for handling analyzing and sort, while another listens for user input.
See *
Cleanup of events not needed or being inactive for a given time will
make sure the system doesn’t fill up
the RAM.
Table 8.2: Performance tactics
71
Control
resource
demand
Manage
resources
Manage
resources
Control
Resource
Demand
CHAPTER 8. ARCHITECTURE
Possible Issues
As stated earlier, the group got little to none experience with this kind of system. Possible
problems might be everything from too long processing times to the program not running
at all on lesser systems.
• Processing time will decide how fast the program will respond to user inputs, but it
will also depend in CPU power, storage space, available system RAM and so on.
• Multi-threading and dependencies might be a possible issue when loading different
files at the same time, and especially if race-conditions are an issue.
• Event prioritizing might be an issue if calculations are being done when the user
expects the system to respond. Making sure the user never thinks the program has
crashed and give the right feedback in the event of long processing times will be
important.
8.2.3
Usability
Usability was chosen as a quality as the most important requirements talked about efficiency and ease of use. With the right amount of usability-focus during development
and in the architecture the program will be easier to learn and use, and should have advanced features needed by the experienced users. While the architecture doesn’t directly
address usability it will affect it by having good performance and modifiability both during
development and as an end-product.
U1
Increase efficiency with 50% over today’s time it takes to analyze a log file.
U2.
The system must be easy to learn for new users, while also giving flexibility to the advanced
users.
U3.
The system must minimize the chance to make errors, missing an important event in a log
file might mean an entirely wrong conclusion made in the analysis.
U4.
The UI would need to change to adapt to the users need. This to make sure the user can
do the analysis as efficient as possible.
72
CHAPTER 8. ARCHITECTURE
U5.
The system should give appropriate feedback to the user. The user should know when the
system is doing computational work, if the user has to wait for it to finish, if a new setting
was applied etc.
The tactics used to achieve the these usability qualities is listed in table 8.3.
73
CHAPTER 8. ARCHITECTURE
Quality
Requirement
U1
Tactic
How?
Result
User operations*
Give feedback to the user for what
the users operations are doing, and
make the user able to cancel and
pause/resume certain task.
Introduce shortcuts for functions
having a more probability of being
used.
User initiative
Shortcuts
Aggregate
Maintain
system
model**
U2, U3
Rapid prototyping
U4
Maintain
system
model
User operations
Cancel
When a list or graph of events
are being shown, multiple boxes of
events should be able to be selected
to prevent repeatedly operations
Give user feedback on what the system is currently working on. i.e
processing a log file or multiple
events. The system should show a
progress bar indicating time left.
By testing several interfaces, the
group will be able to find a good
UI that supports the system needs,
and the best for the user to understand and use
See **
See *
Good
for more
advanced
users
User initiative
System
initiative
Error
prevention
System
initiative
User initiative
When a user cancels an event or
loading process, the system should
stop computation on the task being
canceled, thereby reducing computational overhead
Table 8.3: Usability tactics
Possible Issues
It is quite possible that the time available for the project is to little to realize all the
goal for the program. This means the customer together with the development team must
prioritize the functions that are essential, and the management of the project must be done
74
CHAPTER 8. ARCHITECTURE
as good as possible to detect when time might be a problem.
8.2.4
Testability
Testability as chosen as a quality since the program will go through many iterations (scrumsprints) and will be developed further after this project is done. To this end it is important
to have enough tests to make use when a changed is done in the program it will still work
as intended. While this shouldn’t be the main factor in deciding on an architecture it
should be one of the qualities that should be included if at all possible.
T1.
Allow fast testing on new and completed developed code in the system. Before code will
be merged, it should be tested fully making sure the system works as expected.
T2.
The system should always give the correct output. The group have to make sure the system
is tested to not produce any errors when the system is released.
The testability tactics used to achieve the wanted testability is listed in table 8.4 on
page 76.
75
CHAPTER 8. ARCHITECTURE
Quality
Requirement
T1
Tactic
How?
Result
Sandboxing
The code should already be isolated, since it’s still not merged
with the full project code.
Tests should be run through handcoded assertions, making sure the
code works with these assertions
before being merged
Make protected getters and setters
for every class created, to more easily change and retrieve object variables.
Test sets should be created which
the system should be tested
against. A test set doesn’t require
any change in code, and can easily
be connected with the system.
By following modifiability, which is
also a quality attribute chosen by
the group, it becomes easier to do
tests on sets of the system.
A set of given inputs will create
known outputs. The system will be
checked to see if it creates the desirable outputs, or an error is thrown
Control
and
observe
Control
and
observe
Executable
assertions
Specialized
interfaces
T2
Abstract
data sources
Limit structural complexity
Executable
assertions
Control
and
observe
Control
and
observe
Limits
complexity
Control
and
observe
Table 8.4: Testability tactics
Possible Issues
The development team haven’t been doing a lot of automatic testing when it comes to
coding, and will probably need some time to implement testability in the system to get
it right. If not done early enough in the development and in the right way a lot of time
might be used on testing without giving the wanted results.
8.3
Architectural Significant Requirements
A good architecture can’t only consider the quality attributes for the system, it also need
to consider the requirements that will affect the architecture the most. These requirements
will be gathered by doing requirements analysis, by addressing the different stakeholders
76
CHAPTER 8. ARCHITECTURE
and analysing the different qualities the program will need. Before the ASR were made
the group talk among them self to analyse the problem and there were meetings with the
customer, which also is the only other stakeholder, where requirements and functionality
was discussed. Afterward the system-architects discussed and agreed upon the ASR. Table
8.5 on page 77 shows the ASR found, and these will later be used to make an architecture.
Quality Attribute
Performance
Attribute
Refinement
Troughput
Latency/
Response
time
Modifiability Adding new
UI
Usability
Several
views
ASR
Priority
Support up to 20 000 events
which might be as much as 400
000 lines in the log files.
User input shouldn’t take longer
than 0.5s to repsonse.
H
When first loading the log, the
system shouldn’t use more than
5s to analyze and sort
Sorting and filtering an event file
shouldn’t take longer than 3s
While filtering and searching,
providing response on user events
shouldn’t take longer than 0.6s
Needs to be possible to change the
UI during the whole development
process
The system should have multiple views/modes to support several types of analysis methods.
Should increase efficiency with
50%.
L
H
L
M
H
H
Table 8.5: Architectural Significant Requirements
8.4
Architectural Patterns
This section describes the patterns that are going to be used for this architecture.
8.4.1
Layered Pattern
Context
The pattern splits up the program and restricts communication to connected layers. This
helps with keeping the program organised and easier to develope.
77
CHAPTER 8. ARCHITECTURE
Problem
The software needs to be segmented in such a way that the modules can be developed
and evolved separately with little interaction among the parts. This is important for
modifiability and reuse. This will also be critical for the completion of the program as it
allows for splitting the program in several packages that can be developed independantly
and in different scrum sprints.
Solution
The software is separated into units called layers, each layer is a grouping of modules
that gives a cohesive set of services. In this program this might be groupings like parsers,
renderer, models, controllers etc.
Weakness
One of the restrictions to this kind of pattern is that it restricts communications between
the layers and not all layers should be able to communicate with each other. To make
this pattern work everyone on the development team must understand how its going to be
implemented.
Figure 8.1: Layered Pattern
78
CHAPTER 8. ARCHITECTURE
8.4.2
Model-View-Controller Pattern
Context
The UI is the most modified part of an interactive application. For this reason it is
important to keep modifications to the user-interface separate from the rest. Users often
wish to look at data from different perspectives and changes made to one view should often
be reflected on the other views as well.
Problem
How can you make the user interface separate from the application functionality and at
the same time responsive to user actions? And how can multiple views of view modes of
the UI be coordinated with the underlying data in real time?
Solution
MVC solves these issues. The model contains the applicaton data, the view displays some
portion of the data and interacts with the users, and the controller is an intermediate
between the model and the view. This will probably be one of the best patterns for the
program, especially if several views will share some kind of data.
Weakness
The complexity of this pattern might not be worth it for a simple UI, but if the need arises
and shared data is a reality then this patterns is necessary.
Figure 8.2: MVC Pattern
79
CHAPTER 8. ARCHITECTURE
8.4.3
Factory Method Pattern
Context
A class is created as template for creating objects, and other classes that need its core
functionality can extend it. These classes can decide which functions to override or not.
Functions not being overridden, will use the parent(s) functions when called.
Solution
Removes the need for writing code multiple times, and gives objects a level of abstraction.
Weakness
More complexity in code and extra work coding. The classes can be more difficult to debug
and maintain.
8.4.4
Abstract Factory Pattern
Context
Provides interface for creating related or dependent objects by making a standard class
with special functions, which other classes inherit. The functions aren’t implemented in
the abstract class itself, but rather in the classes inherit from the base-class. It’s a way
of defining what type of functionality certain classes should have, and only defines the
concrete type of the object.
Solution
Filter out standard functions an object should have, i.e. a file parser. A file parser should
be able to parse file, but for the xml and log files, they do it differently. By implementing
an abstract class, which all the parser classes inherit from, you are able to define all the
functionality a parser needs.
Weakness
More complexity in code and extra work coding. The classes can be more difficult to debug
and maintain.
8.4.5
Facade Pattern
Context
Object providing an interface for handling multiple objects. The facade can give a more
simple interface to the underlying objects, which will be more of a complex system. When
80
CHAPTER 8. ARCHITECTURE
called, the facade calls the underlying functions for the objects connected with the facade
object. The facade pattern reduce dependency and gives more flexibility in developing the
system, since users can more easily work on different parts.
Solution
Connecting all the modules together, and give a more easy interface that the controller and
view can interact with. The pattern will be used as a “parent” class, called masterModule,
where the controller and view will be controlling all the modules from through an easy
interface.
Weakness
More objects created, can give more complexity when wanting to update the code or add
new functions, since it has to be implemented both in the view, showing the functions, the
facade, which calls the underlying objects, and the underlying objects itself, handling the
new functionality.
8.4.6
Singleton Pattern
Context
Restricts the instantiation of a class to just one object. Only one object is needed throughout the system, which will make the system more efficiently.
Solution
Makes it easier to use already made objects as you don’t need to send it around everywhere.
Limits the creation of more than one instance of an object. Gives the program higher
efficiency.
8.4.7
Pipe and Filters Pattern
Context
For the filtering of events there is the problem of performance. To this extent it would be
nice to have a way to split up the list and use concurrency, and to process the filtering as
fast as possible.
Solution
By using a pipeline where each output of a “station” is the input of the next, the use of
concurrency at each station will speed up each filter appliance. For each “station” split up
the list and apply the filter to each sublist in parallell, then merge the new lists and split
it again for the next “station. This gives a pipeline with high concurrency.
81
CHAPTER 8. ARCHITECTURE
Weakness
Night be dependant on race conditions and might be unnecessary and hard to implement.
Figure 8.3: MVC Pattern
8.5
Development Process
To get an initial sketch of the architecture we use a method called Attribute Driven Design
Method. The five steps of this method is described below:
1. Choose an element of the system to design
2. Identify the ASRs for the chosen element
3. Generate a design solution for the chosen element
4. Inventory remaining requirements and select the input for the next iteration
5. Repeat steps 1-4 until all the ASRs have been satisfied
Following this process for the ASRs discussed earlier should lead to a good initial sketch
of an architecture for the program.
Iteration 1
Step 1: The UI will be looked at first as this is much an important part.
Step 2: The ASRs for this part is listed under.
• To have a modular, efficient and clean interface.
– Needs to be possible to change the UI during the whole development process.
• The possibility to have several UIs or modes to support several types of analysis
methods.
82
CHAPTER 8. ARCHITECTURE
– To reach to goal of 50% increase efficiency we need an adaptable UI with good
search methods and sorting.
Step 3: Several views: As described earlier the MVC pattern seems to fit these requirements quite well, the pattern also gives good possibility for modifiability and usability as
several views will be used. The downside here is that it will have a little negative impact
on performance if not done carefully, and it is quite complex to get right.
Step 4: The two remaining ASRs mentioned earlier remains, and both of these can be
looked upon at the same time for the next iteration
Iteration 2
Step 1: The next element that needs to be look at is the model and the underlaying
requirements for that.
Step 2: The ASRs for the model is the two remaining ASR
• To have efficient filters and sorting to give the user good performance and response
times.
– To achieve what the customer want the program need to have good response
times and overall good performance
• Support up to 20 000 events which might be as much as 400 000 lines in the log files.
– Might have a big impact on the architecture as we got little to no experience
with systems of this size.
Step 3: The model is already part of the MVC pattern used in iteration 1, thus so far
that have already solves that part, but a concern is the requirements for the model. The
model need efficient filters and sorting to handle the possibility of up to 20 000 events,
and to make the scrum process more efficient it should be a concerned that different
modules should be work upon at the same time. To achieve this, and at the same time
have the necessary modifiability, the program should split up some of the model’s tasks
in several modules. This is where the Layered pattern should help along with the Pipe
and Filter pattern. The model itself should store the data structures and be responsible
for the communication with the view and controller. Another module should be made for
the filtering of data and the model module can use this filter module to do calculations,
filtering and sorting. Another module should be made for the loading and initialization
of the data. This module will be responsible for communicating with the file parsers and
give the model module the wanted operations to load and initialize the data sets. The last
module should be the parser module, this will be in communication with the loader module
83
CHAPTER 8. ARCHITECTURE
and will be responsible to locate and parse the log and xml files. As the layered pattern
will make it easier to make the code, it will not necessarily make the performance good.
To achieved this we want to address the filter module discussed above. We need good
performance here, and an easy way to get that is with concurrency. What we suggest is a
pipe and filter pattern that helps with the filtering, and for each step on the pipeline we
use concurrency to optimize the filter times. This should help a lot with the performance
of the program.
Step 4: All the ASR have been fulfilled, but to address other issues and concerns another
iteration will be done.
Iteration 3
Step 1: This iteration will look at the requirements for the program and development
process
Step 2: Here is what will be considered:
• Development time and cost
• Program structure
Step 3: To reduce the workload and to improve the program structure lets apply some
more patterns on parts of the program. The loader module will have 3 different types of
nodes, Unit node, Fault node and Event node. Lets use the abstract factory pattern to
make another layer of abstraction. As for the loader module, the parser module got the
same issues. By using the abstract factory pattern it will be easier to interact with the
different parsers and it makes it more intuitive what the loader will need for them.
The main module is a divider between the frontend and the backend. The main module
will be connecting all the modules together, so the frontend will be accessing objects in
terms of operations instead of a lower level data accesses with the backend. Facade helps
reducing the complexity of the system. The controller and view runs functions on the main
module, which inturn calls the other modules beneath the main module. Instead of calling
different modules, the frontend only have to deal with one module, making it more easy
for the developers to work on different parts of the system, and only combining them into
one module.
The Singleton pattern makes sure only one instance of one object gets created, and
thus saving space and increases the efficiency in the system. The main module should be
a singleton, as the system wouldn’t need multiple connections between the frontend and
backend, but rather having one object handle all of the information flow. The same goes
for the controller, so the view(s) will only exchange information with one controller, so no
more than one controller will be sending user events to the main model. This can also be
applied to the main model class as it will only be one of those and to the program loader
and the main view.
84
CHAPTER 8. ARCHITECTURE
Conclusion
Taking the results from all the iteration you get the initial architecture, and as figure 8.4
shows the architecture is some sort of mix of MVC and Layered patterns with some extra
patterns and tactics to supplement this. This is the initial architecture, this first draw that
was made. For this final architecture see figure 8.5
Figure 8.4: Old architecture
8.6
Architectural Views
This section looks at different achitectural views.
8.6.1
Logical Views
Figure 8.5 shows the final architecture for the system. It consists of several different
patterns, but the layered pattern is dominant while the other patterns are there to support
the different layers. The view layer consists of several different views, all with an abstract
factory for easy communication with the controller. The controller takes actions from the
views and apply it to the models, it then tell the views that they need to update. The
models can apply filters directly to themselves, this is done if the controller tell the models
to do so. While this might make a small delay it shouldn’t matter as most of the processing
is done in the pipeline for the filters. Lastly the model communicates with the fileloader to
get the data they need. The fileloader can then make parsers to reader in the information
from local storage.
85
CHAPTER 8. ARCHITECTURE
Figure 8.5: The final architecture
The class diagram in figure 8.6 will be useful for the continued development of the
system. This is meant for developers if they want to understand the structure of the
program on a better level than the architecture. The class diagram is a little simplified
compared to the real situation, but to keep it form getting to complex and at the same
time make it understandable this was neccassary.
86
CHAPTER 8. ARCHITECTURE
Figure 8.6: Class diagram of the final system
8.6.2
Development Views
As the layered stucture is used there is no need for activity diagrams, the layered structure
itself shows clearly how the modules communicate with each other. To give the last bit of
clarification on the packaging and stucture of the program the architects wants a package
diagram to show how the different files relate the the layers in the architecture. Figure 8.7
shows this final diagram.
87
CHAPTER 8. ARCHITECTURE
Figure 8.7: Package diagram of the final system
8.7
Architectural Rational
The architects felt the layered pattern would give the best structure for the overall program,
and that it would be easier to maintain this structure throughout he whole development
process. The other patterns were applied to add some needed structure to some of the
layers. By using the layered structure it would also be easy to do incremental development,
and it is easier to further develop the prototype when it is done. The MVC structure, even
though it is a little modified, will work excellent with our plans for different views and will
make it easy to keep the views updated in a relatively simple way. The abstract patterns
will work well to save some time, and will not affect the program in any negative way.
To address performance the pipe-and-filter pattern is very nice, it should give the filters
the performance they need. Even though the MVC and Layered pattern should affect
performance, right now they are only a concern when the program load and will have
88
CHAPTER 8. ARCHITECTURE
little to say during runtime. During runtime the Model layer communicates directly to the
Pipeline and this should make performance as good as possible. The different views chosen
in the report should give the necessary overview of the program, both for the user and
for further development. The logical views should give the necessary information needed
to understand the structure of the program, as well as how it communicates internally,
and the development view should give the last bit if information needed to link the files
together with the architecture.
8.8
Changes
This section describes the evolution of the architecture of the project. What changes were
made and why.
Changelog
• Sprint 2
- Model View Presenter removed as possible pattern.
- Initial architecture model made (see figure 8.4 for this architecture).
• Sprint 4
- Architectural Views were added to the architecture.
- Tools were made to its own chapter.
- Architecture was updated to show the final architecture of the program. Little
changes were made, MVC was changed to Layered (or MVP).
89
9 | Sprints
90
10 | Sprint 1
This section shows how the group didsprint 1 of the scrum process, it might deviate some
from a normal scrum cycle, but some modification had to be done in order for us to use
scrum. Thus, this chapter will, to an extent, reveal deviation from the conventional SCRUM
process. Section 10.1 gives an overview of the sprint planning, and sections 10.3 and 10.4
provides documentation of the sprint review and sprint retrospective, respectively.
10.1
Sprint Planning
The Sprint Planning initiated the first sprint. We did not have a product backlog ready
prior to the Sprint Planning, but we have chosen to use the conventional SCRUM terms
to describe the process for this period of time, despite the fact that it was not technically
a SCRUM sprint at the very beginning.
The Sprint Planning was held to determine what work that could be done in the course
of this sprint and how.
We planned to write the product backlog, and the customer would later modify and
approve it. In the meantime, we were to produce alternatives for different solutions to their
problem, namely merging and presenting the log files, using what information we had at
that point in time. We added the items needed to accomplish this in the back log based
on the assumption that this would be approved by the customer.
10.1.1
Duration
The first sprint lasted from the initial Sprint Planning 01.09.2014 to the Sprint Review
19.09.2014.
10.1.2
Sprint Goal
The objective for this sprint was to provide at least one concept of solution, including
GUI elements, that would be in compliance with the customer’s wishes. Additionally, we
wanted to implement a flexible program skeleton that could be modified easily based on
what solution the customer wanted us to pursue further.
91
CHAPTER 10. SPRINT 1
10.1.3
Sprint Backlog
• Provide a GUI concept
• Create the initial architecture
10.1.4
GUI: Concept
When deciding what kind of user interface we want to employ, we first had to figure out
what kind of solution we wanted. Planning and concept development was done in plenary.
It was decided to discuss different proposals in a workshop. A lot of time was spent
discussing what kind of user interface we wanted to provide to our customer as choices
made would greatly effect the rest of the application. As stated in the introductory, our
customer wanted an application which would present data from a log file in a graphical,
user friendly way.
Because of the nature of the log files, representing the data using different charts is
an appropriate solution. The log files could potentially contain thousands of events, so
representing all information in one view will not work. The solution we came up with
contained three different main views for representing data on three different levels of detail.
The first view is the outer most level of detail. This view is meant to give an overview of
all the events. A line chart was deemed the most useful way to approach this problem.
The line chart inserts all events, and shows the distribution of number of events versus the
time they were generated in the log. With a overview such as this one, the user will be
able to see where events occur most frequently and will be able to ignore time slots where
there are few events. A simple mock-up with some design elements is depicted in figure
13.2.
92
CHAPTER 10. SPRINT 1
Figure 10.1: Line chart view for a general overview
The second view will illustrate the second level of detail. It is meant to be used when
a portion of events are filtered out. Like the first view, the second view will be a graph
in the form of a bar chart. In addition, the bar chart should be color coded. This view is
meant to give the user the ability to pin point a group of events that are interesting based
on the number of events that occur in a given time period as well as the type of log event.
The user shall then, based on this information, be able to pull these events to the to the
last view for detailed viewing. See figure 10.2 for paper mock up.
93
CHAPTER 10. SPRINT 1
Figure 10.2: Paper mock-up for bar chart view
The third and last view will give a detailed view of events. It will be possible to
expand each log entry to get a detailed view of all relevant information including extended
information provided by the fault and unit .xml files. A paper mock-up of this view is
depicted in figure 10.3.
94
CHAPTER 10. SPRINT 1
Figure 10.3: Paper mock-up for node chart view
Together, these views will give the user a set of detailed levels to easily filter out what
is less important and find relevant log entries much quicker. As the user navigates the line
chart view, he or she will be able to switch to the bar chart view when excess information
is discovered. This process is iterated in the bar chart view, bringing the user to the final
view where specific entries can be obtained.
Different solutions to the GUI were discussed during layout workshops. Other solutions
were for example a heat map which would display the distribution of events and a simple
table view where the user could filter out unnecessary events. Both of these solutions
were deemed less valuable as they did not give possibilities of displaying different levels of
design. The user would be chained to one level of detail which would only be beneficial in
certain parts of the analysis of the log.
10.2
Create Initial Architecture
Most of the architecture and its development process can be found in the chapter 8 from
page 68. As part of the backlog from this sprint some of the group worked on the architecture and the initial documentation of this. This suggested architecture will be used in
the second sprint to start making the program packaging, and the result from this task
can have a huge impact on the whole development process and the final program.
95
CHAPTER 10. SPRINT 1
10.3
Sprint Review
We accomplished the Sprint Goal and fulfilled the requirements listed in the Sprint Backlog
to complete this sprint’s increment. The customer approved of the product backlog and
there were no new additions or adjustments.
The customer gave good feedback on the proposed solution. They liked our proposal
regarding representation of the log events in a line chart, and encouraged us to take this
aspect of our solution further. This also meant that the architecture the group made will
be used throughout the project, and that the group got a good start on the project with
a robust back-structure for the application.
The main challenge of this sprint was to present a possible solution to a problem of
which we had no domain knowledge. We were asked to create the product backlog ourselves
based on assumptions to what they might find useful.
Inexperience with SCRUM as a development methodology proved to be somewhat of
a challenge. There was no clear structure of the group for the first week, but after having
settled on areas of responsibility this came into order of its own. Fortunately, the group
dynamics were great, and we shared the same goals and thoughts throughout what was
believed to be a challenging phase of the project.
Other challenges include incidents we have covered in the Risk Assessment "see table
5.1 for further details. Also, try to list some of them". This was more of a challenge for
a first sprint than for the other sprints. We had not yet established routines for handling
situations that may prove hurtful to the project as a whole. Luckily, this did not affect the
completion of this sprint’s increment.
We agreed upon the items we should focus on for the next sprint, and settled on a
timeline for completion. This was done in collaboration with the project owner.
10.4
Sprint Retrospective
We should continue to...
• ...accomplish our Sprint Goals
• ...to have constructive discussions and a well established platform for communication
• ...to be proactive and make assumptions where needed in order to get things going
• ...to work well both individually and as a team
• ...to have a common understanding of goals and project scope
• ...to maintain a high morale
• We did a good job of presenting a solution proposal for the customer
96
CHAPTER 10. SPRINT 1
We should start...
• ...sending out meeting invites the day before the meeting
• ...reminding each other to deliver status updates, and make sure all the documents
to be delivered is finished one day before delivery
• ...give notice the day before the meeting if you can’t come.
• ...answering questions within 24 hours on weekdays.
• ...communicating more on facebook.
• ...having a template on google drive to fill in work hours.
• ...preparing better for customer and advisor meetings.
• ...wearing warmer clothes so we don’t get sick.
• ...arriving on time
• ...to get familiar with our areas of responsibility.
• ...having the SCRUM master make sure we keep meeting durations within the timebox.
• ...taking individual responsibility for adding bullets to the meeting agendas.
• ...using the SCRUM board to a greater extent.
97
11 | Sprint 2
In this sprint we started creating the skeleton of our program. The main focus of this sprint,
as requested by the customer, was to design and implement a working prototype for the GUI
of our application. The sprint log was quite ambitious, as we needed basic functionality to
work throughout all layers of our application architecture.
11.1
Sprint Planning
The second sprint builds on the foundation that was laid out during the first sprint. The
sprint plan was made in cooperation with the customer, and as stated earlier, the customer
wanted a working prototype of the application. The tasks we pulled from the backlog into
the sprint log were therefore all of the work packets that were needed to implement a
working prototype of the application.
11.1.1
Duration
All the sprints lasts 3 weeks, and this sprint started the 19.09.2014 after the first sprint
review was done and ended 10.10.2014.
11.1.2
Sprint Goal
The goal for this sprint was that we should make a prototype of the GUI and the backbone
of the program based on the architecture and suggestions we made in sprint 1. At the end
of the sprint we should be ready to start implementation different kinds for functionality
and features that the customer want in the program.
11.1.3
Sprint Backlog
The sprint log for the second sprint included:
• Implementing a file-browser to access log file and .xml documents
• Creating and implementing the general program skeleton
• Pre-study for the parser
98
CHAPTER 11. SPRINT 2
• Creating and implementing parsers for the log file, event-xml file and unit-xml file
• Creating and implementing a program loader
• Implementing a Prototype GUI
• Program packaging and structure
11.2
Packaging, structure and program skeletion
As the sprint started we already had an architecture from sprint 1. This meant that we
could just organize the packing and structure of the program as the architecture wanted.
What was done was that the lead architect made all the packaging and structures and
skeleton files, and made sure the program could start as a basic JavaFX application. Then
it was just a matter of modifying most of the files that was made and make helper classes
when needed. For a closer look at what the packaging looks like see the Architecture
chapter and Appendix A.
11.3
Program loader and parser
As the basic program skeleton was in place it was just a matter of modifying files and
making helper classes and files for this to be completed.Since interfaces was in place the
group could work on all these tasks at the same time.
11.3.1
Program loader
The program loader was supposed to call on the parser to get a list of all the events in
the log as a custom node class, then the loader should combine the event nodes with the
xml nodes. This was not to hard to make as little pre-study had to be made to finish the
loader, but as the parsers needed a lot of pre-study this task was put on hold most of the
sprint until the parsers was done.
11.3.2
Parsers
The parsers was the hardest task of this sprint. To complete this task a lot of pre-study
was needed to understand the log- and xml-files in order to know what should be done.
This took up a lot of time, but by the end of the sprint all the files was parsed and ready
to be used by the program. This also meant that the program loader finally could load the
files and this again lead to the completion of the model-class for the event nodes.
99
CHAPTER 11. SPRINT 2
11.4
11.4.1
Implementing a GUI prototype
Process
The second sprint was focused on implementing a prototype of our current solution for the
customer to review. The concepts developed in the first sprint(Chapter 10) had to be refined and prepared for implementation. Additional information about wanted functionality
that the user could manipulate also needed to be clearly defined.
One of the most changing tasks when implementing the prototype was to learn JavaFX
and Scenebuilder 2.0. No one in the group had used this before and this meant a lot of
time had to be spent on learning this and understanding exactly how this should be used
in the program. After this was done the program skeleton and packaging was used to
implemented the GUI suggestions that already was made in sprint 1.
Figure 11.1: GUI elements of the user interface
From the set of definitions for functionality, these GUI elements were added(see figure
11.1):
1. First item on the GUI shows the main view area. This section of GUI shows the
visual representation of the log entries. This section will change if the user chooses
to switch to any of the other detail levels such as bar chart.
100
CHAPTER 11. SPRINT 2
2. Second item depicted in figure 11.1 shows the top toolbar and represents tools that
can be used across views such as filtering, entry searches and any other tools which
is applicable.
3. The third item is the left toolbar and contains actions that are only applicable to this
certain view. If the view changes from a line chart to the more detailed bar chart,
then the left toolbar should also change to accommodate the switch in detail level.
4. The fourth item depicts any saved entries that the user would like to access quick.
Adding to this list is done at the most detailed view where each entry and its information can be displayed.
5. The fifth item is the general actions toolbar and includes saving files, open files and
other file specific actions.
11.4.2
Result
The result for the prototype was a skeleton program with little functionality. The basic
interface was in place and much of the packaging and skeleton for easy continued development was in place. This meant that while the prototype wasn’t fully functional, not much
work was needed to make a lot of new functionality.
11.5
Sprint Review
Even though the goal for this sprint was ambitious as the group had no idea of how the
Log and XML files worked, at the end we managed to finish all the goals for this sprint. At
the meeting with the customer at the end of the sprint he approved of the prototype and
told us he wanted us to continue work on the prototype we had made so far. At the end
of the sprint the packaging and the architecture still looked like it first was intended, and
the structure of the program was followed. This meant that when we started on the next
sprint we could work in parallel on many tasks at the same time and the initial groundwork
we had done in the last sprint and this sprint had paid of. At the end of the sprint the
group planned the next sprint in collaboration with the customer.
11.6
Sprint Retrospective
Some changes for the structure of the retrospective were made in the second sprint. Instead
of just discussing what was good versus what we could improve; it was decided to change
the format into: what we should start doing, what we should continue doing and what we
should stop doing. This restructuring was done to get a more concise guideline for the next
sprint. As of this restructuring it was clear as of which actions were positive and negative
as well as which processes should be brought forward.
101
CHAPTER 11. SPRINT 2
List of group processes which should be continued:
• Striving to achieve good communication within the team
• Keeping oneself occupied at all times by working on unassigned tasks
• Strive to stay motivated throughout the project
• Make sure everyone is included throughout the sprint
• Having structured meetings with a planned agenda
• Strive to use scrum board in unison with version control software
List of new group processes which should be included:
• Putting in more work hours to achieve desired results
• Formalize guidelines for version control
• Fix requirements for software implementation
• Set up procedure for giving notice of not being able to attend group activities and
meetings
• Adhering to soft punishments conducted when required guidelines are not met
• Using proper tools when performing QA
• Strive to use scrum board for work packet management
• Implement work processes that allow for interleaved work patterns
• Implement proper meeting culture with hand gestures
List of group processes which should terminate:
• Late reporting of hours worked at a given week of the sprint
102
12 | Sprint 3
This chapter presents the third sprint of the project. Section 11.1 will give an introduction to
the sprint planning, sections 11.2-11.5 will detail functionality added, section 11.6 discusses
the usability test conducted, and section 11.7 and 11.8 a gives an overview of the sprint
review and retrospective, respectively.
12.1
Sprint Planning
For the third sprint the group decided to focus on implementing several new functionality
requirements. Usability testing was to be conducted in the last week of the sprint, and to
be able to deliver a program tailored for the customer’s needs and usage, the group would
need to test if the functionality was implemented in a likeable manner. System testing and
bug fixing would have a low priority this sprint to allow the group to focus completely on
achieving the sprint goal.
12.1.1
Duration
The third sprint lasted from the 13.10.2014 to 31.10.2014.
12.1.2
Sprint Goal
The object for the third sprint was to include a prototype of several new functionality
elements. These elements should be tested on the customer to provide a more detailed
feedback on how the software should be improved for the final version.
12.1.3
Sprint Backlog
• Functionality to search for keywords in the log file
• User should be able to filter events on time
• User should be able to filter events on event type
• User should be able to search for unit ID
103
CHAPTER 12. SPRINT 3
• Functionality to save and load projects
• User should be able to save several projects for the same logfile
• User should be able to save filters, tabs, notes and level of zoom
• Functionality to view information about a single event
• User should be able to gain all information from the log file about a single event
• System should merge information from unit- and fault files with information from
logfile
• Functionality to extract information from bar chart and line chart
• System should keep the same level of zoom when switching between views
• Bar chart should sort events on colours
• Usability testing
12.2
GUI - Reviewing and Changes
Sprint 3 builds on the state of the GUI after sprint 2. A prototype had at this point
been constructed and the application was ready for initial usability tests. Up until this
point there had been some questions as to how to represent the most detailed view of the
application. A solution was created which represented each of the log entries as a node
which was structured in a grid format. The user could choose to expand a given node
which would show details such as fault type, unit IDs, arm state, and so on.
Figure 12.1: Bar chart for added level of detail
104
CHAPTER 12. SPRINT 3
The prototype only contained the view for the first level of detail, the line chart. Before
conducting usability tests the other two views were implemented. Polishing and reviewing
the GUI also took place during this sprint. The color scheme was changed because the
prototype color scheme felt too distracting. Structure of the layout, as well as template
icons remained the same. Throughout the iterative approach of designing the user interface,
there was always a focus on not designing graphic elements that may not be used. This
was done so that we would not spend time designing which would not produce anything for
the final program. In addition to implementing views, a new panel for filtering log events
and a panel for loading the log file were added. Designs on these panels were based on the
background of the main body to ensure consistency throughout the user interface.
Figure 12.2: Panel for filtering log entries
After conducting the usability test the following was commented by the customer about
the GUI:
• The customer expressed that he would like a list instead of entries instead of graphical
representation of an entry when it comes to the the most detailed view. This was
so that he could easily see the order in which the events appeared, and probably be
able to look at more nodes at the same time.
Based on the feedback from the customer, the last view was changed to a list structure.
Each list entry represents a log entry. The list entries can be expanded which gives the
internal structure of the log entry and all relevant information. Functionality for making
comments to an entry as well as storing entries in the side panel was also added.
105
CHAPTER 12. SPRINT 3
Figure 12.3: List view for a detailed look of log entries
12.3
Functionality to search for keywords in the log file
This was accomplied by applying seach results as filters. This gave the user enough visual
feedback for what they had searched about and made it easy to revert seaches and see the
effect of each search. While the search function is very limited it is one of the functions that
is a prof-of-concept of what could be done, and it something the the group can develope
futher if time is availible.
12.4
Functionality to save and load projects
This was one of the requirements the group was unsure about how to do. This was delayed
to sprint 4 for this reason as more prestudy was needed before this was tried.
12.5
Functionality to view information about a single
event
This is accomplished in the EventlistView where each event in the list should be expandable
and show the relevant infomration found in the log file. While the functionality of merging
in logfile with the xml files was not done this sprint the result was that you can get the
information from the log file atleast.
106
CHAPTER 12. SPRINT 3
12.6
Usability testing
The group invited Autronica to participate in the user test, and three employees got
assigned to complete it. The three test objects were placed in separate spaces along with
one or two group members, and were asked to complete the five assignments if they were
able to, to think out loud and to always mention where on the screen they were looking,
what buttons they press and why, and what they expected to see when they interact with
the program. At this point a lot of the main functionality was already implemented, but
far from bug free.
12.6.1
Results
The group got a lot of feedback during the user tests. After the tests, the group and
representatives from the customer sat down and discussed the findings, evaluating what
should be the group’s focus and what can be neglected. This chapter will include and
discuss the findings of the tests and the preceding evaluation. Bugs and faults found
during the test will not be included.
Zooming function
During the test the zooming function had several small bugs and was not fully implemented,
but unknown issues were discovered as well. All the test subjects understood that they
should be able to zoom in on the graph. The intuitive way to do this was either clicking,
dragging or scrolling. If one should scroll to zoom it was important that the center of the
resulting graph was kept by the cursor, because having to scroll sideways afterwards felt
tedious. The group decided to implement a zooming tool that allows the user to draw a
square, and all nodes inside the square will be drawn in a zoomed graph. The zoom will
then remain when adding filters or changing views.
Colorcoding
Colorcoding different events was a very appreciated feature, but it is important that each
type of event have the same color at all times, and it should not change after applying
filters. Color coding should also be applied to the list view to ease sorting filtered events.
“Tools” section
The first design prototype included a “tools” section on the left side of the screen. Later
in the development it became clear that the only tool we need is a magnifying glass for
zooming. The tools section should be removed to allow for a bigger view of the charts, and
the magnifying glass moved to a more suitable place.
107
CHAPTER 12. SPRINT 3
Barchart
The test subjects agreed that the barchart was good and gave a lot of information. Here
several test subjects tried to zoom or click a bar to get a more detailed view with smaller
time intervals. This should be possible using the zoom function. Some test subjects argued
that this graph was a lot more informing than the line chart, but agreed that it is necessary
to have both for large logfiles.
Saving important findings
During the tests it was pointed out that there is no way to save important findings, thus
creating a need to have a lot of open tabs which can become confusing. The ability to mark
nodes as important and save them in a “significant node” view on the screen was greatly
welcomed. The test subjects also suggested being able to save the state of the program
and load it at another time, not having to lose all the progress if the computer shuts down.
Filters
The addition of filters made finding specific events a lot easier. One should be able to
doubleclick a filter and automatically add it without having to press several buttons. Filters added should be viewed on the top of the charts with the ability to directly remove
them without opening the “filters” section. At the time the group already had plans on
implementing more filters, which was greatly appreciated. Being able to add filters within
filters was suggested, but not regarded as important.
Node chart
The nodechart was in an early alpha stage during the test, and the findings were surprising.
The test subjects did not appreciate the idea of using circles to represent nodes as well as
the group thought, and a more standard list view was requested. The list view will allow
for viewing more events at the same time, and increases readability. Using color coding
and filtering in the node chart should simplify the process of finding a specific event. The
node chart should also not include information that is already in the filters, e.g. if filtering
on only fault events, the nodes should not be titled “fault event”. The nodes should never
have event ID in the title because it is unnecessary when they are already sorted on it.
The x-axis
The x-axis on the graphs should display text horizontally to be readable. Dates and time
should also be viewed in a Norwegian typesetting (dd-mm-yy 00:00) instead of American.
It was suggested to include more details on the x-axis, but this was neglected once the test
subject understood how the other views will solve the same issue. If there is too many
points on the x-axis all the text will be unreadable, and a proposed solution is to only have
text to explain the axis value at set points.
108
CHAPTER 12. SPRINT 3
File loader
The file loader was simple, and all test subjects managed to open the correct files without
any big issues. The wanted type of file could be more highlighted where one chooses a file
to make it easier for users that are not familiar with the log system. It was pointed out
that it is important to hide irrelevant files in the file explorer. All the files (event, unit,
fault) always have the same name, which could be used to make uploading files smoother.
Information from nodes
The system sorted all events based on time. This is not correct because the clock may
change and cause events to be sorted in the wrong order. Therefore it is important that
the system sorts events based on each events’ entry ID. This was considered a top priority
change because the system could become harder to use than the existing solution, which
would be a big setback. The information from the nodes should also be displayed correctly
and information from the fault- and unit files must be merged with all fault files.
Tabs
Tabs are good for using different filters and nodes. Instead of applying different views to
different tabs and keeping them there, a new tab should open a new, reset line chart of the
log file, and the user can choose filters or zooms as they see fit. There should also not be
three tabs open at all times, but one should be able to open a new tab when necessary.
12.6.2
Evaluation
The group and the representatives from the customer discussed the test and the results.
The group describes the features and fixes that was already being worked on, and the
customer had some features they would like to add based on the user test. Because this
was at such a late stage in the project none of the new additions would become hard
requirements, but it was strongly wanted from the customer’s side.
This list represents in a prioritized order features that should be implemented before
the deliverance of the project.
1. Nodes and the x-axis on the graph should be sorted by sequence number instead of
time
2. Changing between views in the same tab should not influence the level of zoom
3. Names of the different filters should be more readable
4. Saving the state of the program should be possible, including tabs, filters, zoom and
nodes marked as important
5. The ability to only load the log-file without the unit and fault file would be usable.
109
CHAPTER 12. SPRINT 3
6. Implementing a free text search function that works like a filter could be time consuming, but usable
7. Removing the “tools” section and replacing the space with a bigger graph.
8. Big fixes, especially in filter.
It was also explained that the customer would like the program to be so understandable that they can send it to their own customers to analyze their own log files.
This requires a whole new level of understandability that the group was not prepared
for, including changing all codewords into human language. To do this the group
would need a more detailed education about what each code word or symbol in the
files represents, and the customer would not be able to provide this in reasonable
time. Therefore this is not set as a requirement, but the group will keep it in mind
nonetheless and try to increase understandability and use human language when able
to.
12.7
Sprint Review
The sprint goal was completed in time, and the usability test gave the group a lot of
feedback, which was exactly what we wanted for this sprint. The customer was satisfied
with the amount of work done, and agreed that the usability test was a great addition,
and would improve the final quality of the product. However, several issues arose which
the group was bound to tackle.
The main issue this sprint was to present all the functionality the group wanted to
include in a respectable manner for the customer to see. We would not be able to have bug
free final versions of all the functionality, but we wanted to have so few bugs that the test
subjects would not focus on the detail issues on the user test. This required more work
hours than the first and second sprint, and along with writing the report, this sprint ended
up being fairly more stressful for all group members.
Usability testing proved very useful, since the customer for the first time during the
project proposed concrete additions to requirements. This resulted in the Scrum backlog
being edited for the rest of the project, which could not have been done later in the
development phase.
For the usability test, the customer representative brought along one co-worker that
had not been introduced to our project before. Even though he had little knowledge of
our solution, he was well aware of the concept for the project. He provided some feedback
on big requirement additions that would change the focus of the project, which after some
discussion was neglected in order to focus on finishing a functional software before the
due date. However, the group decided to keep in mind that the system is to be used by
many users with different opinions, and a presentation of how the software could be further
developed will be included in the report.
Absence from the group meetings was a big issue this sprint due to several cases of
short term illness and one case of long term illness. This threat was included in the initial
110
CHAPTER 12. SPRINT 3
risk assessment, and the group used the predefined strategies to avoid the issues damaging
the project. However, it was discovered that the planned strategies would not suffice if
several group members were ill at the same time. This resulted in the prototype of the
functionality being less operative than expected, which would make the backlog for next
sprint bigger than planned.
12.8
Sprint Retrospective
We should continue to...
• ...have good meetings and workshops
• ...having a good communication framework to help each other
• ...having a good work moral and striving to achieve best possible results
• ...work hard these last weeks
• ...resolve work packets
We should start...
• ...using the Trello scrum board more efficiently
• ...using partial deadlines to prevent work being help off until the end of the sprint
• ...rewarding ourselves for good work done
• ...sharing information about meetings and results more efficiently
• ...acknowledging we have read messages
We should stop...
• ...pushing all implementation towards the end of each sprint
• ...neglecting administrative work such as presenting work hours
• ...being late for meetings
• ...speaking Norwegian
111
13 | Sprint 4
This chapter reports on the fourth and final iteration of our project. Section 13.1 contains the Sprint Planning, section 10.3 the Sprint Review, and section 13.6 this sprint’s
retrospective.
13.1
Sprint Planning
Having received the customer feedback at the first iteration of usability testing, the adjustments to the product backlog were far more severe than we had anticipated. As the
program was nearly in its complete state, the customer could easier find out what features
they thought should be added to the program and what features should be improved. We
discussed these features at the sprint review for sprint 3 and agreed that they should make
a prioritized list of them so that we could focus on the most important ones. Following is
the list we worked out in collaboration with the customer:
1. The log events should be sorted on sequence numbers rather than time. The timestamps were not trustworthy and did not necessarily represent the events in chronological order.
2. The transition between views should be improved. Filters should be remembered
from view to view, in addition to zoom scaling. As of before sprint 4, changing from,
for instance, line chart view to bar chart view caused the zoom scale to reset.
3. Mark an event for later reference
4. Saving functionality.
• Should save all tabs
• Should save the filters applied to each tab
• Should save the events that were marked as important
• Should save all notes from a previous session
5. Support the ability to take notes on a specific event within the program.
6. Support loading of log file without loading the xml-files.
112
CHAPTER 13. SPRINT 4
7. Tools in separate screen
8. Support a search function.
9. Remove or reduce various design elements in order to make space for the views.
We made clear to the customer that due to the time constraint of the project and the
severity of change to our product backlog, it was unlikely that we could check all the items
off of their prioritized list. We had to focus on the report and presentation of our product
as well, and the customer understood our situation. We promised to put in extra hours
and try our best to fulfill as many of their wishes as possible. The development team made
a new prioritized list based on the customer feedback and estimated time for each task. It
was important for us to finish the tasks that we set out to do, so we modified the prioritized
list so that it took the estimated time for each task into consideration.
13.1.1
Duration
Sprint 4 lasted from the sprint planning meeting November 3rd to the sprint retrospective
on November 15th. This sprint was shorter than the others so that we could have time to
finish writing the report and prepare for the presentation of our product.
13.1.2
Sprint Goal
The goal of sprint 4 was to provide the customer with a program that they would find both
usable and useful. Our initial goal of the project was to reduce the time used for analyzing
log files by 50 per cent. Since their previous workflow would change in order to utilize our
program to as high a degree as possible, there was no way of actually knowing how much
time they would save by using our program without them having learned to use it first.
13.1.3
Sprint Backlog
• Bug fixing and print info
• Add TimeFilter
• Add Method Filter
• Add UnitFilter
• Add tab for each filter added
• View for adding filters
• Update NodeView to list
• Add support for saving state
113
CHAPTER 13. SPRINT 4
• Support tabbing with multiple views
• Transition between views
• Zoom by adding filter
• Important events sidebar
13.2
GUI - Final Review
The final sprint mainly contained polishing the layout and adding changes that the customer wanted from the second usability test. These changes includes:
• Removing the left column(view dependent tools)
• Make the top toolbar slimmer
• Make the right column(saved log entries) removable by the user, further extending
the main view
13.2.1
Review of GUI in respect to design guidelines
As a review of the GUI, this section will go through the guidelines first introduced in
chapter 5.1.6 and see how they were applied to the product.
Figure 13.1: Final layout of main screen
114
CHAPTER 13. SPRINT 4
Rule One, Put the user in control
• Be wary of using different modes of a user interface. The application does
to some extent use different modes if we look at the different charts as modes. The
functionality of the application does not change when we switch do a different view
state such as the bar chart, which avoids the main issue with having different modes.
It can therefore be concluded that this principle was followed.
• Allow users to choose between different input methods. The application has
indeed implemented features to support keyboard as well as mouse actions. Standard
key combinations such as [Ctrl + S] for saving and [Ctrl + O] for open are implemented. Using only keyboard for navigating the graph would be so inefficient that it
was decided not to be implemented.
• Allow for users to take a break from using an application. The given state of
the application does not depend on any previous states, meaning that the user does
not need to remember anything from previous steps when working the the GUI. If
the user decides to close the application completely, there is support for saving the
users current work. When the user decides to continue with the saved file then the
state of the application will be exactly how he or she left it.
• Display appropriate messages and text. Displaying text and messages is not
very applicable to this type of application, however it is employed in some instances
such as trying to open a file without having selected a file. When this happens text
appears telling the user to select a file.
• The user interface should provide feedback. The user is almost always provided
with feedback when an action is taken. If the user clicks the button to switch the
view to the bar chart, then this will indeed happen. There is no functionality that is
provided to the user which just does background work, without giving any indication
that something happened. Each action has a direct influence on the user interface.
• Provide ease of navigation. This point is less applicable because there is not much
navigation within the application. The only form of navigation is switching to other
user generated instances of the views which is implemented with a tab structure which
should be recognizable for users with basic experience with computer applications.
• The user interface should be usable for users with differing skill levels.
Most of the functionality is implemented with a one click action. It should therefore
not be any additional functionality for expert users.
• Make the user interface transparent. The user interface has been made as transparent as possible with users being able to manipulate the graphs directly without
having to plot values to change the current selection of log entries(the application
supports value input as well if this is preferred by the user). GUI elements such as
sliders and add boxes have also been employed to give users additional abstraction.
115
CHAPTER 13. SPRINT 4
Figure 13.2: Final layout with filter panel
Rule Two - Reduce the users’ memory load
• The interface should relieve the user of short-term memory. As stated
earlier, the user does not need to remember certain actions to be able to perform any
action.
• Rely on people recognizing instead of recalling. Icons are designed in a way
that should give clear indication of what they do. Standard icons for zooming actions
are also employed. Filters that the user employ are also displayed at all times, so he
or she does not have to remember which actions the user took to get to current state.
• Provide visual clues. N/A
• Give the user an option to save. Users have the opportunity to save their work
using the standard file menu.
• Provide shortcuts. N/A
• Incorporate real world objects. N/A
• Provide easy access to common features. All features of the application are
provided in the main view. Actions are represented as icons. Adding filters is also
very accessible with a single button click.
116
CHAPTER 13. SPRINT 4
• Organize information presentation. Information presentation is only applicable
in the most detailed list view of log entries. The structure of data within an entry
is structured the same way as it is in the log which should be familiar for users who
are used to working with the log file.
Figure 13.3: Final layout with filter panel
Rule Three - Make the interface consistent
• Keep the context of the user’s task. Manipulation of the graphs is only supported by mouse actions, the user does not have to change input mediums while
performing an action sequence.
• Make sure results from actions are consistent. Functionality is not dependent
on the current state of the user interface.
• Provide aesthetic appeal with focus on product functionality. The layout
has tried to maintain a consistent color scheme throughout, icons have the same
frame and buttons that do similar actions or are organized in a group have the same
layout. Main focus of product has however been on the functionality it provides, as
the customer agreed to.
• Strive towards encouraging exploration. The application has a very specific
set of few tasks that it delivers, so the user should not need to do much exploring
of the user interface. If additional functionality is introduced to the product, then
implementing processes for easy navigation of the user interface is recommended.
117
CHAPTER 13. SPRINT 4
As shown, all applicable guidelines have been followed to the extent that is possible.
Some of the principles are not applicable for this type of application denoted as "N/A".
The acceptance test shows that the customer was generally happy with the layout(there
were some visual bugs that were sorted out later) even though they did not think this was
very important for the application.
Figure 13.4: Final layout of bar chart view
13.3
Testing
13.4
Usability testing
A lot of changes has been made to the program before this user test, most of them based
on feedback from the first usability tests. On this test the customer provided only two
employees for our testing, which is under the predefined minimum of three user tests per
iteration, but for the tests being able to give us valuable input and allow us to improve
the program accordingly, the tests must be conducted with best possible effort within
reasonable time. For this user test the team decided to start off with a demonstration of
the software and its tools, before the test subjects could provide feedback and discuss with
the team what needs to change and what is working correctly.
118
CHAPTER 13. SPRINT 4
13.4.1
Results
This user test mostly provided feedback on small bugs and issues, along with some GUI
feedback. Some comments on the functionality were also received which the team appreciated.
Saving functionality
The saving functionality was not fully implemented before this test. Saving functionality
is still a top priority and must be fully functional before the project is over. The state
of the program should be saved in some nameable file and can be, if the user wants to,
opened as a new project. The ability to load saved work should not be done without the
user intend to do it. The appropriate solution will be to have separate menu options for
creating a new project and opening old projects. The customer informed the group that
the unit-, fault- and logfile is always places within the same folder on the computer, and
the group should save the project file in this folder.
Notes on important events
The notes on important events should be more visible, and it should be easier to see which
events have notes on them. This could be done by adding some text or an icon to an event
in the list view. Viewing notes on events is only considered relevant in the list view.
Information from the log file
All the information from each event should be displayed in a tree structure in the list view,
having the same indents as in the log file.
Using fault- and unit files
The unit- and fault files are fully parsed within the program, and the information gained
from them should be merged with the information from the log file to create event nodes.
This is essential for the customer since the current state of the program, which only displays
information from the log file, requires the user to open the fault- and unit files when
working. This functionality was not yet completed during the user test.
Simpler search functionality
The implemented search functionality requires the user to be very familiar with the log file
and its structure. The customer would like to have some simpler search functions to make
some things easier for themselves and their customers. This includes the ability to search
on keywords "alarm" and "...". It should also be possible to filter on these keywords.
119
CHAPTER 13. SPRINT 4
Zoom functionality
The zoom functionality is too difficult to use. The level of zoom should not be changed
between views. When zooming in on the barchart or linechart graphs, the graph should be
redrawn with more detail. Zooming in on the barchart should not change the color coding
on different event types.
GUI design
The customer does not want us focusing too much on design and GUI, but since usability
is the highest valued quality attribute in this project, and the main focus of the usability
test, it should also be evaluated. The icons are mostly understandable except one white
button that does not work. This should be removed. Menu bars should be made slimmer
to allow for even more focus on the graph and tools. The "saved important events" menu
should be optional to view, since it is not always usable. When this is hidden, the graph
should be even more enlarged.
The colors and placement looks good, except the yellow print on white background in
the main menu. This should be edited to be more readable.
13.4.2
Evaluation
This last usability test gave the team good feedback on small usability issues and design
problems that should be changed. Some of the most discussed functionality was already
being worked on by the team, and it ensured us that we were going in the right direction.
The customer representatives was very pleased with our work, and expressed that the
program was already very usable and that the goal of creating a software that was easier
to use than the current solution was already achieved. The group is very motivated to
continue improving and completing functionality to provide our customer with the best
possible solution.
13.5
Sprint Review
The sprint review for the last sprint was held on Friday November 14, one day before the
sprint finished. It was held immediately after the final acceptance test where the customer
approved of the items having been completed during this sprint.
We agreed that we had fulfilled all the backlog items chosen for this sprint, including
the new adjustments prior to this sprint. They were satisfied that we had managed to
change the program to such an extent in so little time.
Challenges for this sprint was mostly the time constraint. All members of the development team was taking other courses in addition to this one, and so it was difficult and
energy-consuming to put in all the extra hours required to reach our goal. Fortunately
there were no sick leaves and we were all highly motivated to produce a good result.
We managed to complete all the items chosen from the product backlog.
120
CHAPTER 13. SPRINT 4
13.6
Sprint Retrospective
For this sprint retrospective we focused especially on giving each other positive feedback.
This sprint was the last iteration of our project, but we still needed to deliver the report
and give a presentation at the end, so we used the last retrospective to boost each other’s
morale before the final days of hard work.
13.6.1
We should continue...
• ...working hard.
• ...sharing responsibility.
• ...communicating.
• ...setting deadlines in order to reach our goals.
• ...believing in our work.
13.6.2
We should start...
• ...updating each other more often.
• ...feeling the pressure.
121
14 | Evaluation
In this section we will talk about what we have learned, what we have done well and what
could have been done differently. Since non of the group members had a lot of experience
with working on bigger projects like this, the team learned a lot during the process.
14.1
The process
This section is more in-depth about the process and our evaluation of it.
14.1.1
The team
The team was randomly put together from students taking the course, and most of the
group members didn’t know each other from before. We were six Norwegian students and
one student from Mexico. Because of this it was early established that all communication
should be done in English, which didn’t provide much a problem since all the group members speak and write English fluently. One of the first thing the team did was decide on
the goal for the project, which was really important. This way everyone knew how many
hours one should work each week, and we all had the same goal in mind. One of the most
important qualities the team had was the ability to stay motivated and motivate each other
even when we had a lot of work to do and it could seem like we would never reach our
goal. This has been the main driving force of the team.
14.1.2
Scrum
We decided to use Scrum as development framework, since this is what we have some
experience with it and the customer is used to work this way as well. The group started
out with assigning different roles to use throughout the project, except for the Scrum
master which was changed for each sprint. Before we chose role we discussed the strengths
and weaknesses of the different group members which was very helpful to establish early,
and most of the roles worked pretty well. The reason the Scrum leader changed each week
is because we wanted different group members to have the opportunity to try the leader
role. This had both positive and negative effects for the project. The good part about
this is that each scrum leader had different thoughts on how things should be organized
an had some minor things to improve from the previous one. This also made it easier
122
CHAPTER 14. EVALUATION
for the scrum leader to discuss issues with other group members as more people had an
understanding on how the scrum leader role was. The negative effect of this is that that
for each new sprint the scrum leader was inexperienced and it took some time for the new
scrum leader to adapt to all the assignments and responsibilities it brought with it. For
the project it would probably been better if we had chosen one scrum leader for the entire
project, but for learning purposes this work out very well.
14.1.3
Workflow
We tried to use Trello as our Scrum board, an use this board to always have an updated list
of what we worked on. One of the biggest weaknesses of the group, which is also reflected
on the retrospect, is that we were never able to keep this up to date. It is hard to say what
we could have done differently to get better at this, but one thing we could have done is at
the start of each meeting check up that the board was up to date so people got used to work
with the board. Instead we were good at communicating what we did through Facebook,
which is probably because the group members had more experience with Facebook and
used this a lot for other purposes as well.
One thing we saw a lot of improvement on was the quality assurance of the project.
We used the same method to QA the code and the report. When one part was done we
created a pull-request on Github, made someone else look on it, and if it was good enough
merge it into the report or the code base. For some group members this was a new way to
do work and it took some time before everyone was able to work this way efficiently, but
towards the end everyone learned this workflow and was able to QA. One problem we had
is that we were sometimes a little bit too quick to merge the pull-requests and probably
should have used more time on QA, and give feedback before it was merged. We had some
incidents were the code merged broke some old functionality which should never happen.
Something that worked very well for the group was to set hard deadlines on when
different tasks should be done. This made us work more efficient, and made it easier to
keep track of what people were working on and when we could expect the tasks to be done.
This also made it easier to ask for help, as the group members would usually ask for help
if the task they were working on was to large to do on time. This is something we would
have started with right away if we were to do things again.
14.1.4
Communication
As we mentioned earlier the communication between the different team members worked
well, and Facebook proved to be a good platform for this. The thing we improved most on
regarding communication was that we got better at asking each other for help and telling
when we weren’t able to get tasks done by ourself, which we had some trouble with the
first weeks. We also had good communication with the customer, though there were some
problems. One problem is that the customer often used a couple of days before responding
to emails, which led to some uncertainties with when the customer could have meetings.
We also didn’t get a lot of feedback on how the customer wanted the product, which did
123
CHAPTER 14. EVALUATION
make it hard to decide on how to do the tasks at some points. Here the usability tests
proved very useful because this is were we actually got some feedback we could use to
improve the product. This also gave us a deeper understanding of how they worked, and
how our product could suit their needs better.
14.1.5
Mood
As described in the compendium the group kept track of how the general mood was at each
meeting. Even though the number describing the mood could be dependent on specific
events that occurred at that time, it gives an overall picture on how we felt the project
were going at any given stage of the process. A graph representing the mood throughout
the project is shown in figure 14.1.
Figure 14.1: example caption
The graph shows that the mood has been pretty good throughout the project, which
is probably because we have had a good team dynamic and high motivation. We see that
the graph spikes at the end, this is when we were close to the deadline and were really
motivated to get the last bit of work done.
124
CHAPTER 14. EVALUATION
14.2
The customer
The customer was very enthusiastic about the product, and very helpful when there was
something he could contribute to. Even though we are pretty happy about the customer
and the task he gave, there were somethings that we thing could have been better. One
of the main problems is that our contact at the company traveled a lot, which led to us
having different persons to be product owner throughout the project. This in itself would
not provide much of a problem, but it seemed like the different persons we had as contacts
had different thoughts about what they wanted from the product. The first person wanted
a graphical representation, while the second one wanted a program their customer could
use and the last person wanted a program to filter different events. This led to a lot of
requirement changes during the project, and a little less polished product than it could
have been if the customer had agreed upon what they wanted before they asked us to make
it. There were also a lot other requirements that changes during the project, but this is to
be expected when working with a customer.
14.3
The task
When we got the task we were pretty satisfied as this seemed like a product we could be
able to get done during this semester. The customer was also really helpful, and eager to
help us create the best possible product for him. One problem we had is that we thought
the task would be easier than it proved to be, and led to some time problems at the end
when we were to finish the product. One of the hardest part of this task was to understand
the domain we worked in and what they really wanted from the product, in order to find a
solution that would suit them. As our assignment was very open, and the customer didn’t
give us much feedback it took some time before we got the requirements for the product
correct. This is something both our team and the customer could have done better from
the start. It didn’t seem like the customer knew what he wanted at the start of the project,
which we think should be the case before we started with the work.
14.4
The advisor
It was very helpful to have an advisor to help us throughout the project, and make sure we
were on the right track. The advisor is really a valuable resource which we should have used
more from the start. What we did after some weeks was to have a short meeting before the
meeting with the customer so we could prepare some questions and expectations for the
meeting. This helped a lot on the usefulness of the meetings. We would have wished that
the advisor could give us more feedback though. It seemed that she didn’t really prepare
well for all the meetings and keep up to date with what we were doing. What could have
been more helpful was if the advisor read the drafts from the report and could give us
some feedback on the content and if it was appropriate rather than just look at the list
125
CHAPTER 14. EVALUATION
of content and tell us how it should be structured. We would also have liked some more
tips on how we could work better with the customer to make sure to get the best result
for them.
14.5
Further work
Even though we reach all the goals for the project there are a lot of improvements to be done
with the product. One thing the customer would like from the product for further work,
which was not a plan for our project, is to make it more user-friendly for their customers
and not just be a tool for them to use. This means that a lot of the information from the
log files should be translated to more understandable information. As this requires a lot
of domain knowledge we think it was the right choice not to focus on that for our project.
It should also be possible to detach the different tabs in the program so one would be able
to work on multiple screens.
Our focus was on getting all the functionality the customer wanted in the product, as
this was the request from the customer. This led to a lot of GUI-work to not be prioritized.
If this is a program Autronica want to present to their customers, there probably should
be some changes in the GUI. There should be some colour changes, as well as some layout
changes.
If we were to estimate, we would probably say that for the product to have this improvement one would need about 300 hours.
14.6
Suggestions for the course
The course was really educational, and learned us a lot on working in teams and with
customers. We would have like to get some more help from the advisor though. One thing
that would have helped is, as mentioned, if the advisor before each meeting read through
the changes in the report, and the documents received with how the other work was going.
This would probably lead to more useful meetings. One problem is also that since the
customer gets the product for free they get no notion on the cost of the different tasks.
This make this project quite a different situation from what you would have working with
real customers. It would also be helpful if the customer had a clear understanding of what
they wanted before the project started.
14.7
Summary
The team is really satisfied with the product and what was achieved during the project.
We have to say the project is a success, and we were able to meet all the requirement we
agreed upon with the customer. There was a lot of work that had to be done to understand
the domain and design a solution to suit the customer needs. The most difficult part
was to design a good solution for the customer, as the implementation itself was not to
126
CHAPTER 14. EVALUATION
complicated. We learned a lot during the process, and would probably have done some
things differently if we were to start again, but that is usually the case for most projects.
As this now is a working product that can help Autronica in their work, and they are very
happy with the result we have to say that in the end everything worked out great, and we
are very satisfied with the effort of each team member.
127
15 | Conclusion
In this chapter we will summarize our work, describe our final solution before we discuss
whether we were successful or not. Finally, in this section we will present the product
owner with our suggestions for further development of both concept and application
15.1
The Process
Prior to this project, Autronica Fire and Security AS manually read through their event
logs in order to analyze them and provide feedback to their clients. The process was timeconsuming and they sought to improve its efficiency. Although certainly possible, they had
no initial thoughts as to how their problem should be solved, apart from the fact that the
event logs should be presented in a graphical and user-friendly way.
Our first challenge was to come up with a concept of solution that would suit our
customer’s needs. We needed a product that would significantly reduce the time used
analyzing event logs. As the project progressed, we made use of an iterative development model that helped us gradually understanding our customer’s intent and to modify
our current solution thereafter. After 13 weeks of hard labor and a motivated team, we
have managed to fulfill all product backlog items and finished a fully functional event log
analyzing tool for our customer.
15.2
Product Overview
Autronica Log Visualizer (ALV) is a JavaFX application for analyzing Autronica event
logs. The application’s input is an Autronica event log and its related .xml-files. ALV uses
these to present information to the user through different views, namely line chart view,
bar chart view, and tree view. The user is able to use these views to narrow down the
number of events, take notes on them and mark them as important for later reference. The
application supports a search function, various filters and saving functionality in addition
to the aforementioned views.
The solution the group have made have archieve the goals for the project. The program
that is made is something the customer have approved satisfies what they wanted, this is
confirmed in the acceptance test done together with the customer. There is no doubt that
the efficency of the log analysing have gone up with the help of this program, and the
128
CHAPTER 15. CONCLUSION
usability of the program compared to analysing the logs for hand is a huge improvement.
The solution is also user-friendly and easy to learn, and it should be no hard challenge to
learn to use this tool. Whiel the domain-knowledge still needs to be high to understand
the content of the log files, this program will help more easily learn the domain and get
new log analysers avdantages over the old system.
15.2.1
Architecture
The system architecture at the end of the project is nearly the same as what was planned
in the planning phase of the project. See architecture chapter 8 for reference. This proved
to be invaluable for our implementation, as it saved us a significant amount of time that
would be spent restructuring our code. Instead, we could focus on the items in the sprint
backlogs.
We have managed to produce a product with modifiability, usability, performance and
testability in mind, as was initially our intention. We provide a high test coverage, have
implemented a intuitive GUI, and had no issues with performance in either of the sprints.
Due to the architecture, implementing new features, as expanding the filter function, adding
other graphical views, and improve the search function to be more extensive will prove to
be undemanding for the developers who will take over the source code.
129
Bibliography
[1] M. C. S. J. Ben Shneiderman, Catherine Plaisant. Designing the User Interface, strategies for effective human-computer interaction. Pearson, fifth edition edition, 2009.
[2] T. Inc. About trello, 2014.
[3] G. S. James Gosling, Bill Joy. Preface, 1996.
[4] R. K. Len Bass, Paul Clements. Software Architecture in Practice. Addison-Wesley,
third edition edition, 2013.
[5] Microsoft. Log parser 2.2, 2014.
[6] J. Nielsen. Why you only need to test with 5 users, 2000.
[7] M. Pawlan. What is javafx, 2013.
130
Glossary
latex Is a mark up language specially suited for scientific documents. 1
131
A | User Manual
132
APPENDIX A. USER MANUAL
A.1
User Manual
This appendix contains the user manual for the program. It tries to document all the
features of the program and how to use them. The user manual is intended for the end user
that got some experience with the log files they are analyzing and want to use this program
to do the analysis.
A.2
Start the program
Figure A.1 on page 133 shows the start screen for the program. You are given two choices
when you start a program.
• You can open a new log file with or without the supplementing xml-files
• You can open a saved file (The save file must be in the same folder as the log)
Figure A.1: Start screen of the program
133
APPENDIX A. USER MANUAL
New log
Opening a new log file is done by selecting a log file and the optional xml files by clicking at
the appropriate button. All the files must be opened now, you can’t open them at a later
point. You will use a native explorer window to select the log files, and when done you
click load. This will load the log file for you and open the default program configuration.
Load log file
When you have used the program you have the option to save the current session. You
can load a saved file at any point as long as the conditions in the list below is meet.
• The log file (and xml files if used) must be in the same folder as the save files.
• The log file (and xml files) must be the one you used when you saved the program.
When loading a file you use the native browser to select a saved program session (this will
be a txt file). This will load all the saved nodes you got, all the open tabs and all the
filters you got applied at the moment.
A.3
User interface
This section describes all the buttons in te user-interface. For a closer description on how
to use each of the functions mentioned here, check the appropriate manual section.
Main Screen
Figure A.2 on page 135 shows the main screen of the program. Under is a list of all the
features you can use on the main screen.
• 1. This opens the Filter Screen, this will be used to apply either an event filter or a
time filter to the currently selected tab.
• 2. This is the clear filter button, use this with care as it clears all the filter currently
applied to a tab.
• 3. This button will change you current tabs view to the Linegraph view.
• 4. This button will change your current tabs view to the Barchart view.
• 5. This button will change your current tabs view to the Eventlist View.
• 6. The + button will apply a timefilter to the the current view, the - button will
deselect the current selection (not reset the time filter), and try to redraw the view
to show more detail. The area you have selected by making a rectangle on either the
Linegraph or the Bargraph will be the filter parameters. (To select an area on one
of the graphs use your mousedrag to select an area.
134
APPENDIX A. USER MANUAL
• 7. This is the search bar, you can use it to do search in the currently open log.
• 8. The bar shows the currently applied filters (this is specific to the tab you currently
have focused).
• 9. This is the tab bar, it shows all the tab you have open at the moment.
• 10. This is the View window, this will be used to show graphical representations of
the log files.
• 11. This is the list of all the events you have selected as important.
• 12. This is the menu bar. It can be used to save and open log files and exit the
program.
Figure A.2: Main screen of the program
A.4
Filter screen
The filter screen showed in figure A.3 on page 136 is used to apply filter related to different
event types and event IDs.
135
APPENDIX A. USER MANUAL
• Event filters can be applied by moving event types from the Possible filters list to
the Selected filters list. Clicking Apply will apply these filters.
• A "timefilter" can be applied by either dragging the sliders or writing in the text
box. The sliders are limited to the maximum and the minimum event id in the log
that is currently open. The time filter will also be applied when you click the apply
button.
Figure A.3: The filter screen
A.5
Filter and Tab bars
This section looks at the filter and tab bars on the main screen.
A.5.1
Tab bar
The tab bar shows the tabs you got open right now. On this bar you can open new tabs
or close existing tabs.
• Each tab opens a new screen where no filters are applied.
136
APPENDIX A. USER MANUAL
• Each filter you apply is only applied to that tab
• Open tabs are saved as is when you save the program.
A.5.2
Filter bar
The filter bar is tab specific and shows the currently applied filters to that tab.
• Each filter that is applied will be showed here.
• You can removed filter easily by clicking the X on the filter you want to remove.
• The filters will be saved as is when the program is saved.
A.6
Search
The search function works by applying a filter on what you search. All events that match
the search will be displayed. To use the search you need to use the method described
below.
• Each search you do will be added as a filter to the filter bar and can be closed as a
normal filter.
• You can search on events, time and units
• To search on event, type: "event:EVENTTYPE "
• To search on unit, type: "unit:UNIT()" or "unit:UNIT(ID)"
• To search on time, type: "to:XXXX" or "from:XXXX", the id number must be in to
log from it to work.
• typing "alarm" will show all alarm events
• Typing "disabled" will show all Disable events
A.7
Views
There are three different view modes that helps you visualize the log files. They are the
Linegraph, the Bargraph and the Eventlist views. Each will be help you get different types
of information out of the log.
• The Linegraph should give you an estimate of how many events are in the log. It is
sorted on the event ID, so the dates you see aren’t necessary chronological. When
you apply filters this view will redraw itself to show the new information.
137
APPENDIX A. USER MANUAL
• The Bargraph should give you more information on what type of events are present.
The graph is sorted on event ID and each bar shows events that happened close to
each other in time. Each filter you apply will redraw this graph to show what you
have filtered on.
• The Eventlist view will show all the events that match the current filter. It is sorted
on event ID and this view lets you mark events as important to add them to the
important list. You can also make notes for the different events and both the important mark and the notes will be saved if you save the program. This view is the view
that will show the merged log and xml files. Each event will have one or two buttons
for the unit and the fault information. If the xml files are loaded these buttons will
show the information found in the xml files.
A.8
Zoom
The zoom tools can be used to apply timefilters in an easy way. This is done either in
the linegprah or the bargaph by drawing a rectangle by clicking and drawing in the graph
window. When you get the rectangle you want you need to click the + button to apply the
filter. To clear the filter again you must close it by removing to timefilter from the filter
bar.
A.9
Important Events
The important event list contains all the events you have marked as important in the
Eventlist view. The list is not dependent on the tab that is selected at the moment and
will show important events from all the tabs. Here you can deselect events, read all the
information about it or edit the note for that event.
138
B | Meeting Minutes
139
APPENDIX B. MEETING MINUTES
This appendix include all the meeting minutes from the customer meetings, advisor
meetings and the group meetings.
B.1
Advisor Meeting minutes
This section includes all the meeting minutes from the advisor meetings.
140
Advisor Meeting Minutes, 01.09.2014
What we’ve done:
● We met with the advisor ( Soudabeh Khodambashi) and the customer (Morten
Solli) for the first time 28.08.2014.
○ The customer introduced the problem and some pointers as to
what he expected from us.
■ We were to analyze and simplify log files from fire
security panels and to present the information in the log files in a more
user friendly way to save time.
● The customer encouraged us to use Scrum since this was what he was used to,
so that it would be easier for him to take part of our process and to share his own
experiences.
To do:
● We should start writing the report immediately.
● We should define the chapters of the report this week.
● We should assign main responsibility areas ( who has the responsibility for the
report, customer relations, communications, programming)
● We should deliver a progress report every week when we meet with the advisor.
Our first due date is Friday 05.09.2014. The progress report should include...:
○ ...which problems we’ve had.
○ ...questions that have arisen since last time, for either the advisor
and/or the customer.
○ ...the plan for next week.
○ ...the latest version of our final report.
● We decided to meet with the advisor 11.45 wednesday 10.09.2014
● We should come to an agreement on how many hours each person should use
each week. 25 hours.
● We should write a requirements analysis.
● We should create each chapter, and project plan till next time.
● We should figure out which software to use. (Edit: we will do this at the end of the
first scrum cycle)
● We should write the first chapter before the meeting on wednesday.
● All e-mails addressed to the advisor should be marked with group 2 and subject
code.
Advisor Meeting Minutes, 11.09.2014
We should estimate hours per task, and then report how it went
Gant diagram.
We’ve set up a meeting with the customer the 19th.
She wants us to write an introduction.
Chapter 1:
Introductory. Needs an introduction.
Planning and requirements.
Chapter 2:
Preliminary study.
We need a chapter for evaluation:
Risk assessment.
A help document for the user. User Manual.
We should send her a layout (or what we have so far) of the final report, with a “complete”
introduction to the project. Due date first-coming monday, 12.00.
Meet again monday 2.
Meeting Minutes
September 15th, 2014
Attendees
Christopher T, Rune A, Jonas K
Scribe
Jonas K
Agenda
●
●
Old Business
○ What have the group done so far
○ Status report and draft of final report
○ Responsibility
New Business
○ What will the group continue to work with
○ Documents for next delivery
○ Next meeting
Old Business
●
●
What the group have done so far. The group have been working on the first sprint,
which will end this week (19.09.14). The group had a workshop on Thursday 11.09
after last adviser meeting, where requirements and different design ideas was
discussed.
Status report and draft of final report. Documents delivered to adviser should have
been delivered, to get feedback on how the group is doing. The draft of final report
●
wasn’t delivered before the advisor meeting, so the group didn’t get any feedback on
this. The final report should be delivered within this day (15.09) or absolute deadline
tomorrow (16.09).
Responsibility. The group discussed with the adviser their responsibilities for the
project and this sprint, so the advisor would know what each person of the group is
working with.
New Business
●
●
●
What will the group continue to work with. The group will continue to work with
getting the first sprint done until 19.09 before the customer meeting, which will also be
a end meeting of the sprint.
Documents for next delivery. Before every advisor meeting, both the status and the
draft of the final report should be delivered to the advisor. This to better prepare the
advisor for the next meeting. This is important task that should have a high priority for
next meetings. Also a plan for the next sprints should be delivered with their estimates.
The requirements should be put in the final report. The deadline for deliver these
documents is 19.09 after the customer meeting.
Next meeting. Will be held Monday 29th September at 14:00.
Next Meeting Agenda Items
●
●
●
.
What the group have done so far
Status and feedback of delivered documents
What will the group continue to work with
Advisor Meeting Minutes, 01.09.2014
What we’ve done:
● We’ve had some problems with sickness and various reasons for people not
working as many hours as they should. We’ve decided to
● We should have so
To do:
● Restructure Report: Problem description. Stakeholders. Why they should want to
do something like this. The tools they currently have. Report outline.
○ Introduction
○ Preliminary studies (assumptions to back up choices),
(Ownership), (Limitations),
○ Requirement Specifications(Use Cases, changes over time)
○ Planning (Methodology, Group communication, Time
planning(Gantt Diagram),
○ Quality Assurance and Risk Assessment.’
○ System Architecture and Tools, Restraints(Limitation)
○ Sprints
● Customer Meetings:
Advisor Meeting Minutes, 13.10.2014
What we’ve done:
● Finished sprint goals
● Worked more, but still not enough
● Problem description. Stakeholders. Why they should want to do something like
this. The tools they currently have. Report outline.
○ Introduction
○ Preliminary studies (assumptions to back up choices),
(Ownership), (Limitations),
○ Requirement Specifications(Use Cases, changes over time)
○ Planning (Methodology, Group communication, Time
planning(Gantt Diagram),
○ Quality Assurance and Risk Assessment.’
○ System
To do:
●
●
●
●
Restructure: Introduction
○ Problem Description
○ Project Name
○ Customer
○ Stakeholders (Who’s the customer) Check it up! Pretty sure
stakeholders include programmers.
○ Current solution, tools (What needs to be integrated)
○ Report Outline
Preliminary Studies:
○ Introduction
○ Existing Solutions
○ Desired Solution
○ Current Solution
○ Assumptions
○ Limitations
○ Product ownership
Requirement Specifications:
○ Introduction
○ Use-cases
○ Requirement Analysis
Planning
○ Introduction
○ Work breakdown structure
○ Gantt
○ Methodology
○ Milestones
●
Quality Assurance and Risk Analysis
○ Introduction
● System Architecture and Tools
○ Introduction
○ Architecture (Include figures)
○ Tools
● Implementation
○ Introduction
● Sprint 1
● Sprint 2 (All chapters before and including this one should be done by the
deadline on wednesday/thursday?)
● Sprint 3
● Sprint 4
PRESENTATION:
● We should prepare a presentation of our prototype, the architecture, code, the
report (How it works etc.) on next meeting monday. 10-15 minutes. All of us should be a
part of the presentation.
Advisor Meeting Minutes, 20.10.2014
What we’ve done:
●
●
First complete draft of the Final Report
15 min Presentation
●
Usability Test
○ 4 or 5 employees testing the program
Performance Test
Customer Feedback
○ Feedback about the graphical representation, such as tabs,
colors, position of elements.
Presentation
○ Make the presentation more extendable (detailed)
○ Less text in the slides
○ Add Roles slide (photos and area of representation)
Meeting with Advisor
○ No meeting next week, next will be november 3rd.
To do:
●
●
●
●
Advisor Meeting Minutes
November 3rd, 2014
Attendees
Christopher, Alma, BigJoe, Juul, Rune, Tonje
Scribe
Tonje Svepstad
Agenda
●
Old Business
○ Usability Test
○ Customer Meeting
○ Status Program
○ Status Report
●
New Business
○ Report feedback
○ Usability Test Iteration 2 (When?)
○ What can we expect to get done?
Old Business
●
●
Usability Test
We got three of Autronica’s employees for the first iteration of the usability test. We’ve
gotten many programming tasks from this meeting, but it’s unlikely we’ll have the time
to complete all of them.
Customer Meeting
●
●
We asked the customer for a prioritized list of functionality and are working our way
through this list. The meeting was at the same time as the usability test, so the focus
was mainly on functionality.
Program
We reached the sprint goals for the program, but it still lacks some functionality to be
truly useful for the customer. We still need to make an executable file, and will work
with this alongside writing the report for at least the first week of the sprint.
Report
We’ve focused largely on programming in the two weeks after last meeting. Partly
because we thought it would make ore sense to work with the report after we get
feedback from the advisor, but also so that the usability testing could be made in two
iterations. We have a lot of pages to write, and little time.
New Business
How many people have to present?
Soudabeh not sure, will ask and give us feedback.
Can we use keynote?
What should be the ratio between the product and process?
More focus on how the focus on the product was. Can mention stuff like Scrum, but the
important part is explaining the solution and why it’s good. Sell the work we have done and our
solution.
● What’s missing from the chapters that we have written in the report?
○
We will get a more detailed feedback next week on the report and the contents.
○
Each chapter should have a subchapter with changes made and how/why.
● What is needed to get a top grade?
○
Ask the course coordinator about presentation and grading.
● We should have a further development chapter with stuff that could/should be done with the
program after delivering.
●
○
●
●
○
Next Meeting Agenda Items
●
APPENDIX B. MEETING MINUTES
B.2
Customer Meeting Minutes
This section contain all the meeting minutes from the customer meetings.
151
First meeting with customer
About the company:
Our customer is Autronica and is part of an American company called UTC.
They are working with fire and gas detection for both land markets and offshore markets.
About the fire detection systems:
The detection system can contain many different panels in different zones, but always has one
main panel that takes care of the logging of events. All events are logged because if something
goes wrong, then they have to be able to find out what happened. The logging is done in a
Round Robin fashion, where if the log file is full, the system starts writing new entries from the
start of the file again. Because of this, the entries at the top of the log file, may not be the oldest
entries. In addition to this, the customer may change the time of the system. If this happens we
may get entries that has logged the same time (clock), but did not happened on the same time.
The log file is a plain ascii file and can have about 10 000 – 12 000 events. When something
goes wrong we will find entries with a fault code. If nothing goes wrong we will just get entries
stating that everything is ok, and get no interesting information.
The task
The task we are working with is taking all the information, and present the information so it is
easy to see where things went wrong. We need on view to show the large picture of what
happened with the ability to zoom in to points of interest to get more information. The program
we are to make has to run on Windows, but would be nice to have for all platforms (mostly linux,
as the customer wanted to use it on linux servers).
The program has to interpret the log file containing all the entries, and use information from two
different xml files with information about different codes used by the system to present what
happened. The hardest part will probably to find a good way to show all the information in a
good way, and take care of different corner cases.
Future plans
We will work Scrum with sprints of 3 weeks and change scrum master for each sprint. We will
have a meeting with Autronics as soon as possible at their office. We will meet monday to
discuss some more about the project. The main goal in the first sprint is to come up with
different ideas on how to show the information from the log file in a good way and present it to
the customer at the end of the sprint.
Time:
Place:
Date:
Attendants
So this is basically what we learned from our meeting with our customer.
In regards to what to prioritize in the project, the customer wants us to focus on finding a
graphical presentation of the most important events in the log file. He suggested maybe giving
events and error codes different color, level or something like that, and mentioned that he
wanted to be able to find all the information about a certain event by maybe “zooming in” on it.
The hardest part of the project will maybe be finding out how to present this large amount of
data in an understandable, readable way. In regards to requirements of the system he had no
hard limits or wishes, but he suggested that we create some requirements and send them to
him so he can overlook them before we start the implementation phase.
Searching for, and separating events based on time, error code, unit or type is a nice addition to
the system, but not required from his part. He would like a adjustable screen size, but a
standard screen size is also “liveable”. Being able to save information is not important and
nothing we should focus on, but could implemented if we want.
The log is round robin, as we have learned from before. Sequence numbers, used to tell the
order of the entries, are also round robin. And the clock may be corrected whenever. How to find
the “start” or the oldest event is up to us..
The customer is always available, and we can send him a mail with questions anytime. He also
wanted us to send parts of our report, especially the first chapter, so that he can make sure we
are on the right track. He mentioned that he will be gone for about a week from september 22rd,
so we should ask any questions we have before he leaves.
We gave the customer some homework, and he will send us:
- Some requirements he can think of
- More log files so we can test our program on different logs of different sizes
- A list of the most important events (fire, fault ++)
Meeting Minutes
September 19th, 2014
Attendees
Christopher T, Alma V, Tonje S, Juul R, Runa A, Jonas K,
The customer
Scribe
Jonas K
Agenda
●
●
Old Business
○ Discuss the suggested solutions we got
○ Update on how far we have gotten
○ Decide if we should continue with the current solution
○ Make sprint log for the 2nd Sprint
○ Other issues we need to discuss
○ Ask if he has any design things he want - logos or whatever
○ New requirements?
○ Existing solutions
New Business
○ Preparing
○ Estimation
Old Business
●
●
●
●
●
●
●
●
Discuss the suggested solutions we got. The customer is very happy with the
proposed solution. They thought it was a good way to represent the log and a good
approach to the problem. The customer liked the idea for having the ability to change
between the views and being able to have different filters on each mode.
Update on how far we have gotten. We showed the customer sketches of how we
want the GUI to be and talked a bit about the architecture, and what kind of software
and programming language we wanted to use.
Decide if we should continue with the current solution. Since the customer was
very happy about the proposed solution, we will continue working with that. Also the
customer told us we should.
Make sprint log for the 2nd Sprint. By the end of the next sprint, the group decided
with the customer these tasks should be done: Prototype of UI, parsing of files will be
implemented, code structure will be in place, the system should be able to read the files
and be able to show some information about the log and be able to load files. The group
then needs to work on understanding the structure of the log file. The customer should
also provide a prioritized list of events to the group, to be able to highlight and show
critical events.
Other issues we need to discuss. We didn’t have any issues needed for discussion.
Ask if he has any design things he want - logos or whatever. The customer will
send logo that will be used in the system. They also had some base colors that could be
used in the system.
New requirements? If anything is unclear in the backlog, the customer will let us
know. They will also provide new requirements if needed, but they didn’t have anything
at this moment.
Existing solutions. The customer have been developing a simple xml viewer
themselves in PEARL, and also looked at more graphical systems used on cruise liners.
The graphical system, not developed by the customer, had some of the same elements
and layout as the group had proposed. The system didn’t have any filtering, and not as
complex as we have proposed. The problem with the system they have been looking at
is that it needs to be custom made for their specific layout of the log file.
New Business
●
●
Preparing. For the next meeting the group should be more prepared. We should know
before the meeting who will say what, bring a computer and also be sure to print out
and bring the agenda.
Estimation. The group should estimate each task in the sprint log to get an overview of
how much time and work will be done in the sprint. The sprint should have enough task
for it to last three weeks.
Next Meeting Agenda Items
●
Walk through of how far the group has come with the solutions, and how much is done
in the sprint log
Meeting Minutes
Oktober 14th, 2014
15:30 at EL Rom G034
Attendees
From the group: All
From Autronica: Preben and Morten
Scribe
BigJoe
Agenda
●
Old Business
○ Demonstrate the prototype
○ Update on work so far
○
○
○
○
○
○
○
● New Business
Make sprint log
New requirements
Ownership of the product
English LogFile
How to merge xml with log
prioritized events
Other
Old Business
●
●
We presented our prototype. They seemed satisfied.
updated the customer on the work we have accomplished
New Business
Prioritize filters if we have time after adding the tabs(views)
○ They will send us a prioritized list over the folder,
and event files.
● Still need prioritized list of events.
●
they have no problem with us using the code (own the product)
○ the log files is what is secret
● No new requirements
● They will send a file of how the log files and xml-files correlate.
●
Next Meeting Agenda Items
●
The prioritized list of events.
Time: 15.20
Place: E5-103
Date: 31.10.2014
Attendants: Three representatives from Autronica, juul, Alma, Jonas x2, Rune, Tonje
Feedback from User-test:
Filter level. Expert and more common users.
x-axis on
Done:
TODO:
Listed by priority:
1.
(Make executable file.) Must but not first.
2.
X_axis based on sequence number. And nodes should also be based on this in
the way they are represented.
3.
Transaction between Views. Remember x_axis. Doing one thing in same tab
should affect all the views in that tab.
4.
Fix filter-names
5.
Saving functionality. Instance of program what? Mark nodes as important
6.
Be able to only load the log_file to start looking at that.
7.
Search-funcion. Like a filter.
8.
Tools in another screen. Work area is important. Should be as big as possible.
9.
Bug fixes. Filter especially.
APPENDIX B. MEETING MINUTES
B.3
Group Meeting Minutes
This section contains all the meeting minutes from the group meetings.
B.3.1
Sprint 1
160
Meeting Minutes
September 1st, 2014 13:15 in Realfagskantina
Attendees
Rune Abrahamsen, Jonas Johnsen Hildershavn, Christopher Tannum, Juul Arthur Ribe
Rudihagen, Jonas Kirkemyr, Alma Valencia
Scribe
Jonas Kirkemyr
Agenda
●
●
What we have done
○ First meeting with our customer
New business
○ Set guidelines for teamwork
○ Plan the first meeting with our advisor
○ Discuss schedule, when and where we are going to meet
Old Business
●
The first meeting with our customer went good. We learned that our customer
wants to help us and take part in our project, which is nice.
New Business
●
We set some basic guidelines for teamwork which includes that everyone should
●
●
●
●
always try to show up for meetings with the group, customer or advisor. We included a
chocolate penalty which means that if you’re late for a meeting you have to bring some
chocolate for wasting the other team members’ time.
For our first meeting with our advisor we planned some questions. We were unsure
how to approach the problem, how the work breakdown should be done, how much we
are supposed to work. We also wanted to tell her what we have done so far.
We are seven people with different schedules, which means that working together
will be a challenge. We managed to find two timeslots where we were all able to meet
every week. We are supposed to meet 13:15 every monday, and 08:15 every thursday.
On thursday we will try to book a room where we can sit together and work if we need
or want to.
Latex is to be used for writing the report. It is not necessary that every group member
know LaTeX, since we will use Google Drive to write the first versions of the report
chapters. The .tex file will be stored in our Git folder.
Git will be used for sharing code and report files. Everyone should make an account,
and Jonas should create a private repo for us to work in.
Next Meeting Agenda
●
●
●
●
What do we have ready?
Role assigning, time scheduling
Start the planning phase of the project
How to share weekly work hours
To do until next meeting
●
●
●
●
●
Tonje will book a room
Jonas will make a GitHub-repo
Alma will create a draft for the work breakdown
Jull will send a meeting invitation
Rune will send an email to the customer, asking if he can meet us on wednesday,
September 3rd.
Meeting Minutes
September 4th, 2014 08:15 at Zoo-5 in Realfagsbygget
Attendees
Rune Abrahamsen, Jonas Johnsen Hildershavn, Christopher Tannum, Juul Arthur Ribe
Rudihagen, Jonas Kirkemyr, Alma Valencia, Tonje Svepstad
Scribe
?
Agenda
●
●
What we have done
○ Meeting with our customer
New business
○ What do we have so far?
○ Start writing on the report, planning phase
○ Plan sprints
○ Assign roles
○ Discuss software to be used
○ Discuss time scheduling
○ Decide standards for documents, code and writing
Old Business
●
The meeting with our customer went very good. We learned more about what they
want from us, and learned more about the company. We also asked him to send us
some information about the current system, and things we need to know, like what
events in the system is considered “important”. We will also receive more log files for
testing.
New Business
●
●
●
●
●
●
●
So far we have gotten a understanding of the problem, we have thought of some
possible solutions, created a facebook group and a google drive that will be used for
communication and document sharing.
We should start writing on the report as fast as possible. We decide that most of
the planning part and first chapter of the report (the A part from the compendium)
should be completed today or as soon as possible.
We have planned 4 sprints, where each sprint is 4 weeks long. We have set
deadlines for each sprint. For every sprint we will have a new scrum master, which will
give several group members a chance to try out a leader role. The scrum master will
send invitations to meetings, and have responsibility for booking a room for the
meetings. If the meetings are over 4 hours long, the scrum master will contact the
room master (Tonje) so that she can book the room for the remaining time.
Roles have been assigned, and every group member have gotten a responsibility.
The role of project leader / scrum master will change for every sprint, giving four group
members the chance to try being a leader.
Noone knows a good scrum board software, so that needs to be researched more.
Time scheduling is very hard, but we should try to find out how much time we will
spend on each part of the project. This will be easier after we have created the backlog.
Templates has been made for meeting minutes, documents to be shared with the
advisor and customer. We will discuss standards for commenting code when we start
that process.
Next Meeting Agenda
●
●
●
First draft of the backlog
Discuss the completed parts of the report
Decide a scrum software
To do until next meeting
●
●
●
Rune will send a mail to the customer, ask for information about project goal definition,
define how fast we can expect to get a response (approvals, feedback, answers to
questions).
Alma will invite everyone to the next meeting.
Everyone should ty to work on the backlog because it’s easier to work when we know
what to do.
Meeting Minutes
September 8th, 2014 13:15 in Realfagskantina
Attendees
Rune Abrahamsen, Jonas Johnsen Hildershavn, Christopher Tannum, Juul Arthur Ribe
Rudihagen, Alma Valencia, Tonje Svepstad
Group mood: 7
Scribe
?
Agenda
●
●
Old Business
○ First draft of the backlog
○ What we have so far
○ The Scrum Software
New Business
○ Find alternate meeting times for meeting with the advisor
○ The sprint log
Old Business
●
●
●
The first draft of the backlog is good, but needs some work. We should write it more
detailed so we can send it to the customer. We agree on working on it today, so we can
send a draft to the customer for approval.
We have found a Scrum Software called Trello. Everyone should make an account so
Juul could add us to the project before he goes on vacation.
The first draft of chapter 1 of the report is mostly completed, and will be sent to the
customer for approval tomorrow. Everyone should check if there is some changes we
●
should make.
The first draft of the backlog looks nice, but needs some work. We should write on it
to make it more detailed
New Business
●
●
●
Since we couldn’t meet with the advisor in our regular timeslot this week, we
should find another time that fits us all. We decide on meeting at 8:15 on thursday.
The sprint log should be completed as soon as possible, but the backlog should be
done first.
The Scrum board will be set up when the backlog is done, and everyone has created
an user account on Trello.
Next Meeting Agenda Items
●
To do until next meeting
●
●
●
●
●
Alma will invite everyone to the meeting and write an agenda
Everyone will make an user account on Trello, and post their user name in the facebook
group
Juul will add everyone to the Trello project and make sure everyone are administrators
The backlog and draft of the report will be sent to the customer
Everyone should make sure the backlog is completed
Meeting Minutes
September 8th, 2014
Attendees
Scribe
Alma
Agenda
●
●
Update on progress
○ Templates
○ Report
○ Roles
○ Backlog
○ Software to use
To do
○ Time of meeting
○ Sprint log
○ Task
○ Scrum Board
Update on progress
●
●
●
●
Templates. Necessary templates created for different kind of meetings is done.
Report. We have written until A7 in the report. We’re pretty much done with the layout,
need some extra work.
Roles. We have assigned roles and responsibilities to each one of the members of the
group.
Backlog. First version of backlog is done. Everybody should look through it and add
tasks. Will be sent on tuesday
●
Software to use. After looking after scrum software to use, we decided on using Trello.
To do
●
●
●
●
Time of meeting. We have to decide a new time of the same time as wednesday for
meeting with Sodabeh on Thursday. (since she has classes at the time of the meeting
on wednesdays). Will try to have it at 08:15
Sprint log. The sprint log need to be approved by the customer before a sprint log is
created.
Task. Sprint should be split into smaller tasks so we can start working. Should make
sure the backlog is divided as much as possible.
Scrum Board. Juul will set up the scrum board and everybody have to create user at
Mood:
●
7
Meeting Minutes
September 11th, 2014
Attendees
Scribe
Alma
Agenda
●
●
Update on progress
○ Scrum board
○ Meeting
○ Backlog
○ Architecture
To do
○ Tasks
Update on progress
●
●
●
●
Scrum Board Scrum board created and tasks added
Meeting Meeting with advisor is re-scheduled
Backlog Backlog sent to customer for approval
Architecture Work on architecture document started
To do
●
Tasks should be assigned to people and start working on them
Mood:
●
7
Meeting Minutes
September 11th, 2014 09:00 at Zoo-2 in Realfagsbygget
Attendees
Rune Abrahamsen, Jonas Johnsen Hildershavn, Christopher Tannum, Jonas Kirkemyr, Alma
Valencia, Tonje Svepstad
Scribe
Tonje Svepstad
Agenda
●
●
What we have done
○ We have created the backlog and sent it to the customer
○ We have started working on the architecture document
○ Everyone is added to Trello and the backlog is implemented there
New business
○ Detail the backlog
○ Assign the tasks from the backlog
○ Brainstorm design solutions
○ Status report
○ Start working
○ Talk about the meeting with the advisor
●
●
What have people done this week?
What needs to be done?
Old Business
●
This week we have researched the design and how the UI could look like. We have
also written the backlog and sent it to the customer. We have worked on the
architecture document
New Business
●
We need to work with restructuring the document and adding stuff like risk analysis.
Next Meeting Agenda
●
●
●
First draft of the backlog
Discuss the completed parts of the report
Decide a scrum software
To do until next meeting
●
●
●
●
Write the introduction for the document
Write a structure for the document as a whole
Decide on some functionality and design ideas
Decide on a platform to use
Meeting Minutes
September 15th, 2014
Attendees
Scribe
Alma
Agenda
●
●
Update on progress
○ Ideas
○ Started with
○ Architecture
To do
○ Introduction
○ Structure report
○ Estimating
Update On progress
●
●
○
○
○
●
Ideas We have discussed as a group the design ideas and the functionality for the
product
Started with
Risk assessment
Existing solutions
different analyzer modes for the program
Architecture. Still working with initial architecture
To do
●
●
●
Introduction start writing introduction for the document.
Structuring the report
Estimate hours per task and make a Gantt chart
Mood:
●
6
Meeting Minutes
September 11th, 2014 09:00 at Zoo-2 in Realfagsbygget
Attendees
Rune Abrahamsen, Christopher Tannum, Jonas Kirkemyr, Alma Valencia, Tonje Svepstad,
Juul Arthur Ribe Rudihagen
Scribe
Tonje Svepstad
Agenda
●
●
What we have done
What needs to be done
Things we have done
● This week we have worked on the architecture and a design solution to show
the customer. We have started working on the document, and written the
introduction in LaTeX. The work breakdown, some user stories and some use cases is
also done. We have spent some time researching existing solutions as well.
Things to be done
Everyone should follow the Scrum board on Trello.
Instead of everyone waiting to be assigned tasks, people should be able to
find out what needs to be done in their responsibility area.
●
●
● Everyone will continue on what they are doing so we can complete every task
in the sprint log until the sprint ends tomorrow.
● We will have a Git course so that everyone knows how to use it
Next Meeting Agenda
●
●
Review the first sprint
Start the second sprint
To do until next meeting
●
●
●
Finish the tasks in sprint 1
Prepare for the meeting with the project owner
Start adding documents in google drive to the LaTeX report document
Meeting Minutes
September 18th, 2008
Attendees
Scribe
Alma
Agenda
●
●
Update on progress
○ work breadown
○ user stories
○ meeting dates
To do
○ introduction
○ structuring
○ gant diagram
Update On progress
●
●
●
Work Breakdown structure document started
User Stories started working with user stories document
Meeting dates decided for meeting with customer
To do
●
Introduction of report should be started
●
●
Structure the report as a whole
Gant Diagram shoule be made
Mood:
●
6
Meeting Minutes
September 19th, 2014
Attendees
Customer and whole student group
Scribe
Rune
Agenda
●
●
●
●
●
●
●
●
Discuss suggested solutions
update on progress
Decide if we should continue with current solutin
make sprint log for 2nd sprint
Other issues
Design preferenecs, like logo etc
New requirements
Existing solutions
APPENDIX B. MEETING MINUTES
B.3.2
Sprint 2
181
Meeting Minutes
September 22th, 2014
Attendees
Scribe
Alma
Agenda
●
●
Update on progress
To do
Update On progress
What we’ve done
●
●
●
We had a meeting with the customer
We made a draft version of the overall design
We made the firsts chapters of the report
To do
●
●
●
●
Retrospective of the 1st sprint
Review the basics of GitHub
Assign task in the sprint log.
Latex
●
●
●
●
GitHub
Decide how the chapters of the report should be structured.
Discuss some of what we’ve written so far.
Discuss what people are good at in programming - divide and conquer the main areas
Impediments:
Jonas H made the Latex shell and read through the other reports, as well as what we have done
so far.
Juul made the Gantt Chart.
Alma have worked on administrating SCRUM, meeting agenda and working hours. Existing
Solutions.
Jonas Kirkemyr has made the first draft of the class diagram as well as thought of how we
should start implementing the program. (Program SKull).
Tonje have talked to some friends that have made a similar software to ours, and asked them
for pointers, as well as made the risk assessment table.
We discussed what version of Java to use. We decided to ask the customer whether there
would be any problems with downloading the new Java.
We had an introduction to git and latex
We also had retrospect afterwards
Mood:
●
8/10
Meeting Minutes
September 25th, 2014
Attendees
Christopher, Juul, Tonje, Jonas, Rune
Scribe
Christopher
Agenda
What have people done/going to do?
● Tonje: Been working on scrum document
● Alma: Been working on “other solutions”
● Rune: Looking additionally at the architecture for multiple developers
● Chris: Been looking at design, java fx, and documenting layout
● Jonas: working with the shell of report
● Juul: Finished Gant-diagram -> Needs input
● Jonas: Looking at parser for xml -> Continue working on it
Project set up:
● Status: Architecture is mostly done
● To do: Skeleton needs additional updating
● Each of the different views have a separate sub-model of a master model
● Back-end includes parser and loader
● Basic interfaces are made for the three parsers
Gantt diagram:
● Status: A solution has been made
● To do: Should be sent to QA
Report scrum board:
● Status: Created a new board for report. Added “backlog” entries.
● To do: Make sure people get assigned to different tasks in the report board. Be
better at using scrum boards. Make sure to put task at working if new task is assigned.
New Business
●
Mail from ?Soudabeh?: Introduction should contain project information and company
introduction. This is done. Updated report to be done before friday. Make sure estimates
are added for each task and sprint. This is going to be a guess, but it still needs to be
done. When we are done with sprint/task we need a E/A (Estimates/Actual) overview.
Mood: 8/10
Agenda 25.09.14
When: 08:15
Where: Zoo 4
What have we done (Everyone tells what they have done, and what they are to do):
Tonje: Been working on scrum document
Alma: Been working on “other solutions”
Rune: Looking additionally at the architecture for multiple developers
Chris: Been looking at design, java fx, and documenting layout
Jonas: working with the shell of report
Juul: Finished Gant-diagram -> Needs input
Project set up:
● Status:
● To do:
Gantt diagram:
● Status:
● To do:
Report scrum board:
● Status:
● To do:
Walkthrough on the project set up:
Mood
Meeting Minutes
September 28th, 2014
Attendees
Scribe
Alma
Agenda
●
●
●
●
Meeting with Soudabeh
Programming
Report
Meeting to celebrate Sprint 1
Update On progress
Meeting with Soudabeh:
●
Status:
Programming:
●
●
Status:
Todo:
●
●
Status
Todo
Report:
Meeting to celebrate sprint one:
●
Status:
Meeting Minutes
September 25th, 2014
Attendees
Christopher, Juul, Jonas, Rune, Alma
Scribe
Alma
Agenda
What have people done/going to do?
● Tonje: Been working on scrum document, researching and worked in the parser
-> keep continue working on that
● Alma: Been working on Test Scenarios
● Rune: Been working in the Structure and Packaging of the project
● Chris: Been working on layout
● Jonas: working with the report and the documents in google drive
● Juul: Been working on an explorer to open files and pass them to the parser and
scrum master tasks
● Jonas: Working on the parser. -> keep continue working on that
Meeting with Soudabeh:
●
Status: Will meet her next week
Programming:
●
●
Status: Working on parsers and layout.
Todo: MVC model for the layout
●
●
Status: Some documents should be re written before get into Latex
Todo: QA of some documents, and write guidelines of how the report should be
Report:
written.
Meeting to celebrate sprint one:
●
Status: The group will meet at 7 pm outside of studentersamfundet
New Business
●
●
Sprint chapters of the report: Rune and Jonas will start working on that.
Acceptance test: Need to write the test using JUnit.
Mood: 8/10
Meeting Minutes
October 6th, 2014
Attendees
Jonas Kirkemyr, Jonas Hildershavn, Tonje, Christopher, Juul, Alma, Rune
Scribe
Rune
Agenda
What have people done/going to do?
Tonje: Worked with the parser. Has run into some problems.
Jonas K: Has finished the unit parser. Will be testing and implementing the error parser.
Christopher: Has worked with the UI. It’s going well. Need help with the controller to finish in
time.
Alma: Been working with the tests. Need to put into the drive.
Jonas H: Has written report guidelines, updated the Latex. Reading up on how to write a report.
Will rewrite the first chapter. Structure drive.
Juul: Have updated tools section in report, looked at master ?. Scrum Master stuff. Will help
Christopher with UI.
Rune: Structured some code. Looked at code. Will start write the chapter on Sprint 1, and help
others.
Meeting with Soudabeh:
● Status: Ask her about how the customer meetings should work. What should we
present to him?
● Todo:
Programming:
Status:
●
We’ve made one parser. Made some progress with the UI.
Todo:
● Finish the other parsers before the meeting on thursday.
● Finish the view before the meeting thursday.
● Finish the controller for the UI.
● Make the file loader load the three files at the same time in the same pop-up
window.
Report:
● Status: Initial structure has been made. Most of hat we’ve written in drive has
been added. Almost no QA so far.
● Todo: QA on all chapters. Restructure in compliance with Soudabeh’s guidance.
(See Meeting with Advisor, 06.10.2014). Write an introduction in itself. Get it finished in
time for the next advisor meeting.
Pull-request:
●
●
Status:
Todo:
Work-hours:
●
●
Status: We have worked too little
Todo: Work more.
●
Next meeting on thursday 8.30.
Other:
Mood: 7/10
Meeting Minutes
October 2th, 2014
Attendees
Whole group
Scribe
Juul
Agenda
●
●
●
What we’ve done
Programming
Report
Update On progress
What we’ve done
● Tonje: Working with parsers. Done with some of it. Are going to create a pullrequest. Going to be working more with the parsers.
● Christopher: Started to implement the design. Has chosen how the viees will be
mad with css-files, xml og java classes. Going to be working more on that.
● Juul: Written about the tools we use and why we have chosen them. Going to
work more on the fileloader and create pull-request for the report.
Programming:
● Status: One of the parsers have some functionality, and the design shell has
been created and the pattern has been chosen.
● Todo: We have to get the parsers done, merge the pending pull-request.
Report:
● Status: Have been writing about the tools and why we have chosen what we
have.
● Todo: Create pull request from our work and merge it inn.
Mood:
●
6/10
Meeting Minutes
October 9th, 2014
Room: Room R Zoo-2 (360.DU2-182)
Time: 08:30
Attendees
Jonas, Tonje, Alma, Juul, Rune, Jonas
Scribe
Rune
Agenda
What have people done/going to do?
Rune - Have written about architecture
Alma - Working on acceptance tests, ready for QA. Will be working on report about testing
Jonas- Worked on parsers, will work on the nodes
Tonje - worked on event parser
BigJoe - Worked on report, will continue on the report, restructure Drive
Juul - Worked on UI
Parsers:
●
●
Status: Done
Todo: Make them work with nodes and make them work with masterlist
●
●
Status: Got some functions, might be enough for the early prototype
Todo: Merge with master and produce the graph with the masterlist
GUI:
Report:
●
●
Status: Still rewriting a lot, but we got the things the advisor asked about
Todo: Most parts needs QA, needs to finish all the chapters up to Sprint 1
●
Meeting with customer, plan so far 14.10 at 15:30
Other:
Mood: 8
APPENDIX B. MEETING MINUTES
B.3.3
Sprint 3
197
Meeting Minutes
October 13th, 2014
Attendees
Jonas, Jonas, Tonje, Rune, Juul, Alma
Scribe
Juul
Agenda
What have people done/going to do?
● BigJoe: Started on introduction. Done QA on things written in the report. Still at
the planning chapter
● PapaJoe: Rewritten some of the nodes, will push it today
● Tonje: Done som coding on the mastermodel. Writing waterfall. Done some QA
Will finish the waterfall chapter
● Alma: Worked on the existing solution in latex. Could need some screenshots
from the program.
● Rune: Finished the architecture chapter. Looked some at the code. Will finish the
architecture chapter, and whaterver we decicde.
● Juul: Worked on the program. Make functionalty for drawing graph from the
event-file. Fixed zooming and dragging.
Meeting with Soudabeh:
●
●
Status: Ask if the structure is right
Todo:
Meeting with Customer:
●
●
Status: We asked for meeting on tuesday and have no answer.
Todo: Call the customer.
Programming:
● Status: There is a warning when you run the program. The graph is drawn from
the event-file.
● Todo: Rewrite code and merge pull request from the masterlist branch.
Report:
● Status: Much under QA. restructure complete. Architecture and existing solutions
under work.
● Todo: Have to finish architecture and existing solution. Try to rewrite as much as
possible before wednesday.
Mood: 7
Meeting Minutes
October 16th, 2014
Attendees
Christopher, Tonje, Juul, Rune, Alma
Scribe
Jonas Kirkemyr
Agenda
What have people done/going to do?
Alma: Preliminary studies and QA on sprint 1, Plans to check scrum board for missing
tasks
Tonje: Methodology,
Rune: Finished architecture chapter, and worked on requirements. Don’t know what to
do yet.
Jonas: Written the introduction chapter, tried to set up the structure. Structured the trello
board and google drive. Want to be part of the programming, will work with the
report and presentation.
Juul:
Chris: Worked on the second sprint. Plan to work on presentation
Jonas: been working on QA chap 5. Will push to github, and move to QA on trello. Will
be doing work where needed.
Report:
●
●
●
Is there anything we have to add before delivery later today?
○ We are good
Should there be a QA of what has been done this week, is there time?
○ Do your work before QA
Maybe some sections should be subsections? [Juul Arthur]
○ Yes, only one section for each chapter, rest is subsection. Remove
the Chapter before section.
●
Questions about some subsections under sprints [Juul Arthur]
Programming:
●
●
What is missing for delivery of prototype on Monday?
Are there any quirks which should be fixed?
○ Just merge the pull request from Tonje
Presentation of prototype:
● This is going to be our main task today guys. We all have to have a 2min
presentation.
● Which part of our project would you like to present?
○ Introduction: Chris ! 1min
○ Requirement specification: ! 2min Alma
■ Current solution and existing solution and our
○ How we have organized the group (Scrum, roles, etc, workflow,
plans of the different sprints, QA) ! 3min BigJoe & Tonje
■ Reasoning about development model and why we
chose it based on requirements
■ Why did we divide roles?
■ What is our workflow
○ Tools: 1min, BigJoe & Tonje
■ Programming tools Java, JavaFx
■ GitHub and trello for collaboration
○ Architecture, packaging and structure : Rune & Jonas K, 4min
■ Architecture vs Requirements
■ Collaboration
■ Modifiability
○ Show the program: Juul, 2min
○ GUI design: Chris, 2min
■ The different GUI we discussed
■ Why we chose this GUI
■ Ease of use
● Discuss structure of presentation.
● PowerPoint or Prezi(http://prezi.com/)?
● We don’t have much time, so we need to be very critical of what we chose to put
in the presentation. Discuss!
Other:
●
●
Mood:
Schedule time for retrospect of sprint 2.
Should we have a social get-together as a celebration of completion of sprint 2?
Meeting Minutes
October 23rd, 2014
Attendees
Juul, Rune, Tonje, Chris, Jonas K, Alma
Scribe
Alma Valencia
Agenda
What have people done/going to do?
JK: combined event nodes. it's been a little difficult. Next: don't know yet
Rune: barchart, has done some restructuring, working with the filters. Next: more filters
Juul: change the file loader, work with the graph, zooming function. Next: work with
graph intervals and number of events
Tonje: working with the usability test. Next: work with filters.
Alma: working with the tab switching. Next: assign tab switching to a button
Chris: working in the design of the graphs.
Programming:
●
●
●
How are your tasks going? People will continue working with the graphs
Are there any issues? Not really
Do people need help?
●
Anything we need to add right now?
Report:
Retrospective(If we have time):
● Continue using the format from last retrospective, i.e. using blackboard if
possible.
● What should we start doing?
● What should we stop doing?
● What should we continue doing?
Refer to retrospective document.
Mood: 9
Meeting Minutes
October 23rd, 2014
Attendees
Scribe
Juul
Agenda
What have people done/going to do?
● Tonje: Have written about the user-test for the report. I don’t we know, lets find
something.
● Bigjoe: Trying to do the programming, asked for some help. Juul is gonna help
after the meeting.
● Rune: Haven’t done anything since thursday, helped Jonas a bit and contacted
customer. Can try to improve bar-chart
● Alma: Been working on creating new tabs, need help. Continue with the tabs.
● Chris: Working on the final view, could need some help. Continue working on
that.
● Juul: Worked on improving the line-chart and improve zoom
● PapaJoe<3 - changed back to using pointers for eventNodes. Will be adding
more classes for events in new log files
Programming:
●
●
●
●
●
How are your tasks going?
○ Things are going good, some people needs a little help.
Are there any issues?
○ We do not have much time this week.
Do people need help?
Need to make a constant class for the different types
User-Test (day/time):
●
○ Try to have the meeting on friday.
○ Try to make it without paper-prototypes
Set the location for the file-explorer
●
Anything we need to add right now?
Report:
Mood: 6
Meeting Minutes
October 30th, 2014
Attendees
Scribe
Jonas Hildershavn
Agenda
What have people done/going to do?
● PapaJoe: Working in event classes. Next: Working with filters or transaction
between graphs.
● Alma: tabs, tabs, tabs…
● Juul: Working with the zooming functionality. Next: Filters or transaction between
graphs.
● BigJoe: Working with the bar chart, fixing titles and added keyword functions.
● Chris: Working with the views.
Programming:
●
●
●
●
●
●
●
How are your tasks going?
○ People starting to get finished?
Are there any issues?
Do people need help?
Status on application for user test
How is the XML linking going?
Please remove console prints before pushing!
What is up with the node IDs? They do not seems to be working (node.getID())
●
Who can attend?
User Test:
○ Juul, BigJoe, PapaJoe, Rune, Alma
When and where is it?
○ Trying to have the test on Friday from 2 pm to 4 pm. Customer
meeting from 4 pm to 5 pm.
● Perhaps we have a run through of the test before meeting with testers from
Autronica
●
Report:
●
Mood: 7
Anything we need to add right now?
Meeting Minutes
October 30th, 2014
Attendees
Scribe
Jonas Hildershavn
Agenda
What have people done/going to do?
● PapaJoe: Working in event classes. Next: Working with filters or transaction
between graphs.
● Alma: tabs, tabs, tabs…
● Juul: Working with the zooming functionality. Next: Filters or transaction between
graphs.
● BigJoe: Working with the bar chart, fixing titles and added keyword functions.
● Chris: Working with the views.
Programming:
●
●
●
●
●
●
●
How are your tasks going?
○ People starting to get finished?
Are there any issues?
Do people need help?
Status on application for user test
How is the XML linking going?
Please remove console prints before pushing!
What is up with the node IDs? They do not seems to be working (node.getID())
●
Who can attend?
User Test:
● When and where is it?
● Perhaps we have a run through of the test before meeting with testers from
Autronica
Report:
●
Mood:
Anything we need to add right now?
APPENDIX B. MEETING MINUTES
B.3.4
Sprint 4
210
Meeting Minutes
November 3rd, 2014
Attendees
Everyone
Scribe
Juul Arthur Ribe Rudihagen
Agenda
What have people done/going to do?
● PapaJoe:
○ Done: Haven’t done anything since thursday
○ Todo: Will work with transaction between views. Parser should
work with only the log file in place.
● Alma:
○ Done: Worked on the tabs, and need to correct some indexing
○ Todo: Don’t know what to do next
● Juul:
○ Done: Worked on the linechart, fixed the x-axis scaling. Sorted the
nodes on sequence numbers.
○ Todo: Fix the zoom, use the timefilter, help Jonas with the
transaction between views.
● BigJoe:
○ Done: Done some management, and made a plan for the next few
weeks. Worked on the last view with the tree structure.
○ Todo: Work more on the last view.
● Chris:
○ Done: Did some hotfixes before the user test. Fixed the resolution
size.
○ Todo: Have to find out today what to do. Fix some UI changes.
● Tonje:
○ Done: Written about the user test.
○ Todo: Dont know what to do next
● Rune:
○
○
Done: Haven’t done anything since thursday.
Todo: I will work on the filters. Try to look at the report.
Programming:
●
Priority List from Usability Test.
○ Assigned tasks on trello, and prioritized by order
● What can we expect to get done by 20th november, and how are we going to get
it done.
○
● Divide tasks in SCRUM board
○ Same as the first bullet-point
● Issues?
○
● Ask for help.
○ Remember to ask for help, maybe someone has done what you
are doing
Report:
●
●
●
●
What’s missing?
■ Sprint chapters
■ Conclusion
■ Testing?
■ Implementation
■ User manual
○ Should we have separate chapters for Testing.
■
○ Any more chapters to add? Look at Table of Contents
■
What needs to be done in order to reach our goals.
○
Divide tasks in ReportBoard
○
How to QA?
○ Everyone QA on the workshop
Final Presentation:
●
●
We need to start making this now.
○
Christopher in charge of this?
■ yes
○ Will it Prezi? Powerpoint? Short discussion.
■ Prezi
Workshop(s)
●
When? Set date and time.
○ saturday 12-17. 5. floor p15. Key time is 12-17, but show up
●
●
earlier or stay later as needed.
What? Find out what to do in workshop. Specific tasks that needs to be finished.
○ Finish the program on the first workshop, finish the report on the
last sprint.
Eat together? We should find a ay to have a good time even though it’s all work :)
○ YEA! PIZZA!
Discuss Plan for Sprint 4:
●
●
●
Is the plan feasible?
○ Yes, after some adjustments
What should be added, removed?
○ Change some deadlines to get more time for programming.
Which deadlines should we set for the different tasks?
○ See above
Mood: 7
Why?: Because
Meeting Minutes
November 6th, 2014
Attendees
Christopher Tannum, PapaJoe, Alma, Juul
Scribe
Christopher Tannum
Agenda
What have people done/going to do?
● PapaJoe:
○ Done: Fixed Zoom to make transitions.
○ Todo: Continue working on that.
● Alma:
○ Done: Working on testing for the application. Indexing for the tabs
○ Todo: Continue with testing and indexing of tabs
● Juul:
○ Done: New zooming functionality, QA on pull-requests
○ Todo: Make use of time filters
● BigJoe:
○ Done: The new node view. Usability testing preparations.
Management.
○ Todo: Continue with node view.
● Chris:
○ Done: Fixed design elements such as back ground colors and size
constraints and resizing.
○ Todo: Contrinue with this work, making the layout look as good as
possible before delivery.
● Tonje:
○ Done:
○ Todo:
● Rune:
○ Done: Time filters and Filterbar and search
○ Todo: Unit filter and search
Programming:
●
●
●
How are we doing with the tasks:
○ Seem, to be doing well. Some issues need to be resolved before
the usability test tomorrow. This includes, but not restricted to, the bar chart,
node view, layout restructuring and transitionings.
Issues?
○ Does not seem to be any issues.
Ask for help.
○ Remember to ask for help, maybe someone has done what you
are doing
Report: [FOCUS MORE ON THIS NEXT WEEK]
●
●
●
●
Anyone done anything?
○ Not as far as we know, some may be added to the usability tests.
What needs to be done in order to reach our goals.
○
Divide tasks in ReportBoard
○
How to QA?
○ Everyone QA on the workshop
Final Presentation:
●
●
How’s it going?
I got an E-mail! [Christopher]
○ [1, .inf] people from the group can do the presentation. 20-30min
presentation and demo, 5-10min Q&A
■ I think they can't include too much technical details
to their
■ presentations because of the time limitations. They
are expected to give
■ general information about their projects and what
they did. Examiners
■ are not familiar with the projects, they will learn
about the projects
■ during the presentations.
Workshop(s)
●
Other:
When? Date and time.
○ Saturdays, Core time: 12-17. 5. floor p15
○ Finish the program on the first workshop, finish the report on the
last sprint.
○ YEA! PIZZA!
●
●
Mood:
Check Facebook and reply more. Should be checked at least once a day.
Usability Testing. Are we on Friday?
○ Need to double check with Rune, but I believe so.
Meeting Minutes
November 10th, 2014
Attendees
All
Scribe
Jonas Kirkemyr
Agenda
What have people done/going to do?
Deadline to Thursday!
● PapaJoe:
○ Done: started parser tests
○ Todo: Continue writing tests
● Alma:
○ Done: focused on test skeleton checks.
○ Todo: Look at working hours vs actual hours
● Juul:
○ Done: zoom check, qa, save & load functionality
○ Todo: Write about testing for the report
● BigJoe:
○ Done: Finished treeview, usability test, minor functionality
○ Todo: Sprint 4 & conclusion
● Chris:
○ Done: scaling, design chapter in report
○ Todo: Sprint 3, fix sprint 1 & 2
● Tonje:
○ Done: Save functionality
○ Todo: Usability, conclusion
● Rune:
○ Done: merging, usability test, make exe file, QA, minor changes
○ Todo: What have changed in architecture and user manual for
filters
Programming:
● From monday, start working with fixing coding problems. This is only for those
who don’t have the presentation.
Report: [FOCUS MORE ON THIS NEXT WEEK
●
●
Divide tasks in ReportBoard
○
How to QA?
○ Everyone QA on the workshop
Final Presentation:
●
●
How’s it going?
○ Juul & Christopher have main responsibility. Ask others for help if
needed!
I got an E-mail! [Christopher]
○ [1, .inf] people from the group can do the presentation. 20-30min
presentation and demo, 5-10min Q&A
■ I think they can't include too much technical details
to their
■ presentations because of the time limitations. They
are expected to give
■ general information about their projects and what
they did. Examiners
■ are not familiar with the projects, they will learn
about the projects
■ during the presentations.
Workshop(s)
●
The one that was:
○ What worked? WHat was bad?
○ Why didn’t we get it done in time?
Other:
● Check Facebook regularly. Does anyone have a problem with communicating
this way? When should we expect to get a reply?
● Reconsider our goals for the project?
● Workshop saturday
○ QA on saturday when we have workshop. until then, write as
much as possible. Jonas will read through report and check in the end. Should
be done with report on saturday!
Mood:
Meeting Minutes
November 13th, 2014
Attendees
JOnas, Jonas, Alma, Chris, Juul, Rune
Scribe
Jonas
Agenda
What have people done/going to do?
● PapaJoe:
○ Done: writing tests
○ Todo: test
● Alma:
○ Done: written the acceptance tests, work on the workload for the
report, gant chart,
○ Todo: user stories
● Juul:
○ Done: Written testing part of project
○ Todo: rewrite sprint 1
● BigJoe:
○ Done: written some on the report, sprint 4 and conclution, fix some
bugs in the program
○ Todo: work on whatever is needed, create new tasks when he
finds them. QA new tasks to be done
● Chris:
○ Done: Working with design, sprint 2&3 and started creating the
layout of the presentation
○ Todo: continue writing with sprint chap
● Tonje:
○ Done:
○ Todo:
● Rune:
○ Done: rewriting architecture, class diagram, scetch of architecture
written about views, found bugs, sent program to customer.
○ Todo: will do whatever comes up
Programming:
●
Is there any have tos?:
○ not prioritized right now. Issues will be fixed when done with report
Report: [FOCUS MORE ON THIS NEXT WEEK]
●
●
●
●
What’s left?
○ BigJoe will QA after meeting, and assign people do tasks they
should do
What needs to be done in order to reach our goals.
○ work your hours
Divide tasks in ReportBoard
○ BIgJoe will have responsibility doing this, and assign people
How to QA?
○ Everyone QA on the workshop
Final Presentation:
●
How’s it going?
○ Have started with layout. Should be done until sunday (Decided
by Juul & Christopher
Workshop(s)
●
When? Date and time.
○ Saturdays, Core time: 10-whenever we’re done. 5. floor p15
○ Finish the report on the last sprint.
○ YEA! PIZZA!
Acceptance Test
● Haven’t heard anything from customer. Did make an appointment last usability
test that it should be Friday 14.nov. Assumes this still holds.
Other:
Check Facebook and reply more
●
. Should be
checked at least a billion times a day.
○ Reply and say something. give response/reply just to confirm you
have seen it. When posted before 16.00, everybody should respond!
● If anything is unclear or you actually have the time to do something even though
you haven’t gotten assigned to something, ask!
●
●
●
●
Mood: 7
○ check trello also!
Anyone needs anything?
○ talk together
We should consider writing further development.
○ will be done, along writing the user-manual. which should be
based on the user stories
Sprint chapters.
○ write as much as possible. BigJoe will post what he expects to be
in the chapter. The structure will be agreed upon on saturday.
Focus when working
○ don’t do anything that doesn’t benefit the grade! don’t start
restructuring code, as it has no impact on the final grade
Meeting Minutes
November 17th, 2014
Attendees
Scribe
Jonas Hildershavn
Agenda
What have people done/going to do?
● PapaJoe:
○ Done:
○ Todo:
● Alma:
○ Done:
○ Todo:
● Juul:
○ Done:
○ Todo:
● BigJoe:
○ Done:
○ Todo:
● Chris:
○ Done:
○ Todo:
● Tonje:
○ Done:
○ Todo:
● Rune:
○ Done:
○ Todo:
Programming:
●
What needs to be prioritized before the presentation?:
○ The color scheme for the TreeView.
○ Loading importantList items
○ Background behind the top toolbar
○ Easy to see all text
○ The pop up for notes
○ Cancelling issues
○ Change scrollers to light blue
○ Button cosmetics
○ Filters can’t be closed
○ WHat happens if you load files after loading the text file.
○ Zooming function needs to be thouroughly tested
○ Bring back the scaling
●
What’s left?
○
What needs to be done in order to reach our goals.
○
How to QA?
○ Everyone QA on the workshop
Report:
●
●
Final Presentation:
●
How’s it going?
○ They have made the skeleton. If you disagree with anything, say
so now.
●
The general outline?
○ Final Presentation
●
Work hours
Other:
Mood: 8