1
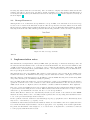
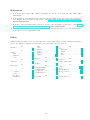
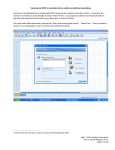
NORDUGRID
NORDUGRID-MANUAL-5
4/3/2014
The Grid Monitor
Usage and installation manual
Oxana Smirnova∗
Abstract
The LDAP-based ARC Grid Monitor is a Web client tool for the ARC Information System, allowing
to browse all the published information about the system. It makes use of the hierarchical information
organization and the PHP LDAP module to provide a real-time monitoring and primary debugging for
ARC-based grids.
∗ [email protected]
1
Introduction
Information services play a very important role in any computational grid architecture, being a nerve system
of the Grid. Resource discovery, scheduling, monitoring and many other tasks are impossible without a
reliable and up-to-date information about system components.
ARC Information System [3] provides a robust and dynamic model for accessing not only quasi-static information about resources and services, but also about such rapidly changing parameters like queue and job
status. Being based on OpenLDAP [4], it can be easily interfaced to any browsing or monitoring tool, giving
thus a user-friendly overview of all the testbed resources.
The Grid Monitor makes use of the LDAP module of PHP [1] to provide a Web client tool to browse the ARC
information infrastructure. It is available in many human languages in order to follow browser localization
settings or user preferences. This document gives a summary of its capabilities and usage guidelines.
2
Grid Monitor Modules
The structure of the Grid Monitor to great extent follows that of the ARC Information System [3]. The
basic objects are defined by the following schema’s objectclasses:
–
–
–
–
nordugrid-cluster: a cluster
nordugrid-queue: a queue at the cluster, accessible by the authorised users
nordugrid-job: a Grid job, associated with a queue
nordugrid-authuser: a user, authorized to submit jobs to a given queue
The Grid Monitor also uses the Virtual Organisation (VO) organisationalPerson and Storage Element
nordugrid-se objectclasses, and their attributes.
For each objectclass, either an essential subset of attributes, or the whole list of them, is presented in an
easily accessible inter-linked manner. This is realized as a set of browser windows, each being associated
with a corresponding module. There are nine major modules :
1)
2)
3)
4)
5)
6)
7)
8)
9)
The overall Grid Monitor
Cluster description
Queue details
Job information
User information
Attributes overview
Customizable search
List of storage facilities
Lists of active users
Each module displays both dynamic and static information: for example, a queue name is static, while the
amount of running jobs in this queue is dynamic. Most of the displayed objects are linked to appropriate
modules, such that with a simple mouse click, a user can launch another module, expanding the information
about the corresponding object or attribute. Each such module opens in an own window, and gives access
to other modules in turn, providing thus a rather intuitive browsing.
In what follows, these modules are described in details, giving an overview of their functionality and usage
hints.
2
2.1
The Grid Monitor
The basic module, providing access to the most required information, is the Grid Monitor, showing the
overall status of the system. It serves as a starting point for browsing the system information. The purpose
of this module is to give a quick overview of the current status of the Grid infrastructure by showing the
list of the available clusters and the most essential information about them: an alias, number of working
processors, number of occupied processors and number of queuing jobs. In the current implementation, the
main Grid Monitor window contains also the link to the user base of the infrastructure. Figure 1 shows a
screenshot of the running monitor. All the information shown is dynamic, including organizational names
(countries in this case).
Figure 1: The Grid Monitor
In Figure 1, the numbered tags indicate clickable objects as explained below:
1) Cluster: a cluster alias, linked to the cluster description module (Section 2.2), which provides complete
information about the current status of a cluster.
2) Load: a graphical and numeric representation of the cluster load, showing both Grid- and non-Grid
(submitted locally) running processes. Colored bar shows percentage of Grid processes, while the grey
bar shows total relative occupancy of a cluster. Numbers indicate the absolute amount of running
processes, with first figure corresponding to the Grid, and second - to the non-Grid ones. It should
be noted that number of processes does not necessarily correspond to the number of running jobs: a
parallel job can occupy several processors. By clicking on a bar, a user accesses the list of all Grid
jobs, running on a cluster (Section 2.4).
3) Queuing: number of queuing jobs, which includes both jobs queued in an LRMS and those being
pre-processed by the Grid Manager [2]. Only jobs which can be potentially executed in a Grid queue
are counted. The number is linked to the same module as the Load item, with the only difference
that it displays the list of the Grid-queued jobs. Note that non-Grid jobs are counted in the total
number of queued jobs, while they can not be listed by the Grid Monitor, as they are not providing
any information in the ARC Information System.
4) Search: link to the custom search interface (Section 2.7) which allows users to compose non-standard
monitor requests.
5) Storage resources: link to the list of available storage resources (Section 2.8).
3
2.2
Cluster Description
The cluster description module displays all the cluster attributes stored in the local information tree, as well
as most relevant information about the queues, accessible by the Grid users. The window thus contains two
lists, as shown in Figure 2:
1) Attributes: this is a dump of all the attributes of the nordugrid-cluster objectclass, dynamic and static
ones. Such attributes as cluster alias, or domain name, are static; others are dynamic, with the values
obtained by the information providers: e.g., total CPU number, amount of jobs, or available disk space.
More details about these attributes can be found in the ARC Information System description [3]. Each
attribute (apart of the time stamps) is linked to the Attributes Overview module (Section 2.6), such
that clicking on an attribute name brings the list of the values of this particular attribute on all the
Grid clusters. For instance, this is the most convenient way to browse available disk space or runtime
environment values over the system.
2) Queues: the list of queues at a given cluster, accessible by the Grid users. While the detailed list
of queue attributes and corresponding jobs can be obtained by clicking on a queue name (see Queue
Details module description, Section 2.3), the most essential parameters are listed already in the Cluster
Description module. They are: queue name, queue status, queue length (minimal and maximal),
number of CPUs assigned to a queue (if available), and number of running and queued jobs. Since
queues can be shared between Grid and local users, the total number of jobs is shown, with the number
of Grid jobs in parentheses.
The Cluster Description module is linked from most other modules (except the List of Users one): clicking
on a domain name of a cluster brings the Cluster Description window.
2.3
Queue Details
In the ARC Information System, the nordugrid-queue objectclass is described by a set of queue-specific
attributes, and has two sub-trees: nordugrid-job and nordugrid-authuser. This structure reflects the fact that
users are not implicitly authorized to submit jobs to any queue. However, the list of users allowed to a
specific queue is a fairly static information, and thus is beyond the scope of the Grid Monitor† .
The Queue Details module provides the list of the queue attributes and of all the jobs scheduled (running
or waiting) to this queue. Figure 3 shows the queue description window, with clickable fields marked by
numbered tags as follows:
1) Attributes: the dump of the queue attributes. Just like the cluster attributes (Section 2.2), they can be
both static and dynamic. Every attribute is linked to the Attributes Overview module (Section 2.6),
which allows to browse the values of each attribute over all the Grid system.
2) Cluster name: each queue is associated with the cluster, which name is shown at the top of the window.
Clicking the cluster name brings up the Cluster Description window (Section 2.2).
3) Job name: from the Queue Details window, users can get access to detailed information about every
job in the queue by clicking the job name. Each job name is linked to the Job Information module,
described in Section 2.4.
4) Owner: The Grid authentication mechanism allows to associate every job with a corresponding user,
even though an actual Unix account owner may be a generic ”griduser”. The Grid Monitor uses this
feature to display explicitly each job owner. In the Queue Details window (as in all other modules),
user’s name is linked to the User Information module (Section 2.5), which displays all the resources
available for a given user, as well as the list of user’s jobs.
Queue Information module is accessible via links to queue names in the Cluster Information (Section 2.2),
Job Information (Section 2.4), User Information (Section 2.5) and Attributes Overview (Sec 2.6) modules.
† List
of queues available for a given user can be obtained through the User Information module
4
Figure 2: Grid cluster details
2.4
Job Information
The Job Information module is activated on three different occasions:
– To display a list of all running Grid jobs on a cluster
– To display a list of all queued Grid jobs on a cluster
– To show the full information on a given job
Lists of running and queued jobs are accessible from the top Grid Monitor window (Section 2.1) by clicking
the corresponding fields (marked 2 and 3 in Figure 1). As shown in Figure 4, such a list contains not only
job names, but also their respective owners, status (as returned by the Grid Manager), execution time (in
case of running jobs), and the submission queue.
Most of the fields in a job list window are linked to the corresponding monitor modules, giving access to
more detailed information:
1) Job name: just like in the Queue Details window (Section 2.3), the job name is linked to the Job
Information window, described below. However, while the Queue Details module lists the jobs in a
given queue, the Job Information window gives an overview of all the Grid jobs on a cluster.
5
Figure 3: Grid queue details
2) Owner: this field is also identical to the one in the Queue Details window: user’s name is linked to the
User Information module (Section 2.5), which displays all the resources available for a given user and
the list of user’s jobs.
3) Queue: the name of the queue is liked to the Queue Details window (Section 2.3), which gives a
snapshot of the queue status, including al the Grid jobs submitted to a particular queue – running or
waiting.
4) Cluster name: clicking on the cluster name brings up the Cluster Description window (Section 2.2),
which gives a general overview of a given cluster and the status of its queues (those available for the
Grid users).
The job information window is invoked by clicking on a job name in any Grid Monitor window which lists
jobs. It is handled by the same module which produces running/queued job list, and contains simple dump
of all the available job attributes (see Figure 5). Just like in the Cluster Description and Queue Description
windows, each attribute is clickable (as indicated by a tag numbered 1 in Figure 5), and is linked to the
Attributes Overview module (Section 2.6). This is a convenient way to compare jobs that reside on the
system.
Figure 4: Grid job list
6
Figure 5: Grid job statistics
2.5
User Information
The User Information module of the Grid Monitor gives access to all the available information, related to
a given user. This includes the list of available resources (queues, processors and disk space), and the list
of user jobs, residing on the system at the time of query. To collect this information, the whole system has
to be queried, therefore invocation of this module typically takes quite a bit of time (at least comparing to
most other modules).
Figure 6 shows a typical User Information window, where the numbered fields are linked to other Grid
Monitor modules:
1) Job name: this field is linked to the Job Information window (Section 2.4), providing access to the
detailed information on a given job. Unlike of Job Information or Queue Information modules, which
list local to a cluster jobs, the User Information module collects all the jobs submitted by a given user
to the whole system.
2) Cluster: since the User Information window displays all the jobs associated with a given user, description
of each respective cluster is available by clicking the cluster name. This brings up a cluster description
window, described in Section 2.2.
3) Queue: this field is linked to the Queue Details module (Section 2.3), thus giving access to the information about the status of the relevant queue.
4) Cluster: the upper part of the User Information window lists the Grid resources, available for a user.
Each cluster, to which a user is authorized to submit jobs, is indicated by its name. Cluster names
are linked to the Cluster Description window (Section 2.2), giving detailed information on available
resources.
5) Queue: since users authorization may be not only cluster-based, but also queue-based, the allowed
queue information can be accessed by clicking a queue name. This brings up the Queue Details
window, described in Section 2.3.
User Information can be invoked from any Grid Monitor window where a user name is displayed (e.g., an
Active Users list, a Job Information or a Queue Details window).
2.6
Attributes Overview
As it was mentioned above, every ARC objectclass attribute, appearing in a Grid Monitor window, is linked
to the Attributes Overview module, which queries all the relevant objects on the system and delivers a
7
Figure 6: Grid user information
comparative list of the attributes. Similarly to the User Information module, querying all the Grid resources
takes somewhat long time, as the Grid Monitor does not have an own cache.
This module can also be accessed via the search interface (Section 2.7). In this case, it can list as many
attributes as specified by a user request, eventually applying the user selection criteria.
Figure 7: Grid objects grouped by attribute
Figure 7 shows a typical result of the Attributes Overview query: in this example, the nordugrid-cluster
attribute ”Jobs, total amount” was queried, and a comparative list of results returned. The Resource field
(indicated by the tag 1) depends on the nature of the attribute, and can be either of:
– cluster name, linked to the Cluster Description module,
– cluster name and queue name, linked to the Cluster Description and Queue Details modules respectively,
– job ID string (see ref.[2] for details), linked to the Job Information module.
8
2.7
Custom search
The custom search is a customizable interface to the Attributes Overview module (Section 2.6). It allows
users to chose which attributes of an object to display, optionally applying filters. While the other Monitor
windows display a pre-defined set of data, this module gives an advanced user a possibility to build a
customized request to the Information System.
An example use case for this interface could be a user desiring to view a list of his running (but not queued
or finished) jobs, complete with used CPU and wall time, memory and job name. The search tool would be
then invoked for the job object, and the display request would contain Name, Used CPU time, Used wall time,
Used memory (KB), and Status – the latter with a filter Status = INLRMS: R .
Figure 8: Object class selection window
Figure 8 shows the first screenshot of the search interface, which welcomes users to select the object class
to work with, and the amount of attributes to be displayed. When not sure about the latter, users should
specify a top estimate – unused fields will be ignored in further searches.
Figure 9: Attribute selection window
Figure 9 is a snapshot of the screen where the attributes to display and their selection criteria are specified.
If a user wishes to display an attribute for all the objects, independently of its value, the rightmost field may
be either kept empty, or filled with an asterisk (*), while the middle field should be set to “=”. Whenever a
filter has to be applied, an operator should be selected in the middle column, and a match string specified in
the rightmost field. For example, if only clusters containing “NBI” in their domain names have to be shown,
the attribute filter would be Front-end domain name ∼ nbi . Matches are case-insensitive.
Figure 10: Customized cluster information display
Figure 10 is the result of the search according to the criteria defined in the example in Figure 9. Three filters
were applied: on operating system attribute, total number of CPUs and postal code (in this case we were
9
selecting any cluster which is not in Sweden). Since we wanted to display each cluster’s alias as well, this
attribute was added to the selection, but with a “match everything” scope. The attribute matching method
is exactly the same as used by the Attributes Overview module (Section 2.6), and it re-uses the screen layout
shown in Figure 7.
2.8
Storage Resources
Although there is no well-defined Storage Element concept in ARC, some information about the storage
resources can be found in the Information System. The Storage Resources module, linked from the main
Monitor window, displays all the available information for those Storage Elements which publish it. Particularly important is the base URL, which specifies the Grid mount point that could be used in job descriptions.
Figure 11: List of storage elements
different
3
Implementation notes
The Grid Monitor is implemented entirely in PHP, with optional usage of client-side JavaScript. Since all
the databases the Grid Monitor has to deal with are hierarchical LDAP ones, the server-side LDAP module
of PHP is absolutely necessary to be enabled in order to make the Grid Monitor functioning. The PHP
LDAP module conveniently allows parallel LDAP searches, – the feature heavily used by the Grid Monitor,
since it speeds up the data retrieval.
The Grid Monitor uses only minimal disk caching (overview window only), storing all the LDAP query
results in the memory. To minimize memory usage, only the attributes relevant to each query are retrieved.
The basic principle of information discovery in ARC is to traverse EGIIS indexing services harvesting ARIS
end-points, and then poll each ARIS (normally, in parallel).
Since the ARC architecture makes use of several equivalent bootstrap top-level EGIIS servers, the Monitor
queries all of them in order to have a reliable access to all the system information. In some cases, lower-level
ARIS servers can also be duplicated, hence the Monitor contains a built-in mechanism to filter duplicates.
Discovery of lower-level ARIS servers is done recursively, starting from the registration information in all the
top-level indexes, and ending at the local level. This recursive search method is invoked not only to discover
clusters in e.g., the main Monitor module, but also to locate storage facilities.
All the Grid Monitor windows are automatically refreshed by the means of the built-in browser HTML
instructions. Every window can be forcefully refreshed, printed and closed by using either standard browser
tools, or the provided JavaScript-enabled buttons.
In the top Monitor window, clusters are automatically grouped by geographical location. Alternatively, users
may chose to order them by e.g. capacity or load.
Such fields as cluster aliases, user names and attribute names, are customizable, and can be adjusted from the
stored in the information system values to any more appropriate ones, depending on the actual requirements.
In general, the Grid Monitor was designed to be a cross-browser, cross-platform tool, and have been shown
to work properly with all known browsers.
10
4
Installation and configuration
LDAP-based ARC Grid Monitor is distributed in the nordugrid-arc-ldap-monitor RPM and DEB binary
packages available in a variety of repositories (Fedora, Ubuntu, NorduGrid, EMI, UMD), and can therefore
be deployed in a standard manner by a system administrator.
However, being just a set of PHP scripts, Monitor can also be deployed by any non-privileged user by
unpacking the contents of the packages, or obtaining the scripts from the ARC code repository. Please
consult README file distributed with the package for necessary dependencies and configuration suggestions.
The Monitor can be installed via manual unpacking on any non-Linux operating system which has an HTTP
server with PHP enabled, and PHP’s LDAP and GD modules installed. Consult PHP installation notes on
a given system for details.
Be generous when configuring PHP memory consumption limits: few dozen megabytes may be needed,
depending on the size and load of your infrastructure.
In general, the following software must be present at the Web server that wishes to host the Monitor:
1. GD library (e.g. http://www.boutell.com/gd/)
2. OpenLDAP library (e.g. http://www.openldap.org)
3. PHP4 or PHP5 (http://www.php.net) with OpenLDAP and GD modules (available with all common
distributions)
4. HTTP server with PHP4 or PHP5 (commonly available as well)
In order to install the Monitor manually, do the following:
1. unpack the files in a folder accessible by your HTTP server;
2. verify that this folder contains a directory called cache and that it is writable by the HTTP server.
If your server is configured to have write access only to a specific location, such as e.g. ../htdata,
modify CACHE LOCATION value in includes/settings.inc accordingly;
3. modify includes/settings.inc according to your information system structure and liking: most
likely, you want to modify the bootstrap $giislist array by removing some servers and adding
other(s). By default the Monitor is configured to poll NorduGrid servers;
4. test installation by opening file loadmon.php in a browser. More verbose output for debugging purposes
can be achieved by using loadmon.php?debug=1 or loadmon.php?debug=2.
Configuration of few necessary parameters is done via the file includes/settings.inc. Normally, no
adjustments are needed, except of the bootstrap tuning explained above.
To make output more human-readable or adjust it for your mother tongue, you may wish to modify translations in /lang/*.inc and strings in includes/cnvname.inc and includes/cnvalias.inc.
In order to avoid misbehaving sites from being polled, modify includes/blacklist.inc: filtering is switched
on by flag “1”. Otherwise, the file is not needed and can even be removed.
5
Acknowledgements
This work was supported in parts by: the Nordunet 2 program, the Nordic DataGrid Facility, the EU
KnowARC project (Contract nr. 032691), the EU EMI project (Grant agreement nr. 261611) and the
Swedish Research council via the eSSENCE strategic research program.
11
References
[1] T. Converse and J. Park. PHP 4 Bible. John Wiley & Sons, Inc., New York, NY, USA, 2000. ISBN
076454716X.
[2] A. Konstantinov. The NorduGrid Grid Manager And GridFTP Server: Description And Administrator’s Manual. The NorduGrid Collaboration. URL http://www.nordugrid.org/documents/GM.pdf.
NORDUGRID-TECH-2.
[3] B. Kónya. The NorduGrid/ARC Information System. The NorduGrid Collaboration. URL http:
//www.nordugrid.org/documents/arc_infosys.pdf. NORDUGRID-TECH-4.
[4] M. Smith and T. A. Howes. LDAP : Programming Directory-Enabled Applications with Lightweigt Directory Access Protocol. Macmillan, 1997.
Index
Numbers written in italic refer to the page where the corresponding entry is described; numbers underlined
refer to the definition; numbers in roman refer to the pages where the entry is used.
A
attributes . . . . . . . . . . . . . . . . . 7
cluster . . . . .
alias . . . .
attributes
load . . . .
.
.
.
.
.
.
.
.
C
..
..
..
..
.
.
.
.
.
.
.
.
.
.
.
.
.
.
.
.
.
.
.
.
.
.
.
.
.
.
.
.
.
.
.
.
.
.
.
.
.
.
.
.
4
3
4
3
D
disk space . . . . . . . . . . . . . . . . . 4
G
grid monitor . . . . . . . . . . . . . . . 3
job . . . . . . . . .
on cluster .
by user . . .
in a queue .
information
.
.
.
.
.
J
..
..
..
..
..
.
.
.
.
.
.
.
.
.
.
.
.
.
.
.
.
.
.
.
.
.
.
.
.
.
.
.
.
.
.
.
.
.
.
.
.
.
.
.
.
.
.
.
.
.
.
.
.
.
.
4
5
7
4
6
name .
owner .
parallel
queued
queuing
running
.
.
.
.
.
.
.
.
.
.
.
.
.
.
.
.
.
.
.
.
.
.
.
.
.
.
.
.
.
.
.
.
.
.
.
.
.
.
.
.
.
.
.
.
.
.
.
.
.
.
.
.
.
.
.
.
.
.
.
.
.
.
.
.
.
.
.
.
.
.
.
.
.
.
.
.
.
.
.
.
.
.
.
.
.
.
.
.
.
.
.
.
.
.
3,
4
4
3
5
3
5
L
language . . . . . . . . . . . . . . . . . . 2
M
modules . . . . . . . . . . . . . . . . . . 2
N
nordugrid-authuser
nordugrid-cluster .
nordugrid-job . . . .
nordugrid-queue . .
.
.
.
.
.
.
.
.
.
.
.
.
.
.
.
.
.
.
.
.
.
.
.
.
.
.
.
.
.
.
.
.
.
.
.
.
.
.
.
.
2
2
2
2
O
objectclass . . . . . . . . . . . . . . . . 2
12
queue . . . . . .
attributes
length . . .
list . . . . .
name . . .
.
.
.
.
.
.
.
.
.
.
Q
..
..
..
..
..
.
.
.
.
.
.
.
.
.
.
.
.
.
.
.
.
.
.
.
.
.
.
.
.
.
.
.
.
.
.
.
.
.
.
.
.
.
.
.
.
.
.
.
.
.
.
.
.
.
.
4
4
4
4
4
R
resources . . . . . . . . . . . . . . . . . 7
runtime environment . . . . . . . . . 4
search
storage
Storage
Storage
.......
.......
Element
resources
S
..
..
..
.
.
.
.
.
.
.
.
.
.
.
.
.
.
.
.
.
.
.
.
.
.
.
.
.
.
.
.
.
.
.
.
.
3, 9
.. 3
. 10
. 10
U
user information . . . . . . . . . . . . 7