1
Intel® SDK for OpenCL™
Applications 2014
User Manual
Copyright © 2010–2014, Intel Corporation. All Rights Reserved
Contents
Legal Information ................................................................................................................. 5
Getting Help and Support ...................................................................................................... 7
What is New.......................................................................................................................... 8
Code Editing and Building with Visual Studio* Plug-in .......................................................... 9
OpenCL™ API Offline Compiler Plug-in for Microsoft Visual Studio* IDE .................................. 9
Configuring Microsoft Visual Studio* IDE ............................................................................ 9
Converting Existing Project into OpenCL™ Project .............................................................. 10
Building OpenCL™ Project ............................................................................................... 10
Using OpenCL™ Build Properties ...................................................................................... 10
Selecting Target OpenCL™ Device .................................................................................... 11
Generating and Viewing Assembly Code ............................................................................ 11
Generating and Viewing LLVM Code .................................................................................. 12
Generating Intermediate Program Binaries with Offline Compiler Plug-in ............................... 13
Configuring OpenCL™ Build Options ................................................................................. 13
Code Editing and Building with Eclipse* Plug-in ................................................................. 14
OpenCL™ API Offline Compiler for Eclipse* IDE .................................................................. 14
Configuring OpenCL™ API Offline Compiler Plug-in for Eclipse* IDE ...................................... 14
Configuring Options ............................................................................................... 14
Building and Compiling Kernels in Eclipse* IDE .................................................................. 15
Generating Assembly Code in Eclipse* IDE ........................................................................ 16
Linking Program Binaries in Eclipse* IDE ........................................................................... 16
Saving and Loading OpenCL™ Code in Eclipse* IDE ............................................................ 16
Saving Intermediate Representation Code in Eclipse* IDE ................................................... 17
Building and Analyzing with Kernel Builder ........................................................................ 18
Kernel Builder for OpenCL™ API ....................................................................................... 18
Using Kernel Builder ....................................................................................................... 18
Building and Compiling Kernels ............................................................................... 18
Saving and Loading Code ....................................................................................... 19
Saving and Loading Session .................................................................................... 19
LLVM, SPIR, and Assembly Code View ...................................................................... 20
Generating Intermediate Program Binaries ............................................................... 20
Linking Program Binaries ........................................................................................ 21
Configuring Options ............................................................................................... 21
Configuring Linkage Options ................................................................................... 24
Kernel Performance Analysis ............................................................................................ 27
Analyzing OpenCL™ Kernel Performance .................................................................. 27
Managing Variables................................................................................................ 28
Viewing Analysis Results ........................................................................................ 35
Deep Kernel Analysis in Kernel Builder ..................................................................... 36
Building with Kernel Builder Command-Line Interface........................................................ 40
OpenCL™ Debugger for Linux* OS ...................................................................................... 42
Debugging with Visual Studio* Plug-in ............................................................................... 45
OpenCL™ Debugger ....................................................................................................... 45
Enabling Debugging in OpenCL™ Runtime ......................................................................... 45
Configuring Debugger ..................................................................................................... 46
2
Legal Information
Changing Debugging Port ................................................................................................ 46
Troubleshooting the Debugger ......................................................................................... 47
API Debugging in Visual Studio* ...................................................................................... 47
OpenCL™ API Debugger ......................................................................................... 47
Enabling the API Debugger ..................................................................................... 48
Trace View............................................................................................................ 49
Objects Tree View.................................................................................................. 51
Properties View ..................................................................................................... 52
Command Queue View ........................................................................................... 55
Problems View ...................................................................................................... 56
Image View .......................................................................................................... 57
Data View ............................................................................................................. 61
Memory Tracing .................................................................................................... 66
OpenCL™ Development for Android* OS ............................................................................. 67
Configuring the Environment ........................................................................................... 67
Creating an Android* Emulator ........................................................................................ 68
Installing OpenCL™ Runtime on Android* Emulator ............................................................ 69
Creating an Android* Application...................................................................................... 71
Preview Features ................................................................................................................ 73
OpenCL™ 2.0 Experimental Development Environment ....................................................... 73
OpenCL™ New Project Wizard .......................................................................................... 73
About the OpenCL™ New Project Wizard .................................................................. 73
Creating an Empty OpenCL™ Project for Windows*.................................................... 74
Create a New OpenCL™ Project from OpenCL Project Template for Windows* ............... 74
Create a New OpenCL™ Project from OpenCL Project Template for Android* ................ 76
OpenCL™ Scholar ........................................................................................................... 78
About OpenCL™ Scholar ......................................................................................... 78
Enabling OpenCL™ Scholar ..................................................................................... 79
OpenCL™ Scholar Hints .......................................................................................... 80
Debugging Kernels on Intel® Graphics ............................................................................. 82
About Kernel Debugger .......................................................................................... 82
Assigning Debug Parameters................................................................................... 83
Kernel Debugger Controls ....................................................................................... 84
Selecting Work-Items and Work-Groups to Debug ..................................................... 85
Watching Variables and Kernel Arguments ................................................................ 86
OpenCL™ Analysis Tool ................................................................................................... 87
About the OpenCL™ Analyze Tool ............................................................................ 87
Creating and Launching New Analyze Session ........................................................... 87
Analyzing the Data ................................................................................................ 88
Revising Code and Rerunning Session ...................................................................... 90
Configuring the Analyze Tool................................................................................... 90
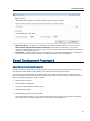
Kernel Development Framework....................................................................................... 91
About Kernel Development Framework ..................................................................... 91
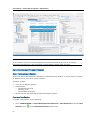
Kernel Development Framework Session .................................................................. 92
Building and Compiling OpenCL™ Program ............................................................... 97
Build Artifacts ....................................................................................................... 98
Kernel Arguments .................................................................................................. 98
3
User Manual – Intel® SDK for OpenCL™ Applications
Code Builder Build Toolbar ...................................................................................... 99
Analyzing Kernel Performance ................................................................................. 99
Variable Management .......................................................................................... 102
4
Legal Information
Legal Information
By using this document, in addition to any agreements you have with Intel, you accept the terms set
forth below.
You may not use or facilitate the use of this document in connection with any infringement or other
legal analysis concerning Intel products described herein. You agree to grant Intel a non-exclusive,
royalty-free license to any patent claim thereafter drafted which includes subject matter disclosed
herein.
INFORMATION IN THIS DOCUMENT IS PROVIDED IN CONNECTION WITH INTEL PRODUCTS. NO
LICENSE, EXPRESS OR IMPLIED, BY ESTOPPEL OR OTHERWISE, TO ANY INTELLECTUAL PROPERTY
RIGHTS IS GRANTED BY THIS DOCUMENT. EXCEPT AS PROVIDED IN INTEL'S TERMS AND
CONDITIONS OF SALE FOR SUCH PRODUCTS, INTEL ASSUMES NO LIABILITY WHATSOEVER AND
INTEL DISCLAIMS ANY EXPRESS OR IMPLIED WARRANTY, RELATING TO SALE AND/OR USE OF INTEL
PRODUCTS INCLUDING LIABILITY OR WARRANTIES RELATING TO FITNESS FOR A PARTICULAR
PURPOSE, MERCHANTABILITY, OR INFRINGEMENT OF ANY PATENT, COPYRIGHT OR OTHER
INTELLECTUAL PROPERTY RIGHT.
A "Mission Critical Application" is any application in which failure of the Intel Product could result,
directly or indirectly, in personal injury or death. SHOULD YOU PURCHASE OR USE INTEL'S PRODUCTS
FOR ANY SUCH MISSION CRITICAL APPLICATION, YOU SHALL INDEMNIFY AND HOLD INTEL AND ITS
SUBSIDIARIES, SUBCONTRACTORS AND AFFILIATES, AND THE DIRECTORS, OFFICERS, AND
EMPLOYEES OF EACH, HARMLESS AGAINST ALL CLAIMS COSTS, DAMAGES, AND EXPENSES AND
REASONABLE ATTORNEYS' FEES ARISING OUT OF, DIRECTLY OR INDIRECTLY, ANY CLAIM OF
PRODUCT LIABILITY, PERSONAL INJURY, OR DEATH ARISING IN ANY WAY OUT OF SUCH MISSION
CRITICAL APPLICATION, WHETHER OR NOT INTEL OR ITS SUBCONTRACTOR WAS NEGLIGENT IN THE
DESIGN, MANUFACTURE, OR WARNING OF THE INTEL PRODUCT OR ANY OF ITS PARTS.
Intel may make changes to specifications and product descriptions at any time, without notice.
Designers must not rely on the absence or characteristics of any features or instructions marked
"reserved" or "undefined". Intel reserves these for future definition and shall have no responsibility
whatsoever for conflicts or incompatibilities arising from future changes to them. The information here
is subject to change without notice. Do not finalize a design with this information.
The products described in this document may contain design defects or errors known as errata which
may cause the product to deviate from published specifications. Current characterized errata are
available on request.
Contact your local Intel sales office or your distributor to obtain the latest specifications and before
placing your product order.
Copies of documents which have an order number and are referenced in this document, or other Intel
literature, may be obtained by calling 1-800-548-4725, or go to:
http://www.intel.com/design/literature.htm.
Intel processor numbers are not a measure of performance. Processor numbers differentiate features
within each processor family, not across different processor families. Go to:
http://www.intel.com/products/processor_number/.
Software and workloads used in performance tests may have been optimized for performance only on
Intel microprocessors. Performance tests, such as SYSmark and MobileMark, are measured using
specific computer systems, components, software, operations and functions. Any change to any of
those factors may cause the results to vary. You should consult other information and performance
tests to assist you in fully evaluating your contemplated purchases, including the performance of that
product when combined with other products.
5
User Manual – Intel® SDK for OpenCL™ Applications
Intel, Intel logo, Intel Core, VTune, Xeon are trademarks of Intel Corporation in the U.S. and other
countries.
This document contains information on products in the design phase of development.
* Other names and brands may be claimed as the property of others.
OpenCL and the OpenCL logo are trademarks of Apple Inc. used by permission from Khronos.
Microsoft product screen shot(s) reprinted with permission from Microsoft Corporation.
Copyright © 2010-2014 Intel Corporation. All rights reserved.
6
Getting Help and Support
To get support, visit the product support forum at http://software.intel.com/en-us/forums/intelopencl-sdk/.
For information on SDK requirements, known issues and limitations, refer to the Release Notes.
7
What is New
Comparing to the User's Guide of the Intel® SDK for OpenCL™ Applications 2014 R1, the User Manual
now has the following changes:
•
•
•
•
•
•
•
The document is divided into the User Manual - with the information about tools, and two
Reference Manuals - one with information on the OpenCL Runtime for Intel CPUs and Intel
Processor Graphics, and another with the information on the OpenCL Runtime for Intel CPUs and
Intel Xeon Phi coprocessors
Updated guideline for using Code Builder options in Visual Studio
Added a section about the OpenCL 2.0 Experimental Development Environment
Renamed the JumpStart feature - now it is called the OpenCL New Project Wizard
Added new chapter about the new tool - OpenCL Analysis Tool
Added new chapter about the new tool - Kernel Development Framework
Other minor corrections
Please submit your feedback if you have any comments or suggestions regarding this document
contents, structure, and so on.
8
Code Editing and Building with Visual
Studio* Plug-in
OpenCL™ API Offline Compiler Plug-in for Microsoft
Visual Studio* IDE
OpenCL™ API Offline Compiler plug-in for Microsoft Visual Studio* IDE enables you to develop OpenCL
applications with Visual Studio IDE.
The plug-in supports the following features:
•
•
•
•
•
•
•
•
•
New project templates
New OpenCL file (*.cl) template
Syntax highlighting
Types and functions auto-completion
Offline compilation and build of OpenCL kernels
LLVM code view
Assembly code view
Program IR generation
Selection of target OpenCL device – CPU or Intel Graphics
NOTE
To work with the plug-in features, create an OpenCL project template or convert an existing project
into the OpenCL project.
See Also
Converting Existing Projects into OpenCL Projects
Configuring Microsoft Visual Studio* IDE
To configure the OpenCL™ API Offline Compiler plug-in for Microsoft Visual Studio* IDE, do the
following:
1. In the Visual Studio software select Project > Properties.
2. In the C/C++ > General property page, under Additional Include Directories, enter the full
path to the directory where the OpenCL header files are located:
$(INTELOCLSDKROOT)\include
3. In the Linker > General property page, under Additional Library Directories, enter the full
path to the directory where the OpenCL run-time import library file is located. For example, for
64-bit application:
9
User Manual – Intel® SDK for OpenCL™ Applications
$(INTELOCLSDKROOT)\lib\x64
4. In the Linker > Input property page, under Additional Dependencies, enter the name of the
OpenCL ICD import library file OpenCL.lib.
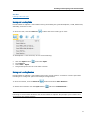
Converting Existing Project into OpenCL™ Project
OpenCL™ API Offline Compiler plug-in for Microsoft Visual Studio* IDE enables you to convert a
standard C/C++ project to an OpenCL project and vice versa.
To convert your project, do the following:
1. Right-click the project you want to convert in the Solution Explorer.
2. In the project menu click Convert to a project for OpenCL API.
Building OpenCL™ Project
To build the solution using OpenCL™ API Offline Compiler plug-in for Microsoft Visual Studio* IDE,
click Build > Build Solution.
When building solution, Intel OpenCL compiler automatically builds attached OpenCL kernels. See the
build result in the Output build dialog of the Microsoft Visual Studio IDE.
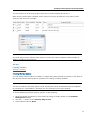
Using OpenCL™ Build Properties
OpenCL Build properties page in the Microsoft Visual Studio* IDE enables you to set compilation
flags and change target device when building an OpenCL kernel. To change the settings, do the
following:
1. Go to Project > Properties.
10
Code Editing and Building with Visual Studio* Plug-in
2. Click the Intel SDK for OpenCL Applications entry under the Configuration Properties group.
3. Modify properties and click OK.
NOTE
The Intel® SDK for OpenCL™ Applications entry exists for OpenCL projects with *.cl source
files attached. If the entry does not exist, convert an existing standard project into the OpenCL
project.
See Also
Creating an Empty OpenCL™ Project
Converting Existing Project into OpenCL Project
Selecting Target OpenCL™ Device
OpenCL™ API Offline Compiler plug-in for Microsoft Visual Studio* IDE enables you to choose the
target device when building your OpenCL code:
•
•
•
•
Intel CPU
Intel® Graphics
Intel Xeon Phi™ coprocessor
Intel CPU on Experimental OpenCL 2.0 Platform
The default device is CPU.
To choose a target device, do the following:
1.
2.
3.
4.
Go to Project > Properties.
Click Configuration Properties > Intel SDK for OpenCL Applications > General.
Change the Device option according your needs.
Click OK.
Generating and Viewing Assembly Code
OpenCL™ API Offline Compiler plug-in for Microsoft Visual Studio* IDE enables generating assembly
representation of the OpenCL code. To enable generating and viewing the assembly code, do the
following:
1. Go to Project > Properties.
2. Click Configuration Properties > Intel SDK for OpenCL Applications > General.
11
User Manual – Intel® SDK for OpenCL™ Applications
3. Change the Generate Assembly Code option to Yes.
4. Click OK.
After the build, you can open the generated assembly file in the Visual Studio editor by double-clicking
the message in the Output view.
Generating and Viewing LLVM Code
OpenCL™ API Offline Compiler plug-in for Microsoft Visual Studio* IDE enables generating LLVM
representation of the OpenCL code. To enable generating and viewing LLVM code, do the following:
1. Go to Project > Properties.
2. Click Configuration Properties > Intel SDK for OpenCL Applications > General.
3. Change the Generate LLVM Code option to Yes.
After the build, you can open the generated LLVM file in the Visual Studio editor by double-clicking the
message in the Output view.
12
Code Editing and Building with Visual Studio* Plug-in
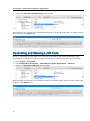
Generating Intermediate Program Binaries with Offline
Compiler Plug-in
OpenCL™ API Offline Compiler plug-in for Microsoft Visual Studio* IDE generating program binaries of
the OpenCL code.
An application can use generated program binaries to create program from binaries later
(clCreateProgramFromBinary(…)). To generate intermediate program binaries, do the following:
1. Go to Project > Properties.
2. Click Configuration Properties > Intel SDK for OpenCl Applications > General.
3. Change the Create Program Binary option to Yes.
4. Click OK.
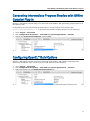
Configuring OpenCL™ Build Options
OpenCL™ API Offline Compiler plug-in for Microsoft Visual Studio* IDE enables configuring build
options for the OpenCL code. To configure the build options, do the following:
1. Go to Project > Properties.
2. Click Configuration Properties > Intel SDK for OpenCL Applications > General.
3. Add build options into the Additional build options line.
4. Click OK.
13
Code Editing and Building with Eclipse*
Plug-in
OpenCL™ API Offline Compiler for Eclipse* IDE
OpenCL™ API Offline Compiler plug-in for Eclipse* IDE enables developing OpenCL kernels with the
Eclipse IDE. The Offline Compiler plug-in supports Eclipse versions 4.2 (Juno), 4.3 (Kepler), and 4.4
(Luna).
The plug-in supports the following features:
•
•
•
•
•
Offline compilation, build and link of OpenCL kernels
LLVM code generation
Assembly code generation
program IR generation
Target OpenCL device selection
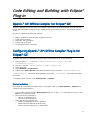
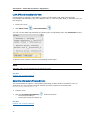
Configuring OpenCL™ API Offline Compiler Plug-in for
Eclipse* IDE
To enable the OpenCL™ API Offline Compiler plug-in for Eclipse* IDE, do the following:
1. Copy the plug-in *.jar file from $(INTELOCLSDKROOT)\bin\eclipse-plug-in to
$(ECLIPSEROOT)\dropins.
2. On Linux* OS add $(INTELOCLSDKROOT)\bin to LD_LIBRARY_PATH.
3. Run Eclipse IDE.
4. Select Window > Preferences.
5. Switch to the Intel OpenCL dialog and set OpenCL binary directory$(INTELOCLSDKROOT)\bin\
$(INTELOCLSDKROOT) represents SDK installation root folder, $(ECLIPSEROOT) represents the Eclipse
root folder.
To configure other options, select Intel OpenCL > Options.
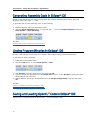
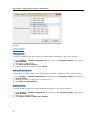
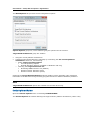
Configuring Options
In the OpenCL™ API Offline Compiler Plug-in for Eclipse* IDE, go to Intel OpenCL > Options and
configure the needed options:
•
•
•
Type the build options into the Build Options text box or click "..." to add options from list. Hold
Ctrl to select several options.
Select the target architecture:
o x86 for 32-bit architecture
o x64 for 64-bit architecture
Select the target instruction set:
o Streaming SIMD Extension 4.2 (SSE4.2)
o Advanced Vector Extensions (Intel AVX)
o Advanced Vector Extensions 2 (Intel AVX2)
14
Code Editing and Building with Eclipse* Plug-in
•
•
Select the build type:
o Debug
o Build
Select the OpenCL Device type:
o Intel CPU
o Intel Graphics
o Intel Xeon Phi™ coprocessor
o Intel CPU on Experimental OpenCL 2.0 Platform
NOTE
Intel Graphics support is available on Windows* OS only.
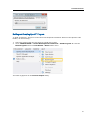
Building and Compiling Kernels in Eclipse* IDE
To build or compile an OpenCL™ kernel using the OpenCL™ API Offline Compiler plug-in for Eclipse*
IDE, do the following:
1. Write code into the Eclipse code editor or load code from file.
2. Click the Build
or Compile
button at the tool bar, or right-click the file in the project
explorer and select Intel OpenCL > Build or Compile.
After compilation completes, the output appears in the Console tab of the Eclipse IDE.
Error and warning messages appear in the Problems tab.
See Also
Saving and Loading OpenCL™ Code in Eclipse* IDE
15
User Manual – Intel® SDK for OpenCL™ Applications
Generating Assembly Code in Eclipse* IDE
OpenCL™ API Offline Compiler plug-in for Eclipse* IDE enables generating and viewing files with
assembly code of the input *.cl files.
To generate and view the assembly code, do the following:
1. Build the OpenCL code from the Eclipse editor.
2. Click the Show Assembly button, or right-click the *.cl file in the Project Explorer, and select
Intel OpenCL > View Assembly.
See Also
Building and Compiling Kernels in Eclipse* IDE
Linking Program Binaries in Eclipse* IDE
OpenCL™ API Offline Compiler plug-in for Eclipse* IDE enables linking several compiled files.
To link binaries, do the following:
1. Build code in the Eclipse editor.
2. Click the Link button, or select Intel OpenCL > Link.
3. Click Browse, select the input files to link, and click OK.
4. Type the output file destination into the Output File text box, or click Browse to specify the path
using graphics user interface.
5. Specify OpenCL device type and Architecture in the Target Configuration group box and click
OK.
See Also
Configuring Offline Compiler for Eclipse* IDE
Building and Compiling Kernels in Eclipse* IDE
Saving and Loading OpenCL™ Code in Eclipse* IDE
Create a C/C++ eclipse project to open or link *.cl files in Eclipse* IDE.
16
Code Editing and Building with Eclipse* Plug-in
NOTE
Install the Eclipse C/C++ Development Tool (CDT) to work with the Offline Compiler capabilities.
To save a *.cl file using OpenCL™ API Offline Compiler plug-in for Eclipse* IDE, do the following:
1. In the Eclipse user interface select File > Save As...
2. Enter or select folder to save the file.
3. Type the file name and click OK.
To load OpenCL™ code from file into the Eclipse* IDE code editor, do the following:
1.
2.
3.
4.
Right-click the target C/C++ project and select Import...
Go to General > File system and click Next.
Click Browse, select the folder with the files you need to import, and click OK.
Select the files you need to import and click Finish.
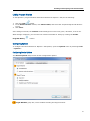
Saving Intermediate Representation Code in Eclipse*
IDE
To save the Intermediate Representation code using the OpenCL™ API Offline Compiler plug-in for
Eclipse* IDE, do the following:
1. Compile an *.cl file using the Offline Compiler plug-in for Eclipse IDE.
2. Select Intel OpenCL > Save IR Binary, add file name, select path, and click Save.
17
Building and Analyzing with Kernel
Builder
Kernel Builder for OpenCL™ API
The Kernel Builder for OpenCL™ API is the standalone version of the OpenCL Code Builder. It enables
you to build and analyze OpenCL kernels. The tool supports Intel® processors, Intel Graphics, and
Intel Xeon Phi coprocessors. The tool provides full offline OpenCL language compilation, which
includes:
•
•
•
•
•
OpenCL syntax checker
Cross-platform compilation
Low Level Virtual Machine (LLVM) viewer
Assembly code viewer
Intermediate program binary generator
With the Analyze Board of the Kernel Builder you can:
•
•
•
Assign input to the kernel and test its correctness
Analyze kernel performance based on:
o Group size
o Build options
o Device
Perform Deep Kernel Analysis
NOTE
Intel Graphics support is available on Windows* OS only.
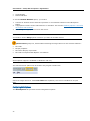
Using Kernel Builder
Building and Compiling Kernels
To build or compile an OpenCL™ kernel using the Kernel Builder for OpenCL API, do the following:
1. Write your code into the code editor or load code from file.
2. Click Build
or Compile
.
If you succeed, the Console window background color turns green, otherwise, it turns red.
In case of failure the Kernel Builder reports the number of the problematic line. Double-click the error
line in the Console text box to jump to the relevant line in the code.
You can save the compiled binary by clicking the Create Program Binary
button.
18
Building and Analyzing with Kernel Builder
See Also
Loading Code from File
Saving and Loading Code
Kernel Builder for OpenCL™ API enables saving and loading the generated OpenCL, LLVM, SPIR LLVM,
Assembly, and source code.
To save the code, click the Save As
button and select code type to save:
To load OpenCL™ code from file, do one of the following:
•
•
•
•
Click the Open button
and select Open.
Press Ctrl+O.
Select File > Open.
Drag and drop file into the code editor window.
Saving and Loading Session
Kernel Builder for OpenCL™ API enables saving the current session. A ‘Session’ is all the open tabs
including their configured options and analysis configurations.
To save the session, click the Save As
button and select Save Session…
To load a saved session click the Open button
and select Load Session…
NOTE
Following an unsuccessful shutdown the Kernel Builder for OpenCL API prompts you to restore one
of the last 5 auto saved sessions.
19
User Manual – Intel® SDK for OpenCL™ Applications
LLVM, SPIR, and Assembly Code View
Kernel Builder for OpenCL™ API enables viewing the generated LLVM, SPIR, and Assembly
intermediate representation (IR) of the OpenCL code. To view the LLVM, SPIR, or Assembly code, do
the following:
1. Build your kernel.
2. Click Show LLVM
or Show Assembly
.
You can view the SPIR representation by selecting the corresponding tab in the LLVM View window:
To hide the view windows, click the corresponding button again.
NOTE
Assembly code view is available for the CPU device only.
See Also
Building and Compiling Kernels
Generating Intermediate Program Binaries
The Kernel Builder for OpenCL™ API enables generating program binaries of OpenCL code. An
application can use generated program binaries to create program from binaries later
(clCreateProgramFromBinary(…)).
1. Build the code.
2. Click the Create Program Binary
o Create Program Binary...
o Create linked program's binary IR
See Also
Building and Compiling Kernels
20
button and select:
Building and Analyzing with Kernel Builder
Linking Program Binaries
To link OpenCL™ program binaries with Kernel Builder for OpenCL™ API, do the following:
1. Click the Link
button.
2. In the Select IR Files window, click Choose Files, and select the compiled objects and libraries
to link.
3. Click Done.
If the linkage succeeds, the Console window background color turns green, otherwise, it turns red.
When linkage completes, you can save the created executable or library by clicking the Create
Program Binary
button.
Configuring Options
To configure the Kernel Builder for OpenCL™ API options, open the Options menu by selecting Tools
> Options…
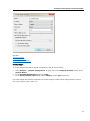
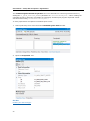
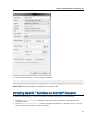
Configuring Device Options
The Device Options tab provides several configuration options.
Target Machine group box, which enables selecting the target machine:
21
User Manual – Intel® SDK for OpenCL™ Applications
•
•
Local Machine
Remote Machine
To use the Remote Machine option, you need to
1. Connect an Android* device with Intel processor or an emulator based on Intel x86 System
Image.
2. Copy OpenCL runtime to the Android device or emulator. See section Installing OpenCL™ Runtime
on Android* OS Emulator.
3. Click Setup to copy OpenCL tools to the device.
NOTE
You need to use the Setup option each time you start an emulator device.
OpenCL Device group box, which enables selecting the target device for the selected machine:
•
•
•
•
Intel CPU
Intel(R) Graphics
Intel Xeon Phi(tm) coprocessor
Intel CPU on Experimental OpenCL 2.0 Platform
NOTE
Intel Graphics support is available on Windows* OS only.
The selected device options can be found in the program window title.
NOTE
Select the target device for each Code editor tab separately. CPU device is default for all open
tabs.
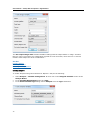
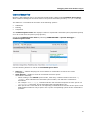
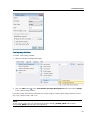
Configuring Build Options
The Build Options tab provides several configuration options.
22
Building and Analyzing with Kernel Builder
OpenCL Options group box, which enables
•
•
Typing the options into the text box.
Selecting options from the list, available on clicking the … button. To select several options from
the list, hold Ctrl.
Target Build Architecture group box, which enables:
•
•
Using the current platform architecture.
Configuring the build architecture manually by unchecking the Use current platform
architecture check box, and selecting:
o Select Target operating system:
Current Operating System
Android Operating System (available on Windows* OS only)
o Choosing the Target instruction set:
Streaming SIMD Extension 4.2 (SSE4.2)
Advanced Vector Extension (AVX)
Advanced Vector Extension (AVX2)
Name of the selected instruction set architecture appears in the main window top bar as an indicator,
next to the file name.
Changing the Target Build Architecture options enables viewing assembly code of different
instruction set architectures and generating program binaries for different hardware platforms.
23
User Manual – Intel® SDK for OpenCL™ Applications
NOTE
Target Build Architecture options are available for the CPU device only.
To enable Stripped LLVM generation, check the Replace meaningful names with arbitrary
one checkbox.
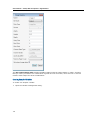
Configuring Advanced Options
The Advanced Options tab provides several configuration options.
Network Settings group box, which enables configuring the network port range.
Android Support text box, which enables specifying the path to the Android* Debug Bridge
(adb).
See Also
Configuring the Environment
Installing OpenCL™ Runtime on Android* Emulator
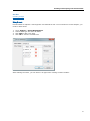
Configuring Linkage Options
To configure device options for linkage of the OpenCL™ code, use the Linkage Options menu of the
Kernel Builder for OpenCL™ API. Open the Linkage Options menu by clicking Linkage button
> Link Options.
Configuring Device Options for Linkage
The Device Options tab provides several configuration options.
24
Building and Analyzing with Kernel Builder
Target Machine group box, which enables selecting the target machine:
•
•
Local Machine
Remote Machine
To use the Remote Machine option, you need to
1. Connect an Android* device with Intel processor or an emulator based on Intel x86 System
Image.
2. Copy OpenCL runtime to the Android device or emulator. See sections Installing OpenCL™
Runtime on Android* OS Emulator and Configuring the Environment.
3. Click Setup to copy OpenCL tools to the device.
NOTE
You need to use the Setup option each time you start an emulator device.
OpenCL Device group box, which enables selecting the target device for the selected machine:
•
•
•
•
Intel CPU
Intel(R) Graphics
Intel Xeon Phi(tm) coprocessor
Intel CPU on Experimental OpenCL 2.0 Platform
25
User Manual – Intel® SDK for OpenCL™ Applications
NOTE
Intel Graphics support is available on Windows* OS only.
The selected device options can be found in the program window title.
NOTE
Select the target device for each Code editor tab separately. CPU device is default for all open
tabs.
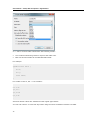
Configuring Link Options
The Link Options tab provides several configuration options.
OpenCL Options group box, which enables
•
•
Typing the options into the text box.
Selecting options from the list, available on clicking the … button. To select several options from
the list, hold Ctrl.
See Also
Configuring the Environment
Installing OpenCL™ Runtime on Android* Emulator
26
Building and Analyzing with Kernel Builder
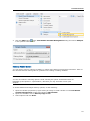
Kernel Performance Analysis
Analyzing OpenCL™ Kernel Performance
To analyze OpenCL™ kernel performance with the Kernel Builder for OpenCL API, do the following:
1. Click the Analyze
button.
2. Click Refresh kernel(s) to get the list of kernels in the currently open *.cl file.
3. Select the target kernel from pull-down menu. If only one kernel is available, it is selected by
default.
4. Click cells in the Assigned Variables column to create or add variables as kernel arguments. You
can assign one-dimensional variables (such as integer, float, char, half, and so on) on-the-fly
by typing single values into the table. See section "Creating Variables" for details.
5. Set number of iterations, global size and local sizes per workload dimension in the Workgroup
size definitions group box.
6. Click Analyze to wrap a specific kernel and execute analyses.
You can use the local size(s) text boxes for several different test configurations:
•
•
•
•
Set single size value for a single test.
Add several comma-separated sizes for multiple tests.
Set 0 to utilize the default framework-assigned local size.
Click Auto to enable the Kernel Builder iterate on all sizes that are smaller than global size and
device maximum local size.
Also consider the following:
•
•
•
•
•
•
Using each option is available for each dimension.
To analyze the kernel in its designed conditions, set a single value.
To find the local size that provides higher performance results, click Auto or set a list of commaseparated values.
To improve the analysis accuracy, run each global and local work size combination several times
by increasing the Number of iterations value. Several iterations minimize the impact of other
system processes or tasks on the kernel execution time.
Use the Device Information
dialog to compare device properties and choose the
appropriate device for the kernel.
When running analysis on Experimental OpencL 2.0 Platform, you may use local WG size as
described in OpenCL 2.0 specification
o Local work-group size doesn’t have to be a divisor of the global WG size.
o When choosing “auto", all global work-group size devisors and all powers of 2 smaller than the
global work-group size ran in the analysis.
27
User Manual – Intel® SDK for OpenCL™ Applications
See Also
Creating Variables
Managing Variables
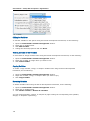
Creating Variables
Creating Buffers
To create buffers using Kernel Builder for OpenCL™ API, do the following:
•
•
•
Select Analyze > Variable management. Or click cells in the Assigned Variable column of the
Analyze Board.
In the Variable Management dialog click Add.
In the Select Variable Type dialog choose Buffer from the Type combo box.
Use CSV or binary files, random values, or zeroes to create buffers.
•
•
When using CSV files, each line represents one OpenCL data type (like int4, float16, and so on),
with a value in each column to satisfy the type size. For example, for a long8, at least eight
columns of long numbers should exist in each line. The size of the buffer is used as the number of
lines to read from CSV. The CSV file may hold more columns or lines than needed for a specific
buffer, but not fewer.
When using binary files, the content should be a concatenation of the OpenCL data type, and as
with using CSV files, the file may hold more data than indicated by the Size argument.
NOTE
Output buffers do not need a value assigned to them. If a value is assigned, it is ignored.
28
Building and Analyzing with Kernel Builder
See Also
Creating Images
Creating Samplers
Choosing Memory Options
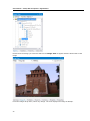
Creating Images
To create images using Kernel Builder for OpenCL™ API, do the following:
•
•
•
Select Analyze > Variable management. Or click cells in the Assigned Variable column of the
Analyze Board.
In the Variable Management dialog click Add.
In the Select Variable Type dialog choose Image from the Type combo box.
Use input bitmap files and the parameters to create images. Create output images with the correct
size, type, channel order, and so on.
29
User Manual – Intel® SDK for OpenCL™ Applications
The Get output image data checkbox disables reading back the output buffer or image. It means
that you can try more than one combination of global or local work sizes, where there is no need to
read the same output for all the combinations.
See Also
Creating Buffers
Creating Samplers
Choosing Memory Options
Creating Samplers
To create samplers using Kernel Builder for OpenCL™ API, do the following:
•
•
•
30
Select Analyze > Variable management. Or click cells in the Assigned Variable column of the
Analyze Board.
In the Variable Management dialog click Add.
In the Select Variable Type dialog choose Sampler from the Type combo box.
Building and Analyzing with Kernel Builder
See Also
Creating Images
Creating Buffers
Using Structs
Kernel Builder for OpenCL™ API supports user-defined structs. To use structs for kernel analysis, you
need to define them:
1.
2.
3.
4.
Go to Analyze > Struct Management.
Choose data type and enter fill name.
Click Add to add a new field.
Click OK to save the created field.
After defining the struct, you can select is as type when creating a buffer variable:
31
User Manual – Intel® SDK for OpenCL™ Applications
A CSV file for a struct buffer should have the following format:
•
•
Line numbers should be greated or equal to the buffer size.
Each line should contain all concatenated data fields.
For example:
typedef struct Point {
int x;
int y;
float value;
}
For a buffer of size 4, the CSV file contains:
0,1,3.56
1,1,33.7
1,0,12.58
0,0,4.85
.
Zero and random values are available as with regular-type buffers.
You can edit a struct. In such case any buffer using the struct reinitializes with the new data.
32
Building and Analyzing with Kernel Builder
You can delete a struct as long as other structures or buffer variables do not use it.
When working with uniform variables, fill the values in the pop-up dialog for every field to insert
values for the struct. For example:
NOTE
You must define structs with the same names as used in the code to enable the Kernel Builder to
assign a variable to the argument.
See Also
Creating Variables
Editing Variables
Choosing Memory Options
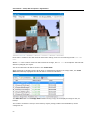
You can change memory options of buffers or images using Kernel Builder for OpenCL™ API. Refer to
the relevant sections of this guide for guidelines on creating or editing variables.
NOTE
You are not limited in selecting options. Avoid selecting the option combinations that are forbidden
by the OpenCL 1.2 specification, otherwise you may encounter errors upon analysis.
To choose buffers and images memory options, do the following:
1. Open the variable properties by right-clicking an image or buffer variable in the Variables
Management window.
2. Click the "..." button next to Memory flags to use.
3. Select options and click Done.
33
User Manual – Intel® SDK for OpenCL™ Applications
See Also
Creating Variables
Editing Variables
Editing Variables
To edit the variables in the system using the Kernel Builder for OpenCL™ API, do the following:
1. Select Analyze > Variable management. Or click cells in the Assigned Variable column of the
Analyze Board.
2. Right-click a variable name.
3. Click Edit variable properties.
4. Change the desired properties and click Done.
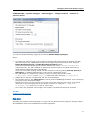
Viewing Variable Contents
To view buffer or image contents when using the Kernel Builder for OpenCL™ API, do the following:
1. Select Analyze > Variable management. Or click cells in the Assigned Variable column of the
Analyze Board.
2. Right-click a buffer or image name you want to view.
3. Click Show variable contents.
Deleting Variables
To delete variables when using the Kernel Builder for OpenCL™ API, do the following:
1. Select Analyze > Variable management. Or click cells in the Assigned Variable column of the
Analyze Board.
2. Right-click a variable name.
3. Click Delete variable or Delete all variables.
34
Building and Analyzing with Kernel Builder
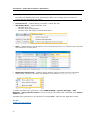
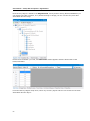
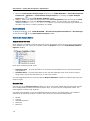
Viewing Analysis Results
Best and Worst Configurations
The Analysis Results tab of the Kernel Builder for OpenCL™ API enables you to see the tested global
and local size best and the worst configurations, based on median execution time. In case only one
configuration exists, the result appears in both result windows.
To export or view the analysis results, do the following:
1. Click the Analyze
button.
2. Switch to the Analysis Results tab.
3. Right-click the table and choose the action you need to perform.
Statistics for Each Configuration
The Execution Statistics table in the Analysis Results tab of the Kernel Builder for OpenCL™ API
enables you to see statistical analysis results for a selected configuration. The statistics consists of the
following iteration execution time values for the selected configuration:
•
•
•
•
•
Median
Average
Standard deviation
Maximum
Minimum
To open the Execution Statistics table, do the following:
1. Click the Analyze
button.
2. Switch to the Analysis Results tab.
3. Click Execution statistics.
Statistics per Iteration
The Execution Iteration Times (ms) table in the Analysis Results tab of the Kernel Builder for
OpenCL™ API enables you to see the total run time, the breakdown to queue, submit and execute
times per iteration for the given configuration.
To open the Execution Iteration Times (ms) table, do the following:
35
User Manual – Intel® SDK for OpenCL™ Applications
1. Click the Analyze
button.
2. Switch to the Analysis Results tab.
3. Click Execution Iteration Times (ms).
Variable Handling
The Variable Handling table in the Analysis Results tab of the Kernel Builder for OpenCL™ API
enables you to see read and read-back times for each variable, as well as the output file path for
output parameters. Clicking on this input/output path pops up its content (images and buffers).
To open the Variable Handling table, do the following:
1. Click the Analyze
button.
2. Switch to the Analysis Results tab.
3. Click Variable Handling.
NOTE
The analysis results restore each time you select the kernel from the kernel list.
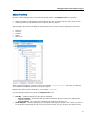
Deep Kernel Analysis in Kernel Builder
About the Deep Kernel Analysis
Deep Kernel Analysis feature of the Kernel Builder for OpenCL™ API enables getting profiling data for
OpenCL kernels running on Intel Graphics. The data includes:
•
•
•
Exact kernel runtime for each execution unit and hardware thread (in GPU cycles).
Exact execution time for selected OpenCL code lines (in GPU cycles).
Execution units occupancy and hardware thread utilization across the execution.
The new feature uses the Kernel Builder automatic host application feature, so you only need to write
an OpenCL kernel, assign variables to its arguments, and define the global and local group sizes. You
may also mark specific OpenCL code lines as IL profiling points, and then use the Deep Analysis
button to run the analysis.
NOTE
To work with the Deep Kernel Analysis feature, add the following key in the registry:
[HKEY_LOCAL_MACHINE\SOFTWARE\Intel\KMD] "DisableDOPClockGating"=dword:00000001
Profiling Kernels for Deep Kernel Analysis
To profile kernels using the Deep Kernel Analysis feature of the Kernel Builder for OpenCL™ API, do
the following:
1. Run the Kernel Builder.
2. Open an OpenCL code file, or type in your code in the editor.
36
Building and Analyzing with Kernel Builder
3. Click the Analyze
button, press the Refresh Kernel(s) button, and select a kernel for
analysis.
4. At the Assign Parameters tab assign parameters from previously defined variables or create
them on the fly from the popup dialog.
5. Define group sizes for the analysis, and press the Deep Analysis button to start profiling.
If desired, mark any of the possible OpenCL code lines for profiling by clicking the red circles on the
left of your code lines. The marking can be undone by clicking the filled circles (toggling on and off).
NOTE
Do not use the Auto feature for best local group size configuration with Deep Kernel Analysis.
Define a single group size for both global and local for each dimension used.
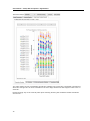
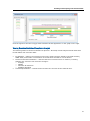
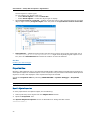
Viewing Deep Kernel Analysis Results
After the profiling is done, the data is collected and is shown in a graph and a few tables.
Execution Duration:
37
User Manual – Intel® SDK for OpenCL™ Applications
The chart shows 12 bars of utilization across the profiling time. Each color represents a specific EU,
while the average time of an EU utilization over time range determines the height of each color on
each bar.
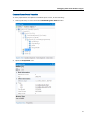
Double-clicking any of the colored parts opens a dialog showing the hardware thread activations
across time:
38
Building and Analyzing with Kernel Builder
Click the legend to the left to toggle each hardware thread appearance on the graph on the right.
Viewing Execution Statistics of Deep Kernel Analysis
The following tables of the Kernel Builder for OpenCL™ API Deep Kernel Analysis Results tabs show
textual tables with execution data:
•
•
•
EU Statistics – data on the execution units on the Intel Processor Graphics (physical location),
SIMD width, and number of activations of the hardware threads to run the kernel.
Full Kernel Execution Statistics – reflects total kernel execution time on each EU, including
statistics per execution unit and their averages:
o Average
o Median
o Minimum & maximum
o Standard deviation
Timestamps Statistics – reflects total execution time for each of the selected lines.
39
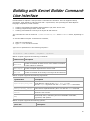
Building with Kernel Builder CommandLine Interface
Kernel Builder for OpenCL™ API provides a command-line interface. The tool supports Intel®
processors, Intel Graphics, and Intel Xeon Phi™ coprocessors, also providing full offline OpenCL
language compilation, which includes:
•
•
•
Creating executable Intermediate Representation (IR) from source code
Creating compiled object from source code
Creating executable IR or library from object IR and libraries
The command-line tool is located in $(INTELOCLSDKROOT)\bin\ under x86 or x64 folder, depending on
OS.
To use the Offline Compiler command-line interface,
1. Start the command-line.
2. Type ioc64 to run 64-bit version
Type the run parameters in the following sequence:
ioc<version> -cmd=<command> -<argument> -<options>
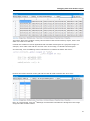
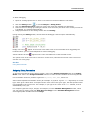
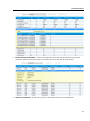
Offline Compiler supports the following commands:
Command Use Description
-cmd=build
Creates executable IR from source code. Default command
in case nothing is specified.
-cmd=compile
Creates compiled object IR from source code.
-cmd=link
Creates executable IR or library from object IR and libraries.
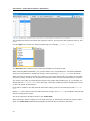
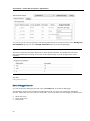
Offline Compiler supports the following arguments:
Argument Use
Description
-input=<input_file_path>
Builds OpenCL code from the input_file_path file.
Use the -input argument with the build and compile commands.
-binary=<"binary_files">
Links comma-separated binary files. Use with the link command.
-version
Shows the tool version.
-help
Shows help menu, containing the list of available commands,
arguments, and options.
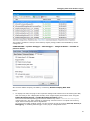
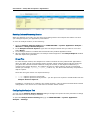
Offline Compiler supports the following options:
Option Use
Description
40
Building with Kernel Builder Command-Line Interface
Selects target device type:
-device=<device_type>
•
•
•
•
-targetos=<os>
Set target operating system if it is different from current:
'android' (use with 'cpu' device only).
The command is supported only in 32-bit version of the tool.
cpu - Intel CPU device, which is Default
gpu - Intel Graphics device
co - Intel Xeon Phi coprocessor device
cpu_2_0 - Intel CPU device on Experimental OpenCL 2.0
Platform
Selects target instruction set architecture. Available on CPU device
only.
The following instruction set architectures are available:
simd=<instruction_set_arch>
•
•
•
sse42 - Streaming SIMD Extensions 4.2
avx - Intel Advanced Vector Extensions (Intel AVX)
avx2 - Intel Advanced Vector Extensions 2 (Intel AVX2)
output[=<output_file_path>]
Writes build log into the output_file_path. When this option is
specified,
the build log does not appear in the command-line.
-asm=[<file_path>]
Generates assembly code.
-llvm[=<file_path>]
Generates LLVM code.
-llvm-spir32[=<file_path>]
Generates 32-bit LLVM SPIR code.
-llvm-spir64[=<file_path>]
Generates 64-bit LLVM SPIR code.
-ir[=<file_path>]
Generates intermediate representation binary.
-spir32[=<file_path>]
Generates 32-bit SPIR code.
-spir64[=<file_path>]
Generates 64-bit SPIR code.
-scholar
Enables performance hints.
-bo[="<build_options>"]
Adds comma-separated build options.
41
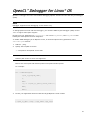
OpenCL™ Debugger for Linux* OS
OpenCL™ Debugger for Linux* OS enables debugging OpenCL kernels with the GNU Project Debugger
(GDB).
NOTE
Debugger supports kernel debugging on CPU device only.
To debug OpenCL kernels with the Debugger, you need the GNU Project Debugger (GDB) version
7.3.1 or higher with Python support.
Directly link your application to libpthread.so. Do not use LD_PRELOAD, since LD_PRELOAD fails
loading the Intel OpenCL devices altogether.
To enable GDB debugging of an OpenCL kernel, in the build options string parameter in the
clBuildProgram function:
1. Add the –g flag.
2. Specify the full path to the file.
-s <full path to the OpenCL source file>
NOTE
Relative path to the CL file is not supported.
Enclose the entire path with double quotes if the path includes spaces.
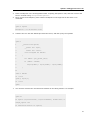
For example:
err = clBuildProgram(
<your_cl_program_name>,
0,
NULL,
“-g -s \“<path_to_opencl_source_file>\””,
NULL,
NULL);
3. Invoke your application that executes the target OpenCL kernel in GDB:
$ <path_to_gdb> --args ./<app_name> <app_args>
42
OpenCL™ Debugger for Linux* OS
4. Place a breakpoint in the host application after compiling the OpenCL code, and then execute the
kernel. Consider using clEnqueueNDRangeKernel.
5. Once you hit the breakpoint, place another breakpoint in the target kernel and issue a run
command:
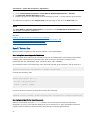
(gdb) b square
Breakpoint 3 at 0x700000ef: file…
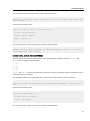
6. Continue the run until the GDB stops inside the kernel, and then query the symbols
(gdb) l
1
__kernel void square(
2
__global int* input,
3
__global int* output,
4
const unsigned int nElems)
5
{
6
int index = get_global_id(0);
7
if (index < nElems)
8
9
output[index] = input[index] * input[index];
}
10
(gdb) p nElems
$1 = 1024
(gbd) p input[0]
$2 = 1122
(gdb)
7. You can also examine the call stack and variables in the calling frames. For example:
(gdb) bt
#0 square (input=0x3f7e380, output=0x3eed900, nElems=1024) at
simple_square.cl:6
#2 0x000000007000021c in square()
43
User Manual – Intel® SDK for OpenCL™ Applications
#3 0x00007ffff64bdf23 in InvokeKernel (params_size=,
pParameters=, pEntryPont=) at…
[…]
(gbd)
When the kernel compilation completes and GDB receives a notification of the kernel code, the GDB
stops inside a kernel. After that, you can find the source files GDB recognizes, including the files that
contain the OpenCL kernels, by issuing the i sources command to GDB.
The path is the full route to the OpenCL source file provided with the -s flag while building the kernel.
During the debugging session, all work-items execute simultaneously, which means that different
work-items hit a breakpoint multiple times. To examine a specific segment of code for a single workitem, you should manually insert a condition on get_global_id().
44
Debugging with Visual Studio* Plug-in
OpenCL™ Debugger
OpenCL™ Debugger plug-in for Microsoft Visual Studio* IDE enables debugging OpenCL kernels using
the Microsoft Visual Studio software debugger GUI. The Debugger enables debugging host code and
OpenCL kernels in a single Microsoft Visual Studio debug session.
Debugger supports existing Microsoft Visual Studio debugging windows such as:
•
•
•
•
•
Breakpoints
Memory view
Watch variables – including OpenCL types like float4, int4, and so on
Call stack
Auto and local variables views
NOTE
Debugging is available only for CPU device. If the code should run on Intel Graphics, debug on CPU
device during development phase, then change the target device.
For debugger limitations and known issues refer to the Intel SDK for OpenCL Applications 2014 Release Notes.
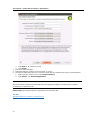
Enabling Debugging in OpenCL™ Runtime
To enable debugging mode in the Intel OpenCL runtime for compiling OpenCL code using OpenCL™
Debugger plug-in for Microsoft Visual Studio* IDE, do the following:
1. Add the –g flag to the build options string parameter in the clBuildProgram function.
2. Specify full path to the file in the build options string parameter to the clBuildProgram function
accordingly (including the CL file name):
-s <full path to the OpenCL source file>
If the path includes spaces, enclose the entire path with double quotes.
NOTE
Relative path to the CL file is not supported.
For example:
err = clBuildProgram(
45
User Manual – Intel® SDK for OpenCL™ Applications
g_program,
0,
NULL,
“-g -s \“<path_to_opencl_source_file>\””,
NULL,
NULL);
According to the OpenCL standard, work-items execute OpenCL kernels simultaneously. The Debugger
requires setting in advance the global ID of the work-item to debug, which is before debugging
session starts. The Debugger stops on breakpoints in OpenCL code only when the pre-set work-item
reaches them.
NOTE
To work with the OpenCL™ Debugger plug-in for Microsoft Visual Studio* IDE, the OpenCL kernel
code must exist in a text file, separate from the code of the host. Debugging OpenCL code that
appears only in a string embedded in the host application is not supported. Create your OpenCL
project with the OpenCL Offline Compiler plug-in for Microsoft Visual Studio* to get seamless
integration with the Debugger.
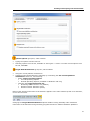
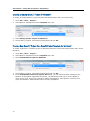
Configuring Debugger
To configure the OpenCL™ Debugger plug-in for Microsoft Visual Studio* IDE, do the following:
1.
2.
3.
4.
Run the Visual Studio IDE.
Select CODE-BUILDER > OpenCL Debugger > Options.
Check Enable OpenCL Kernel Debugging.
Set applicable values in the Select Work Items fields. The values specify its 3D coordinates. You
can select only one work-item.
NOTE
If NDRange is not 3D, leave unused dimension values at 0.
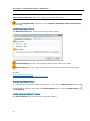
Changing Debugging Port
If you receive a “Protocol error" message, change your firewall settings or change debugging port in
the OpenCL™ Debugger plug-in for Microsoft Visual Studio* IDE.
NOTE
Default debugging port is 56203.
To change the debugging port number, do the following:
46
Debugging with Visual Studio* Plug-in
1.
2.
3.
4.
5.
Run the Visual Studio IDE.
Select CODE-BUILDER > OpenCL Debugger > Options.
Switch to the Advanced Settings tab.
Check the Use Custom Debugging Port check box.
In the Debugging Port Number field enter the port you need.
NOTE
If the Use Custom Debugging Port check box is unavailable, switch to the Basic Settings tab
and check the Enable OpenCL Kernel Debugging check box.
Troubleshooting the Debugger
In case of issues with kernel debugging,
1. Set the following environment variables:
INTEL_OCL_DBG_LOG=1 INTEL_OCL_DBG_LOG_FILE=c:\temp\debugger.txt
2. Restart the Microsoft Visual Studio* IDE.
3. Continue debugging.
Using these environment variables, you generate a log file. Use it to determine the root cause of the
issue. You can submit the generated log at http://software.intel.com/en-us/forums/intel-opencl-sdk.
API Debugging in Visual Studio*
OpenCL™ API Debugger
The interface of the Microsoft Visual Studio* IDE provides standard debugging capabilities for the host
side of OpenCL™ applications, while the OpenCL Debugger plug-in of the Code Builder enables
debugging OpenCL kernels. The stitch between simultaneous debugging of OpenCL kernel and host
application might be complicated in different stages. API Debugging feature of the Code Builder Debugger plug-in for Microsoft Visual Studio covers the stitch.
The API Debugging feature enables monitoring and understanding OpenCL environment of applications
throughout execution.
The feature supports the following:
•
•
•
•
•
API Tracing - lists a trace of all OpenCL API calls that occurred during the execution, list of trace
arguments, return values, and execution time.
OpenCL Objects View - shows all OpenCL objects that exist in memory during the execution.
Properties View - retrieves common information per each OpenCL object.
Command-Queue View - tracks the execution status of the enqueued commands.
Problems View - summarizing all error and warning messages.
47
User Manual – Intel® SDK for OpenCL™ Applications
•
•
•
•
Image View - visually displays all 2D image objects as bitmaps.
Data View - visually displays buffer data and 2D image pixel arrays on a grid.
Save/Load session - enables capturing a state/snapshot of all views of the plug-in, saving it on
disk, and also loading the stored sessions.
Memory Tracing - enables storing OpenCL Images and Buffers content, and visually examining
either by Bitmap or Grid view the contents of the underlying data associated with the memory
object throughout the various API calls that affected it.
NOTE
Concurrent debugging sessions are not supported with the OpenCL API Debugger. This includes
attaching the debugger to more than one process, or opening multiple instances of the Visual
Studio and debugging processes concurrently.
See Also
Trace View
Objects Tree View
Properties View
Command Queue View
Problems View
Image View
Data View
Memory Tracing
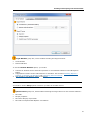
Enabling the API Debugger
To use the API Debugger, do the following:
1.
2.
3.
4.
Start the Microsoft Visual Studio* IDE.
Go to CODE BUILDER > OpenCL Debugger > Options > API Debugger.
Check Enable OpenCL API Debugger.
Insert breakpoints in the application in different OpenCL API calls, and then start debugging with
F5.
5. Open the needed API Debugger views by selecting CODE BUILDER > OpenCL Debugger and
select the view you need.
The API Debugger updates the view panes when:
•
•
•
The Debugger hits a breakpoint in Microsoft Visual Studio* IDE.
One of the views behavior changes, which means you click a buttons.
The host application execution ends.
So, to see data in the views,
1. Insert some breakpoints in your application (in different API calls), or run the application with
Start Debugging (F5).
2. Then open the needed views via CODE BUILDER > OpenCL Debugger.
48
Debugging with Visual Studio* Plug-in
See Also
Trace View
Objects Tree View
Properties View
Command Queue View
Problems View
Image View
Data View
Memory Tracing
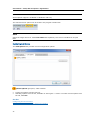
Trace View
The trace view contains trace of all OpenCL™ API Calls during the execution, API call arguments,
returned values and time of execution.
To access the trace view, select CODE BUILDER > OpenCL Debugger > Trace View.
Use the following buttons to control the view:
•
•
Save – enables saving the current state of all views with live OpenCL objects, API trace, command
queue, and so on,
o to either a binary file (.trace) that can be later loaded with the Load Session button.
o or, you can export a list (trace) of all API calls into a CSV file
Load Session... – enables restoring the state of the views from a previously saved .trace file
either using Save As... or Generate trace file option in the API Debugger settings.
49
User Manual – Intel® SDK for OpenCL™ Applications
NOTE
This feature is available only when Visual Studio* IDE is not in debug mode, as views are
synced with the application you debug.
•
•
Success/Errors - enables filtering successful or failed API calls.
API Display Mode – toggles between views:
o Function name only
o Function name and arguments
o Function name with argument names and values
•
Filter – enables filtering out API calls by name. Start typing “device” for example, to get only API
calls with device in their name:
•
Right-click context menu - enables toggling between various display modes of arguments
Hex\Decimal, and show raw values (for example, 0x2 instead of CL_DEVICE_TYPE_CPU).
To enable automatic trace generation, select CODE BUILDER > OpenCL Debugger > API
Debugger > Auto-generate session. Traces are saved in the folder that is specified in the Output
Folder text box.
Automatic trace generation is an equivalent to clicking Save… after the host application ended.
See Also
Enabling the API Debugger
50
Debugging with Visual Studio* Plug-in
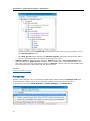
Objects Tree View
OpenCL™ API Debugger plug-in for Microsoft Visual Studio* IDE Objects Tree view enables:
•
•
Getting a better understanding of which objects are “alive”/released at any given point of time.
Showing hierarchy and dependencies of various OpenCL objects.
API Debugger also reflects the OpenCL objects that exist in memory during application execution:
•
•
•
•
•
Platform
Devices
Context
Buffer
and so on
When creating an OpenCL context for with (for example, clCreateContext() API call), the Objects
Tree updates immediately with the new context object.
Objects dim when become released by, for example, clRelease.
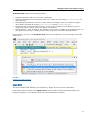
Use the following buttons to control the Objects Tree view:
•
•
Sort By – enables toggling the way data is displayed:
o Sort by Context – all entities that are associated with a specific context are displayed as
context successors.
o Sort by Device – all contexts are displayed as children of the devices.
Show Objects – enables displaying only a subset of the OpenCL objects. Use it when you have a
lot of OpenCL objects that are alive at some given moment, and you need to see status of only
51
User Manual – Intel® SDK for OpenCL™ Applications
•
•
several objects or object types.
To view objects of a specific type only,
o Select Show Objects > uncheck Show All.
o Select Show Objects > select the object type to display.
Open Source Code in a new tab – enables viewing the source code associated with the program
object. Right-click any Program object in the tree, then click Open Source Code in a new tab.
Save Binaries – enables dumping binary files that were built for the program object with use of
clBuildProgram, or clCreateProgramWithBinaries. Right-click any built program object in the
tree, then click Save Binaries and select the location to save the binaries.
See Also
Enabling the API Debugger
Properties View
OpenCL™ API Debugger plug-in for Microsoft Visual Studio* IDE exposes miscellaneous properties for
each OpenCL object or Command Queue event. Properties view pre-fetches information about OpenCL
objects or events, and displays it when a particular object is selected.
Access the Properties View by selecting CODE BUILDER > OpenCL Debugger > Properties
View.
All properties in the Properties View are read-only.
OpenCL Objects Properties
To view properties for an OpenCL object, do the following:
1. Select (left-click) some object from the Objects View window.
2. Open the Properties view.
The OpenCL Objects Properties view is an alternative to calling API calls such as
clGetDeviceInfo().
52
Debugging with Visual Studio* Plug-in
Command Queue Events Properties
To view properties for an OpenCL command-queue event, do the following:
1. Select (left-click) an event from the Command Queue View window.
2. Open the Properties view.
53
User Manual – Intel® SDK for OpenCL™ Applications
The Command Queue Events Properties view is an alternative to retrieving execution time by
adding the CL_QUEUE_PROFILING_ENABLE parameter to clCreateCommandQueue() when creating the
command queue to which the commands are enqueued, and then querying the enqueued events
execution times using clGetEventProfilingInfo().
To view properties for an OpenCL command-queue event:
1. Select (left-click) some event from the Command Queue View window.
2. Open the Properties view.
See Also
Enabling the API Debugger
54
Debugging with Visual Studio* Plug-in
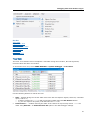
Command Queue View
OpenCL™ API Debugger plug-in for Microsoft Visual Studio* IDE provides Command Queue View,
which enables tracking the execution status of enqueued commands (issued by clEnqueue API call).
The status for a command can be either of the following options:
•
•
•
Submitted
Running
Completed
The Command Queue View also displays events for a particular command-queue (Separate Queues)
or for all events from all queues (Unify Queues).
Access the Command Queue View by selecting CODE BUILDER > OpenCL Debugger >
Command Queue View.
Use the following buttons to control the Command Queue View:
•
•
Save As… – enables dumping the current status of commands to a text file for a later
investigation.
Unify Queues – enables to view all commands across all queues.
Also note the following:
o When working in the Unified queues mode, each entry is added a suffix of the form: CQ
[NUMBER], which indicates the command-queue number, with which the command is
associated.
o For example: TASK(3) CQ[1], indicates that the 3rd command enqueued to some queue is a
clEnqueueTask command, and is associated with Command-Queue [1].
o Each queue has a color and all its corresponding commands have the color of the queue. Such
differentiation makes it easy to spot in the eye the corresponding queues of the commands in
question:
55
User Manual – Intel® SDK for OpenCL™ Applications
Command-queues in the Objects Tree view share the same color in the view as their color in
the Command Queue view.
The Unify Queues button changes into Separate Queues button after being clicked, which
does the opposite operation and shows events status per queue.
Separate Queues – appears when working in Unified mode after clicking Unify Queues, and
does the opposite to Unify Queues operation, which is showing the commands per-queue. First
select the queue from the drop-down list under the Save As… button, then the view updates with
the commands that are associated with the selected queue.
o
•
See Also
Enabling the API Debugger
Problems View
OpenCL™ API Debugger plug-in for Microsoft Visual Studio* IDE provides the Problems View that
summarizes into a single view all errors and warnings that occurred during the execution.
To access the view, select CODE BUILDER > OpenCL Debugger > Problems View.
56
Debugging with Visual Studio* Plug-in
Problems View supports the following features:
•
•
•
•
•
Displaying warnings and errors of kernel compilation.
Showing uninitialized kernel arguments, each one of them is set by calling clSetKernelArg() for
each argument.
Releasing OpenCL objects in the out-of-order mode, for example, when you release a program
object before releasing its kernels (clReleaseProgram before clReleaseKernel).
Resource leaks: at the end of the program, an error entry is added for each OpenCL resource
(programs, buffers, images, and so on) that is not released
API call failures – when an OpenCL API call fails, an error entry is added to the problems view. You
can right-click the entry, to jump to the line item in the trace view that caused the failure.
Double-clicking an error in the Problems View opens the compilation error log message in the code
editing area.
See Also
Enabling the API Debugger
Image View
This view enables visual displaying of the OpenCL™ Image objects in the host application.
Each Image object is added to the Objects View, and by double-clicking each Image object, the
bitmap is displayed - the underlying pixel array gets translated into bitmap.
57
User Manual – Intel® SDK for OpenCL™ Applications
Double-click the Image you need and wait for the Image View to appear with the latest state of the
image
From the Images drop-down, select any Image. The view displays the image as bitmap.
58
Debugging with Visual Studio* Plug-in
The history drop-down enables viewing various states of the selected image, where each state is a
result of an API call.
If, for instance, you create an image with all pixels set to 0, you see on Image creation the following
view:
Now, after running the kernel on the selected Image, you can observe that it was updated indirectly
by clEnqueueNDRange API call (therefore causing the kernel to run).
59
User Manual – Intel® SDK for OpenCL™ Applications
Each state is related to the API call that caused the change, and is in the following format: #ID: API
Call.
Where #ID is the number of API call that caused the change, and API Call is the OpenCL API call that
affected (changed) the object.
This is the same API call that it shown in the Trace View.
When selecting an Image from the drop-down, or alternatively selecting an Image state, the Trace
View automatically highlights the API call that is related to that state:
The Save As button in the Image View enables saving a copy of the displayed image to disk, as
bitmap.
The number of states to save per each memory object (Image, Buffers and SubBuffers) can be
configured via:
60
Debugging with Visual Studio* Plug-in
CODE BUILDER > OpenCL Debugger > API Debugger > Images & Buffers > Number of
previous states
You can also disable dumping images by unchecking Enable Dumping Images.
Notes:
•
•
•
•
To display the data, the plug-in has to perform background activities such as fetching the data,
and converting it into a displayable format, which might impact performance when using the
Enable Dumping Images or Enable Dumping Raw Data options.
Take into account that profiling performance measured by either clGetEventProfilingInfo
runtime API call / any other method for measuring execution time or occupied host memory,
might entail certain performance degradation.
To get more accurate profiling results, use the runtime directly by pushing Ctrl+F5, Start w/o
Debugging, or disabling API Debugger in the plug-in configuration menu.
Only 2D images are supported for viewing, which is memory objects that contain
CL_MEM_OBJECT_IMAGE2D in their image_type field inside their descriptor (cl_image_desc).
Images above 2GB are not supported and will not be displayed
The bitmaps shown in the Image View are merely an 8-bit RGBA approximation of the underlying
pixel array of the associated images.
Behind the scenes, the plug-in does a liner color conversion from the input range of the pixels,
which can be any type supported by the OpenCL runtime, for example, CL_SNORM_INT8,
CL_UNSIGNED_INT16, and so on) to the [0..255] range.
As a result, the presented colors might not accurately represent the bitmap as expected.
See Also
Enabling the API Debugger
Data View
The Data View enables visual displaying on a grid of all the OpenCL Memory Objects: Images, Buffers
and SubBuffers, that were instantiated in the host application.
61
User Manual – Intel® SDK for OpenCL™ Applications
Each Memory Object is added to the Objects View, and by double-clicking Buffers/SubBuffers you
can display the buffer contents, or by double-clicking an Image you can view the raw pixel data
associated with the image.
Double-click the Buffer you need, and Data View window appears with the latest state of the
buffer/sub-buffer.
From the Memory Objects drop-down, select any memory object and the view shows the raw data
associated with the object:
62
Debugging with Visual Studio* Plug-in
The history drop-down enables viewing various states of the selected memory object, where each
state is a result of an API call.
Consider the situation of a host application that calculates a histogram of a grayscale image. For
example, use a buffer with 256 bins for each color of the image, to calculate the histogram.
As a first step, issue an NDRange kernel called bzero to initialize the buffer with zeros:
Examine the buffer contents on the grid and see that all buffer elements are set to zero:
Now, as a second step, issue a 2nd NDRange command that calculates the histogram of the image
using the buffer as bins counter:
63
User Manual – Intel® SDK for OpenCL™ Applications
This example has 22 pixel elements with grayscale value 5, and 27 pixels with grayscale value 9, and
so on.
Use the Type box to select the underlying data type (for example, cl_uint, cl_double).
The Save As button enables saving a CSV representation of the data to disk.
When exporting Buffer/SubBuffer, you get each buffer cell in a separated line. The Buffer/SubBuffer
values are interpreted as a contiguous memory chunk containing unsigned, chars as its elements.
When exporting an Image as a CSV, the number of rows in the output CSV is the height of the image
(number of rows), and each row represents all columns of that row joined and delimited by commas.
The values in the cells are interpreted according to the image channel data type, so, for example, an
Image that has CL_SIGNED_INT32 as its data-type, causes the resulting output to display each row as
an array of signed 32-bit integers.
Each state is related to the API call that caused the change, and is in the following format: #ID: API
Call.
Where #ID is the number of API call that caused the change, and API Call is the OpenCL API call that
affected (changed) the object.
This is the same API call that it shown in the Trace View.
When selecting a memory object from the drop-down list, or alternatively selecting a memory object
state, the Trace View automatically highlights the API call that is related to that state:
64
Debugging with Visual Studio* Plug-in
The number of states to save per each memory object (Image, Buffers and SubBuffers) can be
configured via:
CODE BUILDER > OpenCL Debugger > API Debugger > Images & Buffers > Number of
previous states
We can also disable dumping raw data by unchecking Enable Dumping Raw Data.
Notes:
•
To display the data, the plug-in has to perform background activities such as fetching the data,
and converting it into a displayable format, which might impact performance when using the
Enable Dumping Images or Enable Dumping Raw Data options.
Take into account that profiling performance measured by either clGetEventProfilingInfo
runtime API call / any other method for measuring execution time or occupied host memory,
might entail certain performance degradation.
To get more accurate profiling results, use the runtime directly by pushing Ctrl+F5, Start w/o
Debugging, or disabling API Debugger in the plug-in configuration menu.
65
User Manual – Intel® SDK for OpenCL™ Applications
•
•
Memory objects above 2GB are not supported and are not displayed.
Buffers/Sub-Buffers that are set as parameters to kernels via clSetKernelArg are fetched into
API Debugger after each kernel enqueue operation, regardless of the memory flags they were
created with.
This means that even buffers created with CL_MEM_READ_ONLY are fetched behind the scenes.
See Also
Enabling the API Debugger
Memory Tracing
Memory tracing enables the user to capture the session of the debugging into a file, and also to load a
previously stored state into the views.
The stored state contains:
•
•
•
State of all the views – this includes all the data that is filled in the various views of the plug-in
Images bitmaps (if Enable Dumping Images is on)
Memory objects raw data (if Enable Raw Data is on)
The state can be stored by either of the following ways:
•
•
Automatically when host application ends
Manually, by going to: Trace View > Save > Save Session (.trace)
The automatic memory tracing contains:
•
•
State of all the views
CSV of all API calls that occurred during the execution
And can be enabled via:
CODE BUILDER > OpenCL Debugger > API Debugger > Other settings > Auto-generate
session
This option creates a separate directory for each captured session of the plug-in.
The directory is stored under the Output Folder specified in the same window.
See Also
Enabling the API Debugger
66
OpenCL™ Development for Android* OS
Configuring the Environment
To develop OpenCL™ applications for Android* OS, you need to configure your system the following
way:
1.
2.
3.
4.
5.
Download Android* SDK.
Put <Android_SDK_Install>\sdk\platform-tools in PATH environment variable.
Enable Intel Virtualization Technology (vt-x) in BIOS (Windows* OS only).
Run Android SDK Manager from <Android_SDK_Install>\sdk\tools\android.bat
Mark and install:
o Android 4.2.2 (API 17) > Intel x86 Atom System Image
o Extras > Google USB Driver
o Extras > Intel x86 Emulator Accelerator (HAXM) (Windows only)
6. Install the OpenCL runtime on an Android* device or emulator.
NOTE
Root permissions are required on Android* devices and emulator.
To make the Android device be accessible without root permissions,
1. Identify the Intel devices by running lsusb command, for example:
[user@Ubuntu ~]>lsusb
### Output reduced ###
Bus 003 Device 008: ID 8087:0a21 Intel Corp.
2. Following the example above, you can either change the ownership of the device file, and/or give
permissions to the file:
o Change ownership of the device file to the desired user and group via the following command:
sudo chown USER:GROUP /dev/bus/usb/003/008
where USER and GROUP are the target user and group to have permissions to the device.
o
Give permissions to everyone:
Sudo chmod 666 /dev/bus/usb/003/008
Udev configuration files should be edited to enable full permissions without sudo.
67
User Manual – Intel® SDK for OpenCL™ Applications
3. Edit any file(s) that conform to the following convention:
/etc/udev/rules.d/N-android.rules,
and append the following line:
SUBSYSTEM=="usb", ATTRS{idVendor}=="8087", ATTRS{idProduct}=="0a21", MODE="0666"
If no android.rules file are present in /etc/udev/rules.d/, create the following file:
/etc/udev/rules.d/51-android.rules.
4. Next step enables read and write opetations on an Android device:
Call adb root and then call adb remount.
See Also
Installing OpenCL™ Runtime on Android* OS
Creating an Android* Emulator
To create a new Android* emulator,
1. Run Android SDK Manager from <Android_SDK_Install>\sdk\tools\android.bat
2. In Android SDK Manager select Tools > Manage AVDs.., and define new emulator:
68
OpenCL™ Development for Android* OS
To run the created emulator, use the following command:
<Android_SDK_Install>\sdk\tools\emulator.exe -avd test_emulator -partition-size 1024
Parent topic: Developing OpenCL™ Applications for Android* OS
Installing OpenCL™ Runtime on Android* Emulator
To install the Intel OpenCL™ runtime on Android* Emulator using script, do the following:
1. Go to the android-preinstall subfolder of the Intel® SDK for OpenCL™ Applications 2014
installation folder.
2. Use the OpenCL_Android_Install script to configure the emulator or Android* device or use the
following options to start the emulator manually:
69
User Manual – Intel® SDK for OpenCL™ Applications
o
o
On Ubuntu* OS ./OpenCL_Android_Install –h
The script requests root password.
On Windows* OS OpenCL_Android_Install –d <your device/emulator>
NOTE
On Windows only one device can be running at installation time.
NOTE
Installation of the OpenCL runtime for Android via scripts is supported only on emulator.
NOTE
Root permissions are required on Android emulator.
To configure the emulator manually,
1. Copy the following files from the SDK installation folder to /system/vendor/lib using the
Android* Debug Bridge:
o __ocl_svml_g9.so
o __ocl_svml_n8.so
o __ocl_svml_s9.so
o __ocl_svml_v8.so
o clbltfng9.rtl
o clbltfng9_img_cbk.o
o clbltfng9_img_cbk.rtl
o clbltfnn8.rtl
o clbltfnn8_img_cbk.o
o clbltfnn8_img_cbk.rtl
o clbltfns9.rtl
o clbltfns9_img_cbk.o
o clbltfns9_img_cbk.rtl
o clbltfnv8.rtl
o clbltfnv8_img_cbk.o
o clbltfnv8_img_cbk.rtl
o libcl_logger.so
o libclang_compiler.so
o libcpu_device.so
o libgnustl_shared.so
o libintelocl.so
o libOclCpuBackEnd.so
o libOclCpuDebugging.so
o libOpenCL.so.1.2
o libtask_executor.so
o libtbb_preview.so
o libtbbmalloc.so
o opencl_.pch
Use the following command to copy the files:
70
OpenCL™ Development for Android* OS
adb -s <Emulator-Name> push <file1> /system/lib
2. In the /system/lib folder on the Android* device create two links:
adb -s <Emulator-Name> shell ‘cd /system/vendor/lib; ln –s libOpenCL.so.1
libOpenCL.so; ln –s libOpenCL.so.1.2 libOpenCL.so.1’
3. Copy the intel.icd file to /system/vendor/Khronos/OpenCL/vendors folder. Use the following
command:
adb -s <emulator-name> push intel.icd /system/vendor/Khronos/OpenCL/vendors
NOTE
If you close the emulator you must reinstall the OpenCL runtime after you run it again.
See Also
Configuring the Environment
Creating an Android* Application
To create a new application, do the following:
1. Run the Eclipse* IDE from the SDK installation folder:
o On Windows* OS run C:\sdk\adt-bundle-windows-x86_64-20130219\eclipse\eclipse
o On Ubuntu* OS run /sdk/adt-bundle-linux-x86_64/eclipse/eclipse
2. Specify the Android NDK location in Eclipse:
1. Go to Window > Preferences > Android > NDK.
2. Enter the Android NDK path
3. Create a new Android project:
1. Go to File > New > Project… > Android > Android Application Project.
2. Add the appropriate information. For example:
71
User Manual – Intel® SDK for OpenCL™ Applications
3. Click Next in all remaining forms.
4. Click Finish.
4. Run the created emulator.
5. Install the OpenCL runtime on the emulator or device.
6. Develop the application and run it using the Intel OpenCL software technology implementation:
1. Right-click the project name in the Project Explorer.
2. Click Run As > 1 Android Application.
NOTE
Install the Intel® Hardware Accelerated Execution Manager (HAXM) to accelerate the emulator
performance on Windows* OS.
Parent topic: Developing OpenCL™ Applications for Android* OS
See Also
Installing OpenCL™ Runtime on Android* OS
72
Preview Features
OpenCL™ 2.0 Experimental Development Environment
OpenCL™ 2.0 Experimental Development Environment enables you to test OpenCL 2.0 features with
the Intel CPU on Windows* OS. When developing applications for the OpenCL 2.0 runtime Emulator,
use the header files located in <sdkdir>\include\2.0\CL.
NOTE
Only the CPU OpenCL 2.0 device is supported on the 4th generation Intel® Core™ processors and
lower.
The experimental development environment is part of the SDK package and does not require
installation of any other OpenCL platforms like Intel's implementation of the OpenCL 1.2 standard.
Also the OpenCL 2.0 experimental platform may coexist with other OpenCL platforms (if installed)
under the same system.
The OpenCL 2.0 Experimental Development Environment is an OpenCL 2.0 platform that you can
select when developing your application for testing OpenCL 2.0 features. The platform name is:
Intel CPU on Experimental OpenCL 2.0 Platform
NOTE
Make sure OpenCL.dll, Intelopencl32.dll, and IntelOpenCL64.dll in the system directories
were not changed or updated. If these files are changed, replace them with the ones from
<programfilesdir>\Common Files\Intel\OpenCL2.0\sys to the respective system directories.
OpenCL™ New Project Wizard
About the OpenCL™ New Project Wizard
OpenCL™ New Project wizard is a plug-in for Microsoft Visual Studio* software enables developing
Windows* and Android* OpenCL applications with Visual Studio IDE either from scratch (empty
project) or based on template projects.
The wizard kit supports the following features:
•
•
•
Create a new empty OpenCL project for Windows* platforms
Create a new OpenCL project from OpenCL project template for Windows* platforms
Create a new OpenCL project from OpenCL project template for Android* devices
See Also
Creating an empty OpenCL™ Project
Create a new OpenCL project from OpenCL project template
73
User Manual – Intel® SDK for OpenCL™ Applications
Creating an Empty OpenCL™ Project for Windows*
To create an empty OpenCL™ project for Microsoft Visual Studio* IDE, do the following:
1. Go to File > New > Project…
2. Select OpenCL templates from the Templates tree view.
3. Select Empty OpenCL Project for Windows.
4. Fill the Name, Location, and Solution name fields and click OK
Create a New OpenCL™ Project from OpenCL Project Template for Windows*
To create an OpenCL™ template project for Windows platforms in Microsoft Visual Studio* IDE, do the
following:
1. Go to File > New > Project…
2. Select OpenCL templates from the Templates tree view.
3. Select Code Builder Project for Windows.
4. Fill the Name, Location, and Solution name fields and click OK.
5. In the Code Builder wizard for OpenCL API dialog, you can select the basic settings for the
behavior of the OpenCL application and kernel. The parameters that can be set are platform
name, device type, kernel type (images or buffer manipulation), build options, and local work
group size behavior. Each field has a short tool-tip explanation.
74
Preview Features
6. Click Finish to create the default template project or click Next to open the Advanced Settings
screen enabling you to set some advanced options like whether to enable profiling queue and the
kernel’s arguments memory source type. For CPU device type, you can also set the out-of-order
execution mode and debug mode for the kernel.
75
User Manual – Intel® SDK for OpenCL™ Applications
7. Click Finish to create the default template project or click Previous to return the Basic Settings
screen.
Create a New OpenCL™ Project from OpenCL Project Template for Android*
To create an OpenCL™ template project for Android devices in Microsoft Visual Studio* 2012 (only!),
do the following:
1. Go to File > New > Project…
2. Select OpenCL templates from the Templates tree view.
3. Select CodeBuilder Project for Android.
4. Fill the Name, Location, and Solution name fields and click OK.
5. In the Code Builder wizard for OpenCL API dialog, you can select the basic settings for the
behavior of the OpenCL application and kernel. The parameters that can be set are platform
name, device type, kernel type (images or buffer manipulation), build options, and local work
group size behavior. Each field has a short tool-tip explanation.
76
Preview Features
6. Click Finish to create the default template project or click Next to open the Advanced Settings
screen enabling you to set some advanced options like whether to enable profiling queue and the
kernel’s arguments memory source type. For CPU device type, you can also set the out-of-order
execution mode.
77
User Manual – Intel® SDK for OpenCL™ Applications
7. Click Finish to create the default template project or click Previous to return the Basic Settings
screen.
NOTE
You need the Android* NDK installed on your system to use the Create a New OpenCL Project
feature for Android*.
OpenCL™ Scholar
About OpenCL™ Scholar
OpenCL™ Scholar is a preview feature that reports potential problems and optimization opportunities
in OpenCL kernels. Upon enabling the scholar mode, compiling the kernel provides hints on improving
the kernel performance. Use Scholar prior to applying any other performance-tuning actions such as
profiling, and right after making sure the kernel works as expected.
78
Preview Features
See Also
Enabling OpenCL™ Scholar
OpenCL™ Scholar Hints
Enabling OpenCL™ Scholar
You can enable the OpenCL Scholar feature in Intel tools for OpenCL code development.
NOTE
Generating Assembly, IR, LLVM, and SPIR output is not supported in the Scholar mode.
Scholar in Kernel Builder Command-Line Interface
In the Kernel Builder for OpenCL API command-line interface, add the -scholar command-line option.
For example:
ioc64 -input=mykernel.cl –device=gpu -scholar
The tool prints optimization hints in the following format
<filename>:<line>:<column>: Scholar: <message>
Scholar in Offline Compiler for Eclipse*
To use Scholar in Eclipse*,
1. Go to Intel OpenCL > Options.
2. Check the Enable Scholar Support check box under the Scholar Configuration group box.
3. Build an OpenCL kernel file, to see Scholar hints highlighted light-blue in the Console View. The
hints also appear with an info marker in the Problems View.
An info marker appears in the editor for each Scholar hint.
Scholar in Offline Compiler for Visual Studio*
To use Scholar in the Miscrosoft Visual Studio*,
1. Right-click your project and open the project properties.
79
User Manual – Intel® SDK for OpenCL™ Applications
2. Go to Configuration Properties > Intel SDK for OpenCL Applications > General.
3. Set Generate Scholar Messages to Yes.
4. Build the project to see the Scholar hints as warnings for each CL kernel code file of the project.
The Scholar hints appear in the Output View of the build log as well as in the Error List view.
NOTE
The Intel SDK for OpenCL Applications group appears in the Configuration Properties only if
your project is an OpenCL API project.
See Also
Building with Kernel Builder Command-Line Interface
OpenCL™ API Offline Compiler plug-in for Microsoft Visual Studio* IDE
OpenCL™ API Offline Compiler for Eclipse* IDE
Converting Existing Project into OpenCL™ Project
OpenCL™ Scholar Hints
OpenCL Scholar suggests several hints for OpenCL™ code optimization.
Use Floating-Point over Integers for Calculations
Scholar notifies about each integer calculation that can be implemented with floating-point instead.
Floating-point calculations are generally faster than the integer equivalents, and have more
bandwidth. Still the optimization might negatively affect code readability.
The message location is the beginning of the left-hand operand of the operation, and its content is:
prefer floating-point calculations to integer calculations
Consider the following code:
kernel void f(global int* a) {
int gid = get_global_id(0);
a[gid] = a[gid] * a[gid];
}
For the code above, Scholar provides the following hint message:
mykernel.cl:3:12: Scholar: prefer floating-point calculations to integer calculations
Use the Restrict Qualifier for Kernel Arguments
Scholar recommends using the restrict qualifier on kernel arguments that may alias other
arguments, if you are sure that this aliasing can never actually occur. Such optimization helps the
compiler limit the effects of pointer aliasing while aiding the caching optimizations.
80
Preview Features
The message location is the parameter name, and its content is:
parameter '<param name>' should be marked as 'restrict' if it never shares memory with
other arguments
Consider the following code:
kernel void f(global float* a, global float* b) {
int gid = get_global_id(0);
a[gid] = a[gid] + b[gid];
b[gid] = b[gid] + 1;
}
For the code above, Scholar provides the following hint message:
mykernel.cl:1:46: Scholar: parameter 'b' should be marked as 'restrict' if it never
shares memory with other arguments
Consider native_ and half_ Versions of Builtins
Scholar reports the following math builtins usage as potentially inefficient when the native_ and
half_ versions might be used instead:
•
•
•
•
sin
cos
exp
log
native_ and half_ versions use hardware instructions directly, potentially greatly decreasing the time
needed for these calculations.
The message location is the beginning of the name of the called function, and its content is:
using native_<name> or half_<name> can provide greater performance at some accuracy
cost
Consider the following code:
kernel void f(global int* a) {
int gid = get_global_id(0);
a[gid] = sin(a[gid]);
}
For the code above, Scholar provides the following hint message:
81
User Manual – Intel® SDK for OpenCL™ Applications
mykernel.cl:3:12: Scholar: using native_sin or half_sin can provide greater
performance at some accuracy cost
Avoid Non-Coalesced Memory Access
Scholar suggests avoiding non-coalesced memory accesses. Such memory accesses occur when
adjacent work-items access non-adjacent buffer elements. Coalesced memory accesses are translated
to wide loads and stores, while non-coalesced accesses translate to gathers and scatters. Wide loads
and stores outperform gathers and scatters.
The message location is the beginning of the statement, in which the memory access occurs, and its
content is:
non-coalesced memory access
Consider the following code:
kernel void f(global int* a, constant int* b) {
int gid = get_global_id(0);
float x = b[gid*2];
a[gid] = x;
}
For the code above, Scholar provides the following hint message:
mykernel.cl:3:3: Scholar: non-coalesced memory access
Refer to the product Optimization Guide for more optimization hints and explanations.
See Also
Intel® SDK for OpenCL™ Applications - Optimization Guide
Debugging Kernels on Intel® Graphics
About Kernel Debugger
Kernel Debugger - is a preview feature that enables OpenCL™ kernel debugging on Intel® Graphics
device through the interface of the Kernel Builder for OpenCL API. The Debugger supports
•
•
•
Running OpenCL kernels on the Intel® Graphics device step-by-step
Setting breakpoints
Viewing variable values
To enable the Kernel Debugger, set the CL_GPU_KERNEL_DEBUGGER_ENABLED environment to True.
82
Preview Features
To start debugging,
1. Open an existing OpenCL file or write a new kernel in the Kernel Builder code editor.
2. Click the Debug button
or select Analyze > Debug board.
3. Click the Refresh kernel(s) button to get the list of kernels available for debugging.
4. Select a kernel to debug by clicking the kernel name from the pull-down menu. If only one kernel
is available, it is selected automatically.
5. Assign parameters for the debug session and click Debug.
Upong clicking the Debug button, the tab with the Debugger controls opens automatically.
Empty red circles
appear in the kernel code editor next to the executable lines suggesting the
locations where you can set breakpoints for kernel debugging.
Yellow and Blue arrows
appear next to the executable line of the selected kernel.
The yellow arrow is the next line to execute in a work-item, while the blue arrow is the next line to
execute in a work-group.
See Also
Using Kernel Builder
Assigning Debug Parameters
To set kernel arguments for the debug session, refer to the Assign Parameters tab on the Debug
Board. Click cells in the Assigned Variable column to create or add variables as kernel arguments.
Use immediate values for primitive types like int, float, char, half, and so on.
Add comma-separated immediate values (for example: 2,4,6,8 for a given uint4 argument) for vector
type. If the given values don't correspond to the vector size of the given type, the last specified value
is propagated to the correct size. For example, if you type 2 as a value to an int4 variable, it turns
automatically to 2,2,2,2.
For complex types like arrays, images, and samples, use the Variable Managment window, which
you can open by clicking cells with Click Here To Assign. In the Variable Managment window
select appropriate variables and click Assign.
83
User Manual – Intel® SDK for OpenCL™ Applications
You can set group sizes by typing the requested global and local work-group sizes in the Workgroup
size definition group box on the Assign Parameters tab of the Kernel Debugger.
NOTE
If a kernel contains input buffer argument or input image argument, the global and local sizes
are set automatically according to the sizes of the buffer/image. You can change these values
manually.
See Also
Using Kernel Builder
Kernel Debugger Controls
You can control the debugging process using the Debug tab of the Kernel Debugger.
The debugger control panel contains several buttons that you can use to control the debugging
process. Using step-over and continue commands, you can perform kernel debugging in three levels:
•
•
•
84
Work-item level
Work-group level
Kernel level
Preview Features
Work-Item Level
On the work-item level, the Debugger runs commands for a single work-item.
Click the
button or push F5 to use the step-over command for the selected work-item.
Click the
button or push F9 to use the continue command for the selected work-item.
Work-Group Level
On the work-group level, the Debugger runs commands for a selected work-group. For example, if the
local work-group size is 10, the debugger runs 10 work-items that belong to the selected work-group.
Click the
button or push F6 to use the step-over command for the selected work-group.
Click the
button or push F10 to use the continue command for the selected work-group.
Kernel Level
On the kernel level, the Debugger runs commands for the whole set of work-items as defined in the
global size.
Click the
button or push F7 to use the step-over command for all work-items.
Click the
button or push F11 to use the continue command for all work-items.
Finish the debugging session by clicking the button or pushing Ctrl+F5.
NOTE
Any combination of commands on different levels is possible during debug session.
See Also
Using Kernel Builder
Selecting Work-Items and Work-Groups to Debug
You can select a work-item to debug via:
•
•
Selecting the global work item:
1. Select the Select Work Item box.
2. Select the requested global work item.
3. Click Select.
Or via selecting a local work-group and work-item:
85
User Manual – Intel® SDK for OpenCL™ Applications
1. Select Select Local Work Group box.
2. Select the requested local work-group and local work-item.
3. Click Select.
Upon selecting the global work-item, the corresponding local work-group and local work-item entries
appear in the Local work-group box and vice versa.
You can change the selected work-item or work-group during the debug session via selecting the
requested work-item or work-group and clicking Select.
Work-item and work-group dimensions availability is determined by the group size set in the Assign
Parameters tab of the Kernel Debugger debug board. If the kernel is one-dimensional (the X value is
bigger than 0, while Y and Z are set to 0) then only X axis is available when selecting work-item or
work-group.
See Also
Using Kernel Builder
Watching Variables and Kernel Arguments
The Watch Variable box contains variable names and values used by the kernel being debugged:
Buffers and images, passed as kernel arguments appear in the Arguments box:
Click any variable name to see its content.
See Also
Using Kernel Builder
86
Preview Features
OpenCL™ Analysis Tool
About the OpenCL™ Analyze Tool
OpenCL™ Analyze Tool is a preview feature that provides basic performance information for OpenCL™
applications.
The Analyze Tool enables to collect trace data of OpenCL APIs, OpenCL kernels and OpenCL memory
operations. You can use the Analyze Tool to find out the time of execution, the frequency and the
work size data of each OpenCL kernel that was launched during your program's execution. You can
also find statistics of all OpenCL API calls and data about memory commands executed in your
program.
When you use the Analyze Tool, you create an Analyze Session, which contains the configuration data
for collecting performance information and the results of the analyze run. You can explore all the
analyze sessions that you created in the Analyze Session Explorer window.
Parent topic: Preview Features
Creating and Launching New Analyze Session
To create and run an Analyze session, do the following:
1. Go to CODE_BUILDER > OpenCL Application Analysis > New Analyze Session…
2. In the OpenCL Analyze Session dialog specify information about the application that you want
to analyze.
3. Make sure that the Start Automatically on Process Launch check box is selected and then click
Launch.
4. Your application starts and the profiler starts to collect data.
5. Exercise the functionality that might contain performance issues.
6. While the application is running a new Session Run tab is opened in the main Visual Studio*
window.
7. Click Pause/Resume analyze button in the Session Run tab to pause or resume data
collection.
8. Click Close analyze or close the application.
87
User Manual – Intel® SDK for OpenCL™ Applications
o
o
o
Application – full path to the target application
Arguments – command-line arguments to use when starting the target application
Working Directory – working directory for the target application to be started. If no working
directory is specified, the default is the directory that contains the target application.
Analyzing the Data
After you finish running the application, the new analyze session that you created appears in the
Analyze Explorer window and the following reports are generated and appear in the main Visual
Studio* window:
•
88
API Call - lists statistics of calls made to the OpenCL API, including the number of times the API
call was called, the number of times error returned, and statistics on the elapsed time each API
call took while executing
Preview Features
•
Kernel Launch Commands - shows every OpenCL kernel that was launched during program
execution. Each row shows the time of execution and work size data for each launch.
•
Memory Commands - shows every memory command executed in your application.
89
User Manual – Intel® SDK for OpenCL™ Applications
Revising Code and Rerunning Session
After you optimize your code, you can rerun the profiling session and compare the data to see how
your changes improve your application performance.
To rerun an analyze session, do the following:
1. Open the Analyze Sessions Explore from CODE BUILDER > OpenCL Application Analysis >
Windows > Analyze Session Explorer
2. In the Analyze Sessions Explorer right-click the analyze session that you want to rerun and
select Rerun.
3. A new analyze session is created and launched and the profiled application starts.
4. After the application is finished the new analyze session appears in the Analyze Explorer window
and new reports are generated.
Output Files
For each analysis session, the analysis tool creates a session directory named with application's
name, the date, and an incrementing session number. When profiling begins and also each time
you pause and resume the data collection during the session, a new capture subdirectory is
created in the session directory. The capture directory is called “capture” and an incrementing
number (for example, capture_1, capture_2, and so on). The files in that directory comprise the
capture reports.
These are the types of files in a capture directory:
o
o
*.csv - capture reports in CSV format.
*.bin - capture reports in binary format – you can open such reports in Visual Studio from the
Analyze Sessions Explorer.
In addition, a session file is created in the session directory. This file stores the data about session
configuration. You can use it to create and run another similar session.
Configuring the Analyze Tool
You can use the Analyze Session Settings dialog to change the reports directory and also to change
the connection info for the analyze sessions.
To open the Analyze Session Setting dialog go to CODE BUILDER > OpenCL Application
Analysis > Settings
90
Preview Features
•
•
Report Location – full path to the directory that contains analyze reports. You can mark the
Place output reports in the solution directory check button. In this case, if you open a
solution in Visual Studio*, the Analyze Tool ignores the specified directory and places the analysis
reports into the solution directory.
Connection – range of ports number for the Analyze Tool to find an available port. The Analyze
Tool uses a port in the specified range to establish connection with Visual Studio*.
Kernel Development Framework
About Kernel Development Framework
Kernel Development Framework is preview feature of native integrated development environment in
the Microsoft Visual Studio* that enables you to build and analyze OpenCL kernels.
The framework supports Intel® Architecture processors, Intel Processor Graphics, and Intel Xeon
Phi™ coprocessors as well as remote development on Android* devices. The tool provides full offline
OpenCL language compilation, which includes:
•
OpenCL syntax checker
•
Cross-platform compilation
•
Low Level Virtual Machine (LLVM) viewer
•
Assembly code viewer
•
Intermediate program binary Generator
The feature also provides a way to assign input to the kernel, test the correctness, and analyze
kernel performance based on group size, build options, and target device.
91
User Manual – Intel® SDK for OpenCL™ Applications
NOTE
All screenshots in this user manual originate from Microsoft Visual Studio* 2012. The Kernel
Development Framework is also supported in Visual Studio versions 2010 and 2013.
Kernel Development Framework Session
About the Development Sessions
Work in the Kernel Development Framework is managed through session. To create, build, or analyze
an OpenCL kernel you need to create a session.
A session contains
•
•
•
A file with an OpenCL program
Build artifacts:
o Generated LLVM code
o Assembly code
o Intermediate binary files
OpenCL kernels with assigned variables and analysis reports
Creating a New Session
To create a new session, do the following:
1. Go to CODE-BUILDER > Kernel Development Framework > New Sessions Or click the New
Session button
92
in the Code Builder Build toolbar menu .
Preview Features
2. Specify the session name, path to the folder to store the session file and the content of the
session (can be either empty session or with pre-defined OpenCL code).
3. Click Done.
Once the session is created, the new session appears in the Code Builder Session Explorer Dialog.
If you don’t see the Code Builder Session Explorer dialog, go to: CODE-BUILDER > Kernel
Development Framework > Windows > Code Builder Session Explorer.
Creating Session from Existing OpenCL Code
The Kernel Development Framework enables you to create a session from an existing application that
contains OpenCL™ code files. If you have a project in Microsoft Visual Studio* that contains such
files(s), you can do the following:
•
Right-click the OpenCL file and select Create Code Builder Session
•
A new Session is created and becomes available in the Code Builder Session Explorer dialog.
Saving and Loading Sessions
To save your session, go to CODE-BUILDER > Kernel Development Framework > Save Session.
Or click the Save Session button
in the Code Builder Build toolbar menu.
New sessions are saved under the New Session Default Directory defined in the Kernel
Development Framework’s Settings. See Kernel Development Framework Settings chapter on how
to change these settings.
93
User Manual – Intel® SDK for OpenCL™ Applications
To load a saved session, do the following:
1. Go to CODE-BUILDER > Kernel Development Framework > Load Session. Or click the Load
Session button
in the Code Builder - Build toolbar menu.
2. Select the session to load in the Open File dialog and click Open.
Removing Sessions
To remove a session from the Code Builder Session Explorer dialog, right-click the session that you
want to remove and select Remove Session (Keep local files).
Configuring Sessions
• To configure the session, open the Session Options menu by selecting CODE-BUILDER >
Kernel Development Framework > Session Options.
The Session Configuration window enables you to define
•
•
•
Target device to perform build or analysis operations
Build options
Target platform architecture
Code Builder Configuration Toolbar
You can control some of the Session’s options through the Code Builder Config toolbar.
To show the toolbar, go to: VIEW > Toolbars and make sure that Code Builder Config is checked.
The Code Builder Config toolbar enables you to:
•
•
•
•
Select the target OpenCL™ Platform (Currently only Intel’s platform is supported)
Select the target OpenCL Device
Select the target platform architecture
Show the platform info dialog
Configuring Device Options
Open the Session Options menu via selecting CODE-BUILDER > OpenCL Kernel Development >
Session Options.
The Device Options tab provides several configuration options.
94
Preview Features
Target Machine group box enables selecting the target machine:
•
•
Local Machine
Remote Machine
To use the Remote Machine option, you need to
1. Connect an Android* device with Intel processor or an emulator based on Intel x86 System
Image.
2. Copy OpenCL runtime to the Android device or emulator. See section Installing OpenCL™ Runtime
on Emulator.
3. Click Setup to copy OpenCL tools to the device.
NOTE
You need to use the Setup option each time you start an emulator device.
OpenCL Device group box enables selecting the target platform and device for the selected machine:
•
•
•
•
Intel CPU
Intel(R) Graphics
Intel Xeon Phi(tm) coprocessor
Intel CPU on experimental OpenCL2.0 Platform
Network Settings group box enables configuring the network port range.
Configuring Build Options
Open the Session Options menu via selecting CODE-BUILDER > OpenCL Kernel Development >
Session Options.
95
User Manual – Intel® SDK for OpenCL™ Applications
The Build Options tab provides several configuration options.
OpenCL Options group box, which enables typing the options into the text box.
Target Build Architecture group box enables:
•
•
Using the current platform architecture.
Configuring the build architecture manually by unchecking the Use current platform
architecture check box, and selecting:
o Select Target operating system:
Current Operating System
Android Operating System (available on Windows* OS only)
o Choosing the Target instruction set:
Streaming SIMD Extension 4.2 (SSE4.2)
Advanced Vector Extension (AVX)
Advanced Vector Extension (AVX2)
Changing the Target Build Architecture options enables viewing assembly code of different
instruction set architectures and generating program binaries for different hardware platforms.
NOTE
Target Build Architecture options are available for the CPU device only.
Configuring General Options
Open the Session Options menu via selecting CODE-BUILDER
The General Options tab enables defining the target session’s platform architecture (x86 or x64).
96
Preview Features
Building and Compiling OpenCL™ Program
To build an OpenCL™ program via the Kernel Development Framework feature of the OpenCL Code
Builder, do the following:
1. Select the session with the code that you would like to build.
2. Go to CODE-BUILDER > Kernel Development Framework > Build Program. Or click the
Build Program button in Code Builder - Build toolbar menu.
The build log appears in the Console Output dialog.
97
User Manual – Intel® SDK for OpenCL™ Applications
Build Artifacts
Once OpenCL™ program build is completed, the build artifacts appear under the Builds Artifacts
note in the Code Builder Session Explorer. The list of artifacts includes:
•
•
•
•
•
•
•
Generated LLVM code (<file_name>.ll)
Generated assembly code for CPU and Xeon Phi only (<filen_name>.asm)
Program’s intermediate program’s binary (<file_name>.ir)
32-bit version of generate SPIR LLVM code (<file_name>_x86.ll)
64-bit version of generate SPIR LLVM code (<file_name>_x64.ll)
32-bit version of the SPIR binary (<file_name>_x86.spir)
32-bit version of the SPIR binary (<file_name>_x64.spir)
All build artifacts are stored in the sessions’ folder. You can double-click the LLVM\Assembly code to
see its content in the IDE’s editor. You can open the containing folder by right-clicking one of the files
and selecting OpenCL Containing Folder.
Kernel Arguments
Once OpenCL program build is completed successfully you are able to see all built kernels with
arguments under the Kernels node in the Code Builder Session Explorer.
98
Preview Features
Code Builder Build Toolbar
To show the toolbar go to: VIEW > Toolbars and make sure that the Code Builder Build option is
checked.
You can use the Code Builder Build toolbar to perform basic operations on sessions such as:
•
•
•
•
•
•
Create new session
Load session
Save session
Build session
Compile session
Open session’s settings dialog
Analyzing Kernel Performance
Using the Code Builder Analysis Toolbar
To show the toolbar go to: VIEW > Toolbars and make sure that Code Builder Analysis option is
checked.
You can use the Code Builder Analysis toolbar to perform analysis operations on sessions such as:
•
•
•
•
Selecting the OpenCL kernel to execute analysis on
Start Analysis
Open Code Buidler Analysis Input window
Open Code Builder Variable Management windows
Analyzing Input
To assign analysis inputs for an OpenCL kernel do the following:
1. Select the desirable kernel from the session’s kernels list in the Code Builder Session Explorer
or from the Select Kernel combobox in the Code Builder Analysis toolbar.
99
User Manual – Intel® SDK for OpenCL™ Applications
2. Open the Code Builder Analysis Input window from: CODE-BUILDER > Kernel Development
Framework > Windows > Code Builder Analysis Input or by clicking the Open Analysis
Input button
in the Code Builder Analysis toolbar.
3. Assign a variable for each kernel argument in the Kernel Arguments table by clicking the Click
here to assign link under the Assigned Variable column. You can assign one-dimensional
variables (such as integer, float, char, half, and so on) on-the-fly by typing single values into
the table. See section "Creating Variables" for details.
Running Analysis
To start the analysis, go to: CODE-BUILDER > Kernel Development Framework > Run Analysis
or click the button
in the Code Builder Analysis toolbar.
Viewing the Analysis Results
Analysis Results Overview
Once analysis is completed, several reports are being generated. A new report is being generated for
each analysis run. The reports are available under the Reports node in the Code Builder Session
Explorer window.
Each report contains several views:
•
•
Execution View – provide information on execution times statistics and on the best and worst
configurations.
Variables View – provide information on the read and read back time of the memory object
being used in the kernel and allows you to see their content.
You can toggle between the views through the Report Selection combobox located at the top of the
report’s layout.
Execution View
The top part of the Execution View enables you to see the tested global and local size best and the
worst configurations, based on median execution time. In case only one configuration exists, the
result appears in both result windows.
The table below enables you to see statistical analysis results for all configurations. The statistics
consists of the following iteration execution time values for the selected configuration:
•
•
•
•
•
100
Median
Average
Standard deviation
Maximum
Minimum
Preview Features
Expending each row in the table enables you to see the total run time, the breakdown to queue,
submit and execute times per iteration for the given configuration.
Variables View
The Variable View table enables you to see read and read-back times for each variable, as well as
the output file path for output parameters. Clicking on this input/output path pops up its content
(images and buffers).
101
User Manual – Intel® SDK for OpenCL™ Applications
Variable Management
Variable Management Overview
You can manage variables in Kernel Development Framework via the Code Builder Variable
Management dialog. To open the dialog go to: CODE-BUILDER > Kernel Development
Framework > Windows > Variable Management or click the Variable Management button
the Code Builder Analysis toolbar.
102
in
Preview Features
Creating Buffer Variables
To create new buffer variable
1. Open the variable management dialog.
103
User Manual – Intel® SDK for OpenCL™ Applications
2. Click the Add button
in the Code Builder Variable Management dialog and choose Buffer in
the opened context menu.
Use CSV or binary files, random values, or zeroes to create buffers.
•
•
When using CSV files, each line represents one OpenCL data type (like int4, float16, and so on),
with a value in each column to satisfy the type size. For example, for a long8, at least eight
columns of long numbers should exist in each line. The size of the buffer is used as the number of
lines to read from CSV. The CSV file may hold more columns or lines than needed for a specific
buffer, but not fewer.
When using binary files, the content should be a concatenation of the OpenCL data type, and as
with using CSV files, the file may hold more data than indicated by the Size argument.
NOTE
Output buffers do not need a value assigned to them. If a value is assigned, it is ignored.
104
Preview Features
Creating Image Variables
To create a new image variable,
1. Open the variable management dialog.
2. Click the Add button
in the Code Builder Variable Management dialog and choose Image
in the opened context menu.
Use input bitmap files and the parameters to create images. Create output images with the correct
size, type, channel order, and so on.
NOTE
In this version of the tool only 2 dimensional images with CL_UNORM_INT8 channel data
type and CL_BGRA channel order are supported.
105
User Manual – Intel® SDK for OpenCL™ Applications
The Get output image data checkbox disables reading back the output buffer or image. It means
that you can try more than one combination of global or local work sizes, where there is no need to
read the same output for all the combinations.
Creating Sampler Variables
To create new sampler variable
1. Open the variable management dialog.
106
Preview Features
2. Click the Add button
in the Code Builder Variable Management dialog and choose Sampler
in the opened context menu.
Selecting Memory Options
You can change memory options of buffers or images using Kernel Development Framewokr. Refer to
the relevant sections of this guide for guidelines on creating or editing variables.
NOTE
You are not limited in selecting options. Avoid selecting the option combinations that are
forbidden by the OpenCL 1.2 specification, otherwise you may encounter errors upon
analysis.
To choose buffers and images memory options, do the following:
1. Open the variable properties by right-clicking an image or buffer variable in the Code Builder
Variable Management window and selecting Edit Variable.
2. Open the combobox next to Memory flags to use.
3. Select options and click Done.
107
User Manual – Intel® SDK for OpenCL™ Applications
Editing the Variables
To edit the variables in the system using the Kernel Development Framework, do the following:
1.
2.
3.
4.
Open the Code Builder Variable management window.
Right-click a variable name.
Click Edit Variable.
Change the desired properties and click Done.
Viewing Contents of the Variables
To view buffer or image contents when using the Kernel Development Framework, do the following:
1. Open the Code Builder Variable management window.
2. Right-click a buffer or image name you want to view.
3. Click View Variable.
Copying Variables
To create a copy of buffer, image, or sampler varialbe when using the Kernel Development
Framework, do the following:
1. Open the Code Builder Variable management window.
2. Right-click a buffer, image, or sampler name you want to copy.
3. Click Copy Variable.
Removing Variables
To delete variables when using the Kernel Development Framework, do the following:
1. Open the Code Builder Variable management window.
2. Right-click a variable name.
3. Click Delete variable or Delete all variables.
You can delete all buffers, images, or samples by right-clicking the corresponding node (Buffers,
Images, or Samplers respectively).
108