1
Q003fl5O??2E
OR
August1989
HEO/F76/
- 80r3
c 3
AJEU9RA,
ORGANON: SOUTHWEST OREGON
GROWTH AND YIELD MODEL
USER MANUAL
Version 2.0
Arlene S. Hester
David W. Hann
David B. Larsen
JR HEU/F76/2 ,:Or3 c.3
Hester, Arlene
ORGAN ON
FOPEIT RUEARCH LAB
College of Forestry
L
Oregon State University
The Forest Research Laboratory of Oregon State University was
established by the Oregon Legislature to conduct research leading to
expanded forest yields, increased use of forest products, and accelerated economic development of the State. Its scientists conduct this
research in laboratories and forests administered by the University
and cooperating agencies and industries throughout Oregon. Re-
search results are made available to potential users through the University's educational programs and through Laboratory publications
such as this, which are directed as appropriate to forest landowners
and managers, manufacturers and users of forest products, leaders of
government and industry, the scientific community, and the general
public.
The Authors
Arlene S. Hester is research assistant, and David W. Hann is
associate professor of biometry, Department of Forest Resources, College of Forestry, Oregon State University, Corvallis. David R. Larsen
is research associate, Resources Management Division, College of
Forest Resources, University of Washington, Seattle. When this work
was done, Larsen was a research assistant, College of Forestry, Oregon State University.
Legal Notice
This document and associated software were prepared as part of
a project under the auspices of Oregon State University. Neither Ore-
gon State University nor any person acting on behalf of such:
a) makes any warranty or representation, express or implied, with
respect to the accuracy, completeness, or usefulness of any informa-
tion, product, or process disclosed; b) claims that the use of any information or method disclosed in this report does not infringe privately
owned rights; or c) assumes any liabilities with respect to the use of,
or for damages resulting from the use of, any information, apparatus,
or method disclosed in this report.
Disclaimer
Reference herein to any specific commercial product, process, or
service by trade name, trademark, manufacturer, or otherwise, does
not necessarily constitute or imply its endorsement, recommendation,
or favoring by Oregon State University. The views and opinions of
authors expressed herein do not necessarily state or reflect those of
Oregon State University thereof, and shall not be used for advertising or product endorsement purposes.
To Order Copies
Copies of this and other Forest Research Laboratory publications
are available from:
Forestry Business Office
College of Forestry
Oregon State University
Corvallis, Oregon 97331
Please include author(s), title, and publication number if known.
ORGANON
Southwest Oregon
Growth and Yield Model
User Manual
Version 2.0
Arlene S. Hester
David W. Hann
David R. Larsen
© 1989 Oregon State University.
All rights reserved.
OR HEO/F76/2 .80r3 c.:3
Hester, Arlene S.
URGANCIN
j
Contents
Data Read and Edit
Error and Warning Detection
Error Correction
Errors to Correct
Introduction
Hardware Requirements
Software Requirements
List All Record
Modify a Record
Add a Record
Productivity Variable
Sites Indexes
Even/Uneven Age Stand
Stand Age
Data Completion
What You Need to Know
to Use ORGANON
Overview
Program Setup
Expansion Factor
Height and Height Calibration
Crown Ratio and
Crown Ratio Calibration
Diameter Calibration
Calibration and Actual Data Plots
.INP Files
Two-Floppy System
Hard Disk System
Program Parameters
8
8
9
10
10
11
12
13
13
13
13
14
14
15
17
18
18
20
Logged Drive
File Names
ORGANON Model Execution
ORGANON Data Edit
Measured Tree Data
Minimum Required Measurements
Strongly Recommended Measurements
Optional Measurements
5
Data File Creation
Data Elements
PlotJPoint Number
Species Code Number
Diameter at Breast Height
Total Tree Height
Crown Ratio
Expansion Factor
Radial Growth
User Code
Word Processor
5
5
5
ORGANON Setup
11
5
5
5
6
6
6
6
6
6
6
7
8
ORGANON Program Defaults and
Specifications
Run Defaults
Tripling
Maximum Tree Samples
Menu Display
Height Calibration
Height-to-Crown Base Calibration
Diameter Growth Calibration
Limit on Maximum Basal Area
Yield Tables
Mortality Table
Printer Form Feed
Graphics Printer
Volume Equations
Board Foot Defaults
Minimum Board Foot
Log Top Diameter
Board Foot Trim Allowance
Board Foot Stump Height
Board Foot Log Length
Board Foot Minimum Log Length
Cubic Foot Defaults
Cubic Foot Conifer Top Diameter
Cubic Foot Hardwood
Top Diameter
Cubic Foot Conifer Stump Height
21
21
21
22
22
22
22
22
22
22
23
23
23
23
24
24
24
24
24
24
24
24
24
24
Execution Suggestions
26
Master Menu Options
Residual Tables and Plots
Sample Tree List (11)
Sample Summary Table (SS)
Per Acre Stand Table (ST)
Stocking Table (SK)
27
Log Table (LG)
Mortality Table (MO)
Run History (RH)
Display Defaults (DF)
Average Plots
Per Acre Plots
Table and Plot Parameters
Species
Destination
Windows
Cut Tables and Plots (CR)
Growth (GR)
Growth Cycles
Growth Cycle Limits
27
28
28
28
29
30
30
30
31
31
32
33
33
33
34
35
37
37
38
Management (MT)
Thin
Diameter Thin (DB)
Basal Area Thin (BA)
Stand Density Index Thin (DI)
User Code Thin (US)
Fertilization (FE)
Ingrowth (IN)
Final Harvest (FH)
Creating a Management Scheme
Trial vs. Accepted Management
Reports (RR or CR)
Restart Management (RS)
Management Exit
Void Management (VM)
Perform Management (PM)
Restart ORGANON (RS)
Quit (QU)
Final Output File and Run History
Supplementary Program 'PLTYLD'
38
39
39
40
40
41
41
41
42
42
43
43
43
43
43
43
44
44
44
so
Warning and Error Messages
52
Literature Cited
59
111
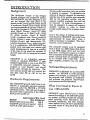
INTRODUCTION
Background
The Southwest version of the ORegon
Growth ANalysis and projectiON system,
SW-ORGANON, has been designed to project the changes that take place in the
mixed conifer, young-growth forest stands
of southwest Oregon. Such stands should
have approximately 80 percent of their basal area in Douglas-fir (Pseudotsuga men-
ziesii [Mirb.] Franco), grand fir (Abies
grandis [Dougi. ex D. Doni Lindi.), white
fir (Abies concolor [Gord. & Glend.]
LindL), ponderosa pine (Pinus ponderosa
Dougi. exLaws.), sugar pine (Pinus lambertiana DougL), and incense-cedar (Calocedrus decurrens Torr.), either singularly or in combination. SW-ORGANON can
predict both even-aged and uneven-aged
stand development as long as a majority
of the trees in the stand are between 15
and 120 years old, as measured at breast
height.
During model execution, only one module
is present in memory. To determine the
i111UUIiI., UI II1UIUL
IqLUi U iU.[
2kULLI4JII,
add the size of the module, approximately
40K for the operating system, and any
memory resident programs that will not
be removed. In some circumstances, it
may be necessary to remove all memory
resident routines in order to obtain
enough usable memory for program execution.
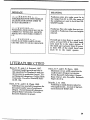
Due to the extent of mathematical equations found in ORGANON, the model runs
approximately 20 times faster when a
math co-processor is installed. This chip,
however, is not mandatory.
The computer system must be equipped
with at least two 360K floppy disk drives
or one 360K floppy drive and one hard
disk drive. If frequent output to a report
ORGANON is an interactive program
written in standard FORTRAN 77 code
file is requested (yield tables, plots and reports), running times are noticeably shorter on a system with a hard disk. In all
other respects, program runs are identi-
program is "user friendly" and should
Software Requirements
designed specifically to run on an IBM PC
or compatible personal computer. The
guide users through its execution. The
user manual should help you prepare the
tree data input file as well as run the
model.
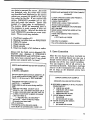
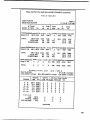
Hardware Requirements
The ORGANON growth model runs on an
IBM PC or compatible personal computer
operating under the MS-DOS or PC-DOS
operating system. The load size of each of
the three main components of the ORGA-
NON growth model are:
Module
Approximate Mm. Load
Size (kilobytes)
START (data entry and edit):
294 K
ORGNON (growth and reports): 493 K
PLTYLD (yield table plotter):
49 K
cal.
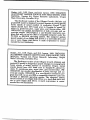
ORGANON is delivered as an executable
module. An MS-DOS or DOS operating
system environment is necessary to load
the program (and overlays as necessary)
and provides the program Input/Output
requirements and file operations.
What You Need to Know to
Use ORGANON
ORGANON users should have a fundamental knowledge of the MS-DOS operating system, including simple file management (printing, name restrictions, etc.),
keyboard familiarity, and disk management (default drive, file drive specification
and path names if using hard disk subdirectories).
1
You should realize that computers distinguish the difference between 0 (zero) and
0 (oh) and 1 (one) versus 1 (lower case letter L). Please be careful to enter the correct values.
ing on the situation, restarts a suspended
operation of the program. Otherwise,
pressing the carriage return selects a default response designated by parentheses
Refer to the MS-DOS and hardware man-
input by printing those responses in bold
in the request (see Execution Suggestions). This manual designates all user
type.
uals for further information regarding
computer operation.
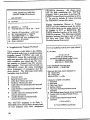
Overview
The use of '<CR> in this manual and on
the computer screen during program execution refers to using the key marked either 'carriage return', 'enter' or a bent left
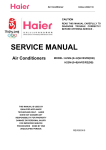
The illustration below depicts the entire
ORGANON system, showing each of its
major components and their relationship
arrow (depending on the keyboard).
Pressing the carriage return key, depend-
Data Previously
Edited?
Yes
N f
-
to each other.
Edit an
CExisting
File!)
No ________
(
Yes
I
No
i
I
Creat9 a
New File?
(Read and Editi
Data File_J
Yes
I
4,
'1'
Data
Read Data) t:: I_Correction J
IReadNew
L Data File
Data
Completion
Write Data
File
MAIN MENU
( Residual
[Restarti
'.
Reports and I
Plots
Management
2
J
j,
r Quit j
Growth
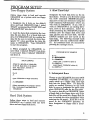
PROGRAM SETUP
Two-Floppy System
1. (First Time Only)
Follow these steps to load and execute
1. Designate the A drive as the default
drive and load ORGANON Disk 1 titled
Designate the hard disk drive as the default drive. Create a new directory (using
the DOS command 'MKDIR\dirname'),
and move to this new directory (using the
DOS command 'CD\dirname') where you
will work in ORGANON. If you wish to
'START' containing files START.EXE and
ORGANONBAT into drive A.
tory, move to that directory. Insert the
ORGANON on a system with two floppy
disk drives.
2. Load the data disk containing the tree
data file into drive B or a blank disk into
drive B if ORGANON will be creating the
data file (be sure to include the drive designator 'B:' when specifying the data file
name to ORGANON). Type ORGANON
to start the program.
work on ORGANON in an existing direc-
disks containing the ORGANON program
modules into the floppy disk drive and
copy all files onto the hard disk. All ORGANON modules are now saved on the
hard disk. The following example loads
ORGANON onto the subdirectory MODEL. All command lines are executed by
pressing the carriage return.
3. When prompted by ORGANON, re-
move Disk 1 (labeled 'START') from drive
A and insert Disk 2 (labeled 'ORGNON')
into drive A.
INPUT EXAMPLE
(Place the data disk or a blank disk
in drive B. Make drive A the default
drive. Place Disk 1, 'START', in
default drive A:)
B:> A:
PROGRAM SETUP EXAMPLE
A:> C:
C:> MKDIR\MODEL
C:> CD\MODEL
(insert Disk 1, 'START in drive A)
C:> COPY A:*.*
(insert Disk 2, 'ORGNON' in drive A)
C:> COPY A:*.*
2. Subsequent Runs
A:
(type 'ORGANON' to begin execution)
A:>
ORGANON
(When requested by the program, remove
Disk 1 from drive A and insert Disk 2,
'ORGANON')
Hard Disk System
Follow these steps to load and execute
ORGANON on a system with one hard
drive and one floppy disk drive.
Change to the ORGANON directory (DOS
command CD\MODEL). If a data file al-
ready exists on a floppy disk, load that
disk into the floppy drive. If a data file
exists on another directory on the hard
disk, be sure to designate the path name
when ORGANON asks for the file name.
To create a data file in ORGANON, insert
a blank disk in the floppy drive only if the
data file will be saved on a floppy disk (be
sure to include the drive designator when
entering the file name). If the file is to be
saved in the ORGANON directory, no
drive designator or floppy disk is necessary.
The following example has an existing
SETUP EXAMPLE
data file TESTPLT on a floppy disk.
SETUP EXAMPLE
C:> CD\MODEL
(insert data disk in drive B)
C:> ORGANON
(when requested by ORGANON,
designate the data file by
entering B :TESTPLT)
C:> CD\MODEL
C:> ORGANON
(when requested by OIRGANON,
designate the data file by
entering C:\DATA\TESTPLT)
The following example has an existing
data file TESTPLT on the same directory,
MODEL, as the ORGANON program.
SETUP EXAMPLE
The following example has an existing
data file TESTPLT on hard disk subdirectory DATA.
C:> CD\MODEL
C:MODEL> ORGANON
(when requested by ORGANON,
designate the date file by
entering TESTPLT)
PROGRAM PARAMETERS
Logged Drive
The logged (or default) drive is the disk
drive the system searches to find the data
file name you typed in. If a file does not
exist on the logged drive, you must enter
a drive designator (i.e. B:) along with the
file name. ORGANON then searches the
correct directory for the file name designated. If the file is not found in that directory, an error message is displayed on
the screen and you must re-enter a file
name. For file name errors, be sure you
have typed the correct drive designator.
File Names
ORGANON accepts file names that are le-
gal in the DOS operating system. A "le-
gal" file name is 1 to 8 characters in
length, and may be followed by a 1 to 3
4
character extension. See Filenames,
Valid Characters in the DOS manual
for further information. An ORGANON
data file name should not, however, have
the optional 3-letter extension. After ORGANON reads the raw data file, additional variables are calculated and a new file
with the same root name is created. The
3-letter suffix, or file name extension
'.INP', is appended to the root file name.
This file is written to the same drive from
which the original data file was read.
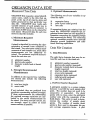
ORGANON DATA EDIT
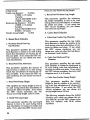
Measured Tree Data
3. Optional Measurements
ORGANON first requests a stand identifi-
The following set of tree variables is optional for input:
cation name, which is the title that appears at the top of all reports, plots and
tables generated by that particular tree
data file. ORGANON then reads each
variable element of each sample tree in
the stand of the data file you entered. A
maximum of 2000 trees can be entered for
each stand. Measured data for each tree
stored in that file includes:
1. Minimum Required
Measurements
A stand is described by entering the char-
U
U
U
expansion factor
prior 5-year radial growth
user code
If expansion factors are missing from the
input file, ORGANON computes the expansion factors based on user-supplied information concerning the sampling design
that measured the stand. The remaining
optional variables provide more accurate
diameter growth predictions and addi-
tional thinning capabilities.
acteristics of sample trees contained in
that stand. You must enter certain meas-
Data File Creation
measurements are not absolutely re-
1. Data Elements
urements of each sample tree, while other
quired. The minimum required measurements for each tree are:
U
U
U
plot/point number
species code number
diameter outside bark at breast
height
2. Strongly Recommended
Measurements
In addition to the required tree variables,
you should also include the following
measurements:
U
U
total tree height
crown ratio
If not included, they are predicted from
equations representing regional averages.
If these measurements are subsampled,
the regional average equations are cali-
brated to the actual measurements for
the stand. For more accurate results, you
are strongly urged to collect as many
measurements as possible.
The eight data elements that may be entered for each tree in the stand are:
U
U
U
U
U
U
U
U
plotipoint number (required)
species code number (required)
diameter (outside bark) at breast
height (required)
total tree height (optional)
crown ratio (optional)
expansion factor (optional)
radial growth (optional)
user code (optional)
a. Plot/Point Number (Required)
A plot/point number is a unique integer
between 1 and 999 for each sample plotl
point. The number does not need to be
consecutive or sequential. For plots!
points with no trees, enter the plot/point
number only with the remainder of the
fields blank. This entry is used in deter-
mining the number of sample plots!
points. The number of sample plots!
points is then used to determine the per
acre average expansion factor. A plot!
5
point number of 0 is not valid and will be
rejected by ORGANON.
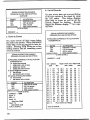
b. Species Code Number (Required)
A species code number is a 3-digit Forest
Service code number to identify each tree
species. ORGANON models for and accepts only the following tree species and
corresponding species codes:
e. Crown Ratio (Strongly Recommended)
The crown ratio is the length in feet of the
live crown (CL) divided by the total tree
height (HT). Crown length is the total
tree height minus the height to crown
base (HCB). In symbolic terms, crown ratio is computed by:
R = CL/HT
or
1.0 HCB/HT
When determining the base of the live
Species Tree
Code
Species
Species Tree
Code
Species
312 Bigleaf Maple
015 White Fir
361 PaciflcMadrone
017 Grand Fir
431 Golden Chinkapin
081 Incense Cedar
631 Tanoak
117 Sugar Pine
122 Ponderosa Pine 805 Canyon Live Oak
815 Oregon White Oak
202 Douglas Fir
Western
Hemlock
818
California Black Oak
263
For any tree species not listed, assign a
code to the tree from the list above that
closely resembles the growth of your unlisted tree species.
c. Diameter at Breast Height
(Required)
The diameter at breast height is the outside diameter measured in inches (to the
nearest one-tenth inch) at the tree's
breast height (approximately 4 1/2 feet
above ground on uphill side) for all trees
greater than breast height.
d. Total Tree Height
(Strongly Recommended)
The total tree height is the height of the
tree from ground level to the crown's tip
measured in feet (to the nearest one-tenth
foot) for all trees.
crown, ignore epicormic and short branch-
es less than 3 feet long. For trees of uneven crown length, visually transfer lower
branches on the longer side to fill holes in
the upper portion of the shorter side to
generate a full, even crown.
f. Expansion Factor (Optional)
The expansion factor is the weight (i.e.,
number of trees per acre) that each sample tree represents on each plotlpoint.
The program automatically converts this
to the stand average (ORGANON divides
by the number of points). For a fixed area
plot, the expansion factor is the reciprocal
of the area of the plot in acres. For variable plots, the expansion factor is the basal
area factor in square feet divided by the
tree's basal area.
g. Radial Growth (Optional)
The 5-year radial growth inside bark at
breast height is measured in decimal
inches determined from increment cores.
If measured during a growing season, be
sure to ignore the current year's growth.
h. User Code (Optional)
A user code is a 1- or 2-digit number assigned to a tree. The user code allows you
to designate the tree in some predetermined manner for thinning. For example,
you might code all mistletoe infected trees
one code and assign another code to
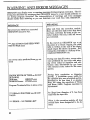
Column # Comment
with
all non-crop trees. Managers can select
1
1-3
Plot/Point number (INTEGER).
REQUIRED (e.g.,10).
2
5-7
Species Code number (INTEGER).
REQUIRED. One of the 2- or 3-digit
codes from section SPECIES CODE
NUMBER (e.g., 202).
3
9-13
Diameter Outside Bark at Breast Height
in inches (REAL-I decimal place).
REQUIRED (e.g., 27.5).
these specially coded trees for removal or
other action.
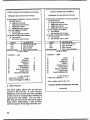
2. Word Processor
You can use any word processor that generates an ASCII file to create the data
file. An ASCII file is a file that contains
no formatting characters (word wrap, formatting, etc.). This is generally referred
to as a flat, or non-document file. Wordstar, PC-Write, IBM Personal Editor and
MS-DOS Line Editor (EDLIN) can create
this type of file. Check your word processor manual for instructions on creating
an ASCII file.
Use one line (all characters up to a carriage return) to enter all the data for one
tree. The total number of lines in the file
should equal the total number of trees being entered plus the number of plots/
points without trees.
data elements should be right justified
in their field. If an optional element is
4
1
5-19
Total Tree Height in feet (REAL-I decimal place). STRONGLY RECOMMENDED (5 blanks if omitted,
e.g.,134.9).
5
21-24
Crown Ratio (REAL-2 decimal places).
STRONGLY RECOMMENDED (3
blanks if omitted, e.g.,63).
6
26-3 1
Expansion Factor for plot/point (REAL2 decimal places). ORGANON will divide this value by the number of plot/
pointsdetermined during data input.
OPTIONAL (6 blanks if omitted, e.g.,
25.24).
7
33-37
Radial Growth inside bark in inches
All
not included, enter blanks in its field. For
plots or points without trees, be sure to
enter the plotlpoint number only with the
remainder of the fields blank. In the following description, an integer refers to a
whole number (no decimal point, i.e.,
365). A real number implies a decimal
(REAL-2 decimalplaces). OPTIONAL (5
blanks if omitted, e.g., 2.91).
6
39-40
User Code (INTEGER). Any designated
identification number for user specified
thinning. OPTIONAL (2 blanks if omit-
ted, e.g.,
2).
number (i.e., 27.4).
the example in the table below to
create a data file using a word processor.
Be sure to begin editing a non-document
ifie whose file name does NOT include a
suffix or extension.
Follow
SAMPLE TREE DATA INPUT LINE
Column
2
1
3
4
1234567890123456789012345678901234567890
10 202
27.5
134.9
I
plot/
point
\ dbh
species
ht
.63
I
cr
25.24
2.91
2
/
\
exp radial user
growth code
I
7
SAMPLE TREE DATA INPUT LINE
WITH MISSING ELEMENTS
Column
4
3
2
1
1234567890123456789012345678901234567890
I\
10 202
plot!
point
I
\ dbh
2.91
.63
27.5
I
I
cr
ht
I
exp
/
radial
user
element at a time, one tree at a time. ORGANON formats the data in an ASCII file
format. The ORGANON setup cannot be
used to add a tree or modify a tree on an
existing tree data file. However, you can
use a word processor to add or edit an existing file. Another option is to use the
on-line editor of ORGANON to add, delete
or modify a tree record.
growth code
species
ORGANON DATA FILE SETUP EXAMPLE
SAMPLE TREE DATA FILE
WITH ERRORS AND OMISSIONS
4
3
1234567890123456789012345678901234567890
1
7.8
1 202
1 202
9.0
1 202
1 202 11.1
4.9
1 202
3.3
1 202
3.0
1 202
2 202 10.4
9.8
2 202
2 202 11.6
4.1
2 202
7.6
2 202
4.4
2 202
2 202 4.6
.2
2 202
6.3
3 199
3.6
3 202
2
43.3
45.9
40.2
35.6
21.9
19.8
45.0
.73
.94
.89
.99
.98
.86
.85
.88
46.6 .91
58.3 .95
31.2 .89
43.6 .92
30.4 .92
35.3 .73
4.5 .87
36.7 .92
20.2 .95
(blank line)
22.5 .98
3.9
3 202
30.7 .95
5.1
4 202
(plot with no trees)
5
C:> CD\MODEL
C:MODEL> ORGANON
Has your data file been previously edited? (Y)- N
Do you want to edit an existing data file? (Y)- N
Do you want to 'create' a new data file? (Y)- V
Enter your 8 letter file name (NO EXTENSION)TESTPLT
TREE#
1
Plot/Point Number (Required-Integer) --> 1
Tree Species Code (Required-Integer) --> 202
Diameter at Breast Height (Required-Real) --> 7.8
Height in feet (Optional-Real) --> 43.3
Crown Ratio (Optional-Real) --> .73
Expansion Factor (Optional-Real) --> <CR>
Radial Growth in inches (Optional-Real) --> <CR>
User 2-digit thinning code (Optional-Integer) --> 2
Species: 202
7.8
DBH:
43.3
HT:
.73
CR:
.0
EXP:
RADGRO: .00
Save this tree (Y)? <CR>
2
USER:
Another tree (Y)? <CR>
Data Read and Edit
3. ORGANON Setup
An optional method of creating a data file
exists within ORGANON. If your data
has not been edited before, and you will
not edit an existing file, you have only one
other choice--let ORGANON create a new
data file. ORGANON prompts you to en-
ter each of the tree data elements, one
After you create a data file and/or have
specified that a data file has not been previously edited, the file is ready for input
into ORGANON.
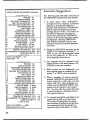
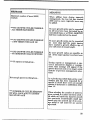
1. Error and Warning Detection
As ORGANON reads an input file, the
raw data is scanned for errors. As errors
are detected, only the trees with errors
are identified and displayed on the screen
unless you request the model to list every
tree record in the file. If you request this
option, ORGANON prompts you to connect and ready the printer. Ignore this
prompt if a hard copy is unnecessary.
The printer MUST be connected later in
the program to print reports if they are
sent to the printer. After all the data are
read, ORGANON provides an error summary. These errors may include:
1. Plot/Point number of 0
2. Missing variables that are REQUIRED
3. DBH of 0 inches
4. Illegal species code
5. Blank records
6. Total tree height of 4.5 inches or under
Along with the fatal errors detected, OR..
GANON also displays if STRONGLY
RECOMMENDED and OPTIONAL variables have been entered and if any plotsI
points were entered with "no trees."
ERROR AND WARNING DETECTION EXAMPLE
C:> CD\MODEL
C:\MODEL> ORGANON
Has your data file been previously edited?(Y)> N
Do you want to edit an existing file?(Y)> <CR>
Stand l.D. (20 char max)?> TEST PL0T278
Tree data file name (NO extension (i.e.
A:MYFILE) J ---> PL0T278
Display data as well as errors during read?(N)>
<CR,
DBH=0.0 FOR TREE 2 IS NOT VALID
HEIGHT<= 4.5" FOR TREE 15 IS NOT VALID
ILLEGAL SPECIES CODE 199 FOR TREE 16
ILLEGAL PLOT/POINT NUMBER OR BLANK
LINE FOR TREE 18
RECORD WILL BE IGNORED***
WARNING POINT 5 HAS NO TREES
20 records have been read...
<CR> to continue...
The following are the data scan results...
Errors MUST be corrected before model is run.
ILLEGAL SPECIES CODES ARE PRESENT,
All point numbers are legal...
ILLEGAL DBH EXISTS
THERE ARE ILLEGAL TREE HEIGHTS...
All crown ratios are present...
THERE ARE EXPANSION FACTORS MISSING...(not reqd)
SOME RADIAL GROWTHS WERE NOT INPUT...(not reqd)
THERE ARE MISSING TREE HEIGHTS...
(not reqd)
1 PLOT WITH NO TREES
Data entry is completed...
You will be entering the correction module.
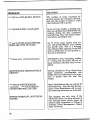
2. Error Correction
After the tree data has been read and an
error and warning listed, you can use a
simple on-line editor to add, delete, list or
change any of the tree record variables.
You can inspect a list of all errors to be
corrected if desired. Entering a carriage
return (<CR>) terminates the on-line edi-
tor as long as all detected errors have
been corrected.
ERROR CORRECTION EXAMPLE
ORGANON ON-LINE EDITOR OPTION
20 RECORDS CURRENTLY IN FILE 'PL0T278
CONSISTING OF:
19 original tree records
1
original plot with no trees
O
added tree records
0 added plots with no trees
0 records flagged for deletion
0 tree records
0
plot records with no trees
20 records remaining after deletion
19 tree records
1
plot record with no trees
b. List All Records
ERROR CORRECTION EXAMPLE
ORGANON ON-LINE EDITOR OPTION
[continued]
ENTER
ERR
LST
ADD
(record number)
TOPERFOIRM
ERRORS to correct
LIST all records
ADDarecord
EDIT (record number)
You can, at any time, get a current listing
of all tree records in the stand by using
the LST option. This listing displays
plots with no trees, as well as all the
Records
'**'
for
a speflagged for deletion display
cies code.
records flagged for deletion.
[<CR>to END]
CORRECT--->
ERROR CORRECTION EXAMPLE
ORGANON ON-LINE EDITOR OPTION
a. Errors to Correct
You must correct all fatal errors before
the model can operate. When ORGANON
reads data, errors are tagged for later detection. Entering 'ERR' during an on-line
editing session lists all remaining record
errors to correct.
ERROR CORRECTION EXAMPLE
ORGANON ON-LINE EDITOR OPTION
20 RECORDS CURRENTLY IN FILE PL0T278
CONSISTING OF:
19 original tree records
original plot with no trees
1
0 added tree records
0 added plots with no trees
0 records flagged for deletion
0 tree records
0 plot records with no trees
20 records remaining after deletion
19 tree records
plot record with no trees
1
TO PERFORM
ERRORS to correct
LIST all records
ADDa record
EDIT (record number)
<CR> to END
CORRECT --->ERR
ENTER
ERR
LST
ADD
(record number)
Tree# 2
DBH =0
Tree# 15
illegal tree height
Tree# 16
bad species code
<CR> to continue...
10
20 RECORDS CURRENTLY IN FILE PL0T278
CONSISTING OF:
ENTER
ERR
LST
ADD
(record number)
TO PERFORM
ERRORS to correct
LIST all records
ADDa record
EDIT (record number)
[.<CR>to END]
CORRECT --->LST
height crown exp radgro user
tree species
code
ratio factor
dbh
point
11
1
2j
3I
41
5
1
6
1
7
1
8
1
1
1
9
2
2
10
2
11
2
2
12
13
I
14 J
7.8 43.3
DF
.0 45.9
DF
DF
9.0 40.2
.0
DF 11.1
4.9 35.6
OF
DF 3.3 21.9
DF 3.0 19.8
DF 10.4 45.0
DF 9.8 46.6
OF 11.6 58.3
DF 4.1 31.2
DF 7.6 43.6
2 DF
2
2
15 I
16 3
17
3
18
3
4
19
201 5
OF
OF
DF
DF
DF
.73
.94
.89
.99
.98
.86
.85
.88
.91
.95
.89
.92
.92
.73
.87
.92
.95
.98
.95
.00
.00
.00
.00
0
.00
.00
0
.00
.00
.00
.00
.00
.00
.00
.00
.00
.00
.00
.00
.00
.00
.00
.00
.00
.00
.00
.00
.00
.00
.00
.00
.00
.00
.00
.00
.00
.00
.00
.00
0
0
30.4
35.3
4.5
.2
6.3 36.7
3.6 20.2
3.9 22.5
30.7
5.1
PLOT WITH NO TREES
4.4
4.6
<CR> to continue...
0
0
0
0
0
0
0
0
0
0
0
0
0
0
0
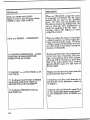
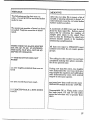
c. Modify a Record
To modify any variable of a tree, or to delete a tree entirely, first enter the tree
record number. This tree number is the
record number assigned during data file
input. You can also obtain this number
by selecting the LST option above and
listing the file on the screen. This number is useful only for editing purposes.
After you select a record number, ORGANON displays all variables of that record.
All modifications to tree variables made
during on-line editing are saved only in
the '.INP' file. The original raw data file
remains unchanged. Strongly Recom-
mended and Optional tree variables that
were not entered appear as 0 during online editing. These zero values do not
need to be corrected as the DATA COMPLETION routine calculates and fills in
the missing values. Errors in the Strongly Recommended and Optional variables,
however, must be corrected as these values are used to calculate calibration factors in the DATA COMPLETION routine.
Select a variable for modification by en-
tering the variable's number (a value
from 1 to 8). ORGANON prompts you for
the new value for that variable. All data
checks made during initial data input are
repeated as each new variable value is entered. After the new value for a tree
record is accepted, all tree variables are
again displayed, as are any changes
made.
If an entire tree record is to be deleted,
select its tree number when prompted.
After all the tree variables are displayed,
select option
9--DELETE/UNDELETE
RECORD. The tree remains in the list,
but is flagged for deletion after you leave
the editor. You can also delete a plot with
no trees in this manner. Option 9 is also
useful to remove the deletion flag in order
to restore a tree to the tree list.
ERROR CORRECTION EXAMPLE
ORGANON ON-LINE EDITOR OPTION
20 RECORDS CURRENTLY IN FILE PL0T278
CONSISTING OF:
19 original tree records
1
original plot with no trees
O
added tree records
o
added plots with no trees
0 records flagged for deletion
o tree records
0 plot records with no trees
20 records remaining after deletion
19 tree records
1
plot record with no trees
ENTER
ERR
LST
TO PERFORM
ERRORS to correct
LIST all records
ADD
ADDa record
(record number)
EDIT (record number)
[<CR> to END)
CORRECT --->2
rree#
2
1)
POINT:
2)
3)
4)
5)
6)
7)
8)
9)
SPECIES:
1
DF
.0
DIAMETER:
HEIGHT:
CROWN RATIO:
EXPANSION:
RADIAL GROWTH:
45.9
.94
.00
.00
USER CODE:
0
DELETE/UNDELETE
[
<CR> to END j
ITEM # TO CORRECT --->3
Enter (decimal) variable value ---> 11.1
1)
2)
3)
4)
5)
6)
7)
8)
9)
POINT:
SPECIES:
DIAMETER:
HEIGHT:
CROWN RATIO:
EXPANSION:
RADIAL GROWTH:
USERCODE:
1
OF
11.1
45.9
.94
.00
.00
0
DELETE/UNDELETE
[<CR> to END
I
ITEM # TO CORRECT ---> <CR>
(continued)
11
ERROR CORRECTION EXAMPLE
ERROR CORRECTION EXAMPLE (continued)
ORGANON ON-LINE EDITOR OPTION
ORGANON ON-LINE EDITOR OPTION
20 RECORDS CURRENTLY IN FILE 'PL0T278'
CONSISTING OF:
19 original tree records
original plot with no trees
1
0 added tree records
added plots with no trees
O
0 records flagged for deletion
0 tree records
0 plot records with no trees
20 records remaining after deletion
19 tree records
plot record with no trees
1
ENTER
ERR
LST
ADD
(record number)
TO PERFORM
ERRORS to correct
LIST all records
ADD a record
EDIT (record number)
20 RECORDS CURRENTLY IN FILE 'PL0T278'
CONSISTING OF:
19 original tree records
original plot with no trees
1
0 added tree records
added plots with no trees
0
1 record flagged for deletion
0 tree records
plot records with no trees
1
19 records remaining after deletion
19 tree records
0 plot records with no trees
ENTER
ERR
LST
ADD
(record number)
CORRECT --->ADD
CORRECT --->20
2)
3)
4)
5)
6)
7)
8)
9)
POINT:
SPECIES:
DiAMETER:
HEIGHT:
CROWN RATIO:
EXPANSION:
RADIAL GROWTH:
USER CODE:
5
.0
.0
.00
.00
.00
0
DELETEJUNDELETE
[<CR>to END]
ITEM#TOCORRECT--->9
Record # 20 flagged for deletion...
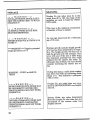
d. Add a Record
The ADD option allows you to add new
records to the tree list. A 'null' record is
displayed on the screen and each variable
of the record is subsequently modified to
describe the tree added. You can add a
plot with no trees to the tree list by specifying ADD, designating a plot number,
and leaving the remaining variables zero.
12
ERRORS to correct
LIST all records
ADD a record
EDIT (record number)
[<CR>to ENDI
[<CR> to END]
1)
FTO PERFORM
1)
POINT:
2)
3)
SPECIES:
DIAMETER:
HEIGHT:
CROWN RATIO:
EXPANSION:
RADIAL GROWTH:
USER CODE:
4)
5)
6)
7)
8)
9)
0
.0
.0
.00
.00
.00
0
DELETE/UNDELETE
[<CR>to END]
ITEM#TOCORRECT---> 1
Enter variable value for item 1) 8
(continue entering variables for new tree)
(continued)
ERROR CORRECTION EXAMPLE
ORGANON ON-LINE EDITOR OPTION
21 RECORDS CURRENTLY IN FILE PL0T278
CONSISTING OF:
19 original tree records
1
original plot with no trees
I added tree records
O
added plots with no trees
2 records flagged for deletion
I tree records
1
plot records with no trees
19 records remaining after deletion
19 tree records
o
plot records with no trees
ENTER
ERR
LST
ADD
(record number)
TO PERFORM
ERRORS to correct
LIST all records
ADDa record
EDIT (record number)
I<CR>to END]
the entered site index. Guidelines for
measuring site index can be found in
Hann and Scrivani (1987).
SITE INDEXES EXAMPLE
Douglas Fir (total height) site index? ->109.4
Ponderosa Pine (total height) site index? ->102.9
b. Even/Uneven Age Stand
You may enter the sample stand as an
even- or uneven-aged stand.
SITE INDEXES EXAMPLE
Even-age Stand? (Y) ---> <CR>
(continued)
NOTE: To continue to follow the examples
shown in this manual using test file PL0T276,
perform the following corrections.
Record #15 - change height to 5.2
Record #16 - make species code 202 (DF)
Record #21 - delete added plot 8 record
ERROR CORRECTION EXAMPLE (continued)
CORRECT--->cCR>
4 points determined for TEST PL0T278
<CR> to continue
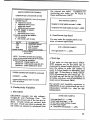
c. Stand Age
If you enter an even-age stand, ORGANON prompts you for the stand age as
measured by breast height diameter. You
have the option to enter the number of
years to breast height to determine total
stand age. If this entry is blank, ORGANON determines the total stand age. Total stand age will be the age displayed in
all tables and plots, and in calculations of
mean annual increment (MAI).
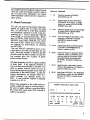
The growth and mortality equations in
3. Productivity Variables
a. Site Indexes
ORGANON requests two site indexes-Douglas-fir and Ponderosa Pine. You
must enter at least one of the two site indexes. If both values are entered, both
are used. If only one value is entered, the
site index not entered is calculated from
ORGANON do not utilize stand age as an
independent variable (i.e., they are age
independent).
STAND AGE EXAMPLE
Even-age Stand? (Y) ---> <CR>
Breast height stand age? ---> 28
Do you want to enter number of years
to reach breast height?
(N ORGANON will calculate) ---> <CR>
13
4. Data Completion
a. Expansion Factor
ORGANON allows very flexible calculation of expansion factors from a wide variety of sample systems.
Three methods for defining an expansion
factor are available:
1.
2.
3.
describe expansion
use default expansion file
create default expansion file.
EXAMPLE OF EXPANSION FACTOR
INPUT METHOD
[EXPANSION DEFAULT SELECTION]
1 - Describe Expansion
2 Use Default Expansion file ORGANON.EXP'
3- Create ORGANON.EXP
[<CR> Describe Expansion]
INPUT--->
priate expansion factor formula for that
subsample. To set these diameter limits
for nested subplots, ORGANON prompts
you to list the lower diameter limit for
each subplot.
DESCRIBE EXPANSION FACTOR EXAMPLE
Expansion factor calculation for afi trees
Did you use nested subsamples? ---> V
Enter the number of subsamples ---> 3
START WITH SMALLEST DIAMETER
SUBSAMPLE
SUBSAMPLE 1:
Fixed radius/area (ie. sq ft)-- F
Variable radius (ie. point)---- V
(enterForV)--->F
Fixed area plot determined by...
1. Square Feet
2. Fractional Acres (X as in 1/X)
ENTER 1,20R3--->3
Enter value ---> 7.78
1. Describe Expansion
With this input method, ORGANON
prompts you to describe the sample unit.
A sample unit is composed of one or more
sub-sample units at a single location and
with a common center. These subsamples
are called "nested subsamples." ORGA-
NON allows a maximum of five nested
subsamples per sample unit.
You can label fixed area subsample values by the square foot size, by the fractional amount of an acre, or by the radius
of a circular plot.
You can label a variable radius plotlpoint
subsample by its basal area factor.
When you select nested subsamples, the
diameter of each tree determines the subsample into which it lies and the appro14
SUBSAMPLE 2:
Fixed radius/area (ie. sq ft)-- F
Variable radius (ie. point)---- V
(enter ForV)---> F
Fixed area plot determined by...
1. Square Feet
2. Fractional Acres (X as in 1/X)
3. Radius
ENTER 1,20R3--->3
Enter value ---> 15.56
SUBSAMPLE 3:
Fixed radius/area (ie. sq tt)-- F
Variable radius (ie. point)---- V
(enter ForV)--->V
Enter basal area factor in sq. ft. (BAF)--> 20
(continued)
default description is unacceptable, you
must select another sampling input method.
EXPANSION FACTORS FOR FILE: PLOT278
SUBSAMPLE 1:
Fixed -- PLOT RADIUS (FT) =
SUBSAMPLE 2:
Fixed -- PLOT RADIUS (FT) =
SUBSAMPLE 3:
Variable radius - 20. BAF
7.78
15.56
Would you like to re-enter? (N) ---> <CR>
Upper and lower limits must be assigned to
the 3 subsamples.
Enter limits and adjustment will be made as follows:
0 4 8 12 (4 subsarnples) results in:
1) 0.0 < DBH <= 4.0" (SUBSAMPLE 1)
2)4.0 < DBH <= 8.0" (SUBSAMPLE 2)
3) 8.0< DBH <= 12.0" (SUBSAMPLE 3)
4) DBH> 12.0"
(SUBSAMPLE 4)
Enter limits for subsamples ---> 04 8
LIMITS HAVE BEEN SET AS FOLLOWS:
1) .0 < DBH <= 4.0" (SUBSAMPLE 1)
2) 4.0 < DBH <= 8.0" (SUBSAMPLE 2)
3) DBH > 8.0"
(SUBSAMPLE 3)
Would you like to re-enter? (N) ---> <CR>
***please wait
expansion factors
are being calculated
2.
Use Default Expansion File
A default expansion file, ORGANON.EXP,
which describes a commonly used sam-
pling method, can provide answers to all
of ORGANON's prompts as described in
input method 1.
When you select the default expansion file
as the input method, ORGANON displays
the file and prompts you to verify acceptance of the sampling description. If the
USE DEFAULT EXPANSION FILE EXAMPLE
E EXPANSION DEFAULT SELECTION]
Describe Expansion
2 Use Default Expansion file 'ORGANON.EXP
3- Create 'ORGANON.EXP'
[<CR> = Describe Expansion]
1
INPUT--->2
EXPANSION FACTORS FOR FILE: PL0T278
SUBSAMPLE 1:
Fixed -- PLOT RADIUS (FT) =
SUBSAMPLE 2:
Fixed-- PLOT RADIUS (Fl)
7.78
15.56
SUBSAMPLE 3:
Variable radius - 20.0 BAF
LIMITS HAVE BEEN SET AS FOLLOWS:
1) .0 < DBH <= 4.0" (SUBSAMPLE 1)
2) 4.0 < DBH <= 8.0" (SUBSAMPLE 2)
3) DBH > 8.0"
(SUBSAMPLE 3)
Reject these defaults? (N) ---> <CR>
***please wait --- expansion factors
are being calculated
3. Create Default Expansion File
In order to avoid repetition when a sampling unit description is used frequently,
ORGANON can create a default ifie contaming that description. The file is created responding to prompts as previously
described in input method 1. Thereafter,
the default file can be used to "answer"
prompts by selecting input method 2.
b. Height and Height Calibration
ORGANON makes two passes through
the input data file to determine height calibration values and to generate missing
15
heights. The first pass through the data
predicts heights for all trees in the stand
having measured heights. ORGANON
uses this predicted height along with the
measured height to determine a calibration value by species, using weighted, sim-
pie linear regression through the origin.
If the calibration value for a species is not
significantly different (p=O.99) from 1.0,
the calibration value is set to 1.0. If the
calibration value is determined to be
greater than 2.0 or less than 0.5, the cali-
bration value for that species is set to 2.0
or 0.5 respectively. A calibration value of
1.4 (or .85) signifies that the sample
heights were on the average 1.4 times (or
.85 times) the height determined by the
heightidiameter equations developed for
ORGANON. These calibration values are
used during prediction of missing heights
for all species and during height growth
for minor species. You can specify the use
of these values during growth before each
ORGANON run (see RUN DEFAULTS).
HEIGHT AND HEIGHT CALIBRATION EXAMPLE
please wait - determining height calibration value
HT's
entered
DOUGLAS FIR ht generation calibration value
GRAND/WHITE FIR ht generation calibration value
PONDEROSA PINE ht generation calibration value
SUGAR PINE ht generation calibration value
INCENSE CEDAR ht generation calibration value
WESTERN HEMLOCK ht generation/growth calibration value
MADRONE ht generation/gwth calibration value
CHINKAPIN ht generation/growth calibration value
TANOAI< ht generation/growth calibration value
CANYON LIVE OAK ht generation/growth calibration value
BIG LEAF MAPLE ht generation/growth calibration value
WHITE OAK ht generation/growth calibration value
BLACK OAK ht generation/growth calibration value
please wait --- missing heights are being calculated
1 tree height predicted from 18 entered heights
<CR> to continue
16
.70
= 1.00
= 1.00
= 1.00
1.00
= 1.00
= 1.00
= 1.00
= 1.00
= 1.00
= 1.00
= 1.00
= 1.00
4,
(18)
(0)
(0)
(0)
(0)
(0)
(0
(0
(0)
(0)
(0)
(0)
(0)
c. Crown Ratio and Crown Ratio
Calibration
ORGANON makes two passes through
the input data file to determine crown ratio calibration and to generate missing
crown ratios. The first pass through the
data calculates crown ratios for all trees
in the stand having measured crown ra-
tios.
that species is set to 2.0 or 0.5, respectively. A calibration value of 1.4 (or .85) signifies that the sample crown ratios were on
the average 1.4 times (or .85 times) the
crown ratios determined by the height-tocrown base equations developed for OR-
GANON. ORGANON uses this value
predict the missing crown ratios. During
missing crown ratio calculations, height-
ORGANON uses this predicted
crown ratio along with the measured
to-crown base is calculated. If it is greater
crown ratio to determine a calibration value by species, using weighted, simple line-
crown base is set to 95% of the height. If
the calibrated height-to-crown base is less
ar regression through the origin. If the
value for a species is not significantly different (p=O.99) from 1.0, the calibration
value is set to 1.0. If the calibration value
is determined to be greater than 2.0 or
less than 0.5, the calibration value for
than 95% of the height, the height-tothan 0, the calibrated height-to-crown
base is set to 0. During crown change, if
the crown ratio is less than 0.5%, it is set
to 0.5%. The use of these values during
growth can be specified before each ORGANON run (see RUN DEFAULTS).
CROWN RATIO CALIBRATION EXAMPLE
please wait determining crown ratio calibration value
C Rs
entered
1
DOUGLAS FIR crown ratio calibration value =
GRAND/WHITE FIR crown ratio calibration value
PONDEROSA PINE crown ratio calibration value =
SUGAR PINE crown ratio calibration value =
INCENSE CEDAR crown ratio calibration value =
WESTERN HEMLOCK crown ratio calIbration value =
MADRONE crown ratio calibration value =
CHINKAPIN crown ratio calibration value =
TANOAI< crown ratio calibration value =
CANYON LIVE OAK crown ratio calibration value =
BIG LEAF MAPLE crown ratio calibration value =
WHITE OAK crown ratio calibration value =
BLACK OAK crown ratio calibration value
1.23
1.00
1.00
1.00
1.00
(19)
1.00
(0)
1.00
1.00
1.00
1.00
1.00
1.00
1.00
(0)
(0)
(0)
(0)
(0)
(0)
(0)
(0)
(0)
(0)
(0)
please wait - missing crown ratios are being calculated
0 crown ratios predicted from 19 entered crown ratios
<CR> to continue
17
value is set to 1.0. If the calibration value
d. Diameter Calibration
If you enter radial growth values, the diameter calibration values are determined
by species using weighted, simple linear
regression through the origin. The stand
is back-dated and then grown in order to
compare actual diameter growth with predicted diameter growth. No missing radial growths are predicted. If the calibration value for a species is not significantly
different (p=0.99) from 1.0, the calibration
is determined to be greater than 2.0 or
less than 0.5, the calibration value for
that species is set to 2.0 or 0.5, respectively. A calibration value of 1.4 (or .85) signi-
fies that the radial growths were on the
average 1.4 times (or .85 times) the radial
growths determined by the equations developed for ORGANON. You can specify
the use of these values to adjust diameter
growth predictions before each ORGANON run (see RUN DEFAULTS).
DIAMETER CALIBRATION EXAMPLE
please wait - determining diameter calibration value
RADGRO's
entered
4,
DOUGLAS FIR diameter growth calibration
GRAND/WHITE FIR diameter growth calibration =
PONDEROSA PINE diameter growth calibration =
SUGAR PINE diameter growth calibration =
INCENSE CEDAR diameter growth calibration
WESTERN HEMLOCK diameter growth calibration
MADRONE diameter growth calibration =
CHINKAPIN diameter growth calibration =
TANOAK diameter growth calibration
CANYON LIVE OAK diameter growth calibration
BIG LEAF MAPLE diameter growth calibration =
WHITE OAK diameter growth calibration =
BLACK OAK diameter growth calibration
1.00
1.00
1.00
1.00
1.00
1.00
1.00
1.00
1.00
1.00
1.00
1.00
1.00
(
(
(
(
(
(
(
(
(
(
(
(
(
0)
0)
0)
0)
0)
0)
0)
0)
0)
0)
0)
0)
0)
<CR> to continue
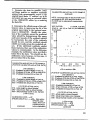
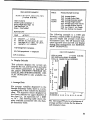
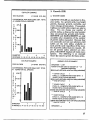
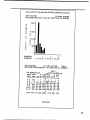
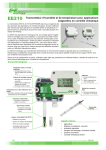
e. Calibration and Actual Data Plots
After height, height-to-crown base, and di-
ameter calibrations are made, plots are
available for the calibrated variables listed
above. These plots show predicted minus
actual values (i.e., residuals) on the Y-axis,
and predicted values on the X-axis for
height, height-to-crown base and diameter
growth.
These plots are available both
with and without the calibration ratios incorporated in the prediction. In addition,
plots are also available showing actual
height or crown ratio on the Y-axis and ac-
tual diameter on the X-axis. The plots
that are available depend on the data entered (i.e., no plots with calibration are
available if the calibration value is equal
to 1.0). Output for these plots only goes to
the screen. For hard copy output, use the
appropriate DOS command. You may request these plots any number of times
with different species. The digit actually
plotted represents the number of input
trees that fall into the range represented
by that cell. The plots of calibrated and
uncalibrated residuals over predicted values can be used to:
Examine the data for possible "outliers"(large positive or negative residuals)
arising from measurement errors in the
original input data. If "outliers' are to be
corrected, you can use an external editor
or the ORGANON editor by re-entering
the data file.
1.
2. Determine the effectiveness of the cali-
bration value in improving the fit of the
original input data to the regional equations in ORGANON. Ideally, the variation of the residuals across the predicted
value should be homogeneous (the upper
and lower bounds of the residuals should
be horizontal), the sum of the residuals
should be zero, and the residuals should
exhibit no trends across the predicted values. If the calibrated residuals exhibit
these features, then use of the calibration
values is recommended. In the following
example, the calibration value provided a
better fit to the data. You should use the
calibration value because, in this case, it
gives a better fit to the data.
TEST PL0T278
[11-24-88 8:35 AM]
(Pred. Ht. Act. Ht.} vs Pred. Ht. (No Calibration)
for
P
A
E
0
L
E
S
S
A
C
T
U
A
L
CALIBRATION AND ACTUAL PLOTS EXAMPLE
[PLOTS OF CALIBRATION AND ACTUAL DATA)
[No CaUbration)
HT (Predicted Ht-Actual Height) vs Pred. Ht.
CR (Predicted HTCB-Act. HTCB) vs Pred.HTCB
DG (Predicted DG-Actual DG) vs Pred. DG
[With Calibration]
HTC (Predicted Ht-Actual Height) vs Pred. Ht.
CRC - (Predicted HTCB-Act. HTCB) vsPred.HTCB
DGC - (Predicted DG-Actual DG) vs Pred. DG
[PLOTS OF ACTUAL DATA)
HTD Actual Height vs Actual Diameter
CRD Actual Crown Ratio vs Actual Diameter
DGD Actual Diameter Growth vs Act. Diameter
[<CR> to End I
CALIBRATION PLOTS --> MT
SPECIES GROUP (AL) ---> <CR> (See section
SPECIES under
TABLE AND PLOT
PARAMETERS for
(continued)
further explanation)
3.4
24.2
40.9
57.6
PREDICTED HEIGHT
78.5
<CR> to continue <CR>
[PLOTS OF CALIBRATION AND ACTUAL DATA]'
[No Calibration]
HT - (Predicted Ht.-ActuaI HI.) vs Pred. Height
CB - (Predicted HTCB-Act HTCB) vs Pred. HTCB
DG - (Predicted DG-Actual DG) vs Pred. DG
[With Calibration)
HTC - (Predicted HI-Actual Ht) vs Pred. Ht.
CBC - (Pred. HTCB-Act. HTCB) vs Pred. HTCB
DGC - (Predicted DG-Actual DG) vs Pred. DG
[PLOTS OF ACTUAL DATA]
HTD Actual Height vs Actual Diameter
CRD - Actual Crown Ratio vs Act. Diameter
OGO - Actual Diameter Growth vs Act. Diameter
<CR> to End I
CALIBRATION PLOTS ---> HTC
SPECIES GROUP (AL) ---> <CR,
(continued)
19
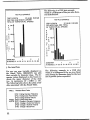
CALIBRATION AND ACTUAL PLOTS EXAMPLE
(continued)
[11-24-88 8:35 AM]
TEST PL0T278
{Pred. Ht. - Actual Ht.} vs. Pred. Ht. (With
Calibra ion) for all species
30.2
P
R
CALIBRATION AND ACTUAL PLOTS EXAMPLE
[PLOTS OF CALIBRATION AND ACTUAL DATA]
[No Calibration]
HT -(Predicted Ht-Actual Ht) vs Fred. Height
CB -(Predicted HTCB-Act HTCB) vs Pred. HTCB
DG -(Predicted DG-Actual DG) vs Pred. DG
[With Calibration]
E
D
19.4
HTC -(Predicted Ht-Actual Ht) vsPred. Height
CBC -(Predicted HTCB-Act HTCB) vsPred.HTCB
[PLOTS OF ACTUAL DATA]
S 10.9
HTD Actual Height vs Actual Diameter
CRD - Actual Crown Ratio vs Act Diameter
DGD - Actual Diameter Growth vs Act Diameter
<CR> to End
L
E
5
A
C
2.3
T
2
1--11-1 -------------- 12
U
A
CALIBRATION PLOTS ---> <CR>
completed tree data is being written to file:
PL0T278.INP
1
3
L
-8.4
3.4
24.2
40.9
57.6
78.5
PREDICTED HEIGHT
.INP Files
After all requested plots are displayed,
press the carriage return to erase the plot
After ORGANON reads the raw data file,
menu display. ORGANON writes the corrected, completed data file to an '.INP' file
(see .INP' FILES)
the completed stand description file is
makes data corrections, and computes
data completion and productivity values,
saved and written to the same drive from
which ORGANON read the original raw
data file. The data file name is the origi-
nal data file name (the root file name),
with a 3-letter suffix or file name extension of '.INP'. This file cannot be read or
altered, because it is represented in a binary format.
20
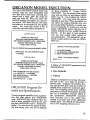
ORGANON MODEL EXEUTI
The main ORGANON module loads into
memory after you have designated that
raw data file(s) have been correctly processed and a valid .INP' file exists for
each raw data file. When the main ORGANON module has loaded, you must select which '.INP' data files you will enter
and allow to be processed by the growth
model. You must also choose a file to
write the requested tables and plots to.
for these variables (3 - Create 'ORGA-
NON.DEF'). You can assign these values
once and use them on any future ORGANON runs (2 - Use Default file 'ORGANON.DEF'). You may select the system
defaults at any time. When prompted, select either the system defaults, your own
previously defined defaults, or create your
own new defaults. To create your own defaults, ORGANON starts with the set of
cvsthm t1ifrni1ts md vrni mn'1ifv thst
Growth and Yield Project
Southwest Oregon Mixed Conifer Forests
SW OREGON VERSION, ED2.O - #SWO-0000
Copyright 1988 College of Forestry
Oregon State University
run, you may modify either system or
user parameters. The parameter set selected remains active for only one ORGANON run.
[DEFAULT INPUT SELECTION]
Has your data file been previously edited?(Y)<CR,
1
[Please wait.. .the main ORGANON model
is loading]
1IcYI1.11
s
Use System Defaults
2 Use Default file ORGANON.DEF'
3- Create 'ORGANON.DEF
[<CR>
Use System Defaults]
INPUT--->1
Growth and Yield Project
Southwest Oregon Mixed Conifer Forests
SW OREGON VERSION, ED2.O - #SWO-0000
Copyright 1988 College of Forestry
Oregon State University
Enter tree data file name [NO extension
(i.e. A:MYFILE) 1---> PL0T278
Enter output file name ---> 0UT278
FILE '0UT278' EXISTSI
OVERWRITE? (Y) ---> <CR>
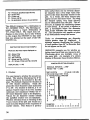
A listing of ORGANON parameters and
defaults follows.
1. Run Defaults
a. Tripling
Tripling is designed to increase the sam-
ple size of the tree data set during a
ORGANON Program Defaults and Specifications
Twenty program variables form a param-
eter list that affects how ORGANON
runs. ORGANON has a default value for
each of these variables which can be used
any time ORGANON runs (1- System Defaults). You also have the option of defining and saving your own set of defaults
growth cycle. Tripling will continue during each growth cycle until the number of
sample trees reaches the maximum specified. Use of tripling causes more realistic
projections of stand development through
the use of stochastic elements added to
the predictions. ORGANON execution
time increases due to the added time
needed to process each of the additional
sample trees. The default for this parameter is 'NO' (tripling will not occur).
21
b. Maximum Tree Samples
e. Height-to-Crown Base Calibration
When you select tripling, there must be a
limit on the number of sample trees that
When a data file is initially entered into
are generated from the input tree file.
tions are calculated for each of the spe-
You can set this value anywhere between
a minimum of 500 trees to a maximum of
2000 trees. The greater the number of
trees, however, the longer the model execution time. The default value is 500
trees. Because of the tripling process
used, the actual number of sample trees
cies. If you choose 'YES' for this parameter, the height-to-crown base calibration
ratios modify the equations for predicting
change in height-to-crown base. If the
calibrations were determined from actual
tree measurement inputs, the growth
models are calibrated for the specific
than the specified maximum.
'YES (use calibrations).
c. Menu Display
f. Diameter Growth Calibration
To assist you when running ORGANON,
the model provides user friendly menus.
After several runs, these menus may no
longer be necessary and may slow more
experienced users. You can eliminate
these menu displays by selecting 'NO' on
the menu display. Even with the menus
off, a brief prompt (i.e., MANAGE --->)
displays to indicate the type of input requested. If you are still uncertain about
When a data file is initially entered into
resulting from tripling is probably less
input choices, enter 'HELP or '?' -ORGANON will display the full menu.
Execution time is slightly quicker when
ORGANON, height-to-crown base calibra-
stand. The default for this parameter is
ORGANON, diameter growth calibrations
are calculated for each of the species. If
you choose 'YES' for this parameter, the
diameter growth calibration ratios modify
the equations for use in diameter growth
predictions. If the calibrations were determined from actual tree measurement
inputs, the growth models will be calibrated for the specific stand. The system
default for this parameter is 'YES' (use
calibrations).
full menus are not displayed on the
g. Limit on Maximal Basal Area
'YES' (display menus).
d. Height Calibration
ORGANON has a mortality factor that is
applied during each growth cycle. Additional mortality can be placed on a stand
When a data file is initially entered into
maximum relative density, based on num-
screen. The default for this parameter is
by using a self-thinning approach to a
ORGANON, height calibrations are calcu-
lated for each species.
If you choose
'YES', the height calibration ratios modify
bers of trees and quadratic mean diame-
ter. The default for this parameter is
'YES' (use limit on maximum basal area).
the equations for use in growth predictions for hardwoods and Western Hemlock. If the calibrations were determined
11..
from actual tree measurement inputs, the
growth models are calibrated for the specific stand. The default for this parameter is 'YES' (use calibrations).
volume by species for each five-year
22
Yield Tables
Yield tables display the stand's trees per
acre, basalarea, cubic foot and scribner
growth cycle. If you choose this parame-
ter, this table is automatically calculated
and then routed to the output file during
each growth cycle. If yield tables are not
requested, the same information may be
requested when needed by manually requesting a STOCK TABLE in RESIDUAL
or CUT REPORTS. The default for this
parameter is 'YES' (automatically output
the yield table report).
i. Mortality Table
If you choose 'YES', ORGANON provides
a Mortality Table report after any growth
cycle(s). The table displays the mortality
rate in trees/acre, basal area, cubic foot
and scribner volume that occurred during
the last total growth period (one or more
cycles) for each diameter class. The default for this parameter is 'NO' (the Mortality Table is not displayed).
j. Printer Form Feed
This parameter determines whether there
is a form feed (new page) in the output
ifie prior to each report requested. If you
do not choose printer form feed, each report may not necessarily start at the top
of a new page when printed on the line
printer. The default is 'YES' (provide a
new page before each report).
k. Graphics Printer
This parameter designates whether the
printer used for listing tables and plots
can print the IBM extended graphics
character set. Selecting 'YES' causes the
printer to display the same characters as
displayed on the screen. Selecting 'NO'
substitutes the extended graphics characters with other printable characters. If
you are unsure of your printer's capabilities, select 'YES' first. If the printout
does not look like the screen display, select the default setting 'NO'. The default
is 'YES' (display IBM extended graphics
character set).
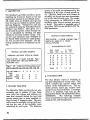
1. Volume Equations
Board Foot volumes are determined by selecting a minimum log top diameter, trim
allowance, stump height, log length, and
minimum log length. Cubic Foot volumes
are determined by designating a conifer
top diameter, hardwood top diameter and
conifer stump height. (See listings 2 and
3 below for definitions). Values of this paraineter can be 'OSU' or 'BLM'. The default setting is 'OSU' (use the OSU voltime equations).
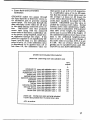
Selecting the OSU volume equations initializes board foot and cubic foot parameters with the following values:
BOARD FOOT
Mm. log top diameter:
Trim allowance:
Stump height:
Log length:
Mm. log length:
6 inches
8 inches
0.5 feet
32 feet
8 feet
CUBIC FOOT
Conifer top diameter:
0 inches
Hardwood top diameter: 0 inches
Conifer stump height:
0 inches
If you select the OSU volume equations,
each of these parameters is displayed and
may be redefined.
If you select the BLM volume equations,
the following values are used in calculations and cannot be redefined.
BOARD FOOT
Mm. log top diameter:
5 inches
if DBH <= 15 inches
Variable
(5.0+(0. 1837)(DBH-15.0))
if DBH> 15 inches
Trim allowance:
Stump height:
Log length:
Minimum log length:
0.3 feet
1.5 feet
16 feet
4.1 feet
23
CUBIC FOOT
5 inches
Conifer top diameter:
if DBH <= 15 inches
Variable
(5.O+(O. 1837)(DBH-15.0))
if DBH> 15 inches
Hardwood top diameter: 5 inches
if DBH <= 15 inches
Variable
(5.O+(O. 1837)(DBH-15.0))
if DBH> 15 inches
1.5 feet
Conifer stump height:
2. Board Foot Defaults
a. Minimum Board Foot Log
Top Diameter
This parameter specifies the top inside
tions, you can choose any log length.
e. Board Foot Minimum Log Length
This parameter specifies the minimum
log length acceptable in feet to be used
during board foot calculations of volumes
for tables and plots. If you select the
OSU volume equations, you can choose
any minimum log length.
3. Cubic Foot Defaults
a. Cubic Foot Conifer Top Diameter
This parameter specifies the top inside
bark diameter in inches for conifers to be
used during cubic foot calculations of volumes for tables and plots. If you select
the OSU volume equations, you can
bark diameter in inches to be used during
board foot calculations of volumes for tables and plots. If you select the OSU volume equations, you can choose any minimum top diameter.
choose any value of cubic foot top diameter between 0 and 6 inches.
b. Board Foot Trim Allowance
This parameter specifies the top inside
This parameter specifies the amount of
log-end trim in inches to be used during
board foot calculations of volumes for tables and plots. If you select the OSU volunie equations, you can choose any top diameter.
c. Board Foot Stump Height
This specifies the stump height in feet to
be used during board foot calculations of
volumes for tables and plots. If you select
the OSU volume equations, you can
choose any stump height under 4.5 feet.
d. Board Foot Log Length
This parameter specifies the log length
desired in feet to be used during board
foot calculations of volumes for tables and
plots. If you select the OSU volume equa24
b. Cubic Foot Hardwood Top
Diameter
bark diameter in inches for hardwoods to
be used during cubic foot calculations of
volumes for tables and plots. If you select
the OSU volume equations, the only valid
responses are 0, 4 or 6 inches.
c. Cubic Foot Conifer Stump Height
This parameter specifies the stump
height in feet for conifers to be used during cubic foot calculations of volumes for
tables and plots. If you select the OSU
volume equations, you can choose any
stump height below 4.5 feet.
The following example shows the default
selection menu when you choose the system defaults, and the OSU volume equa-
tions are replaced with BLM volume
equations.
To continue following the example in this
manual, reset #11 (VOLUME EQUATIONS) to OSU. The following example
shows bow to change item nine on the default menu (PRINTER FORM FEED)
from a 'YES' to a 'NO', and item twelve
(BOARD FOOT LOG TOP DIAMETER)
from 6.0 inches to 4.0 inches.
[RUN DEFAULTS]
TRIPLING: No
DISPLAY MENUS: Yes
3.
USE HEIGHT CALIBRATION: Yes
4.
USE HTCB CALIBRATION: Yes
5. USE DIAM. GRO CALIBRATION: Yes
6.
LIMIT ON MAX. BA: Yes
7.
YIELD TABLE: Yes
8.
MORTALITY TABLE: No
9.
PRINTER FORM FEED: Yes
10.
GRAPHICS PRINTER: Yes
11.
VOLUME EQUATIONS: OSU
[BOARD FOOT DEFAULTS]
1.
2.
12.
13.
14.
15.
16.
LOG TOP DIAM:
TRIM ALLOWANCE:
STUMP HEIGHT:
6 inches
8. inches
.5 feet
LOG LENGTH: 32 feet
MIN LOG LENGTH: 8.0 feet
CUBIC FOOT DEFAULTS
17.
CONIFER TOP DIAM (0.0" - 6.0"): .0 in.
18. HARDWOOD TOP DIAM (0.0",4.0",6.0"): .0 in.
19.
CONIFER STUMP HT: .0 ft.
<CR> to end
INPUT#TOMODIFY--->11
[RUN DEFAULTS]
1.
TRIPLING: No
2.
3.
DISPLAY MENUS: Yes
USE HEIGHT CALIBRATION: Yes
4.
USE HTCB CALIBRATION: Yes
5. USE DIAM. GAO CALIBRATION: Yes
6.
LIMIT ON MAX. BA: Yes
7.
YIELD TABLE: Yes
8.
MORTALITY TABLE: No
9.
PRINTER FORM FEED: Yes
10.
GRAPHICS PRINTER: Yes
11.
VOLUME EQUATIONS: BLM
12.
MAX SAMPLE TREES: 500
[BLM VOLUME DEFAULTS]
13.
BLM MINIMUM DBH (>= 6.0"): 7.0 inches
<CR> to end
INPUT#TO MODIFY--->
DEFAULT SELECTION EXAMPLE
[RUN DEFAULTS)
TRIPLING: No
2.
DISPLAY MENUS: Yes
3.
USE HEIGHT CALIBRATION: Yes
4.
USE HTCB CALIBRATION: Yes
5. USE DIAM. GRO CALIBRATION: Yes
6.
LIMIT ON MAX. BA: Yes
7.
YIELDTABLE: Yes
8.
MORTALITY TABLE: No
9.
PRINTER FORM FEED: Yes
10.
GRAPHICS PRINTER: Yes
11.
VOLUME EQUATIONS: OSU
-[ BOARD FOOT DEFAULTS]
1.
12.
13.
14.
15.
16.
LOG TOP DIAM: 6 inches
TRIM ALLOWANCE: 8. inches
STUMP HEIGHT: .5 feet
LOG LENGTH: 32 feet
MIN LOG LENGTH: 8.0 feet
[CUBIC FOOT DEFAULTS]
17.
CONIFER TOP DIAM (0.0" - 6.0"): .0 in.
18. HARDWOOD TOP DIAM (0.0",4.0',6.0"): .0 in.
19.
CONIFER STUMP HT: .Oft.
<CR> to end ]
INPUT # TO MODIFY --->9
(continued)
NOTE: The default selection menu will not display
item #12 (MAX SAMPLE TREES) when tripling
has not been selected.
25
DEFAULT SELECTION EXAMPLE (Continued)
[RUN DEFAULTS]
TRIPLING: No
DISPLAY MENUS: Yes
2.
USE HEIGHT CALIBRATION: Yes
3.
USE HTCB CALIBRATION: Yes
4.
5. USE DIAM. GRO CALIBRATION: Yes
LIMIT ON MAX. BA: Yes
6.
YIELD TABLE: Yes
7.
MORTALITY
TABLE: No
8.
PRINTER FORM FEED: No
9.
GRAPHICS PRINTER: Yes
0.
VOLUME EQUATIONS: OSIJ
1.
[BOARD FOOT DEFAULTS I
1.
2.
3.
4.
5.
6.
LOG TOP DIAM:
TRIM ALLOWANCE:
STUMP HEIGHT:
6 inches
8. inches
.5 feet
LOG LENGTH: 32 feet
MIN LOG LENGTH: 8.0 feet
CUBIC FOOT DEFAULTS
CONIFER TOP DIAM (0.0" 6.0"): .0 in.
8. HARDWOOD TOP DIAM (0.0",4.0",6.0'): .0 in.
CONIFER STUMP HT: .0 ft.
9.
<CR> to end
7.
INPUT#TO MODIFY---> 12
Enter inches ---> 4
[RUN DEFAULTS]
TRIPLING: No
1.
DISPLAY MENUS: Yes
2.
USE HEIGHT CALIBRATION: Yes
3.
USE HTCB CALIBRATION: Yes
4.
5. USE DIAM. GRO CALIBRATION: Yes
LIMIT ON MAX. BA: Yes
6.
YIELD TABLE: Yes
7.
MORTALITY TABLE: No
8.
PRINTER FORM FEED: No
9.
GRAPHICS PRINTER: Yes
0.
1.
VOLUME EQUATIONS: OSU
[BOARD FOOT DEFAULTS]
2.
3.
4.
5.
6.
LOG TOP DIAM:
TRIM ALLOWANCE:
STUMP HEIGHT:
4 inches
8. inches
.5 feet
LOG LENGTH: 32 feet
MIN LOG LENGTH: 8.0 feet
[CUBIC FOOT DEFAULTS]
CONIFER TOP DIAM (0.0" - 6.0"): .0 in.
8. HARDWOOD TOP DIAM (0.0",4.0",6.O"): .0 in.
CONIFER STUMP HI: .0 ft.
9.
7.
[<CR> to end]
INPUT # TO MODIFY ---> <CR>
Default values are now set.
26
Execution Suggestions
The following tips will make execution of
the ORGANON model faster and simpler.
1.
In most cases, when ORGANON
prompts you for a response, a response
appears in parentheses after the
prompt. This response is ORGANONs
default response should you press a
carriage return (<CR>). The values of
the default responses (carriage returns) were selected by ORGANON's
authors as the most frequently expected responses. Running ORGANON
with default responses reduces user
keyboard entries and speeds program
execution.
2. Whenever ORGANON prompts you for
a YES or NO response, entering 'Y', 'y',
'YES', or 'yes' 'are all acceptable values
for yes. The values N', n', 'NO or 'no'
are acceptable values for no.
3. Any response may be entered in all
capital letters or all small letters. ORGANON is not case sensitive.
4. When menus are not displayed, you
may request them at anytime by entering '?' or 'HELP' when prompted.
5. When a number of reports must be
printed, ORGANON runs faster if all
report output is to a file only, or to the
screen and a file. After program execution, use the MS-DOS 'PRINT' command to print reports in the output
file. You may edit the output file with
a word processor to eliminate all but
the required reports.
6. You should send plots and tables to an
output file as well as to the screen.
The output file describes the stand
and contains all defaults and parameters associated with the stand's requested reports and tables. In addi-
tion, ORGANON's run history attached to
the end of the output file contains a list-
1. ResidualTables and Plots (RR)
growth cycles in a management scenario.
Residual Reports are available at any
time on the main menu except immediately following management. Residual
Reports display the current residual
stand statistics. Residual Reports available within the Management Menu reflect
the stand prior to any cut requests (See
ing of the management decisions and
Master Menu Options
After data are entered, edited, and
checked (including selecting defaults),
ORGANON comes under the control of
the master menu. At that point, ORGANON becomes a 'user-directed' program.
This means that a main menu is disof five program options (REPORTS,
TRIAL VS ACCEPTED MANAGEMENT). The following example shows
the reports and plots available from the
Residual Report Menu.
played and you, the user, must select one
GROWTH, MANAGEMENT, RESTART,
QUIT). After you select a run option, ORGANON processes your input and displays the main menu, prompting you to
RESIDUAL TABLES AND PLOTS EXAMPLE
[RESIDUAL TABLES AND PLOTS)
select another run option. The following
are all selections that may appear on the
main menu. Some selections are only
[Tables]
TL-Sample Tree List
SS-Sample Summary
ST-Per Acre Stand Table SK-Stocking Table
LG-Log Table
DF- Display Defaults
RH-Run History
MO-Mortality Table
available at certain points during pro-
gram execution while others are available
at all times.
[Plots]
A
MASTER MENU EXAMPLE
[MASTER MENU]
Organon
VT
GR
PE
EE
PAH - Height
PAC - Crown Ratio
PCV - CF Volume
PSV Scribner Volume
PDG - Diam Growth PHG Height Growth
PCG - CF Vol Grow. PSG Scrib.Vol. Grow.
R
P E PDF - Dia. Freq.
E
N PBA Basal Area
RD
PVC - CF Volume
PVS Scribner Vol.
RR Residual Tables and Plots
A C PFC - Dia. Freq.
GR Execute Model
(perform 5-yr growth cycle)
C H PAB- Basal Area
RG
PGC - CF Volume
PGS - Scribner Vol.
E
MT Management Scheme
(test or perform management)
AS Restart Program
[<CR>- Return to Master Menu]
RESIDUAL REPORTS --->
(begin with data input)
I
QUIT Stop Program]
ORGANON-.->
NOTE: The MO (Mortality Table) and all per acre
change reports (PFC,PAB, PGC, PAB, and PGS)
will not be available on the Residual Report Menu
until after a growth cycle.
27
a. Sample Tree List (TL)
b. Sample Summary Table (SS)
The Sample Tree List Report is a listing
of the status of the input sample trees.
The header provides the stand identification, age, total stand basal area, number
of sample trees and species group. When
displaying large sample stands, you may
request a report to display the list with a
skip factor (i.e., every other tree, every
fifth tree, etc.). This allows you to quickly
inspect very large data files.
The Sample Summary Table provides a
condensed version of the Sample Tree
List averaged by 2-inch diameter class.
This information is averaged sample data
-- NOT per acre values! The table also
displays cubic foot and scribner volume,
ORGANON displays most items from the
sample tree list in the same format as ini-
lower diameter. The following example
shows an initial Sample Summary Table.
tially entered. However, species, expansion factor and radial growth have been
transformed to a form compatible with
the growth model. ORGANON changes
input species code numbers to alpha codes
for ease of reading. ORGANON changes
expansion factors to a per acre basis (divided by number of plots/points). ORGANON changes radial growth, if entered, to
diameter growth. The following table
shows an initial Sample Tree List.
SAMPLE TREE LIST EXAMPLE
TEST PL0T278 [11-24-88 8:46 AMI
TREE LIST TOTAL 36 YRS
FOR ALL SPECIES -- SKIP1
TOTAL SAMPLE TREES = 12
TOTAL STAND BASAL AREA = 65.8
Page 1
and cubic foot and scribner volume
growth for the average tree in each diameter class. Values for each diameter class
displayed in the Sample Summary Table
include the upper diameter, but not the
SAMPLE SUMMARY TABLE EXAMPLE
111-24-88 8:46 AM]
TEST PLOT27B
INITIAL SAMPLE SUMMARY TABLE
AT 36 YEARS FOR ALL SPECIES
Page
1
TABLE GROWTH FOR THE PREVIOUS 0 YEARS
AVERAGE PER TREE
diam
dia tit
Cf cf ScribScrib
cr grow grow voigrow vol grow
class dbh
ht
o - 2"
5.2 .87 .00 .00
.2
2-4' 3.4 21.1 .91 .00 .00
.0 .0
.6 .0
1.6 .0
0.
0.
0.
4.6 32.6 .89 .00 .00
6- 8' 7.2 41.2 .86 .00 .00 4.6 .0 13.
8-10's 9.4 43.4 .90 .00 .00 7.7 .0 17.
10-12"11.0 50.9 .94 .00 .00 12.1 .0 24.
4 6"
0.
0.
0.
0.
0.
0.
* **.****** ********** * **** ***** *... **********.**** .*******
tree sp
dbh
ht
cr
exp +ht
+d
uc
c. Per Acre Stand Table (ST)
* ********.********** ***** ***** *************.***** ********
1
2
3
4
5
6
7
8
7.8 43.3 .73 14.32 .0
DF 11.1 45.9 .94 7,44 .0
DF
9.0 40.2 .89 11.32 .0
OF 11.1 54.3 .99 7.44 .0
4.9 35.6 .98 14.32 .0
DF
OF
3.3 21.9 .86 57.27 .0
DF
3.0 19.8 .85 57.27 .0
OF 10.4 45.0 .88 8.48 .0
DF
9
10
DF
11
DF
OF
12
9.8
DF 11.6
4.1
7.6
46.6 .91 9.55
58.3 .95 6.81
31.2 .89 14.32
43.6 .92 14.32
.0
.0
.0
.0
.00
.00
.00
.00
.00
.00
.00
.00
.00
.00
.00
.00
0
0
0
0
0
0
0
0
0
0
0
0
The Stand Table provides per acre values
for number of trees, basal area, cubic foot
volume, scribner volume and changes to
these values by 2-inch diameter class. If
you choose to display all species (AL), the
number of trees, basal area, and cubic
foot volume are calculated for all species.
Scribrier volume is calculated for conifer
species only. The change values reflect
movement from one class to another, mor-
tality, and growth. The following exam-
pies show an Initial Stand Table and a
Stand Table after 5 year's growth (1
growth cycle).
Wang), quadratic mean diameter, mean
height, diameter and crown ratio for all
trees greater than 45 feet in height. The
following examples show an initial Stock-
INITIAL PER ACRE STAND TABLE EXAMPLE
TEST PL0T278 [11-24-88 8:46 AM]
INITIAL PER ACRE STAND TABLE
AT 36 YEARS FOR ALL SPECIES
INITIAL RESIDUAL STOCKING TABLE EXAMPLE
class
acre
NET 0YRCHANGE:
cf Scrib trees/
Cf Scrib
ba vol vol acre ba vol vol
0-2"
57.3
.0
0.
0.
4-6" 71.6 8.4112. 0.
6 -8" 43.0 12.4 197. 571.
8 -10" 20.9 10.0 158. 357.
10 -12" 30.2 20.0 362. 701.
0.
.0
4 - 6" 271.2
6- 8"
28.6
42.9
20.8
8-10"
0-12"
2-14" 30.2
ci Scrib
acre ba vol vol
1=0-YR CHANGE =1
DF 36 451.9 65.8 970. 1
451.9 65.8 970. 1
Page 1
Stand Density Index:
157.
Relative Density Index:
.295
Quadratic Mean Diameter: 5.2
Mean Height:
25.8
Mean Diameter:
4.4
Mean Crown Ratio:
.899
NETO-YRCHANGE
ci Scrib trees!
ci Scrib
ba vol vol acre ba vol vol
.1
ci Scrib trees!
vol vol
ENDING
PL0T278
[11-24-88 8:47 AMJ
INITIAL PER ACRE STAND TABLE
AT 41 YEARS FOR ALL SPECIES
56.9
[11-24-88 8:46 AM]
********* *s*********.*********** *************t******S**i
PER ACRE STAND TABLE EXAMPLE
0-2"
2-4"
TEST PL0T278
DATA FILE: PL0T278
spec. yr acre ba
ITotals 451.9 65.8970.1628.
ENDING
A ESID UAL STOCK TABLE
at trees!
2-4" 229.1 15.0 142.
trees!
acre
year's growth (1 growth cycle).
Page 1
ENDING
diam trees/
ing Table and a Stocking Table after 5
1.
0.
-.4
.1
1.
0.
.0
0.
0. -229.6-15.0-142.
0.
493. 782. 199.6 28.2 381. 782.
117. 367. .14.4 -5.4 -80. -204.
365. 860.
22.0 8.5 207. 503.
282. 571.
-9.3 -5.6 -79.-129.
28.3 615. 1519 30.2 28.3 615.1519.
36.6
6.9
18.5
14.4
450.6 104. 1873.4099.
-1.3 39. 1903.2470.
RESIDUAL STOCKING TABLE EXAMPLE
RESIDUAL STOCK TABLE
TEST PL0T278
DATA FILE: PL0T278
at trees!
ct Scrib trees!
ci Scrib
spec. yr acre ba vol vol acre ba vol vol
ENDING
DF 41 450.6 104.9 1873 4099.
d. Stocking Table (SK)
The Stocking Table provides the same per
acre values displayed in the stand table,
only summarized by species group. Addi-
tionally, this table provides Reineke's
(1933) stand density index, Southwest
Oregon relative density index (Hann and
[11-24-88 8:46 AM]
450.6 104.9 1873 4099.
I
=0-YR CHANGE =1
-1.3 39.1 902.8 2470.
-1.3 39.1 902.8 2470.
Stand Density Index:
228.
Relative Density Index:
.429
Quadratic Mean Diameter: 56.5
Mean Height:
35.4
Mean Diameter:
5.7
Mean Crown Ratio:
.783
29
e. Log Table (LG)
The Residual Log Table provides a gross
standing log inventory based on the log
parameters selected in the default menu.
All conifer trees are divided into logs and
then the logs are tallied by species group
and top diameter. Volumes for each log
are computed using the Columbia Bureau
Scribner Log Factors. Also given are a
set of totals by species, where average volume is calculated by dividing the total
volume by the total number of logs. Values for each diameter class displayed in
the Stand Table include the upper diameter, but not the lower diameter. The following example shows a Residual Log Ta-
classes of the table are determined by the
diameters at the start of each growth cycle. Likewise, basal area and volumes in
mortality are based upon tree characteristics at the start of each cycle. The underlying assumption in ORGANON is that
mortality trees have no growth just prior
to death. This table is available only if
you select 'YES' for the MORTALITY TABLE parameter.
MORTALITY TABLE EXAMPLE
[11-24-88 8:46 AM] Page 1
TEST PL0T278
MORTALITY TABLE AT 41 YEARS
FOR ALL SPECIES
ble.
5-YEAR MORTALITY RATE
diam
class
RESIDUAL LOG TABLE EXAMPLE
trees/
acre
Cf
vol
ba
* ** 4* * ** 4*4 ** ** * **** * * *4* *****
RESIDUAL LOG TABLE (TOTAL 36 YEARS)
TEST PL0T278 [11-24-88 8:46 AM] Page 1
LOG LENGTH: 32 ft MIN LOG LENGTH: 8.0 ft
TOP DIAM: 4.0 in
0- 2"
2-4's
4-6"
6-8"
8-10"
10-12"
Top
DF
G/W Fir
Totals
Logs:
Volumes:
Avg.Vol.:
94.0
1628.2
17.3
.1
.0
.0
.0
.0
.0
.0
.0
.0
* ********* *4*4* *
.1
.0
.0
.0
1.2
.3
.3
1.4
1.8
.0
.4
.3
.4
.1
P/S Pine OtherConifer
Diam Logs Vol Logs Vol Logs Vol Logs Vol
4-& 94.0 1628.2 .0
.4
.6
.2
Scrib
vol
.0
.0
.0
.0
.0
.0
.0
.0
.0
.0
Totals
1.3
.1
.0
.0
.0
.0
g. Run History (RH)
The Run History report is available at
any time (displayed on-screen only). This
report contains the current status and
f. Mortality Table (MO)
The Mortality Table provides the per acre
mortality rate in number of trees, basal
area, cubic foot volume and scribner vol-
ume that occurred during the last total
growth period (one or more specified cycles) for each 2" diameter class. The mortality rates for multiple cycle growth peri-
ods are the sum of the mortality rates
calculated in each cycle. The diameter
30
history of the ORGANON run. This includes present stand age, current cycle
and previous stand activities. If manage-
ment is in progress, trial cuts are dis-
played (See TRIAL VS ACCEPTED MANThe following example
AGEMENT).
shows a Run History report after previous
stand growth and management.
RUN HISTORY EXAMPLE
TABLE:
RUN HISTORY AND STATUS
[11-24-88 8:46AM]
TEST PL0T278
Growth Cycles Completed: 3
Breast Height Stand Age: 43
Total Stand Age: 51
Status: TRIAL MGMT
ASSOC.
PLOTS:
Residual Sample Summary
PAH
PAC
PDG
PHG
PCV
PSV
PCG
PSV
Average Height
Average Crown Ratio
Average Diameter Growth
Average Height Growth
Average Cubic Foot Volume
Average Scribner Volume
Ave. Cubic Ft. Vol. Growth
Ave. Scribner Vol. Growth
RUN HISTORY
***** **************. **********.****.****.*. * ********* **.
YEAR
ACTIVITY
***************************************************.****
36 GROWTH ---> 1 CYCLE
41
THIN BA (AL) from above> 20 sq ft
41
41
THIN DBH (AL) 0 ">50% 75 ">50 %
GROWTH --->2 CYCLES
Trial Management in progress...
The following example is a PAH plot
showing a stand profile by plotting average tree height and average crown base
by diameter class. The 'IN' diameter mdicates ingrowth trees and will only display
during trial management (see MANAGEMENT INGROWTH).
SDI THIN proportional --> Target 200
<CR> to continue...
h. Display Defaults
This selection displays the current settings for the run, and board foot and cubic
foot default parameters as described in
the section ORGANON PROGRAM DEFAULTS AND SPECIFICATIONS. DISPLAY DEFAULTS is only available on
screen.
i. Average Plots
For average variables displayed in the
Sample Summary Table, there is a corre-
sponding plot of that variable by diameter
class. The diameter values displayed on
the X-axis indicate the upper diameter of
the class (i.e., 14 represents 12" < DBH
<= 14'). The following table shows the
plots available associated with the Sample Summary Table.
The following PSV plot is a histogram of
average scribner volume for the trees in
each diameter class.
31
The following is a PDF plot example
which is a histogram of the per acre diameter distribution.
PSV PLOT EXAMPLE
[11-24-88 8:46 AMI
TEST PL0T278
PER TREE AVG HEIGHT & CROWN
TOTAL 36 YEARS FOR ALL SPECIES
A
V
G
S 62
PC
ER
RI
B 42
T
R
EV
E 0 21
L
DIAMETER
1
2
3
IN INCHES 2 4 68 0 2 4 68 0 2 4 6 80
j. Per Acre Plots
For any per acre variable displayed on
the Stand Table, ORGANON can plot
that variable by diameter class. The diameter values displayed on the X-axis in-
dicate the upper diameter of the class
(i.e., 14 represents 12' < DBH <= 14').
The following table shows the plots available associated with the Stand Table.
TABLE:
Residual Stand Table
PDF Ending Diameter Frequency
PVC Ending Cubic Foot Volume
PVS Ending Scribner Volume
ASSOC. PBA Ending Basal Area
PLOTS: PFC Change in Diameter Frequency
PGC Change in Cubic Foot Volume
PGS Change in Scribner Volume
PAB Change in Basal Area
32
The following example is a PAB plot
which is a histogram of the per acre basal
area change by diameter class for the last
set of growth cycles requested.
PAB PLOT EXAMPLE
TEST PL0T278
[11-24-88 8:46 AM]
NET CHANGE IN BASAL AREA TOTAL
41 YEARS FOR ALL SPECIES
28.1
The selected species or species group is
fixed until you exit the REPORT menu.
The default response (<CR>) for the species code is AIJ, ALL SPECLES. The following examples show how to select reports for display of a species group (ALL
HARDWOODS), and a single species
N
(DOUGLAS FIB).
'II
EB
TA 14.1
SPECIES SELECTION EXAMPLE
Species groups: Specific Species:
AL-All Species DF-Douglas Fir
GW-Grand.'White Fir
AC-All Conifers PP-Ponderosa Pine
SP-Sugar Pine
AH-AII Hwoods IC-IncenseCedar
WH-W.Hemlock
MD-Macf rone
GC-Chinkapin
TA-Tanoak
CL-Canyon Live Oak
BL-Big Leaf Maple
WO-White Oak
U.
r.'1
GA
EC
R
I E -14.
N
.1.1
BO-Blad Oak
SPECIES OR SPECIES GROUP DESIRED (AL)> AH
-28.
DIAMETER
1
2
3
IN INCHES 24 68 0 2468 0 24 680
k. Table and Plot Parameters
1. Species
Each time you select CUT or RESIDUAL
REPORTS from the main menu, you must
also select the species or species group to
be reported. All reports (except STOCKING TABLE and YLELD TABLE which
always displays DouglasFir, Grand!
White Fir, Ponderosa Pine, Other Conifer
and Hardwoods) only display the results
for that species or species group. The species choices are listed below.
AL: All Species Lumps all species listed in sec
tion SPECIES CODE NUMBER together
SP:Specific Species - One of the specific species
listed in SPECIES CODE NUMBER
AC: All conifers Lumps all trees with species
codes less than or equal to 300 together
AH: All hardwoods - Lumps all trees with species
codes greater than 300 together
SPECIES SELECTION EXAMPLE
Species groups: Specific Species:
AL-All Species DF-Douglas Fir
GW-Grand/White Fir
AC-All Conifers PP-Ponderosa Pine
SP-Sugar Pine
AH-All H'woods
IC-IncenseCedar
WH-W.Hemlock
MD-Madrone
GC-Chinkapin
TA-Tanoak
CL-Canyon Live Oak
BL-Big Leaf Maple
WO-White Oak
BO-Black Oak
SPECIES OR SPECIES GROUP DESIRED (AL)> OF
2. Destination
When you request any reports, you must
also choose a destination for those tables
and plots. That destination holds for every plot or table requested until you exit
the report menu. When you next display
the report menu, ORGANON again re-
quests the destination for tables and
plots. Destination choices for tables and
plots can include any in the following list.
33
FO - Previously specified output fife only
SO Screen only
P0 - Printer only
SF - Screen and file
AL - All destinations (screen, tile and printer)
The default response for a destination is
'SO', SCREEN ONLY. The following ex-
ample chooses a report destination of
'FO', FILE ONLY. The report does not
display on the screen, but is only written
to the output file (OT.JT278 in this case)
that you selected at the start of the ORGANON run.
DESTINATION SELECTION EXAMPLE
Would you like these reports displayed on:
SO - Screen Only
P0- Printer Only
FO - File: 0UT278
SF - Screen and File: 0UT278
larly useful when one (or several) diameter class(es) has a very large value compared to the other diameter classes in the
plot. As a result, the other classes may
appear to have the same value. By using
the window option, very large value(s)
can be eliminated from the plot. This allows you to inspect the remaining classes
in more detail. If you select a window to
plot, a description below the diameter
class X-axis indicates the range requested. This description will appear on plots
to all destinations except the screen.
Under no circumstances are diameter
classes greater than 36" displayed. A
message appears identifying the number
of trees greater than 36" in diameter that
do not appear on the plot.
ORGANON prompts you for window selection input each time you request a plot.
Windowing gives you multiple views of
the same plot. An example of a screen
display of diameter class windows follows.
AL - All - Screen, Printer and File: 0UT278
WINDOW SELECTION EXAMPLE
DISPLAY (SO) ---> FO
RESIDUAL REPORTS ---> PDF
Window? (N) ---> cCR.
3. Windows
You can request a window for any plot selected. The window determines the 2" di-
ameter classes to be included in the display. The default response for windows is
'N' (NO window selection), which displays the entire diameter class scale from
0" to 36". If a window is desired, a 'Y' response requires input of an even number
minimum and maximum (within the 0's36" limit) diameter class to be displayed.
Values for all diameter classes outside
the specified window are not displayed.
Window selection forces a rescaling of the
Y-axis values of the plot and results in a
more accurate display of the requested diameter classes. This feature is particu34
TEST PLOT278
Li 1-24-88 8:50 AMI
PER ACRE DIAM. DIST. TOTAL
41 YEARS FOR ALL SPECIES
1
271.2.1.
N
U
MP
B E180.8
ER
R
0 A120.5
FC
TA
R E 60.3
I
S
.0+
DIAMETER
ulil
* * * *
1
*
2
3
IN INCHES 246802468 024680
WINDOW SELECTION EXAM PLE (continued)
cepthe Cut Log Table show both residuals and removals in one table or plot. The
Cut Log Table is a log table of the cut
RESIDUAL REPORTS ---> PDF
Window ? (N) ---> V
Enter even integer diameter classes
between 2 and 36...
trees only.
The following example shows the reports
and plots available from the CUT MENU.
Min--->8
Max ---> 14
TEST PL0T278
[11-24-88 8:50 AM]
PER ACRE DIAM. DIST. TOTAL
41 YEARS FOR ALL SPECIES
42.
CUT TABLES AND PLOTS EXAMPLE
[CUT AND PLOTS]
[Per Acre Tables]
ST - Per Acre Stand Table
SK Stocking Table
LG - Log Table
DF - Display Defaults
RH - Run History
28.e
N
U
MP
[Residual/Cut Plots J
BE
E R 19.1
CDF-Diameter Frequency
CVC-CF Volume
CBA-Basal Area
CVS-Scribner Volume
R
OA
FC
T B 91
[<CR> - Return to Master Menu]
RE
CUT REPORTS--->
E
S.0
E
DIAMETER
1
2
3
IN INCHES 24 680 2468 024680
8 - 14" W I N D OW
NOTE: Window designation at bottom of example
will not display on screen output.
2. Cut Tables and Plots (CR)
Cut Reports are only available on the
main menu immediately following a management cut. Cut Reports are also available within the Management Menu and reflect any cuts currently requested
whether or not those cuts have been ac-
cepted (See TRIAL VS ACCEPTED MAN-
AGEMENT). All cut tables and plots ex-
The Cut Stand Table is somewhat similar
to the Residual Stand Table. The difference is that the left side of the Cut Stand
Table is labeled 'RESIDUAL', and provides by 2" diameter class, the number of
trees, basal area, cubic foot volume and
scribner volume per acre for the stand af-
ter cutting. The right side of the Cut
Stand Table, labeled 'REMOVAL', pro-
vides the same information as the left for
the cut trees. Values for each diameter
class displayed in the tables include the
upper diameter but not the lower diameter. The following is an example of a Cut
Stand Table after performing a basal area
thin of 20 sq. ft. from above (See BASAL
AREA THIN).
CUT STAND TABLE EXAMPLE
TEST PL0T278 [11-24-88 8:49AM] Page 1
POST CUT PER ACRE STAND TABLE
AT 41 YEARS FOR ALL SPECIES
=
REMOVAL
RESIDUAL
ci Scrib
ci Scrib trees!
diam trees!
class acre ba vol vol acre ba vol vol
********************************. *******.*********.t***
0-2"
2-4"
4-6"
6-8"
56.9
.1
1.
.0
.0
0.
271.2
28.6
8.4 112.
0.
0.
0.
6.9 117. 367.
8 -10" 42.9 18.5 365. 860.
.0
.0
.0
.0
.0
.0
.0
.0
.0
.0
.0
.0
0.
0.
0.
0.
0.
0.
430.2 84.91423. 2916.
0.
0.
0.
0.
20.4 20.0 450. 1183.
The Cut Stocking Table is similar to the
Residual Stocking Table, except that the
left side of the Cut Stocking Table is laThe Cut Stocking
beled 'RESIDUAL'.
Table provides by species group, the number of trees, basal area, cubic foot volume
and scribner volume per acre for the
stand after cutting. The right side of the
table, labeled 'REMOVAL', provides the
same information as the left for the cut
trees. The following is an example of a
Cut Stocking Table.
CUT STOCKING TABLE EXAMPLE
POST(CUT) STOCK TABLE
TEST PL0T278
DATA FILE: PL0T278
[11-24-88 8:50 AM]
ci Scrib trees! ci Scrib
vol
vol acre ba vol vol
vri acre ba
= REMOVAL
DF 41 430.2 84.9 1423.2916 20.4 20.0 450.4 1183.0
Totals
430.2 84.9 1423. 2916 20.4 20.0 450.4 1183.0
190.
Stand Density Index:
.359
Relative Density Index:
Quadratic Mean Diameter: 6.0
34.0
Mean Height:
5.3
Mean Diameter:
.778
Mean Crown Ratio:
36
ameter. The following is an example of a
Cut Log Table.
CUT LOG TABLE EXAMPLE
CUT LOG TABLE (TOTAL 41 YEARS)
TEST PL0T278 [11-24-88 8:40 AM] Page 1
LOG LENGTH: 32 ft MIN LOG LENGTH: 8.0 ft
TOP DIAM: 4.0 in
Top
DF
G/W Fir
P/S Pine OtherConifer
Logs Vol
Diam Logs Vol Logs Vol Logs Vol
4-6" 20.4 362.3 .0
6-8" 14.2 820.7 .0
Totals
Logs:
Volumes:
Avg.VoI.:
34.6
1183.0
34.2
.0
.0
.0
.0
.0
.0
.0
.0
.0
.0
.0
.0
.0
.0
.0
.0
.0
.0
.0
The Run History and Display Defaults on
the CUT MENU are the same as the Run
History on the RESIDUAL MENU.
The following two cut histograms, Diame-
ter Frequency (CDF) and Scribner Volume (CVS), show the same total amount
in each diameter class as the corresponding residual histogram. The two plotting
symbols distinguish between the after-cut
at:I trees!
= RESIDUAL
ter class displayed in the tables include
the upper diameter but not the lower di-
0.
0.
0-12" 20.8 14.4282. 571.
1183.
20.4
20.0
450.
8.3164.
336.
2-14" 9.8
Totals
The Cut Log Table provides the same information as the Residual Log Table except for cut trees. Values for each diame-
residual on the bottom and the cut portion on the top. The diameter values displayed on the X-axis indicate the upper
diameter of the class (i.e., 14 represents
12" <DBH <= 14").
3. Growth (GR)
CDF PLOT EXAMPLE
TEST PL0T278
[11-24-88 8:51 AM]
CUT/RESIDUAL PER ACRE DIAM. DIST. TOTAL
41 YEARS FOR ALL SPECIES
271.2
N
U
MC
ET
R
O E120.5
FS
TD
year cycles. In a growth cycle, tree height
growth, diameter growth, mortality, and
crown change all take place. If requested,
tripling and yield table output can also be
You can choose any number of
tables are the only tables available at
R U 60.3
01
DIAMETER
each growth cycle regardless of the number of growth cycles that you request. Al-
iiii
1
ter all growth cycles selected are com2
3
IN INCHES 2468 024680 2 4680
CVS PLOT EXAMPLE
TEST PL0T278
plete, ORGANON displays all main menu
options. The following is an example
where the stand is grown for three cycles.
GROWTH CYCLE EXAMPLE
[11-24-88 8:42 AM]
CUT/RESIDUAL PER ACRE DIAM. DIST. TOTAL
41 YEARS FOR ALL SPECIES
1518.7
ORGANON--->GR
Number of 5-year cycles to execute? (1) --->3
[execution beginning I
[please wait yield table values are being calculated]
START CYCLE
1
CYCLE 1 -- COMPUTATION ENDS WITH 5
YEARS TOTAL STAND GROWTH
[please wait yield table values are being calculated]
END OF CYCLE
1
C
RC
U1012.4
BT
N
ER
***STARTCYCLE
R E 675.0
2
CYCLE 2 -- COMPUTATION ENDS WITH 10
YEARS TOTAL STAND GROWTH
[please wait yield table values are being calculated]
END OF CYCLE
2
S
VI
OD
L U 337.4
UA
START CYCLE
3
CYCLE 3 -- COMPUTATION ENDS WITH 15
YEARS TOTAL STAND GROWTH
[please wait yield table values are being calculated]
END OF CYCLE
3
ML
E
.0
DIAMETER
GROWTH CYCLES are conducted in five-
growth cycles, as long as the total number
does not exceed the growth cycle limits.
REPORTS and MANAGEMENT are only
available after completion of the number
of growth cycles requested. Because they
are automatic and not user-selected, yield
R
I
Growth Cycles
done.
B U180.8
S
a.
1
2
3
IN INCHES 2468 02468024680
ORGANON--->
37
b. Growth Cycle Limits
For uneven age stands, a maximum of 22
cycles or 110 years of growth can be re-
quested. For even age stands, the number of cycles is limited by the starting
stand age such that the ending stand age
does not exceed 125 years at breast-
height. The stand also cannot be further
grown when more than 50% of the major
species in the stand (Douglas Fir, True
Fir, Incense Cedar, Ponderosa Pine and
Sugar Pine) reach a growth effective age
of 120 breast-height years. However,
MANAGEMENT, RESIDUAL or CUT
REPORTS, and FERTILIZATION may
still be selected from the main menu. Finally, no growth can occur after the stand
has been FINAL HARVESTED.
GROWTH CYCLE LIMITS EXAMPLE
ORGANON--->GR
Number of 5-year cycles to execute? (1) ---> 19
NUMBER OF CYCLES REQUESTED
WILL CAUSE STAND AGE TO EXCEED
MAX STAND AGE
ONLY 16 CYCLES WILL BE RUN
GROWTH CYCLE LIMITS EXAMPLE
ORGANON--->GR
Number of 5-year cycles to execute? (1) ---> 5
START CYCLE
10
CYCLE 10 -- COMPUTATION ENDS WITH 50
YEARS TOTAL STAND GROWTH
[please wait yield table values are being calculated]
END OF CYCLE
10
39.5% OF THE MAJOR SPECIES TREES
ARE OVER 120 YEARS
START CYCLE
11
CYCLE 11 --COMPUTATION ENDS WITH 15
YEARS TOTAL STAND GROWTH
[please wait yield table values are being calculated]
END OF CYCLE
11
51.2% OF THE MAJOR SPECIES TREES
ARE OVER 120 YEARS
GROWTH TERMINATED MORE THAN 50%
OF MAJOR SPECIES TREES OVER 120 YEARS.
ORGANON--->
GROWTH CYCLE LIMITS EXAMPLE
ORGANON ---> GR
Number of 5-year cycles to execute? (1) ---> 20
NOTE: The preceding examples do not
NUMBER OF CYCLES REQUESTED
WILL CAUSE STAND AGE TO EXCEED
MAX STAND AGE
ONLY 19 CYCLES WILL BE RUN
4. Management (MT)
necessarily reflect messages given for example TEST PL0T278.
ORGANON--->GR
The management routines let you select,
view and execute a management scheme
of thinning, fertilization and harvesting.
A display of the Management Menu fol-
Number of 5-year cycles to execute? (1) ---> 2
lows.
GROWTH CYCLE LIMITS EXAMPLE
NO GROWTH CYCLES POSSIBLE
NO REMAINING MAJOR SPECIE&
MANAGEMENT MENU EXAMPLE
(MANAGEMENT MENUI
[SelectionJ
FE - Fertilize
FH - Final Harvest
IN - lngrowth
[Thin I
DB - Diameter
Dl Stand Density
BA - Basal Area
US - User Code
[Reports
RR - Residual
CR - Cut
[Restart]
RS - Restart Management Selection
[Exit]
PM - Perform Management and Exit
VM - Void Management and Exit
MANAGE --->
a. Thin
There are several approaches you can use
to thin a stand. You can use any combination of these thinning methods to ob-
tain the desired results. All thinning op-
erations are reflected on YIELD TABLES,
if requested, and on CUMULATIVE CUT
LOG TABLES. After you select each
thinning operation, you can change your
mind and not thin the stand if you so
choose. ORGANON lets you cancel your
action and returns you to the main menu.
Thinnings are accomplished within ORGANON by reducing the expansion factors of the trees affected. As an example,
a Diameter Proportional thinning is ac-
complished by reducing the expansion factors of all trees by the fractional value (a
constant) needed to meet the userspecified goal. Thinning from above (or
below) starts with the largest (or small-
est) diameter and sets it and each suc-
tree would remove too many trees per
acre. A fractional part of that tree's expansion is then removed to meet your desired goal.
1. Diameter Thin (DB)
You can choose a diameter thin to thin by
diameter class. ORGANON prompts you
for the following information:
Species - The species or species group to
which the thinning will be applied.
Lower DBH - The smallest diameter for
the thinning. This diameter will NOT be
included in the thinning.
Percent removal - The percent to remove
at the lower diameter.
Upper DBH - The largest diameter for the
thinning. This diameter WILL be included in the thinning.
Percent removal - The percent to remove
at the largest diameter.
The removal percentages for diameters
between the smallest and largest diameters are determined by linear interpolation. The formula for this interpolation
is:
P = [(Di - DL)/(DU DL)] [PU - PLI + PL
V/here,
Pi =
Percent removal for an interim
diameter
Di = The interim diameter
DU = The largest diameter
DL = The smallest diameter
PU = Percent removal for the largest
diameter
PL = Percent removal for the smallest
diameter.
ceeding smaller (or larger) tree to zero until doing so to the next smaller (larger)
39
In the following example, a thin of 50%
from 2.5" trees linearly decreasing to 10%
from 28" trees is performed on the DOUGLAS FIR in the stand.
DIAMETER CLASS THIN EXAMPLE
MANAGE --> DB
SPECIES OR SPECIES GROUP DESIRED
(AL) ---> DF
WARNING *** 1
Lower DBH value 'not' included...
Upper DBH value included...
(i.e. lower < CUT <= upper)
Enter lower DBH ---> 2.5
Enter lower removal % ---> 50
EnterupperDBH--->28
Basal Area contil:
A - from above
B - from below
P - proportional
Enter BA Control> A
Total Basal Area = 63.0 sq. ft. for
DOUGLAS FIR
Enter BASAL AREA (sq.ft.) to remove> 20.5
Accept this thin (V)?> <CR>
Executing BA thin from above...
Enter upper removal % ---> 10
3. Stand Density Index Thin (DI)
Accept this thin (Y)? ---> <CR>
Executing thin by DBH control...
<CR> to continue
The current value for Reineke's stand
density index is displayed. ORGANON
then prompts you for the desired target
stand density index. This target stand
density index can be achieved by cuts
2. Basal Area Thin (BA)
You can choose a basal area thin to re-
move a certain amount of basal area from
the stand. ORGANON first prompts you
for the species or species group to which
the basal area thin will be applied. The
total amount of basal area in the species
then be displayed
on the screen. ORGANON prompts you
for the basal area amount to be cut. The
group you selected
will
basal area cut can be performed from
above, below or proportionally across the
diameter classes.
In the following example, ORGANON
prompts you for a basal area thin. The
user selects a thin from above of 20.5
square feet of basal area in DOUGLAS
FIR.
40
MANAGE ---> BA
SPECIES OR SPECIES GROUP
DESIRED (AL) --> DF
from above, cuts from below, or by proporORGANON attempts to
tional cuts.
reach the specified target stand density
index, although in some circumstances,
that target can only be approached.
For this reason, ORGANON displays the
final stand density index achieved. Another thinning attempt, using the same
target except from below instead of above
(or vice versa), usually achieves an exact
target stand density index. In the following example, a user selects a proportional
stand density index thinning to a target
SDI of 200.0.
pansion factors (i.e. the number of trees
per acre the irigrowth tree represents)
MANAGE ---> DI
Stand Density Index is currently
Target SDI ? ---> 75.
A from above
B - from below
will not be adjusted in any way and must
be input for the stand.
The following example shows the procedure for adding ingrowth trees to a stand.
P proportional
INGROWTH EXAMPLE
Enter SDI control from ---> P
[INGROWTH TREE DESCRIPTIONI
Accept this thin (Y)? ---> <CR>
Executing SDI Proportional thin...
Stand Density Index is currently: 75.
Describe each ingrowth tree. A carriage
return <CR> will enter a default value of
zero (0).
TREE#
4. User Code Thin (US)
As defined previously, a numeric user
code (with a value between 1 and 99) is a
variable that you can enter for each tree
record that can later be used in thinning.
When you select 'US', ORGANON
prompts you for the user code along with
the percent of that user code to thin. In
the following example, 20 percent of all
trees with a user code of 0 are to be cut.
1
Tree Species Code (Required-Integer) ---> 202
Diameter at Breast Height [< 2"J
(Required-Real) -> 1.5
Height in feet [>4.5']
(Strongly Recommended-Real) -> 4.9
Crown Ratio (Strongly Recommended-Real) -> .8
Number of trees per acre this tree represents
(Required) -> 46
User 2-digit thinning code (Optional-Integer)>.cCR>
Species: 202
USER CODE THIN EXAMPLE
DBH:
HI:
MANAGE ---> US
Enter user code to thin ---> 0
Enter percent to Cut ---> 20
CR:
EXP:
USER:
Accept this thin (Y)? ---> Y
Executing thin by user code 0...
1.5
4.9
.80
46.0
0 Save this tree (Y)? <CR>
Another tree (Y)? N
1 TREE ADDED TO STAND: TEST PL0T278
b. Fertilization (FE)
This routine is not currently active.
c. lngrowth (IN)
Ingrowth selection from the management
menu allows the addition of small trees to
the tree list. All trees added must have a
breast height diameter less than 2 inches
and a height greater than 4.5 feet. Ex-
Ingrowth trees are listed separately durtrial management reports and plots.
After accepting ingrowth management
(PM), the ingrowth trees are included in
the appropriate diameter class. Not accepting trial management (VM) removes
ing
all ingrowth trees from the stand (see
TRIAL VS ACCEPTED MANAGEMENT).
41
e. Creating a Management Scheme
('LAYERED' MANAGEMENT)
CUT PER/ACRE STAND TABLE EXAMPLE
TEST PL0T278 [11-24.87 1 2:47PMJ Page 1
TRIAL CUT PER ACRE STAND TABLE
AT 41 YEARS FOR ALL SPECIES
= RESIDUAL = = REMOVAL=
cf Scnb
Cf Scrib trees/
trees'
vol acre ba vol
ba
vol
acre
class
diam
Ingrowth 46.0
34.6
0 -2"
2.
0.
.0
.0
0.
0.
.1
0.
0.
22.3
.0
0.
0.
.0
0.
0.
.0
0.
.6
2-4"
4-6"
6-8"
88.9
9.8
12.0
2.4
8-10"
10-12"
15.7
6.8
6.8
4.6
12 -14"
.0
.0
Totals
.0
vol
.0
163. 261. 182.3 24.6 331.
18.8 4.5 77.
40. 126.
134. 315. 27.2 11.7 231.
9.8 193.
14.1
89. 177.
30.2 28.3 615.
0.
0.
0.
521.
241.
545.
395.
1519.
201.8 26.4 428. 879. p94.8 79.0 1447.3220.
d. Final Harvest (FH)
When you choose a final harvest, all remaining trees in the stand, regardless of
species, are cut. The only selections
available from the main menu after a final harvest are CUT REPORTS and RESTART. The cuts are included on the
YIELD TABLE, if requested, and the CUMULATWE CUT LOG TABLE. The following is an example of selecting a Final
Harvest option.
FINAL HARVEST EXAMPLE
MANAGE--->FH
[FINAL HARVEST]
PLEASE NOTE
HARVEST RESULTS IN ALL TREES TO
CUT TABLE & NO FURTHER STAND GROWTH!
From MANAGEMENT MENU, accept final harvest
with 'pM' -- reject harvest with '<CR>'
[<CR> - To Management Menu]
<CR> to continue...
MANAGE ---> PM
Selected management executing...
[please wait yield table values are being calculated]
[please wait for Cumulative Cut Log Table...]
cCR> to continue...
42
All management options are performed in
a 'layered' fashion. A number of manage-
ment options are available and you can
choose any number of them with their ef-
fects added to previous management decisions. As a result, a cumulative management scheme is performed. This allows
you to design any manner of thin desired.
The stand may be viewed via REPORTS
at any point while the management
scheme is being built. If too much has
been cut, a you can choose RESTART to
begin again. If not enough has been cut,
you can choose a new 'layer' of thinning to
increase the cut. Because of this 'building' scheme, ORGANON prompts you to
verify each thinning decision to avoid possible re-entry of a multilayer thin due to
typing error. The following example
shows thinning of all mistletoe trees
marked as user code 1 and 50% of all
hardwoods under 10".
EATING A MANAGEMENT SCHEME
MANAGE ---> US
Enter user code to thin ---> 1
Enter percent to cut ---> 100
Accept this thin (V)? --> .cCR>
Executing thin by user code 1...
MANAGE--->DB
SPECIES GROUP (AL) -->
[
WARNING
Lower DBH value 'not' included...
Upper DBH value included...
(i.e. lower < CUT <= upper)
Enter lower DBH --->0
Enter lower removal % ---> 50
Enter upper DBH ---> 10
Enter upper removal % ---> 50
Accept this thin (Y)? ---> <CR>
Executing thin by DBH control...
MANAGE ---> PM
f. Trial vs Accepted Management
As the construction of a management
scheme is progressing by 'layering', each
thin is being performed on a trial basis.
This means the stand has not actually
been changed. A new layer of manage-
to begin a new management selection. If
no new management is selected, choose a
Void Management (VM) exit instead of
RESTART.
RESTART MANAGEMENT EXAMPLE
ment can be added until the final result
MANAGE--->RS
has been achieved. All cut reports viewed
at this time are labeled as TRIAL only.
MANAGE--->
When the management is satisfactory,
the 'TRIAL' cut can only become perma-
nent by specifically designating accep-
tance. The acceptance Accepting PM
(PERFORM MANAGEMENT) takes you
out of the management menu back to the
main menu. If unacceptable, a decision to
void the management and return the
stand back to its original condition VM
(VOID MANAGEMENT) also exits man-
agement and sends you back to the main
menu. To void the management but remain in the management menu for another try, choose RESTART. After you leave
management by choosing 'PM', MANAGEMENT no longer is available from
the master menu until after the next
growth cycle. If you choose a VM exit
from management, MANAGEMENT is
still available from the master menu.
g. Reports (RR or CR)
Reports are available during manage-
ment in order to view the cumulative effects upon the stand of any management
decisions that have been selected (even on
a trial basis). During management, RESiDUAL REPORTS display the stand as
it appeared before management. CUT
REPORTS display the cumulative results
of all management selections.
Ii. Restart Management (RS)
Restart terminates the current management selections. The stand is returned to
the condition prior to entry into the management routine. The stand is now ready
1. Management Exit
1. Void Management (VM)
After a management option or options
have been made on a trial basis, you may
view any of the residual or cut reports. If,
at that time, the results of the management are not as desired, you can void all
management options and leave the MANAGEMENT MENU, and go back to the
MASTER MENU. The stand then remains as it was prior to entering the man-
agement selection. Be sure to check this
because CUT REPORTS are available
only after a cut and they are otherwise
unavailable. The RESIDUAL REPORTS
selection displays the stand for confirmation. If the management performed was
not desired, but another management attempt will be made, select a RESTART
(RS) rather than a Void Management
(VM) exit. MANAGEMENT is again
available from the master menu.
VOID MANAGEMENT EXAMPLE
MANAGE--->VM
MANAGE--->
2.
Perform Management (PM)
By
selecting PERFORM MANAGEMENT, the management scheme, as previously defined by selections, becomes a
permanent action on the stand and all re43
ports reflect that change on a perma-
nentnot trial basis.
MANAGEMENT
will no longer be available from the master menu until after the next growth cycle.
PERFORM MANAGEMENT EXAMPLE
MANAGE ---> PM
Selected management executing...
[please wait -- Cumulative Cut Log Table
being calculated]
<CR> to continue...
ORGANON--->
5. Restart ORGANON (RS)
When you select RESTART from the
main menu, all output is saved from the
current model run, if requested. ORGANON then re-initializes and begins from
the point of entering a file name of a previously edited data file. In the following
example, ORGANON is restarted, the
yield table is saved but cumulative cut log
table is not saved. A new data file, called
PL0T356, is then selected for the next
analysis.
RESTART ORGANON EXAMPLE
ORGANON--->RS
Save yield table (N)? ---> V
Save cumulative cut log table (N)? ---> <CR>
Enter tree data file name [NO extension (i.e
A:MYFILE)] ---> PL0T356
6. Quit (QU)
When an ORGANON run ends, you must
choose QUIT or RESTART to properly
close all files associated with that run.
44
ORGANON--->QU
[please wait -- yield table transfer is proceeding]
[please wait -- cumulative cut log table
transfer is proceedingi
[ALL OUTPUT HAS BEEN WRITTEN TO FILE:
0UT278]
Stop Program terminated.
C:\MODEL>
a. Final Output and Run History
After QUIT or RESTART, the output file
is closed and consists of all stand parame-
ters, calibrations, program defaults, tables and plots previously requested for
file output along with the yield table, if
requested. A cumulative cut log table follows the yield table. The final report in
the output file will be a run history which
is the same as the Run History available
during program execution in the CUT and
RESIDUAL REPORT MENUS. This re-
port represents the final run history.
be listed with
stand age and number of cycles, each
Each growth request
will
management option will be itemized as to
type and species, and each fertilization
will include age and quantity. You should
request plots and tables during program
execution to save in an output file as well
as to display on the screen. In this way,
the stand description, defaults and run
history are associated with the reports requested.
An output listing of sample ifie PL0T278
follows. The stand is grown one cycle. All
species are proportionally thinned to 20
square feet basal area, and all species are
also thinned 20% for all user codes of 0.
The stand is grown for two more cycles
then clear cut. An example is included of
a plot requested with a window.
FINAL OUTPUT FILE AND RUN HISTORY EXAMPLE
OR GAN ON
ORegon Growth ANalysis and projectiON system
Growth & Yield Project for
Southwest Oregon Mixed Conifer Forests
RELEASE VERSION 2.0 - #SWO-0000
Copyright 1989 by College of Forestry, Oregon State University
by David W. Hann
Arlene Hester, David Larsen, and Martin Ritchie
Department of Forest Management
Oregon State University
This model was funded by:
Forestry Intensified Research (FIR)
with
special help from
Boise Cascade Corporation
&
Medford Corporation
[11-24-88 8:39 AMI
Tree Data File: PL0T278
Stand Identification: TEST PL0T278
Number of Plots/Points: 4
Number of Sample (obs.) Trees: 19
EXPANSION FACTORS WERE SET AS FOLLOWS:
SUBSAMPLE I ---> FIXED 7.8 ft. radius
SUBSAMPLE 2---> FIXED 15.6 ft. radius
SUBSAMPLE 3 ---> VARIABLE BAF = 20.0
Douglas Fir Site Index = 109.4
Ponderosa Pine Site Index = 102.9
Breast height stand age = 28
Total stand age 36
Run Defaults:
1.
TRIPLING: No
2.
DISPLAY MENUS: Yes
3.
USE HEIGHT CALIB: Yes
4.
USE HTCB CALIB: Yes
5. USE DIAM. GRO CALIB: Yes
6.
LIMIT ON MAX. BA: Yes
7.
YIELD TABLE: Yes
8.
MORTALITY TABLE: No
9. PRINTER FORM FEED: No
10. GRAPHICS PRINTER: Yes
11. VOLUME EQUATIONS: OSU
(continued)
45
FINAL OUTPUT FILE AND RUN HISTORY EXAMPLE (continued)
Board Foot Defaults:
LOG TOP DIAM: 4. inches
12.
TRIM ALLOWANCE: 8. inches
13.
STUMP HEIGHT: .5 feet
14.
LOG LENGTH: 32 feet
15.
MIN LOG LENGTH: 8.0 feet
16.
Cubic Foot Defaults:
CONIFER TOP DIAM: 0. inches
17.
HARDWOOD
TOP DIAM: 0. inches
18.
19. CONIFER STUMP HEIGHT: .0 feet
CALIBRATION RATIOS USED FOR THIS RUN:
ht/diam htcb diam
.70 1.23 1.00
DOUGLAS FIR
1.00 1.00 1.00
GRAND/WHITE FIR
1.00 1.00 1.00
PONDEROSA PINE
1.00 1.00 1.00
SUGAR PINE
1.00 1.00 1.00
INCENSE CEDAR
WESTERN HEMLOCK 1.00 1.00 1.00
1.00 1.00 1.00
MADRONE
1.00 1.00 1.00
CHINKAPIN
1.00 1.00 1.00
TANOAK
1.00 1.00 1.00
CANYON LIVE OAK
1.00 1.00 1.00
BIG LEAF MAPLE
1.00 1.00 1.00
WHITE OAK
1.00 1.00 1.00
BLACK OAK
--> -->-->--> --> --> WARNING<-- <-- <--<--<--<-50 SAMPLE TREES IS THE MINIMUM RECOMMENDED II!
Page 1
[11-24-88 8:46 AM]
INITIAL PER ACRE STAND TABLE AT 36 YEARS FOR ALL SPECIES
TEST PL0T278
NET 0
=YEARCHANGE
= ENDING=
diam trees/
class acre
0-2"
2-4"
4-6"
6-8"
57.3
Cf
Sci
ba vol vol
.0
0.
229.1 15.0 142.
treesl
acre
0.
0.
0.
71.6 8.4 112.
43.0 12.4197. 571.
8 -10" 20.9 10.0 158. 357.
10-12" 30.2 20.0 362. 701.
Totals 451.9 65.8 970. 1628.
(continued)
46
Cf
Scrib
ba vol vol
FINAL OUTPUT FILE AND RUN HISTORY EXAMPLE (continued)
TEST PL0T278
[11-24-88 8:46 AM]
PER ACRE DIAM. DIST. TOTAL 36 YEARS FOR ALL SPECIES
229.1
N
U
M
B
E
P152.7
R
E
A
0
F
A101.8
C
T
A
E
A
E
50.9
Ii
.01
DIAMETER
IN INCHES
2
1
3
24 680 24680 24680
TESTPLOT278
[11-24-88 8:47AM]
Page 1
PER ACRE STAND TABLE AT 41 YEARS FOR ALL SPECIES
NET5
= RESIDUAL=
diam trees!
class
acre
=YEAR CHANGE=
cf scrib trees!
ba vol vol
**.***************.***.********fl
0-?
2- 4
4- 6
56.9
.0
271.2
6 - 8
28.6
8 -10
42.9
10-1? 20.8
12 -14w 30.2
scrib
Cf
acre ba vol vol
*******.**.*.**.***.*.*
.1
1.
0.
.0
0.
0. -229.6 -16.0-142.
-.4
.1
36.6 493. 782. 199.6 28.2
6.9 117. 367. -14.4 -5.4
18.5 365. 860. 22.0 8.5
14.4 282. 571. -9.3 -5.6
28.3 615. 1519. 30.2 28.3
Totals 450.6 104. 1873. 4O99
1.
0.
0.
381. 782.
-80. -204.
207. 503.
-79. -129.
615. 1519.
-1.3 39. 1903. 2470.
(continued)
47
YIELD TABLES
Page 1
[11-24-88 8:42 AM]
TEST PL0T278
DATA FILE: PL0T278
trees/
species yr acre
at
ba
trees/
acre
Sciib
vol
cf
vol
ENDING=RESIDUAL YIELD
451.9 65.8
970.
1628.
451.9 65.8
TOTAL MAI:
CONIFER MAI:
970.
27.
1628.
45.
45.
Doug Fir 36
TOTAL:
27.
450.6 104.9
4099.
-1.3
39.1
450.6 104.9
TOTAL MAI:
CONIFER MAI:
1873.
46.
46.
4099.
100.
100.
-1.3
PAl:
PAl:
39.1
RESIDUAL
Doug Fir 41 201.8 26.4
201.8
TOTAL:
26.4
CUT YIELD
294.8
REMOVAL
79.0 1447. 3219.
428.
879.
294.8
79.0
Doug Fir 46
200.3 41.3
796.
TOTAL:
200.3 41.3
796.
2400.
49.
49.
122.
122.
Doug Fir 46
199.7 62.5
1387.
3927.
TOTAL:
199.7 62.5
1387.
56.
56.
3927.
140.
I
140.
14.8
-1.5
PAl:
PAl:
14.8
1]
367.9
73.6
73.6
1521.
304.
304.
5-YRCHANGE
21.2
590.5
1527.
-.6
PAl:
PAl:
21.2
590.5
1527.
305.
305.
Doug Fir 46
A ES I D U AL Y I EL D
-.3
199.4 90.6 2263. 6732.
TOTAL:
199.4 90.6
I
(continued)
3219.
-.6
ENDING
2263. 6732.
178.
66.
178.
66.
1447.
5-YRCHANGE
367.9 1521.
-1.5
ENDINGRESIDUALYIELD
TOTAL MAI:
CONIFER MAI:
2470.
494.
494.
879.
2400.
TOTAL MAI:
CONIFER MAI:
902.
180.6
180.6
428.
ENDING-RESIDUAL YIELD
TOTAL MAI:
CONIFER MAI:
Scrib
vol
0-YRCHANGE
902. 2470.
1873.
Doug Fir 41
ct
vol
0-YRCHANGE
ENDINGRESIDUAL YIELD
TOTAL:
ba
-.3
PAl:
PAl:
118.1
118.1
5-YR CHANGE
876.2 2804.
28.1
28.1
876.2
175.2
175.2
2804.
561.
561.
FINAL OUTPUT FILE AND RUN HISTORY EXAMPLE (continued)
YIELD TABLES
TEST PL0T278
DATA FILE: PL0T278
Page 2
[11-24-88 8:42 AMI
*********.*.***S****.************.**.**********.***.*****.***t****.********.*************.
at
species yr
trees!
cf
acre
ba
Scrib
vol
vol
ci
trees!
acre
ba
vol
Scrib
vol
ENDING=R ESI DUAL VI ELD=5-YR CHANGE
Doug Fir 61
TOTAL:
199.2 125.3
3473.
1448.
199.2 125.3
TOTAL MAI:
CONIFER MAI:
3473.
99.
99.
1448.
240.
240.
-.2
34.8
1209.
4716.
-.2
PAl:
PAl:
34.8
1209.
241.9
241.9
4716.
943.
943.
I
ENDING
RESIDUALYIELD=5-YRCHANGE
199.0 165.8 5102. 7837.
-.2
40.4 1629. 6388.
Doug Fir 66
TOTAL:
199.0 165.8
TOTAL MAI:
CONIFER MAI:
5102.
99.
99.
7837.
319.
319.
-.2
PAl:
PAl:
RESIDUALFINAL HARVEST
40.4
1629.
326.0
326.0
6388.
1278.
1278.
Doug Fir 66
.0
.0
0.
0.
199.
REMOVAL
165.8 5102.
7837.
TOTAL:
.0
.0
0.
0.
199.
165.8
7837.
5102.
CUMULATIVE CUT LOG TABLE
TEST PL0T278
LOG LENGTH: 32 feet
Doug Fir
Logs Vol
Diameter
4 -- 6"
6 -- 8"
MIN LOG LENGTH: 8.0 feet
8 -- 10"
10 -- 12"
12 -- 14"
365.4 6038.5
47.4 2695.0
77.2 6124.7
14.6 1887.8
15.6 2636.5
14-- 16"
6.7 1674.4
G/W Fir
[11-24-88 8:42 AM J
TOP DIAM: 4.0 inches
P/S Pine Other Conifer
Logs Vol Logs Vol Logs Vol
.0
.0
.0
.0
.0
.0
.0
.0
.0
.0
.0
.0
.0
.0
.0
.0
.0
.0
.0
.0
.0
.0
.0
.0
.0
.0
.0
.0
.0
.0
TOTALS
Logs:
527.0
.0
Volumes: 21056.9
.0
.0
.0
.0
.0
AVG VOLUME:
40.0
(continued)
.0
.0
.0
.0
.0
.0
.0
.0
.0
All others must
load the disk containing the 'PLTYLD'
ORGANON directory.
YR ACTIVITY
*********************.**********************************
program, Disk 1, into drive A and the ORGANON output file(s) for plotting in drive
B. Be sure to include B: when entering
the ORGANON output file name.
Display destination (Screen or Printer
36 GROWTH ---> 1 CYCLE
41 THIN DBH (DF) 2.5 "->50% 28 ' ->10%
ONLY) and plot windows must be selected for these plots in the same manner as
THIN BA (DF) from above --> 20.5 sq ft
SDI THIN proportional -> Target 75
THIN USER CODE = 0-> 20%
41
INGROWTH (46 TPA - DOUGLAS FIR)
41
41 GROWTH -> 5 CYCLES
66 FINAL HARVEST
GANON program. The following example
displays screens showing a plot of Trees
Per Acre and Total Cubic Foot Mean!
Periodic Annual Increment.
41
41
for display of CUT or RESIDUAL REPORTS described earlier in the main OR-
b. Supplementary Program 'PLTYLD'
PLTYLD' EXAMPLE FOR FLOPPY DISK USERS
If you request a yield table in the ORGANON growth model run, a supplementary
program named PLTYLD' can read an
ORGANON output file containing a yield
table and generate plots of specified yield
table variables over stand age (for evenage stands) or elapsed time (for unevenaged stands). You need only provide an
ORGANON output file name (including
drive designator, if necessary) and the
plots desired. The following yield table
variables may be plotted:
A:> PLTYLD
trees per acre
basal area per acre
cubic foot volume per acre
Scribner volume per acre
total cubic foot mean/periodic annual
+
increment
total Scribner mean/periodic annual
increment
conifer cubic foot mean/periodic
annual increment
conifer Scribner mean/periodic
annual increment.
The PLTYLD' program is on Disk 1.
Hard disk users should have already loaded this program onto their designated
50
ORGANON
Growth and Yield Project
Southwest Oregon Mixed Conifer Forests
SW OREGON VERSION
EDITION 2.0 - #SWO-0000
Enter ORGANON output file name
(<CR> to STOP) ---> B:0UT278
Would you like these reports displayed on:
SO - Screen Only
P0- Printer Only
DISPLAY (SO) ---> <CR>
Indicate the variable to be plotted:
1. Trees/Acre
2. Basal Area
3. Cubic Foot Volume
4. Scribner Volume
5. Total Cubic Foot Mean/Periodic Annual
Increment
6. Total Scribner Mean/Periodic Annual Increment
7. Conifer Cubic Foot Mean/Periodic Annual
Increment
8. Conifer Scribner Mean/Periodic Annual
Increment
[<CR> to END]
PLTYLD EXAMPLE (continued)
PLTYLD' EXAMPLE [continued]
VARIABLE NUMBER ---> 1
Window? <N> ---> <CR>
[please wait -- yield plot values are being read)
[please wait -- yield plot values are being read]
TEST PL0T278
TREES PER ACRE YIELD
PLTYLD EXAMPLE (continued)
[11-24-88 8:45 AM]
TEST PL0T278
TOTAL CUBIC FT. VOLUME MEAN ANNUAL
INCREMENT/PERIODIC ANNUAL INCREMENT
C326.0
I
V
R
E
E
TL
p
0217.3
p
p
OU
367.8
TM
S
A E 144.9
L
P
p
M
311.8
pm m
A
I
72.4
/
A
C
p
F
451.9 XX
E
R
[11-24-88 8:50 AM)
P
A
255.2
mm
mm
m
R
E
xXXX
199.0
Total
Stand age
36yr+
Total
X
111111
22 33445566778899001122
050505 05050505050505050505
111111
Standage
112233445566778899001122
36yr+
05050 505050505050505050505
11
Indicate the variable to be plotted:
1. Trees/Acre
2. Basal Area
3. Cubic Foot Volume
4. Scribner Volume
5. Total Cubic Foot Mean/Periodic Annual
Increment
6. Total Scribner Mean/Periodic Annual Increment
7. Conifer Cubic Foot Mean/Periodic Annual
Increment
8. Conifer Scribner Mean/Periodic Annual
Increment
[<CR>to END)
Indicate the variable to be plotted:
1. Trees/Acre
2. Basal Area
3. Cubic Foot Volume
4. Scribner Volume
5. Total Cubic Foot Mean/Periodic Annual
Increment
6. Total Scribner Mean/Periodic Annual Increment
7. Conifer Cubic Foot Mean/Periodic Annual
Increment
8. Conifer Scribner Mean/Periodic Annual
Increment
VARIABLE NUMBER ---> <CR>
Stop Program terminated.
VARIABLE NUMBER --->5
Window? <N> ---> <CR>
(continued)
51
WARNING AND ERROR MESSAGES
ORGANON may display error or warning messages during program execution. The following list describes the messages that ORGANON issues to a user should problems oc-
messages
cur during program execution. The interpretations of warnings and error
ORGANON.
maintain
your
work
flow
with
should clarify their meaning so you can
MESSAGE
MEANING
All errors have NOT been corrected.
ORGANON cannot be run.
After exit from the correction module,
there are still tree data errors that have
not been corrected. Re-entry to the corrector module will occur until all errors
are corrected.
*** ALL OUTPUT HAS BEEN WRIT-
TEN TO FILE mx
At the end of an ORGANON run or at
the point of a restart request, the yield
table is written to the end of the designated output file shown in quotes. Following the yield table is a history of the
completed ORGANON run.
xxx crown ratios predicted from yyy en-
tered
During raw data file entry, crown ratios
were predicted for xxx trees with missing crown ratios by equation and cali-
bration ratio determined by yyy trees
with entered crown ratios for the same
species.
CROWN WIDTH OF TREE xx IS OUT
OF RANGE
HEIGHT=xxx
DBH=xxx
DIAMGRO=xxxx HTGRO=xxxx
Program Terminated due to above error.
DBH=O.O FOR TREE xxx IS NOT
VALID
ERROR NO TREES LEFT
52
During data completion or diameter
growth, a maximum crown width for
the specified tree was calculated and de-
termined to be less than 0 or greater
than 100 using the equations of Paine
and Hann (1982). Program execution is
terminated.
An illegal tree diameter of 0. has been
read from the input file.
When in the correction module, all tree
records have been designated to be deleted.
MESSAGE
MEANING
ERROR-- ONLY xx TREES WERE
ENTERED
During tree data correction, the tree
record number specified to edit was
greater than the number of trees en-
tered.
***
ERROR--REENTER --->
The user-requested input has been re-
jected. This can happen when:
1. A real number has been entered when
an integer is requested.
2. A character has been entered when a
numeric value has been requested.
3. Some character other than YES, yes,
NO or no has been entered when a
Yes! No answer was requested.
4. A invalid character has been entered
for a requested character.
5. A numeric value does not fall within
the requested range.
EXECUTION ENDED WITH> 50% OF
TREES OVER 120 YEARS
A warning that the current growth cycle
is completed and more than 50% of the
major have reached growth-effective age
greater than 120 years at breast-height.
No more growth will be allowed after
this point.
FILE ORGANON.DEF' DOES NOT EX-
During default selection, a request was
made to use the preset user defaults in
file ORGANON.DEF on the default
IST!
drive. This file does not exist at this
time and selection <3> should be used to
create this file.
FILE xxx' DOES NOT EXIST! (Drive
OK?)
When a file name for an existing file is
requested in ORGANON, the file name
entered did not exist on the specified
drive. If a drive was not specified, the
file did not exist on the default drive.
Be sure to enter the drive specification
or check the spelling of the file name.
Data files
must have no extensions.
53
MESSAGE
MEANING
FILE 'xxx' DOES NOT EXIST!
When an ORGANON output file name
is requested in PLTYLD, the file name
Either re-enter a data file name (check
DRIVE or enter <CR> to STOP.
entered did not exist on the specified
drive. If a drive was not specified, the
file did not exist on the default drive. Be
sure to enter the drive specification or
check the spelling of the file name. A
carriage return will indicate no more
output files to plot.
FILE 'm' EXISTS! -- OVERWRITE?
When an output file name is requested,
a check is made to see if the output file
name entered already exists. If it does,
a check is made if it should be overwritten. This check is also made during the
creation of a batch file.
*** GROWTH TERMINATED -- MORE
THAN 50% OF MAJOR SPECIES
TREES OVER 120 YEARS
During a growth cycle when subsequent
cycles have been requested, this message warns that no more of the requested cycles will be executed as more than
half of the major species have reached
growth effective ages over 120 years at
breast height.
NOT VALID
Heights entered from the input data file
must be greater than 4.5 feet.
ILLEGAL PLOT/POINT NUMBER
OR BLANK LINE FOR TREE xxx
RECORD WILL BE IGNORED***
A blank line has been read from the input data file or the plotlpoint number is
an illegal 0.
ILLEGAL SPECIES CODE xxx
FOR TREE yyy
A species code read from the input file is
no tone of the legal species codes listed
in the SPECIES CODE NUMBER section.
*** HEIGHT <= 4.5 FOR TREE xxx IS
54
MESSAGE
MEANING
Maximum number of trees (2000)
reached.
When adding trees during ingrowth
management, the tree list has reached
2000 and no more ingrowth trees may
be added.
***NO GROWTH CYCLES POSSIBLE
- ALL TREES HARVESTED
*** NO GROWTH CYCLES POSSIBLE
-- > 50% TREES OVER AGE 120
-
No more growth cycles can be requested
as all trees have been harvested by accumulated thins or a FINAL HARVEST
had been conducted on the stand.
No more growth cycles can be requested
as more than half the major species
have reached a growth effective age of
over 120 years at breast height.
*** NO GROWTH CYCLES POSSIBLE
---NO REMAINING MAJOR SPECIES
No more growth cycles are possible as
all of the major species trees have been
cut.
*** No species in that group...
During reports or management, a species is selected for display or management. This message will appear if the
species does not exist or no longer exists
because of previous management selections.
Not enough species in that group..
*** NUMBER OF CYCLES REQUESTED WILL CAUE AGE TO EXCEED
MAX STAND AGE
In a plot during initial data entry, a calibration plot has been requested for a
species in which there were not enough
entries to determine a calibration other
than 1.0.
When selecting the number of cycles to
grow a stand, a number has been selected which will cause the stand to exceed
the maximum breast-height stand age
based upon the entered age of an evenage stand or 125 years for an uneven
age stand.
55
MESSAGE
MEANING
*** ONLY xx CYCLES WILL BE RUN
The number of cycles requested for
ORGANON WILL CALCULATE
growth exceeds the maximum allowed,
and only the number of cycles to reach
that maximum will be grown.
In the corrector module, a missing variable was specified that ORGANON will
compute during the data completion
step following. This will include expansion factors and heights only.
xxx % OF THE MAJOR SPECIES
TREES ARE OVER 120 YEARS
xxx % of the major species trees are
*** please wait -
ORGANON is busy calculating, reading
or writing and the model will not resume execution until this action is completed.
QUESTIONABLE MERCHANTABLE
HEIGHT!!!
During calculations of log volume from
taper equations, merchantable tree
height has been determined to be negative or greater than the total tree
height.
*** STAND IDENTIFICATION
'xxxxxxxxx *** ONLY FIRST 20
CHARACTERS WILL BE USED.
Stand identification title can only be 20
characters long. Only the first 20 characters of the identification will be used.
All remaining characters are truncated.
SYSTEM OVERFLOW.. .MUST BE REPORTED
This message can
56
over 120 growth-effective years during
this growth cycle. This is a warning
only advising ofthe approach to the 50%
point at which time no more growth cycles can be performed.
only
occur if the
TRIPLING option has been selected. If
this message occurs, please report all
related stand information to College of
Forestry, Forest Management, Oregon
State University.
MESSAGE
MEANING
The following are the data scan results... Errors MUST be corrected before
model is run.
After the raw data file is input, a list of
invalid or missing elements is listed. Invalid elements must be corrected before
further model execution.
The maximum number of trees has been
exceeded. Program execution is terminated.
A maximum of 2000 trees can be input
from the data input file. Reduce size of
input file by reducing the number of
sample plots taken in the stand. This
can be done by dividing the stand into
several smaller stands or by randomly
eliminating sampling plots.
THERE WERE NO MAJOR SPECIES
(DF, WF, GF, PP, SP, IC) ENTERED.
THIS DATA FILE WILL NOT BE ACCEPTED BY ORGANON.
*** THIS ROUTINE DOES NOT
WORK!!
All data sets input to ORGANON must
contain trees from the six major species
groups.
The coding for this routine has not been
completed making this option unavailable at the present time.
xxx tree heights predicted from xxx entered
During raw data file entry, tree heights
were determined for xxx trees with missing heights by equation and calibration
ratio determined by trees with entered
heights in the same species.
xxx tree records have been read...
xxx trees have been read into the main
ORGANON module from the .INP' file.
***
UNACCEPTABLE xx SITE INDEX
VALUE
Unacceptable DF or PPsite index value
has been input. DF and PP site index
cannot be less than 44.5 or greater than
164.5.
57
MESSAGE
MEANING
-->-->WARNING--<--
Douglas Fir site index must be in the
range from 60 to 125, the range of the
sampling set used to build the ORGA-
ORGANON !!!
NON model.
-->-->WARNING<-- <--
Fifty trees is the minimum recommended number of trees to sample.
-->-->WARNING<--<--
An even age stand must be a minimum
DOUGLAS FIR SITE INDEX IS OUTSIDE THE RANGE USED TO BUILD
50 SAMPLE TREES IS THE MINIMUM RECOMMENDED.
MINIMUM AGE FOR A STAND IS 15
age of 15 years.
YEARS !!!
*** WARNING *** Negative potential
height growth set to 0!!
During a growth cycle,the height growth
of a tree has been calculated to be nega-
tive. The height growth will beset to 0
and the growth cycle will continue. This
error will occur if the tree is taller than
the maximum potential the tree could
achieved for the stan&s site index. To
eliminate this problem, the user should
consider increasing the stands site index.
WARNING -- POINT xx HAS NO
TREES
During data input, a valid point number
has been read with all remaining fields
blank or 0. This indicates a plotlpoint
with no trees.
>>>>WARNING>>>
Douglas Fir site index does not corre-
>>>>WARNING>>>
Incense Cedar site index determined
DF/GF/WF/SP/WH SITE INDEX MAY
BE INCORRECTLY ESTIMATED.
GROWTH MODEL MAY NOT WORK
CORRECTLY.
INCENSE CEDAR SITE INDEX MAY
BE INCORRECTLY ESTIMATED.
GROWTH MODEL MAY NOT WORK
CORRECTLY.
spond to DF/WF/GF/SP/WH tree heights
entered.
from the Douglas Fir site index does not
correspond to the incense cedar tree
heights entered.
MESSAGE
WARNING <--
MEANING
<--
PONDEROSA PINE SITE INDEX IS
OUTSIDE THE RANGE USED TO
BUILD ORGANON !!!
>>>>WARNING>>>
PONDEROSA PINE INDEX MAY BE INCORRECTLY ESTIMATED. GROWTH
MODEL MAY NOT WORK CORRECTLY.
-->-->WARNING<z--
STAND IS OUTSIDE LIMITS OF SPECIES MIX USED TO BUILD ORGANON.
Ponderosa pine site index must be in
the range from 60 to 125, the range of
the sampling set used to build the ORGANON model.
Ponderosa Pine site index does not correspond to Ponderosa Pine tree heights
entered.
If stand age is less than or equal to 40
years, at least 60% of the stand basal
area must be in the major species. If
the stand age is greater than 40 years,
at least 80% of the stand basal area
must be in the major species.
LITERATURE CITED
Hann, D. W., and J. A. Scrivani. 1987.
Dominant height growth and site index equations for Douglas-fir and ponderosa pine in southwest Oregon. Forest Research Laboratory, Oregon State
University, Corvallis. Research Bulletin 59. l3p.
Hann, D. W., and C. H. Wang. 1989.
Individual tree mortality equations for
the mixed conifer zone of southwest
Oregon. Forest Research Laboratory,
Oregon State University, Corvallis.
Research Bulletin (in press).
Paine, D. P. and D. W. Hann. 1982.
Maximum crown-width equations for
southwestern Oregon tree species.
Forest Research Laboratory, Oregon
State Univer- sity, Corvallis. Research
Paper 46. 20 p.
Reineke, L. H. 1933.
Perfecting a stand-density index for
even-aged forests. Journal of Agricultural Research 46:627-638.
59
Hester, A.S., D.W. Hann, and D.R. Larsen. 1989. ORGANON:
SOUTHWEST OREGON GROWTH AND YIELD MODEL USER
MANUAL. Version 2.0. Forest Research Laboratory, Oregon
State University, Corvallis. 59 p.
The Southwest version of the ORegon Growth ANalysis and
projectiON model is designed to project changes in young-growth
forest stands of mixed conifers in southwest Oregon. Initial
stands should have 80% basal area in Douglas-fir, grand fir,
white fir, ponderosa pine, sugar pine, and incense-cedar. SWORGANON can predict development of both even-age and uneven-age stands. ORGANON is a user-friendly interactive program that will run on any IBM or compatible computer under the
PC-DOS or MS-DOS operating system. The computer system
should consist of two floppy disk drives or a hard disk drive and
one or more floppy disk drives. A math co-processor is recommended but not mandatory.
As an affirmative action institution that complies with Section 504
of the Rehabilitation Act of 1973, Oregon State University supports
equal educational and employment opportunity without regard to age,
sex, race, creed, national origin, handicap, marital status, or religion.
)
OForestry Publications Office
Oregon State University
Forest Research Laboratory 225
Corvallis OR 97331-5708
Address Correction Requested
Non-Profit Org.
U.S. Postage
PAID
Corvallis, OR 97331
Permit No. 200