1
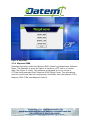
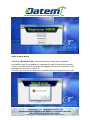
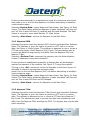
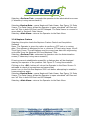
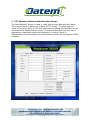
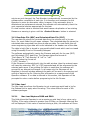
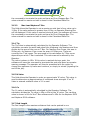
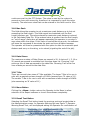
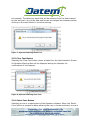
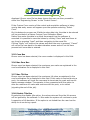
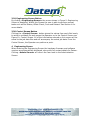
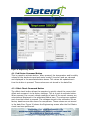
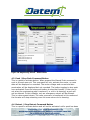
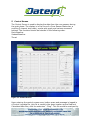
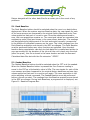
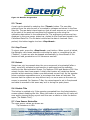
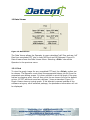
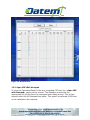
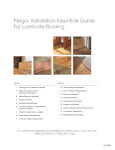
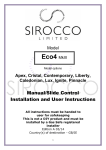
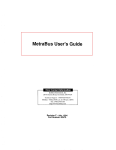
Customer:
Issue No:
Contract No.
6
Issue Date:
18-03-13
Title : Neptune 5000 V6 User Manual
Abstract : This document describes the operation of the Control and Data
Acquisition Software used for the Neptune 5000 CPT Suite.
Three modes of CPT Operation are covered; namely standard
Neptune 5000 5cm2 Digital cone, Neptune 5010 10cm2 Digital
Cone, Neptune 5000 T-Bar and Neptune Custom Third Party 10cm
Cone.
This document is approved for release
Aaron Bromley
Author
This document is approved for use
Martin Steggar
Operations Director
Table of Amendments
Page
Issue
Date
Description of Change
Authorisation
All
Sections
1
21/07/08
Creation of Document.
MS
21
2
25/07/08
Addition of Custom Cone Data Entry
Procedure.
AB
7
3
10/01/11
Addition of Operator PC changes
AB
All
Sections
4
08/10/12
Addition of Software Updates
AB
Multiple
5
14/12/12
Removed references to kPa within T-Bar
AB
Multiple
6
18/3/13
Addition of the changes to the Data Reviewer
AB
Number
Table of Contents
1 Introduction ...................................................................................... 7 1.1 System specifications ................................................................... 7 1.2 Installing the Software ................................................................. 8 2 Starting the Software ......................................................................... 8 2.1 Establishing Communications ........................................................ 8 2.2 CPT Main Menu ...........................................................................10 2.2.1 Neptune 5000 .......................................................................11 2.2.2 Neptune 5010 .......................................................................13 2.2.3 Neptune T-Bar ......................................................................13 2.2.4 Neptune Custom ...................................................................14 3 CPT Operator Software Administration Screen ......................................15 3.1 Project Name .............................................................................16 3.2 Client ........................................................................................16 3.3 Location .....................................................................................16 3.4 Vessel .......................................................................................16 3.5 Client Rep ..................................................................................17 3.6 Operator ....................................................................................17 3.7 Notes ........................................................................................17 3.8 Fix Number ................................................................................18 3.9 Water Depth...............................................................................18 3.10 Push Name ..............................................................................18 3.11 Test Number............................................................................18 3.12 Raw Data File (RDF) and Calculated Data File (CDF) .....................19 3.13 Max Load ................................................................................19 3.13.1 Max Load Neptune 5000 and 5010 ........................................19 3.13.2 Max Load Neptune T-Bar .....................................................20 3.14 Tip .........................................................................................20 3.15 N Value ...................................................................................20 3.16 Cu ..........................................................................................20 3.17 Rod Length ..............................................................................20 3.18 Max Push ................................................................................21 3.19 Data Stores .............................................................................21 3.20 T-Bar ......................................................................................21 3.21 Menu Button ............................................................................21 3.22 Recall Text Button ....................................................................21 3.23 Clear Text Button .....................................................................22 3.24 Select Cone Button ...................................................................22 3.25 Cone Box ................................................................................23 3.26 Max Pore Box ..........................................................................23 3.27 Max Tilt Box ............................................................................23 3.28 Disable Tilts Box ......................................................................23 3.29 Engineering Screen Button ........................................................24 3.30 Control Screen Button...............................................................24 4 Engineering Screen ...........................................................................24 4.1 Pod Status Command Button ........................................................25 4.2 Offset Check Command Button .....................................................25 4.3 Push / Stop Push Command Button ...............................................26 4.4 Retract / Stop Retract Command Button ........................................26 4.5 Tuning Details ............................................................................27 5 Control Screen .................................................................................28 5.1 Deck Baseline .............................................................................29 5.2 Seabed Baseline .........................................................................29 5.3 Thrust .......................................................................................30 5.4 Stop Thrust ................................................................................30 5.5 Retract ......................................................................................30 5.6 Disable Tilts ...............................................................................30 5.7 Cone Sensor Status Bar ...............................................................30 5.8 Strip Chart .................................................................................31 5.9 Polar Plot ...................................................................................31 5.10 Dissipation ..............................................................................31 6 Raw Data Files .................................................................................32 6.1 Project Data ...............................................................................32 6.2 Push Data ..................................................................................32 6.3 Raw Baseline Data ......................................................................32 6.4 Raw Push Data ...........................................................................32 7 Calculated Data File ..........................................................................33 7.1 Project Data ...............................................................................33 7.2 Push Data ..................................................................................33 7.3 Calculated Data ..........................................................................33 8 Raw Deck-To-Deck Data ....................................................................34 9 Control Log File ................................................................................34 10 Calculations ..................................................................................34 10.1 Tip Readings ............................................................................34 10.1.1 Deck Baseline ....................................................................34 10.1.2 Seabed Baseline and During Job ...........................................35 10.2 Sleeve Readings Neptune 5010 and Neptune T-Bar ......................35 10.2.1 Deck Baseline ....................................................................36 10.2.2 Seabed Baseline and During Job ...........................................36 10.3 Sleeve Readings Neptune 5000 ..................................................36 10.3.1 Deck Baseline ....................................................................37 10.3.2 Seabed Baseline and During Job ...........................................37 10.4 Pore Readings ..........................................................................37 10.4.1 Deck Baseline ....................................................................38 10.4.2 Seabed Baseline and During Job ...........................................38 10.5 Tilt X and Tilt Y Readings ..........................................................38 10.5.1 Deck Baseline ....................................................................39 10.5.2 Seabed Baseline .................................................................39 11 Calibration Files .............................................................................40 12 Data Viewer ..................................................................................41 12.1 Print .......................................................................................41 12.2 Open CDF With Notepad............................................................42 12.3 Open RDF With Notepad............................................................43 12.4 Open RD2D With Notepad .........................................................43 12.5 Open CDF With Excel ................................................................43 12.6 Open RDF With Excel ................................................................43 12.7 Open RD2D With Excel ..............................................................43 13 Contacts .......................................................................................44 Table of Figures
Figure
Figure
Figure
Figure
Figure
Figure
Figure
Figure
Figure
Figure
Figure
Figure
Figure
Figure
1: Establishing Communication ....................................................... 9 2: Communication Established .......................................................10 3: Main Menu ...............................................................................11 4: Menu Screen ............................................................................12 5: Tuning Unsuccessful .................................................................12 6: Administration Screen ...............................................................15 7: Operator Warning Recall Text ....................................................22 8: Operator Warning Clear Text .....................................................22 9: Engineering Screen ...................................................................25 10: Engineering Screen – Offset Check ...........................................26 11: Control Screen .......................................................................28 12: Baseline Progress Bar ..............................................................30 13: Data Viewer ...........................................................................41 14: Graph Viewer .........................................................................42 1 Introduction
The Neptune 5000 series MCPT has been designed to operate directly from an
IBM compatible computer (PC) using Datem’s dedicated Neptune 5000 Control
and Acquisition Software Suite. The Software Suite is operated from a
Microsoft Windows™ environment, and comprises 4 main modes. These are
Neptune 5000 5cm² Digital Cone, Neptune 5010 10cm² Cone, Neptune 5000
TBar and Neptune Custom – Third party 10cm Cone.
Transmission between the Topside PC and the Subsea Neptune 5000 series
MCPT can use either standard RS232 protocol at 19,200 baud or Ethernet. The
data is transmitted via a telemetry system housed in the Topside CPT Control
Box to the Subsea System. The telemetry system uses FSK protocol.
1.1 System specifications
The Neptune 5000 Control and Acquisition Software requires a Personal
Computer (PC) that meets the following minimum requirements:
Processor:
Spare Hard Disk Space:
Memory:
Viewing Area:
Graphics:
CD ROM Drive:
Serial Port:
Ethernet Port:
Operating System:
Celeron 500 MHz
1 GB
512MB RAM
1024 x 768
128 MB
To load software
For RS232 communication
For Ethernet communication
Windows XP or Windows Vista
The software has been designed principally to run in a Windows XP / Windows
Vista environment. Whilst the software may operate normally in a Windows 98
environment, we strongly advise against it..
It is highly recommended that Microsoft Excel should be installed on the
Operator PC in order to make full use of the data reviewing facilities.
Before making any changes to the operator PC please consult Datem fully to
ensure the changes will not have an impact on the Neptune Control and Data
Acquisition Software.
1.2 Installing the Software
The Neptune 5000 Control and Acquisition Software is supplied on CD-ROM. To
ensure that installation runs smoothly, it is recommended that you close down
any other programs before running the setup from the disc and remove any
previous installation versions of the software. Insert the Neptune 5000 Control
and Acquisition Software CD into your CD-ROM drive. The disc will
automatically open the installation program. If the disc does not start after a
few seconds, please proceed as follows:
1. Go to the <Start> menu and select the <Run> command
2. Enter the following line: X:\setup.exe, replacing ‘X’ with the letter
assigned to your CD drive (this is usually ‘D’, ‘E’ or ‘F’).
3. Click the <OK> button
The CD will now automatically start. Please follow the On-Screen menu.
2 Starting the Software
Ensure that the desired connection lead from the Neptune 5000 Topside CPT
Control Box is plugged in (either RS232 or Ethernet, if using Ethernet ensure
the IP address range of the operator PC is between 192.168.0.1 and
192.168.0.50, the subnet mask is 255.255.255.0 and the default gateway is
192.168.0.54) to the Operator PC and that all power is switched on.
The default program location for the Neptune 5000 Software is C:\Program
Files\Neptune. In order to access the Acquisition Software select
<Start>, then click on < Programs> and choose the <Neptune>
option.
2.1 Establishing Communications
Upon starting the software the operator will be presented with a screen, this
screen displays the progress of the communication detection. Communication
ports 1 through to 10 will be scanned, after which the Ethernet connection will
be tested. This can be seen in Figure 1 below. Figure 2 shows the successful
communication screen.
Figure 1: Establishing Communication
Figure 2: Communication Established
Failed communication occurs if data is not received during a communication
test, this could be due to an incorrectly installed RS232 port or wrongly
configured Ethernet port. Upon unsuccessful communication the software will
still allow the operator to proceed but only to enable them to view data from
previous jobs within the Data analysis screen.
2.2 CPT Main Menu
Once the communications test is complete (successfully or unsuccessfully), the
Operator is shown the Main Menu Screen. This menu gives the Operator a
choice of which software to run, Neptune 5000, Neptune 5010 or Neptune
5000 T-Bar. See Figure 3: Main Menu.
Selecting the <Exit> option will terminate the program, returning the
Operator to the Microsoft Windows operating environment.
Figure 3: Main Menu
2.2.1 Neptune 5000
Selecting this option loads the Neptune 5000 Control and Acquisition Software
Menu. The Operator is given the option to perform a CPT test or to review
data. See Figure 4: Menu. This software is designed to run or review a
CPT test using standard 5cm2 Neptune 5000 Digital Cones. The calculations
used to convert raw data into engineering units differ from the Neptune 5010,
Neptune 5000 T-Bar and Neptune Custom.
Figure 4: Menu Screen
Selecting <Perform Test> checks that auto-tuning was completed
successfully and if succeeded will navigate the user to the Administration
Screen, if unsuccessful a message will appear informing the operator. This
message can be seen in Figure 5.
The user can view the successful tuning details within the Engineering screen.
Figure 5: Tuning Unsuccessful
If tuning was unsuccessful it is advisable to check all connections and ensure
that power is on to the Sub Sea Neptune unit before attempting to establish
communication again.
Selecting<Review Data> opens Neptune’s Data Viewer. See Figure 13: Data
Viewer. The Data Viewer allows the Operator to open calculated ‘cdf’ files and
raw ‘rdf’ files in both MS Excel (if installed) and Microsoft Notepad. The Data
Viewer is covered in more detail Section 10: Data Viewer.
Selecting <Main Menu> returns the Operator to the Main Menu.
2.2.2 Neptune 5010
Selecting this option loads the Neptune 5010 Control and Acquisition Software
Menu. The Operator is given the option to perform a CPT test or to review
data. See Figure 4: Menu Screen. This software is designed to run or review a
CPT test using larger 10cm2 Neptune 5010 Cones. The calculations used to
convert raw data into engineering units differ from the Neptune 5000 and
Neptune T-Bar.
Selecting <Perform Test> advances the operator onto the Administration
screen (if telemetry tuning was successful)
If tuning was not established successfully a dialogue box will be displayed
warning the operator of the problem. See Figure 5: Tuning Unsuccessful.
Clicking on the <OK> button will return the Operator to the Menu Screen. It
advisable to check all connections and ensure that
power is on to the Sub Sea Neptune 5000 unit before attempting to establish
communications again.
Selecting<Review Data> opens Neptune’s Data Viewer. See Figure 13: Data
Viewer. The Data Viewer allows the Operator to open calculated ‘cdf’ files and
raw ‘rdf’ files in both MS Excel and MS Notepad.
Selecting <Main Menu> returns the Operator to the Main Menu.
2.2.3 Neptune T-Bar
Selecting this option loads the Neptune T-Bar Control and Acquisition Software
Menu. The Operator is given the option to perform a CPT test or to review
data. This software is designed to run or review a CPT test using Neptune TBar Cones. The calculations used to convert raw data into engineering units
differ from the Neptune 5000 and Neptune 5010. The System also records data
while retracting.
Selecting <Perform Test> proceeds the operator to the administration screen
(if telemetry tuning was successful).
Selecting<Review Data> opens Neptune’s Data Viewer. See Figure 13: Data
Viewer. The Data Viewer allows the Operator to open calculated ‘cdf’ files and
raw ‘rdf’ files in both MS Excel and MS Notepad. The Data Viewer is covered in
more detail in Section9: Data Viewer.
Selecting <Main Menu> returns the Operator to the Main Menu.
2.2.4 Neptune Custom
Selecting this option loads the Neptune Custom Control and Acquisition
Software
Menu. The Operator is given the option to perform a CPT test or to review
data. This software is designed to run or review a CPT test using larger 10cm2
Third Party Cones. The calculations used to convert raw data into engineering
units differ from the Neptune 5000 and Neptune T-Bar.
Selecting <Perform Test> advances the operator onto the Administration
screen (if telemetry tuning was successful)
If tuning was not established successfully a dialogue box will be displayed
warning the operator of the problem. See Figure 5: Tuning Unsuccessful.
Clicking on the <OK> button will return the Operator to the Menu Screen. It
advisable to check all connections and ensure that
power is on to the Sub Sea Neptune 5000 unit before attempting to establish
communications again.
Selecting<Review Data> opens Neptune’s Data Viewer. See Figure 13: Data
Viewer. The Data Viewer allows the Operator to open calculated ‘cdf’ files and
raw ‘rdf’ files in both MS Excel and MS Notepad.
Selecting <Main Menu> returns the Operator to the Main Menu.
3 CPT Operator Software Administration Screen
The Administration Screen is used to input both project data and push data.
The project data will relate to a number of CPT pushes. The push data will
relate to one push. When a CPT push has been completed, the Operator will be
returned to the Administration Screen. This administration screen will vary in
appearance, dependent upon which software is running. Figure 6:
Administration Screen displays the Administration Screen for the Neptune 5000
software.
Figure 6: Administration Screen
3.1 Project Name
The Project Name can be entered in this section. The data entered is stored in
the header section of both the raw and calculated data files for each push and
is intended to help in the identification of the data. The Project Name can be
entered using any alphanumeric characters. The use of other characters,
specifically forward slash and back slash symbols has been prohibited. This is
because some of the fields form part of the path and filename for the raw data
and calculated data files. If invalid characters are entered, an Operator
Warning Box will be displayed. Entering the Project Name information is at the
discretion of the Operator. The software will still function correctly if no data is
entered in this section. If no data is entered, the corresponding section of the
push data files will be left blank.
3.2 Client
The Client’s Name can be entered in this section. The data entered is stored in
the header section of both the raw and calculated data files for each push and
are intended to help in the identification of the data. The Client’s Name can be
entered using any alphanumeric characters. The use of other characters,
specifically forward slash and back slash symbols has been prohibited. This is
because some of the fields form part of the path and filename for the raw data
and calculated data files. Entering the Client Name information is at the
discretion of the Operator. The software will still function correctly if no data is
entered in this section. If no data is entered, the corresponding section of the
push data files will be left blank.
3.3 Location
The Location Name must be entered in this section. The data entered is stored
in the header section of both the raw and calculated data files for each. The
Location Name is also used as the name for the destination folder of the push
data files. The Location Name must be entered using any alphanumeric
characters. The use of other characters, specifically forward slash and back
slash symbols has been prohibited, because the field forms the pathname for
the raw data and calculated data files. Entering this information is a
requirement of the Operator software. If no data is entered in this section, the
Operator will be prompted to enter a value before progressing to the Job
Screen.
3.4 Vessel
The Vessel Name can be entered in this section. The data entered is stored in
the header section of both the raw and calculated data files for each push and
is intended to help in the identification of the data. The Vessel Name can be
entered using any alphanumeric characters. The use of other characters,
specifically forward slash and back slash symbols has been prohibited. This is
because some of the fields form part of the path and filename for the raw data
and calculated data files. Entering the Vessel Name is at the discretion of the
Operator. The software will still function correctly if no data is entered in this
section. If no data is entered the corresponding section of the push data files
will be left blank.
3.5 Client Rep
The Client Rep’s Name can be entered in this section. The data entered is
stored in the header section of both the raw and calculated data files for each
push and is intended to help in the identification of the data. The Client Rep’s
Name can be entered using any alphanumeric characters. The use of other
characters, specifically forward slash and back slash symbols has been
prohibited. This is because some of the fields form part of the path and
filename for the raw data and calculated data files. Entering the Client Rep’s
Name is at the discretion of the Operator. The software will still function
correctly if no data is entered in this section. If no data is entered the
corresponding section of the push data files will be left blank.
3.6 Operator
The Operator’s Name can be entered in this section. The data entered is stored
in the header section of both the raw and calculated data files for each push
and is intended to help in the identification of the data. The Operator’s Name
can be entered using any alphanumeric characters. The use of other
characters, specifically forward slash and back slash symbols has been
prohibited. This is because some of the fields form part of the path and
filename for the raw data and calculated data files. Entering the Operator’s
Name is at the discretion of the Operator. The software will still function
correctly if no data is entered in this section. If no data is entered the
corresponding section of the push data files will be left blank.
3.7 Notes
This field allows the entry of any notes that the Operator may wish to enter
that could aid interpretation of the job data at a later time.
3.8 Fix Number
The Fix Number is stored in the header section of both the raw and calculated
data files for each push and is intended to help in the identification of the data.
The Fix Number can be entered using any alphanumeric characters. The use of
other characters, specifically forward slash and back slash symbols has been
prohibited. This is because some of the fields form part of the path and
filename for the raw data and calculated data files. Entering this information is
at the discretion of the Operator. The software will still function correctly if no
data is entered in this section. If no data is entered the corresponding section
of the push data files will be left blank.
3.9 Water Depth
The Water Depth is stored in the header section of both the raw and calculated
data files for each push and is intended to help in the identification of the data.
The Water Depth can be entered using numeric characters. The Value should
be an integer, i.e. with no decimal places. If a non numeric character is
entered, an Operator Warning will be displayed. Entering this information is at
the discretion of the Operator. The software will still function correctly if no
data is entered in this section. If no data is entered the corresponding section
of the push data files will be left blank.
3.10 Push Name
The Push Name is stored in the header section of both the raw and calculated
data files for each push and is intended to help in the identification of the data.
The Bore Hole number forms the first part of the filename for the raw data and
calculated data files, and can be entered using alphanumeric characters. The
use of forward slash and back slash symbols has been prohibited. Entering this
information is a requirement of the Operator software. If no data is entered in
this section, the Operator will be prompted to enter a value before progressing
to the Job Screen.
3.11 Test Number
The Test Number is stored in the header section of both the raw and calculated
data files for each push and is intended to help in the identification of the data.
The Test Number forms the second part of the filename for the raw data and
calculated data files, and can be any four digit number in the range 0000 –
9999. If a non-numeric character is entered, an Operator Warning will be
displayed.
The Test Number is set to 0001 on installation of the software and whenever
the Location or Push Name entries are changed. If the Location and Push Name
entries are not changed, the Test Number is automatically incremented by the
software after completion of each job. It is therefore not necessary for the
Operator to enter an alternative value, however, if the automatic entry is
deleted and no replacement entered, the software will automatically insert the
next sequential number appropriate for the test.
If a test number value is entered that would cause a duplication of an existing
filename no warning is given until the <Control Screen> button is selected.
3.12 Raw Data File (RDF) and Calculated Data File (CDF)
The raw data file stores the received data from the sub sea unit in its raw
form. For most fields this will mean voltages. The calculated data file stores the
calculated data computed from the sub-sea raw data. For most fields this will
mean engineering type data with units indicated in the header row of the data.
The data in both files is stored in comma delimited format which can be viewed
using Microsoft® Excel or Microsoft® Notepad.
The software automatically inserts the filename and path for the raw (RDF)
and Calculated (CDF) data files. The filename takes the format of:
“Push Name” & “Test Number” & “.rdf” or “.cdf”
The path takes the format of:
C:\CPT\”Location”\
If the filename is entered directly into the edit window, then the entered name
will have the extension .RDF (or .CDF) appended and will be referenced to the
selected path name. If an existing file name is used then the software will
prompt for an alternative filename. In all cases only the filename will be
displayed in the edit window although the path will be used in the opening and
writing of data to the file. Entering this information is a requirement of the
Operator software. If no data is entered in this section, the Operator will be
prompted to enter a value before progressing to the Job Screen.
3.13 Max Load
The Max Load box allows the Operator to set a maximum axial load in kg for
the Subsea Unit to apply when thrusting. This value differs for each of the
software packages.
3.13.1
Max Load Neptune 5000 and 5010
This field allows the Operator to set a maximum axial load of any value up to
3500kg. If the value entered is greater than 3500kg, an Operator Warning Box
will be displayed. If this value is reached during a push, the software will issue
the command to terminate the push and issue an Error Message Box. The
value entered for maximum load is stored in the Calculated Data File.
3.13.2
Max Load Neptune T-Bar
This field allows the Operator to set a maximum axial load of any value up to
112kg. If the value entered is greater than 112kg, an Operator Warning Box
will be displayed. If this value is reached during a push, the software will issue
the command to terminate the push and issue an Error Message Box. The
value entered for maximum load is stored in the Calculated Data File.
3.14 Tip
The Tip Value is automatically calculated by the Operator Software. The
calculation converts the axial load value from kilograms into Newtons and then
divides by the area of the cone or T-Bar. For Neptune 5cm Cones, the area is
500sq.mm, for Neptune 10cm cones the area is 1000sq.mm. There are
currently two T bar cones. The area used in this calculation for T-Bar cones
depends upon which T Bar is selected. This value cannot be altered by the
Operator.
The value is shown in MPa. If this value is reached during a push, the
software will issue the command to terminate the push and issue an operator
warning message. The operator will then be presented with the option to
change the maximum tip value and continue, or simply to retract (signaling the
end of the job).
3.15 N Value
This field allows the Operator to enter an approximate ‘N’ value. This value is
used to determine an approximation of undrained shear strength. If no ‘N’
Value is entered a default value of 11 is used.
3.16 Cu
The Cu value is automatically calculated by the Operator Software. The
calculation divides the Tip value in MPa or kPa by the ‘N’ value. The resulting
value is shown in kPa for the T-Bar software and in MPa for the Neptune 5000
and Neptune 5010 software.
3.17 Rod Length
The Rod Length is the maximum distance that can be pushed in one
continuous push by the CPT System. The value is used by the system to
prevent an over push occurring, therefore it is important to input this value
correctly. The maximum value that can be entered in this field is set to 20m.
3.18 Max Push
This field allows the operator to set a maximum push distance up to but not
exceeding the Rod Length. This field cannot be completed until the Rod
Length has been set. The value entered for maximum push distance is stored
in the Calculated Data File. If the entered value is greater than the Rod Length,
an “out of range” dialog box will appear requesting the operator to re-enter a
new value within the range. If this value is reached during a push, the software
will issue the command to terminate the push and issue a status message.
The operator will then be presented with the option to alter the maximum push
distance and carry on thrusting, or to retract (signaling the end of the job).
3.19 Data Stores
The maximum number of Data Stores per second is 20. A choice of 1, 5, 10 or
20 records per second is available from the drop down list. Choosing 1 will
write one line of data per second to the data files. Choosing 5 will write five
lines of data per second to the data files.
3.20 T-Bar
There are currently two sizes of T-Bar available. The larger T-Bar is for use in
soils with a maximum shear strength of 20kPa (assuming an ‘N’ value of 11).
The smaller T-Bar is for use in soils with a maximum shear strength of 40kPa
(also assuming an ‘N’ value of 11).
3.21 Menu Button
Clicking the <Menu> button returns the Operator to the Menu to allow
selection of the Report software or to exit the software completely.
3.22 Recall Text Button
Selecting the Recall Text button loads the previous push and project data to
the Administration screen. An Operator Warning Box see Figure 7: Operator
Warning Recall Text, will be displayed asking the Operator for confirmation of
this request. The data from each field will be restored from the data entered
for the last push. Any of the data entries can be changed as necessary before
clicking on the next button to continue working.
Figure 7: Operator Warning Recall Text
3.23 Clear Text Button
Selecting the Clear Text button clears all data from the Administration Screen.
An Operator Warning Box will be displayed asking the Operator for
confirmation of this request.
Figure 8: Operator Warning Clear Text
3.24 Select Cone Button
Selecting a cone is a requirement of the Operator software. When the ‘Select
Cone’ button is pressed a dialog allowing the user to locate and select a cone is
displayed. Once a cone file has been chosen the user can then proceed to
either the ‘Engineering Screen’ or the ‘Control Screen’.
If the Custom Cone version of the control and acquisition software is being
used a data entry screen will appear upon the operator selecting “Select
Cone”.
On this data entry screen are 8 fields to enter data into, the data to be entered
will be provided on a Datem Custom Cone Calibration Sheet.
Rather than enter the data in multiple times each time the software is
executed it is possible to save the values by clicking “Save” and load them at
any time by pressing “Load” and then navigating to the saved file.
Clicking “Apply” will confirm the values and allow the user to proceed, “Cancel”
will return the user back to the administration screen and will not let them
proceed until cone data is entered.
3.25 Cone Box
Once a cone has been selected, the cone number is displayed in this field.
3.26 Max Pore Box
Once a cone has been selected, the maximum pore value as registered in the
cone’s calibration file is displayed in this field.
3.27 Max Tilt Box
Once a cone has been selected, the maximum tilt value as registered in the
cone’s calibration file is displayed in this field. If this value is reached during a
push, the software will issue the command to terminate the push and issue a
status message window. The operator is then presented with the option to
alter the maximum tilt value and continue with the push, or to retract
(signaling the end of the job).
3.28 Disable Tilts Box
By selecting the disable tilts option, the values returned from the tilt sensors
will be ignored by the software. In this mode the system will continue to push
Irrespective of tilt deviation. If the option is not ticked then the user has the
ability to do so during a push.
3.29 Engineering Screen Button
By clicking <Engineering Screen> the screen shown in Figure 9: Engineering
Screen is displayed. Within this Screen the user is able to perform manual
tasks such as Pod Status, Offset Check, Push and Retract. See Section 4 for
more details.
3.30 Control Screen Button
Clicking the <Control Screen> button stores the values from each field ready
to write to a default file and moves the Operator on to the Control Screen see
Figure 10: Control Screen. All of the information entered on this screen will be
saved to the job data files and will accompany the actual job data. From the
Control Screen, the Operator can perform a push.
4 Engineering Screen
When entering the Engineering Screen the hardware firmware and software
versions are automatically displayed, along with full contact details for Datem.
Clicking <Admin Screen> will return the user back to the Administration
Screen.
Figure 9: Engineering Screen
4.1 Pod Status Command Button
This is a push to activate button. When pressed, the temperature and humidity
values for the electronics pod and motor control (inverter) pod are returned
and displayed in the associated status boxes. The values are updated each
time the button is pressed. These values are not stored in the data files.
4.2 Offset Check Command Button
The offset check button allows the operator to quickly check the cones initial
offset and compare it to its factory settings. This is a push to activate button.
When pressed, the current voltage readings of each of the cone’s sensors are
returned and displayed in the associated status bars. The values are updated
each time the button is pressed. The voltages stored in the calibration file as
factory baselines are also shown for comparison. These values are not stored
in the data files. Figure 10 shows the Engineering screen after the Pod Status
check has been performed.
Figure 10: Engineering Screen – Offset Check
4.3 Push / Stop Push Command Button
This is a push to activate button. When pressed the Manual Push command is
sent to the sub-sea unit. This command will only activate the motor, no cone
data will be displayed or recorded. The motor voltage and current and also
penetration will be displayed but not recorded. The button toggles to stop push
once activated. Press the stop push button to stop the thruster. If the cone is
out when the engineering page is entered (i.e. not in its housing) a push will
not be allowed. In this instance, only an emergency retract will be allowed.
This is a slow speed retract. The cone up sensor is monitored in this mode and
the thruster will stop retracting once the cone returns to its housing.
4.4 Retract / Stop Retract Command Button
This is a push to activate button and will not be activated until a push has been
made or unless the cone is not in its housing. When pressed the retract
command is sent to the sub-sea unit. The button toggles to stop retract once
activated. Press the stop retract button to stop the thruster. The cone up
sensor and encoder counter are monitored in this mode and the thruster will
stop retracting once the cone returns to its housing.
4.5 Tuning Details
The tuning details section of the Engineering allows the operator to see a brief
report of the tuning carried out once the unit was powered. Both levels and
quality for subsea and topside are displayed along with a completion code.
[2] Excellent Tuning.
[1] Acceptable Tuning (borderline). Could be due to cable length.
5 Control Screen
The Control Screen is used to display the data from the cone sensors during
the push phase. The display is in the form of a Cone Sensor Status bar, a
scrolling 3-channel strip chart, a polar plot graph and various command
buttons. The functions should be selected in the following order.
Deck Baseline
Seabed Baseline
Thrust
Figure 11: Control Screen
Upon entering the control screen every button press and message is logged in
a Control Log data file, this file is saved in the same location as the Raw and
Calculated data files, with the extension “.CLog”. This file would be analysed by
Datem alongside all the other data files for a certain job in the event of any
problems.
5.1 Deck Baseline
The Deck Baseline button should be selected when the cone is on deck before
deployment. When the system acquires Baseline data, the raw signals for each
of the cone sensors are compared to the original factory Baselines and a Tare
value applied so that each is re-set to zero. Once the readings are tared to
zero, the cone acquisition remains on. The raw signal values are converted into
engineering units (Mpa) and shown in the cone sensor status bar. The readings
are displayed during deployment of the tool and would normally increase due
to the effects of hydrostatic pressure on the cone. The initial readings from the
Deck Baseline acquisition are stored in the RDF as voltages. The Deck Baseline
must be performed before any other functions are selected. Upon the deck
baseline being completed a raw deck-to-deck data file is created and written to
once per second for the duration of the job until the unit is back onto the deck
(after the push), this file is stored in the same location as both the Raw and
Calculated data files but with the file extension “.RD2D”.
5.2 Seabed Baseline
The Seabed Baseline button should be selected when the CPT is at the seabed.
When the Seabed Baseline button is pressed the Pore Pressure reading is
saved in the CDF as a Hydrostatic value in MPa. The raw signals for each of the
cone sensors are then compared to the original factory baselines and new tare
values applied so that each is re-set to zero again. The cone acquisition is left
active awaiting a thrust command. The Seabed Baseline must be performed
before a thrust can start. The readings from the Baseline acquisition are stored
in the RDF as voltages. During both Baselines, a progress bar is displayed, see
Figure 11: Baseline Progress Bar.
Figure 12: Baseline Progress Bar
5.3 Thrust
A push can be started by selecting the <Thrust> button. The raw data
received from the sub-sea unit is converted to voltages and stored in the Raw
Data file. The raw data is tared again so that all cone sensors are re set to zero
at the start of the push and converted to Engineering units using the
calibration data stored in the calibration file. The engineering values are then
displayed in the cone sensor status bar, plotted to the Graph and stored to the
Calculated Data File. The file data is stored as the data is received. Once
pushed, this button toggles to show <Stop thrust>.
5.4 Stop Thrust
To stop a push, press the <Stop thrust> push button. When a push is halted,
the Operator can choose between continuing the push or completing the job
(‘Retract’). A push can also be stopped automatically by the software if the
maximum load, penetration or tilt values are reached.
5.5 Retract
Retract can only be pressed when the cone movement is terminated (after a
stop), once fully retracted a post baseline is performed and the software
returns to the Administration Screen. For Neptune 5000 and Neptune 5010 the
retract function has three speeds. Initially the thruster will retract as fast as
possible whilst remaining inside a pre determined current limit. As the encoder
pulse countdown approaches zero, a two stage slow down will activate. This
ensures that the system can stop without any run on as soon as the cone up
sensor is operated. For Neptune T-Bar, the retract speed is set to 2cm/second
and data is recorded in the same way as it is during the push phase.
5.6 Disable Tilts
This button is enabled only if the operator proceeded from the Administration
screen without disabling the tilts. When this button is pressed the tilt value will
zero and be ignored during a push until the user re-starts or clicks the button
again (“Re Enable Tilts”).
5.7 Cone Sensor Status Bar
The cone sensor values are shown as:
Tip Resistance in MPa
Sleeve Friction in MPa
Excess Pore Pressure, Δu, in MPa
Cone Tilt (x and y planes) in degrees
Penetration in metres
During each push, the Penetration, Tip Resistance and Cone Tilt are compared
with the push parameters entered on the Administration Screen. If any of
these values are reached, a warning message will be issued and the push
phase terminated. The data is saved to a file instantly after being received.
5.8 Strip Chart
The strip chart displays the three data series Pore Pressure, Sleeve Resistance
and Tip Resistance against Penetration depth. The graph is updated at
intervals of 2cm penetration (once per second). It is possible to zoom in on
each plot by a factor of ten. To do this single click on either the Tip, Sleeve or
Pore graph. Clicking again on these graphs will return the plots to the standard
view. If no pore sensor is fitted to the cone then the space available on the
screen will be used by the Tip and Sleeve graphs.
5.9 Polar Plot
The polar plot graph displays the Cone Tilt from the central vertical. The plot
position is taken from the Cone X and Cone Y deviations. Positive X is taken as
the East Co-Ordinate, positive Y is taken as the North Co-Ordinate.
5.10 Dissipation
A dissipation test can be performed during a push by selecting the
<Dissipation> button. The software continues recording and saving the cone
data. The data is stored to the data files in the usual manner. When <Stop
dissipation> is selected the thrusting will continue.
6 Raw Data Files
The Raw Data File is made up of four components; the Project Data, the Push
data, the Baseline Data and the Raw Push Data.
6.1 Project Data
The Project Data has the following format:
Project Name, Client Name, Location, Vessel, Client, Operator, Cone Data, File
Name, Notes.
6.2 Push Data
The Push Data has the following format:
Fix Number, Water Depth, Push Name, Test Number, Raw Data File, Calculated
Data File, Max Tip, Max Incline, Max Push, Tip Area, N Value.
6.3 Raw Baseline Data
The Baseline Data has the following format for Deck, Seabed and Post test
Baselines:
Raw voltage readings from Tip, Sleeve, Pore, Tilt X, Tilt Y.
The post test baseline is appended after the actual push data.
6.4 Raw Push Data
The Raw Push Data has the following format:
Time Stamp, Penetration (m), Tip (V), Sleeve (V), Pore (V), TiltX (V), TiltY (V),
AltA (m), AltB (m), Volts (V), Current (A), HS Depth (m), Frame Incline X (V),
Frame Incline Y (V).
7 Calculated Data File
The Calculated Data file is made up of three components, The Project Data, the
Push Data and the Calculated Data.
7.1 Project Data
The Project Data has the following format;
Project Name, Client Name, Location, Vessel, Client, Operator, Cone Data File
Name, Notes.
7.2 Push Data
The Push Data has the following format:
Fix Number, Water Depth, Push Name, Test Number, Raw Data File, Calculated
Data File, Max Tip, Max Incline, Max Push, Tip Area, N Value, Tip Area Factor,
Hydrostatic Pressure (MPa).
7.3 Calculated Data
The Calculated Data has the following format:
Timestamp, Penetration(m), Tip (MPa Qc), Cu (MPa), Sleeve (MPa), Excess
Pore (MPa), TiltX (Degrees), TiltY (Degrees), Combined Tilt (Degrees), AltA
(m), AltB (m), Volts (V), Current (A), HS Depth (m), Frame Incline X
(Degrees), Frame Incline Y (Degrees).
8 Raw Deck-To-Deck Data
The raw deck-to-deck data file is a file created upon performing the “Deck
Baseline”, it is then written to once per second until the job has been
completed and the Neptune system is back onto the deck.
The format is shown below:
Timestamp, Penetration(m), Tip, Sleeve, Pore, Tilt X, Tilt Y, Current (A)
9 Control Log File
The control log file is activated once the operator is within the control screen,
any key press, both manual or automatic and any messages to the operator
during a job will be stored within this file along with the time-stamp, this file is
purely for use by Datem and will assist in any fault finding.
10 Calculations
10.1 Tip Readings
The raw Tip value is recorded during the Deck Baseline and a baseline value is
calculated which Tares the Tip sensor back to it’s no load position, i.e. zero
MPa. This zero value is displayed on the cone sensor status bar. The data
acquisition system stays active during deployment. During deployment, the Tip
values which will increase due to hydrostatic pressure effects are converted to
MPa and displayed in the cone sensor status bar. The following
formulae are followed to convert raw data into calculated data. When the
Seabed Baseline is selected, a new baseline value is calculated such that the
Tip sensor is again returned to zero before the CPT push.
10.1.1
Deck Baseline
Tip Reading on Deck (V) * Calibration factor (kN/V)
Tip Reading (V)
Tip Reading (kN)
New Tip Reading (kN)
* Calibration factor (kN/V)
- Deck Baseline Tip (kN)
* 1000 N/kN
=Deck Baseline Tip (kN)
=Tip Reading (kN)
=New Tip Reading (kN)
=Tip (N)
Tip (N)
Note:
Tip Area
Tip Area
Tip Area
Tip Area
10.1.2
/ Tip Area (mm2)
Neptune
Neptune
Neptune
Neptune
=Qc (Mpa)
5000 Cone = 500mm2
5010 Cone = 1000mm2
T Bar Small = 2501mm2
T Bar Large = 4992mm2
Seabed Baseline and During Job
Tip Reading Seabed (V)
* Calibration factor (kN/V)
=Seabed B/line Tip (kN)
Tip Reading (V)
* Calibration factor (kN/V)
=Tip Reading (kN)
Tip Reading (kN)
New Tip Reading (kN)
- Seabed Baseline Tip (kN)
* 1000 N/kN
=New Tip Reading (kN)
=Tip (N)
Tip (N)
/ Tip Area (mm2)
=Qc (Mpa)
Note: 1MPa = 1N/mm2
The Qc value is displayed on the graph and in the Tip sensor box on the cone
sensor status bar. This value is used for comparing to the max permissible Tip
resistance. The values are stored in the RDF file as Volts and as MPa in the
CDF data file.
10.2 Sleeve Readings Neptune 5010 and Neptune T-Bar
The raw Sleeve value is recorded during the Deck Baseline and a baseline
value is calculated which Tares the Sleeve sensor back to it’s no load position,
i.e. zero MPa. This zero value is displayed on the cone sensor status bar. The
data acquisition system stays active during deployment. During deployment,
the Sleeve values will increase due to hydrostatic pressure effects and are
converted to MPa and displayed in the cone sensor status bar.
The following formulae are followed to convert raw data into calculated data.
When the Seabed Baseline is selected, a new Sleeve baseline value is
calculated such that the Sleeve sensor is again returned to zero before the CPT
push.
10.2.1
Deck Baseline
Sleeve Reading Deck (V) * Calibration factor (kN/V) =Deck B/line Sleeve (kN)
Sleeve Reading (V)
Sleeve Reading (kN)
New Sleeve (kN)
Sleeve (N)
10.2.2
* Calibration factor (kN/V)
- Deck Baseline Sleeve (kN)
* 1000 N/kN
/ 15000 (mm2)
=Sleeve Reading (kN)
=New Sleeve (kN)
=Sleeve (N)
=Sleeve (Mpa)
Seabed Baseline and During Job
Sleeve Seabed (V)
(kN)
* Calibration factor (kN/V)
=Sea b/line Sleeve
Sleeve Reading (V)
* Calibration factor (kN/V)
=Sleeve Reading (kN)
Sleeve Reading (kN)
- Sea Baseline Sleeve (kN)
=New Sleeve (kN)
New Sleeve (kN)
* 1000 N/kN
=Sleeve (N)
Sleeve (N)
Note: 1MPa = 1N/mm2
/ 15000 (mm2)
=Sleeve (Mpa)
The Sleeve value is displayed on the graph and in the Sleeve sensor box on the
cone sensor status bar. The values are stored in the RDF file as volts and as
MPa in the CDF data file.
The Sleeve readings relate to soil that is 79mm behind the Tip sensor and so
the Sleeve data should be shifted back by 79mm so that it relates to the
correct penetration depth when post processing the data.
10.3 Sleeve Readings Neptune 5000
The raw Sleeve value is recorded during the Deck Baseline and a baseline
value is calculated which Tares the Sleeve sensor back to it’s no load position,
i.e. zero MPa. This zero value is displayed on the cone sensor status bar. The
data acquisition system stays active during deployment. During deployment,
the Sleeve values will increase due to hydrostatic pressure effects and are
converted to MPa and displayed in the cone sensor status bar. The following
formulae are followed to convert raw data into calculated data. When the
Seabed Baseline is selected, a new Sleeve baseline value is calculated such
that the Sleeve sensor is again returned to zero before the CPT push. The
Neptune 5000 cone is a non-subtraction type.
10.3.1
Deck Baseline
Sleeve Reading Deck (V)
(kN)
Sleeve Reading (V)
Sleeve Reading (kN)
New Sleeve (kN)
Sleeve (N)
10.3.2
* Calibration factor (kN/V)
* Calibration factor (kN/V)
=Deck B/line Sleeve
=Sleeve Reading (kN)
- Deck Baseline Sleeve (kN) =New Sleeve (kN)
* 1000 N/kN
/ 500 (mm2)
=Measured Sleeve (N)
=Sleeve (Mpa)
Seabed Baseline and During Job
Sleeve Seabed (V)
* Calibration factor (kN/V)
=sea b/line Sleeve (kN)
Sleeve Reading (V)
* Calibration factor (kN/V)
=Sleeve Reading (kN)
Sleeve Reading (kN)
- Sea Baseline Sleeve (kN)
=New Sleeve (kN)
New Sleeve (kN)
* 1000 N/kN
=Measured Sleeve (N)
Sleeve (N)
/ 500 (mm2)
Note: 1MPa = 1N/mm2
=Sleeve (Mpa)
The Sleeve value is displayed on the graph and in the Sleeve sensor box on the
cone sensor status bar. The values are stored in the RDF file as volts and as
MPa in the CDF data file.
The Sleeve readings relate to soil that is 79mm behind the Tip sensor and so
the Sleeve data should be shifted back by 79mm so that it relates to the
correct penetration depth when post processing the data.
10.4 Pore Readings
The raw Pore value is recorded during the Deck Baseline and a baseline value
is calculated which Tares the Pore sensor back to it’s “in air” no pressure
position, i.e. zero MPa. This zero value is displayed on the cone sensor status
bar. The data acquisition system stays active during deployment. During
deployment, the Pore values (increased due to hydrostatic pressure effects)
are converted to MPa and displayed in the cone sensor status bar. The
following formulae are followed to convert raw data into calculated data. When
the Seabed Baseline is selected, the measured Pore value is stored in the CDF
file as Hydrostatic Pressure (MPa) and a new Pore baseline value is calculated
such that the Pore sensor is again returned to zero before the CPT push.
10.4.1
Deck Baseline
Pore Reading Deck (V) * Calibration factor (MPa/V) =Deck B/line Pore (MPa)
Pore Reading (V)
* Calibration factor (MPa/V) =Pore Reading (MPa)
Pore Reading (MPa)
- Deck Baseline Pore (MPa)
10.4.2
=New Pore (MPa)
Seabed Baseline and During Job
Pore Seabed (V)
* Calibration factor (MPa/V) =sea b/line Pore (MPa)
Pore Reading (V)
* Calibration factor (Mpa/V) =Pore Reading (Mpa)
Pore Reading at Seabed Saved as Uo, Hydrostatic Pressure
Pore Reading (Mpa)
- Sea Baseline Pore (MPa)
=New Pore Δu, (MPa)
Note:
1MPa = 10bar.
1 bar is approximately equal to the pressure generated by 10m water depth.
Δu is also referred to as excess pore or generated pore.
The Δu value is displayed on the graph and in the Pore sensor box on the cone
sensor status bar. The values are stored in the RDF file as volts and as MPa in
the CDF data file.
10.5 Tilt X and Tilt Y Readings
The raw Tilt values are recorded during the Deck Baseline and baseline values
are calculated which tare the Tilt sensors back to the vertical position, i.e. zero
degrees. A combined Tilt Angle is calculated as the hypotenuse value of the X
and Y tilt values. This zero value is displayed on the cone sensor status bar.
The data acquisition system stays active during deployment. During
deployment, the Tilt values are converted to degrees and the combined tilt
Angle displayed in the cone sensor status bar. The following formulae are
followed to convert raw data into calculated data. When the Seabed Baseline is
selected, new Tilt baseline values are then calculated such that the combined
Tilt Angle is returned to zero before the CPT push.
10.5.1
Deck Baseline
Tilt Reading Deck (V)
* Calibration factor (deg/V)
=Deck B/line Tilt deg
Tilt Reading (V)
* Calibration factor (deg/V)
=Tilt Reading (deg)
Tilt Reading (deg)
- Deck Baseline Tilt (deg)
=New Tilt (deg)
10.5.2
Seabed Baseline
Tilt Seabed (V)
* Calibration factor (deg/V)
=sea b/line Tilt (deg)
Tilt Reading (V)
* Calibration factor (deg/V)
=Tilt Reading (deg)
Tilt Reading (deg)
- Sea Baseline Tilt (deg)
=New Tilt (deg)
√((Tilt X)2 + (Tilt Y2)) = Combined Tilt Angle (degrees)
The combined tilt angle value is displayed on the polar graph and in the Tilt
sensor box on the cone sensor status bar. The values are stored in the RDF file
as Volts and as degrees in the CDF data file. The display is formatted to integer
values only.
11 Calibration Files
The calibration file contains data for each of the cone sensors, the date
calibrated, the Tip area factor and an indication of which sensors are fitted to
the cone. The calibration file is stored within the digital cone.
The sensor calibration data comprises cone bits against applied load in
kilograms at a zero load point, a full load point and an intermediate point. Each
of these three points is calculated from a best fit line which represents the data
points recorded during a factory calibration. The Tip area factor is derived from
pressure testing in a hydrostatic pressure chamber. No Tip area factor is
provided for T Bar Cones.
12 Data Viewer
Figure 13: Data Viewer
The Data Viewer allows the Operator to open calculated ‘cdf’ files and raw ‘rdf’
files from completed CPT jobs in both MS Excel and MS Notepad. Figure 12:
Data Viewer shows the Data Viewer Menu. Selecting <Exit> returns the
Operator to the previous menu.
12.1 Print
To view the graph image for any completed CPT test, the <Print> option can
be chosen. The Operator must select the appropriate bitmap job file from the
presented open dialog screen. It is then possible to print the graph if the user
wishes by pressing print, this will then print the on-screen form to the default
printer. All CPT tests are saved as a bitmap *.bmp as standard. Figure 13:
Graph Viewer shows a typical graph. If the bitmap is opened outside of the
software using any other software package, the pushname information will not
be displayed.
Figure 14: Graph Viewer
12.2 Open CDF With Notepad
To view the Calculated Data File for any completed CPT test, the <Open CDF
with Notepad> option can be chosen. The Operator must select the
appropriate cdf job file from the presented open dialog screen. This is then
opened within the MS Notepad text editor. This option is preferred if MS Excel
is not installed on the machine.
12.3 Open RDF With Notepad
To view the Raw Data File for any completed CPT test, the <Open RDF with
Notepad> option can be chosen. The Operator must select the appropriate rdf
job file from the presented open dialog screen. This is then opened within the
MS Notepad text editor. This option is preferred if MS Excel is not installed on
the machine.
12.4 Open RD2D With Notepad
To view the Raw Deck to Deck Data File for any completed CPT test, the
<Open RD2D with Notepad> option can be chosen. The Operator must
select the appropriate rd2d job file from the presented open dialog screen. This
is then opened within the MS Notepad text editor. This option is preferred if MS
Excel is not installed on the machine.
12.5 Open CDF With Excel
To view the Calculated Data File for any completed CPT test in MS Excel, the
<Open CDF with Excel> option can be chosen. The Operator must select the
appropriate cdf job file from the presented open dialog screen. This is then
opened within the MS Excel Program. This option opens the file in a more
structured manner than notepad, allowing the user to easily view and post
process the data.
12.6 Open RDF With Excel
To view the Raw Data File for any completed CPT test in MS Excel, the <Open
RDF with Excel> option can be chosen. The Operator must select the
appropriate rdf job file from the presented open dialog screen. This is then
opened within the MS Excel Program. This option opens the file in a more
structured manner than notepad, allowing the user to easily view and analyse
the data.
12.7 Open RD2D With Excel
To view the Raw Deck to Deck Data File for any completed CPT test in MS
Excel, the <Open RD2D with Excel> option can be chosen. The Operator
must select the appropriate rd2d job file from the presented open dialog
screen. This is then opened within the MS Excel Program. This option opens
the file in a more structured manner than notepad, allowing the user to easily
view and analyse the data.
13 Contacts
Any problems or software bugs encountered should be referred directly to
Datem Ltd. Our technical staff should be able to provide advice in such
situations. When seeking advice, it is helpful to provide the following
information:
1. Location
2. Nature of problem
3. Any attempted resolution
4. Operational parameters
5. Cone used
6. System parameters (software versions etc.)
7. Any additional information considered to be relevant (weather
conditions)
8. If possible raw data files should be made available for review by
Datem. These will of course be treated in the strictest confidence and
deleted upon request.
This correspondence should be through any of the following means:
e-mail:
[email protected]
Address:
Datem Limited
Woodbridge Road Industrial Estate
Sleaford
Lincolnshire
NG34 7EW
United Kingdom
Telephone: +44 (0) 1529 419970
Fax:
+44 (0) 1526 419989