1
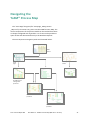
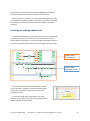
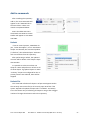
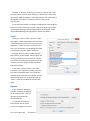
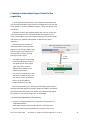
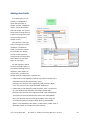
YaSM® Process Map
User Manual for the YaSM® Process
Map (MS Visio™ Version)
Contents
Installation ..................................................................................................... 5
Extracting the ZIP archive ................................................................................................................. 5
Contents of the ZIP archive ......................................................................................................... 5
Setting up the repository add-in ...................................................................................................... 6
Installing the current version of the add-in (Visio 2010 or 2013 on Windows 7, 8 or 10) .......... 7
Installing the “legacy version” ..................................................................................................... 8
First start of Visio after installing the add-in .................................................................................... 9
Required system fonts .................................................................................................................... 10
Installation of updates to the add-in .............................................................................................. 10
Navigating the YaSM® Process Map ..............................................................11
Components of the YaSM® Process Map .......................................................12
Visio diagrams ................................................................................................................................ 12
Front page ................................................................................................................................. 12
Process overviews ..................................................................................................................... 12
Flowchart diagrams ................................................................................................................... 12
Process structure diagram ........................................................................................................ 13
Overview of YaSM data objects (“YaSM objects”) .................................................................... 13
YaSM data object model ........................................................................................................... 13
Object lifecycle diagrams .......................................................................................................... 14
RACI matrix ..................................................................................................................................... 14
Checklists/ document templates .................................................................................................... 14
Quick references............................................................................................................................. 15
YaSM process descriptions ........................................................................................................ 15
YaSM glossary............................................................................................................................ 15
Process inputs/ outputs ............................................................................................................ 15
YaSM role descriptions .............................................................................................................. 15
Process metrics ......................................................................................................................... 15
Types of Shapes used in the Visio Diagrams ..................................................16
Master shapes and the document stencil ...................................................................................... 16
Processes ................................................................................................................................... 17
Tasks/ activities ......................................................................................................................... 17
© IT Process Maps GbR
User Manual - YaSM® Process Map (MS Visio™ Version)
-2-
YaSM data objects (“YaSM objects”) ........................................................................................ 18
“Other data objects” ................................................................................................................ 18
Roles .......................................................................................................................................... 19
Attachments .............................................................................................................................. 20
Start and end events ................................................................................................................. 20
Sequence flows ......................................................................................................................... 21
Associations............................................................................................................................... 21
Decision gateways ..................................................................................................................... 21
OR (inclusive) gateways ............................................................................................................ 21
AND (parallel) gateways ............................................................................................................ 21
Annotations ............................................................................................................................... 21
Navigation shapes ..................................................................................................................... 21
Modifying the Process Diagrams ...................................................................22
Adding new shapes to existing diagrams ....................................................................................... 22
Changing shape data ...................................................................................................................... 22
Modifying links ............................................................................................................................... 22
Creating new process diagrams ..................................................................................................... 23
Container shapes ............................................................................................................................ 23
Inserting or moving swim lanes ...................................................................................................... 24
Using the Repository Add-In..........................................................................26
Introduction .................................................................................................................................... 26
Add-in commands........................................................................................................................... 27
Refresh ...................................................................................................................................... 27
Refresh File ................................................................................................................................ 27
Select ......................................................................................................................................... 28
Options ...................................................................................................................................... 28
Simple changes to the repository ................................................................................................... 29
Creating custom object types linked to the repository .................................................................. 31
Adding data fields ........................................................................................................................... 34
Background information on the repository add-in ........................................................................ 35
Using the YaSM® Process Map with SharePoint ............................................37
Modifications to the Visio diagrams ............................................................................................... 37
Conversion from VSD to VSDX or VDW format ......................................................................... 37
Modification of hyperlinks ........................................................................................................ 38
© IT Process Maps GbR
User Manual - YaSM® Process Map (MS Visio™ Version)
-3-
Modifications to the RACI matrix ................................................................................................... 41
© IT Process Maps GbR
User Manual - YaSM® Process Map (MS Visio™ Version)
-4-
Installation
This document provides instructions for the use of the YaSM®1
Process Map for Microsoft Visio™2; prior knowledge of the Visio
application is assumed.
Extracting the ZIP archive
The YaSM® Process Map is delivered as a ZIP archive, containing all
product components.
The files can be unzipped into any directory. The file names and
the structure of the sub-folders, however, should not be changed
unless required, as the links in the process diagrams are based on
those names.
If file or folder names are changed, all shapes with hyperlinks
pointing to those files or folders must be updated accordingly.
Contents of the ZIP archive
The delivery archive contains the following folders and files:
— Folder "Diagrams": Visio files containing the process diagrams,
arranged in a number of sub-folders:
—
“YaSM_Top_Level”
—
“Service_Lifecycle_Processes”
—
“Supporting_Processes”
—
“YaSM_Object_Lifecycles”
—
“Complementary_Diagrams”
—
“YaSM_ISO20000_Bridge” (only available if the product
license includes the “YaSM® - ISO 20000 Bridge”).
— Folder “RACI”: RACI matrix in Excel format.
— Folder "Checklists": Checklists in Microsoft Word™ format, specifying the YaSM objects in detail.
1
YaSM® is a registered trade mark of IT Process Maps GbR.
2
Microsoft™, Visio™, Word™ and Excel® are trademarks of Microsoft
Corp.
© IT Process Maps GbR
User Manual - YaSM® Process Map (MS Visio™ Version)
-5-
— Folder "Accompanying_Documents": Introduction to YaSM®, user
manual, implementation guide, Excel table of process inputs and
outputs, PDF quick references such as the YaSM glossary, and collection of process metrics.
— Folder “ISO_20000_Documents”: Original ISO 20000 document
and introduction to the YaSM® - ISO 20000 Bridge (only available
if the product license includes the “YaSM® - ISO 20000 Bridge”).
— Folder "Stencils": Visio stencil, containing the master shapes used
in the YaSM® Process Map.
— Folder “Setup”: Installation files for setting up the repository
feature (a Visio add-in).
— Folder "Repository": Excel repository (used in combination with
the repository add-in).
Setting up the repository add-in
The YaSM® Process Map includes an add-in for Visio (the “repository add-in”) which makes it possible to read data from an Excel
repository and write those data into a shape’s shape data fields and
link attributes. See page 26 for more details.
The setup folder of your delivery archive contains two sub-folders
with the current and “legacy” versions of the add-in:
— The current version is to be used with the more recent editions of
Visio and Windows (Visio 2010 or 2013 on Windows 7, 8 or 10).
— The legacy version is to be used with older editions of Visio and
Windows (the minimum requirements are Windows XP and Visio
2003).
Note: The setup files contained in your delivery archive are compatible with the 32-bit editions of Visio, which are typically installed even
on computers running 64-bit editions of Windows. Please get in touch
with IT Process Maps if you use a 64-bit version of Visio to obtain an
additional setup package.
The Visio add-in is not strictly required as the Visio diagrams contain all information, and all hyperlinks work in the product’s original
state upon delivery. But the add-in is a useful extension of the standard Visio functionality that makes it easier to perform certain kinds of
modifications to the Visio diagrams.
© IT Process Maps GbR
User Manual - YaSM® Process Map (MS Visio™ Version)
-6-
Installing the current version of the add-in (Visio 2010 or
2013 on Windows 7, 8 or 10)
Setting up the required version of .NET
The add-in requires Microsoft .NET 4.5 or later, which is present by
default on most Windows systems if they are kept up-to-date
through Windows Update.
If .NET 4.5 (or later) cannot be found on the system, the setup
routine will try to install it. However, we recommend to verify that
the latest version of .NET 4.x is installed on the system before setting
up the repository add-in. If required, the latest updates to .NET can
be obtained through Windows Update.
Installing the latest updates to Windows and Visio
Before installing the repository add-in, please get the latest
updates for Windows and Visio through Windows Update. This is
especially important if you have just completed a fresh installation of
Visio on your PC, as the update will install additional Visio
components, depending on your versions of Windows and .NET.
Setting up the repository add-in
To set up the repository add-in, double-click on “setup.exe” in the
“Current_Version” sub-folder and follow the instructions. Running the
setup is required for each client PC on which the add-in is to be used.
Please note that the setup installs the add-in for the current user
only. Every additional user who intends to work with the add-in on a
particular PC is required to run the setup once again while being
logged in with his or her own user credentials. A standard (nonadministrator) user may start the setup, but Windows may ask for
the password of an administrator during setup.
Security policies and publisher verification
Depending on your organization’s security policy and settings, the
setup may be terminated with a security warning stating that the
add-in’s certificate or its location is not trusted. This may happen in
particular when the setup is started from a network folder.
A possible workaround consists of temporarily copying the setup
folder to a local folder (for instance to the Windows desktop) and
starting the setup from there.
© IT Process Maps GbR
User Manual - YaSM® Process Map (MS Visio™ Version)
-7-
An alternative solution would be to add the add-in’s certificate to
each client computer on which it is to be installed. The certificate can
be found in the “setup.exe” file in the setup folder (right-click on
“setup.exe”, then choose “Properties” from the context menu; in the
“File Properties” dialog, look for the “Digital Signatures” tab, from
where the certificate can be viewed and installed - either for the
current user or the local machine). When asked to specify a location
for the certificate, choose “Trusted Root Certification Authorities”.
Installing the “legacy version”
The legacy version of the add-in is compatible with older editions
of Visio and Windows (the minimum requirements are Visio 2003 and
Windows XP).
Setting up the required version of .NET
The add-in requires Microsoft .NET 2, 3 or 3.5, which is present by
default on most Windows systems if they are kept up-to-date
through Windows Update.
If .NET 2, 3 or 3.5 cannot be found on the system, the setup
routine will try to install it. However, the legacy version of the add-in
may not always succeed and we recommend to verify that the
required version of .NET is installed on the system before setting up
the repository add-in. In the more recent version of Windows, .NET
3.5 can be turned on in the Control Panel under “Programs and
features -> Turn Windows features on or off”).
Installing the latest updates to Windows and Visio
Before installing the repository add-in, please get the latest
updates for Windows and Visio through Windows Update. This is
especially important if you have just completed a fresh installation of
Visio on your PC, as the update will install additional Visio
components, depending on your versions of Windows and .NET.
Setting up the legacy repository add-in
To set up the repository add-in, double-click on “setup.exe” in the
“Legacy_Version” sub-folder and follow the instructions. Running the
setup is required for each client PC on which the add-in is to be used.
Please note that the setup is only able to install the add-in for the
current user. Every additional user who intends to work with the add-
© IT Process Maps GbR
User Manual - YaSM® Process Map (MS Visio™ Version)
-8-
in on a particular PC is required to run the setup once again while
being logged in to Windows with administrator rights.
If company policies demand that “ordinary” users are not normally
assigned administrator rights, the workaround is to temporarily
assign administrator rights to those users while running the setup.
Additional components required by the add-in
Apart from the actual Visio add-in, the setup routine will also
install the two following Microsoft run-time components on which
the add-in depends:
— Microsoft Office 2003 (2007, 2010) Primary Interop Assemblies
(depending on your installed version(s) of Microsoft Office)
— Microsoft Visual Studio 2005 Tools for Office Second Edition
Runtime
The setup routine may try to download the installation package for
Microsoft Visual Studio 2005 Tools for Office Second Edition Runtime
(“vstor.exe”) from the Microsoft web site. If this results in an error
message (for example due to restrictive security settings), this component can be downloaded from the Microsoft website and installed
manually prior to running the setup for the add-in (URL:
“http://go.microsoft.com/fwlink/?LinkId=100566”).
First start of Visio after installing the add-in
Upon the first start of Visio after installing the add-in, four new
commands will be available in the “Add-Ins” tab in the Visio ribbon.
Note: The ribbon was introduced with Visio 2010. A custom toolbar
will appear in the older editions of Visio 2003 and 2007.
A message window will inform you that a “New Config File Visio_
Repository_Add-In.cfg” has been created.
This configuration file stores the add-in’s configuration data. Under
normal circumstances, you will not need to edit this file manually.
Next, a message informs you that no repository file is set at this
stage: Before being able to use the repository feature, it is necessary
to specify where exactly on your system or local network the Excel
repository file is located.
© IT Process Maps GbR
User Manual - YaSM® Process Map (MS Visio™ Version)
-9-
Click on “OK” and select your repository file (if you start up the
YaSM® Process Map for the first time, you will most likely want to
select the original Excel repository, which is located in the “Repository” folder of your delivery archive).
Required system fonts
The diagrams of the YaSM® Process Map use the Calibri font which
is installed by default on most Windows systems.
If Calibri is not installed on your system, an alternative font like
Arial will be used - please install the Calibri font in that case for optimal display and readability of the diagrams.
Installation of updates to the add-in
Before installing an updated version of the Visio add-in, please deinstall the existing installation in the Windows Control Panel.
After that, proceed with setting up the new version of the add-in
as described above.
© IT Process Maps GbR
User Manual - YaSM® Process Map (MS Visio™ Version)
- 10 -
Navigating the
YaSM® Process Map
The “Front Page” diagram (file “Frontpage_YaSM_Process
_Map.vsd”) is the main entry-point into the YaSM® Process Map. The
various components of the process model can be reached from there
via shapes configured with hyperlinks. It is of course also possible to
open all files and documents directly in the Windows Explorer.
The most important navigation paths are illustrated below:
RACI
matrix
Data object
model
Front
page
Level 0: Overview
of YaSM service
management
processes
Process structure
Object lifecycles
Level 1: Main
processes
Level 2: Subprocesses
© IT Process Maps GbR
User Manual - YaSM® Process Map (MS Visio™ Version)
- 11 -
Components of the
YaSM® Process Map
Visio diagrams
Front page
The front page is a portal with links to the
various components of the YaSM® Process Map.
It is the main entry point into the process
model.
Process overviews
Overview diagrams show for each main
process how it is related to the other main
processes and what sub-processes it contains.
Flowchart diagrams
The top areas of the flowchart diagrams illustrate the process interfaces in detail.
Underneath the top area, the flowchart diagrams contain one or several rows (“swim
lanes”) with a detailed account of the process
activities.
© IT Process Maps GbR
User Manual - YaSM® Process Map (MS Visio™ Version)
- 12 -
Process structure diagram
The process structure diagram provides a
complete view of the YaSM process structure on
a single page.
This diagram can be used for directly
navigating to specific overview or flowchart
diagrams on the main or sub-process levels.
Overview of YaSM data objects (“YaSM
objects”)
This diagram provides a list of all YaSM data
objects (process inputs and outputs), sorted by
the processes which are most closely associated
with the objects.
Every YaSM data object has an associated
checklist which describes the object in more
detail, and an associated object lifecycle diagram. Both can be opened via hyperlinks.
YaSM data object model
The YaSM data object model provides a
complete overview of the key relationships
between the YaSM data objects. Its purpose is
to facilitate an understanding of each object's
relevance within the YaSM framework.
© IT Process Maps GbR
User Manual - YaSM® Process Map (MS Visio™ Version)
- 13 -
Object lifecycle diagrams
Object lifecycle diagrams are available for
every YaSM data object. Their aim is to illustrate
which YaSM processes create, update, read and
archive particular YaSM objects, and how their
status changes throughout their lifecycle.
RACI matrix
The RACI or responsibility matrix provides a
summary of the YaSM roles’ responsibilities in
the various YaSM processes.
The RACI matrix is supplied in the form of an
Excel table. The process names in the column on
the left are configured with hyperlinks; this
makes it possible to open the Visio diagram for a
particular process directly from the matrix.
Checklists/ document templates
The checklists in Microsoft Word (.DOC) format explain the YaSM key terms in detail. Typically, a YaSM checklist exemplifies the structure
of the data or information contained in a document or record.
Example: The checklist for the incident record
explains what information is typically maintained for service incidents.
Checklists are available for every YaSM data
object and are generic, i.e. applicable to most
organizations.
© IT Process Maps GbR
User Manual - YaSM® Process Map (MS Visio™ Version)
- 14 -
Many checklists can be used as templates during your YaSM
initiative. For instance, the checklists for service agreements can
serve as a starting point when you need to create such agreements
for your organization.
Quick references
“Quick references” provide overviews of the different types of
objects used in the process model in printer-friendly format:
YaSM process descriptions
This PDF quick reference provides a list of all YaSM processes defined in the YaSM process model, complete with brief descriptions of
the process objectives.
YaSM glossary
The YaSM glossary in PDF format contains definitions or short
descriptions of the YaSM key terms.
Many of those terms correspond to “YaSM data objects” in the
YaSM® Process Map, which are used to describe the information
flows between the YaSM processes. For each YaSM data object there
is a checklist with more detailed information.
Process inputs/ outputs
This Excel workbook (“process_inputs_outputs.xls”) contains two
tables, providing a complete list of inputs and outputs for each process. Filtering and sorting can be applied to create specific views,
focusing on particular processes, inputs or outputs.
YaSM role descriptions
This PDF document contains short descriptions or definitions of all
YaSM roles. Role objects are used in the flowchart diagrams and the
RACI matrix to illustrate the responsibilities for whole processes or
single process activities.
Process metrics
To support the selection of suitable process metrics, the YaSM®
Process Map contains for each process a list of widely used metrics
with brief definitions in PDF format.
© IT Process Maps GbR
User Manual - YaSM® Process Map (MS Visio™ Version)
- 15 -
Types of Shapes used in the Visio
Diagrams
Master shapes and the document stencil
All shapes used in the YaSM® Process Map were created
using the master shapes contained in a special YaSM Visio
stencil, as shown on the right. The file “YaSM_Process_
Map.vss” can be found in the “Stencils” folder of your
delivery archive.
As always in Visio, once a master shape from a stencil is
used in a Visio document, that master shape becomes part of
the document stencil. The master shapes from the stencil are
therefore also present in the document stencils of all individual Visio files which are part of the YaSM® Process Map.
Some of the master shapes are configured to work with
the YaSM® Process Map’s “repository feature”. This is explained in more detail after page 26.
Note: You may insert any type of Visio shape into the process diagrams. However, we provide a set of master shapes
to help you with maintaining a coherent design of the process
model.
© IT Process Maps GbR
User Manual - YaSM® Process Map (MS Visio™ Version)
- 16 -
Processes
The BPMN process shape (BPMN: Business Process Modeling Notation) represents a whole YaSM process or sub-process. Process
shapes are configured with six shape data fields3:
Assess changes (CAB)
— “Name” (name of the process - this text is displayed on the shape)
— “Note” (process objective or description)
— “Reference” (reference tag or outline number of the process)
— “AssignedTo” (assignment to a superior process. - Resolution of
incidents, for example, is assigned to Operate the services)
— “UniqueID” (unique identifier for the process. - The primary key
for selecting processes from the Excel repository)
— “Status” (process status. - “Active” is the default value in this field;
enter “In planning”, for example, to indicate that a process is not
yet operational; any status value not equal to “Active” changes
the shape’s color to grey).
The plus sign at the bottom of the shape indicates the presence of a
link, pointing to the corresponding process diagram (the plus sign is
only shown if a hyperlink is set for the shape). To go to a linked diagram, click on the link in the shape’s context menu or - in the more
recent versions of Visio - click on the shape while holding down the
control key.
The process shape is linked to the “Process” table in the Excel
repository, which is used by the repository add-in to populate the
shape data fields and to set the shape’s link.
Tasks/ activities
BPMN task shapes are used to depict single activities within a
process flow.
Det ermine
required CAB
members
Because tasks typically figure only once in the process model, they
are “simple” shapes: There are no defined shape data fields or links,
and tasks are not managed through the Excel repository.
To modify a task, simply edit its text directly in the shape, as required.
3
Shape data were referred to as “custom properties” in earlier versions
of Visio.
© IT Process Maps GbR
User Manual - YaSM® Process Map (MS Visio™ Version)
- 17 -
YaSM data objects (“YaSM objects”)
YaSM data objects represent process inputs and outputs. Their
main purpose is to illustrate the information flows between the YaSM
processes.
Change record
Master object
For every YaSM data object, the YaSM® Process Map contains one
“master object” and one or several variants which represent specific
lifecycle stages of the object. The stage names are indicated in
brackets after the object name.
The purpose of using variants is easily understood when looking at
the lifecycle diagram for a YaSM data object: The variants make it
possible to show how an object’s state changes as it is created, updated, read and archived by various YaSM processes.
Change record
(proposed - RFC)
Object variant
representing a specific
state of a YaSM data
object
YaSM data object shapes are configured with four shape data fields:
— “Name” (name of the object. - This text is displayed on the shape)
— “Note” (object description or definition)
— “UniqueID” (unique identifier of the object. - The primary key for
selecting YaSM data objects from the Excel repository)
— “Status” (object status. - “Active” is the default value in this field;
enter “In planning”, for example, to indicate that a YaSM object is
not yet operational; any status value not equal to “Active”
changes the shape’s color to grey).
The “>” symbol in the lower right-hand corner indicates the presence
of hyperlinks (it is only shown if a hyperlink is set for the shape). Every YaSM data object features two links, one to the object’s associated
checklist and a second link to its lifecycle diagram. To go to a linked
diagram or document, click on the link in the shape’s context menu
or - in the more recent versions of Visio - click on the shape while
holding down the control key.
The YaSM data object shape is linked to the “YaSMObject” table in
the Excel repository, which is used by the repository add-in to populate the shape data fields and to set the shape’s links.
“Other data objects”
Just like YaSM data objects, “other data objects” (shown with a
dashed line) represent information flowing from one process to
another. But unlike the YaSM data objects, where YaSM has strong
views about their content, such objects are mostly informal data or
information. There are no associated lifecycle diagrams or checklists.
© IT Process Maps GbR
User Manual - YaSM® Process Map (MS Visio™ Version)
Change status
information
- 18 -
“Other data objects” are configured with four shape data fields:
— “Name” (name of the object. - This text is displayed on the shape)
— “Note” (object description or definition)
— “UniqueID” (unique identifier of the object. - The primary key for
selecting objects from the Excel repository)
— “Status” (object status. - “Active” is the default value in this field;
enter “In planning”, for example, to indicate that an object is not
yet operational; any status value not equal to “Active” changes
the shape’s color to grey).
A “>” symbol in the lower right-hand corner indicates the presence
of a hyperlink (it is only shown if a hyperlink is set for the shape). To
open a linked document, click on the link in the shape’s context menu
or - in the latest versions of Visio - click on the shape while holding
down the control key. No links are set for this type of shape in the
original state of the YaSM® Process Map.
The “other data object” shape is linked to the “OtherObject” table
in the Excel repository, which is used by the repository add-in to
populate the shape data fields and to set the shape’s link.
Roles
Role objects are used to indicate who is accountable for a process
or responsible for carrying out certain process activities.
Change manager
Role objects are configured with four shape data fields:
— “Name” (name of the role. - This text is displayed on the shape)
— “Note” (role description or definition)
— “UniqueID” (unique identifier of the role. The primary key for selecting roles from the Excel repository)
— “Status” (role status. - “Active” is the default value in this field;
enter “In planning”, for example, to indicate that a role is not yet
operational; any status value not equal to “Active” changes the
shape’s color to grey)
A “>” symbol in the lower right-hand corner indicates the presence
of a hyperlink (it is only shown if a hyperlink is set for the shape). To
open a linked document, click on the link in the shape’s context menu
or - in the latest versions of Visio - click on the shape while holding
down the control key. No links are set for this type of shape in the
original state of the YaSM® Process Map.
© IT Process Maps GbR
User Manual - YaSM® Process Map (MS Visio™ Version)
- 19 -
The role shape is linked to the “Role” table in the Excel repository,
which is used by the repository add-in to populate the shape data
fields and to set the shape’s link.
Attachments
Attachment objects do not appear in the original versions of the process diagrams - they are meant to represent your organization’s own
documents. For example, attachment shapes may represent detailed
working instructions for performing certain tasks; if placed next to
tasks in the process diagrams and configured with your organizationspecific links, it will be possible to open those working instructions
directly from within the Visio diagrams.
At tachment ...
Attachment objects are configured with four shape data fields:
— “Name” (name of the attachment. - This text is displayed on the
shape)
— “Note” (attachment description or definition)
— “UniqueID” (unique identifier of the attachment. - The primary
key for selecting attachments from the Excel repository)
— “Status” (attachment status. - “Active” is the default value in this
field; enter “In planning”, for example, to indicate that an attachment is not yet operational; any status value not equal to “Active”
changes the shape’s color to grey).
A “>” symbol in the lower right-hand corner indicates the presence of
a hyperlink (it is only shown if a hyperlink is set for the shape). To
open a linked document, click on the link in the shape’s context menu
or - in the latest versions of Visio - click on the shape while holding
down the control key. No links are set for this type of shape in the
original state of the YaSM® Process Map.
The attachment shape is linked to the “Attachment” table in the
Excel repository, which is used by the repository add-in to populate
the shape data fields and to set the shape’s link (the “Attachment”
table is empty in the original state of the YaSM® Process Map).
Start and end events
Start events and end events represent the start and end points of
processes.
Start event
End event
© IT Process Maps GbR
User Manual - YaSM® Process Map (MS Visio™ Version)
- 20 -
Sequence flows
BPMN sequence flows are used to specify the sequence of activities.
Associations
BPMN associations link processes to other objects. Most importantly, associations are used to illustrate information flows and
process interfaces.
Decision gateways
A decision (exclusive) gateway routes the sequence flow to exactly
one of the outgoing paths. Conditions determine the selection of the
outgoing path. If no explicit conditions are given, the most appropriate outgoing path is selected.
Condition 2
Condition 1
OR (inclusive) gateways
The OR (inclusive) gateway indicates a split in the process flow into
two or more paths where one or more of the outgoing paths are
taken. If no explicit conditions are given, all appropriate outgoing
paths are selected.
AND (parallel) gateways
The AND (parallel) gateway indicates a split in the process flow
into two or more paths where all of the outgoing paths are taken.
Annotations
Annotations are used to enhance the process models with further
information, e.g. when a process activity requires additional explanations.
Consi der level of damage if
the implementation is
delayed.
Because annotations typically figure only once in the process
model, they are “simple” shapes: There are no defined shape data
fields or links, and annotations are not managed through the Excel
repository. To modify an annotation, simply edit its text as required.
Navigation shapes
Navigation shapes are used in the process model to facilitate an
easier navigation.
© IT Process Maps GbR
User Manual - YaSM® Process Map (MS Visio™ Version)
Back to Front Page
- 21 -
Modifying the Process Diagrams
All process diagrams may be changed without limitations - as with
any Visio diagrams created by yourself, there are no restrictions.
The following recommendations, however, will help you make best
use of Visio in combination with the YaSM® Process Map, and to
maintain consistency and a coherent look of your YaSM process
documentation.
Adding new shapes to existing diagrams
Create new shapes by either
— Copying an existing shape within a drawing using “copy” and
“paste”
— Dragging a master shape from the document stencil onto the
diagram.
Changing shape data
For all shapes which are configured for the repository feature (process, YaSM data object, “other data object”, role and attachment
shapes), we recommend not to change the contents of their shape
data fields directly in Visio; rather, change the “Name”, “Notes”, “AssignedTo” and “Reference” attributes in the repository and perform a
“Refresh” with the repository add-in on the affected shapes (this will
help to ensure that all objects in the process model have the correct
values in their attributes).
Modifying links
For all shapes which are configured for the repository feature
(process, YaSM data object, “other data object”, role and attachment
shapes), we recommend not to change the link information directly
in Visio; rather, change the link fields (“HyperlinkDescriptorn”, “Hyper
linkAddressn” and “HyperlinkSubAddressn”) in the repository and
perform a refresh with the repository add-in on the affected shapes.
© IT Process Maps GbR
User Manual - YaSM® Process Map (MS Visio™ Version)
- 22 -
Creating new process diagrams
There are two recommended procedures if new process diagrams
need to be created:
— Create a new process diagram within an existing Visio file by creating a new drawing page, then giving the new page an appropriate name (most likely, the name of a new (sub-)process). Start
inserting shapes by copying (groups of) shapes from other diagrams within your file, or by dragging master shapes from the
document stencil onto the diagram.
— Create a completely new Visio file by copying one of the YaSM®
Process Map’s existing files and renaming it. Delete and/ or rename the existing process diagrams as required. Then modify the
process diagrams by copying (groups of) shapes from other diagrams, or by dragging master shapes from the document stencil or
the YaSM stencil onto the diagram.
Container shapes
Starting with Visio 2010, Microsoft introduced the concept of “container shapes” - boxes around clusters of shapes to define logical
groupings.
The YaSM® Process Map uses containers to help keep things organized: Swim lanes, for example, are containers, as well as the central
boxes in the process overview diagrams.
As soon as you select a container or one or several shapes belonging to the container, the “Container Tools” tab is displayed in the
Visio ribbon:
The shapes inside a container are not a group of shapes, so you
have direct access to them. Shapes are added or removed simply by
dragging them into or out of a container. When dragging a shape into
© IT Process Maps GbR
User Manual - YaSM® Process Map (MS Visio™ Version)
- 23 -
the container, the container outline will be highlighted to indicate
that Visio will make the shape a member of the container.
When you move a container, the contained shapes will move with
it, keeping their positions inside the container. This makes it possible,
for example, to easily move whole swim lanes with all contained
activities.
Inserting or moving swim lanes
The flowchart diagrams on the sub-process level use a special kind
of container shape (a “list container”) as an outer frame and container shapes as swim lanes, as in the example shown below. The list
container will automatically make room for and align the swim lanes.
Process Owner
Superior Processes
Incident manager
Servi ce request
record (rejected)
Support i nci dent and
service request
resol ution
Support i nci dent and
service request
resol ution
YaSM service
management processes
Servi ce request
model (released)
Servi ce request
record (open)
Monitor i ncidents and
service requests
Operat e the services
Log incidents and
service requests
Fulfill servi ce requests
Servi ce request
record (open)
Servi ce request
record (resol ved)
Close i nci dents and
service requests
Resolv e i nci dents and
service requests
Monitor i ncidents and
service requests
Manage configuration
information
Process objective:
To fulfil l serv ice request s, which are
typically either requests for
information or request s to
implement minor (standard)
changes lik e the reset of a password .
CI record (updated)
Manage configuration
information
Outer frame:
List container
CI record (verified)
Incident/ request
status information
Customer process
Back to Front Page
Resource
Verify if the
request can be
handled as a
standard serv ice
request
1st level support
Servi ce request
record created
Request cannot
be handled as a
service request
Highli ght reasons
for rejecting the
request and
inform the
requester
Set the request to
status 'rejected'
Processing of
service request
rejected
If the request is not a
predefined serv ice
request, or might have
consequences which are
not wel l understood, it
must be rejected.
Request can be
handled as a
standard serv ice
request
Cat egorize service
request
Priori tize the
service request
If one is available, apply
the guidance and rules
of a suitable service
request model.
Assign a priorit y to the
service request based on
its urgency, which
determines t he avai lable
time for its resolution.
For most serv ice
requests, guidance on
priori tization is typi cally
contai ned in a serv ice
request model.
Check transferal
to a special ist
fulfillment group
Servi ce request
can be
processed by 1st
level support
Carry out service
request
If possi bl e, follow the
steps descri bed in a
service request model.
Servi ce request
must be transferred to a fulfillment group
Where necessary,
update config.
information in the
CMS
Assumption: The fulfillment of service requests
may include the implementation of preaut horized standard
changes. For such changes,
1st level support can
update the confi guration
information in the CMS.
Document
processing of t he
service request
Set service
request record
status to
'resol ved'
Al so ensure that all
other relat ed documentation required has
been compl eted.
Servi ce request
fulfilled
Inner frame:
Container shape
Inform user of
transferal to
fulfillment group
Resource
Servi ce request
fulfillment group
Carry out service
request
If possi bl e, follow the
steps descri bed in a
service request model.
Note: Ideal ly, many service requests are handled in an automated
way, for example via self-service portals on the intranet.
Where necessary,
update config.
information in the
CMS
Assumption: The fulfillment of service requests
may include the implementation of preaut horized standard
changes. For such changes,
1st level support can
update the confi guration
information in the CMS.
Document
processing of t he
service request
Set service
request record
status to
'resol ved'
Al so ensure that all
other relat ed documentation required has
been compl eted.
To insert new swim lanes into the diagram, simply
click on the blue “insertion” arrow that appears when
you position the mouse cursor over a corner of an
existing swim lane.
You can also drag whole swim lanes up or down
within the outer frame, and you’ll notice that the lanes
will be positioned automatically.
© IT Process Maps GbR
User Manual - YaSM® Process Map (MS Visio™ Version)
- 24 -
Note: Even though container shapes are a new feature introduced
with Visio 2010, such shapes are still compatible with earlier versions
of Visio. A shape configured as a container will behave like a normal
rectangular shape in Visio 2003 and 2007: The contained shapes will
not move with it (to move a swim lane in earlier versions of Visio,
select the whole swim lane and all of its contents).
© IT Process Maps GbR
User Manual - YaSM® Process Map (MS Visio™ Version)
- 25 -
Using the Repository Add-In
Introduction
The Excel repository included in the YaSM® Process Map is a central place where to store and manage all descriptive information and
link data for five object types used in the Visio diagrams: process,
YaSM data object, “other data object”, role and attachment shapes.
For example, the repository contains a worksheet or table named
“Process”, where you will find one row for each process defined in
the YaSM® Process Map. Every row contains a number of cells which
hold the process’s unique ID, its name, objectives, assignment to a
higher-level process, reference tag or outline number, and link information.
There are three more tables in the repository, for the YaSM data
object, “other data object” and role shapes appearing in the process
diagrams, plus one empty worksheet for attachment shapes where
you can enter any documents specific to your organization (these
documents can then be linked into the Visio process diagrams using
attachment shapes from the Visio stencil supplied with the YaSM®
Process Map).
The repository add-in allows you to pick records from the Excel
repository from within Visio, and load the corresponding data into a
shape’s attributes. You can also refresh one or several selected
shapes’ attributes with a single mouse-click after data in the repository has changed.
© IT Process Maps GbR
User Manual - YaSM® Process Map (MS Visio™ Version)
- 26 -
Add-in commands
After installing the repository
add-in, four new commands will
appear in the “ADD-INS” tab in
the Visio ribbon. These commands are explained below.
Note: The ribbon was introduced with Visio 2010. A custom
toolbar will appear in Visio 2003
and 2007.
Refresh
If one or several process, YaSM data object, “other data object”, role or attachment
shapes are selected, this command updates
(“refreshes”) the selected shapes’ attributes
with current data from the repository.
After performing a refresh, the updated
contents will be shown in the shape’s shape
data window.
It is possible to select more than one
shape at a time and perform a refresh on all
of these shapes. If graphical objects or other
“ordinary” shapes not configured for the repository feature are selected, these will be
skipped.
Refresh File
This command refreshes all shapes in all process diagrams within
the currently active Visio file (or all currently open Visio files if the
option “Refresh File updates all open Files” is enabled - see below).
This is the fastest way of refreshing all shapes in one go after a bigger
number of changes have been made in the repository.
© IT Process Maps GbR
User Manual - YaSM® Process Map (MS Visio™ Version)
- 27 -
Example: If “Resolve_incidents_and_service_requests.vsd” is the
currently active Visio file, then clicking on “Refresh File” will refresh
all process, YaSM data object, “other data object” and role shapes in
all diagrams contained in “Resolve_incidents_and_service_
requests.vsd”.
As the refresh proceeds, a message is displayed for every diagram
being processed. Clicking on “Cancel” stops the refresh cycle. These
intermediate messages can be suppressed by disabling the “Show
intermediate Messages during Refresh” option (see below).
Select
Clicking on “Select” while a process, YaSM
data object, “other data object” and role shape
is selected brings up the list of entries from the
repository - choose an item from the list and
click “OK” to load the corresponding data from
the repository into the shape’s attributes.
Example: Select a process shape and then
click “Select” on the toolbar. This brings up the
list of processes from the repository - choose
any process from the list to load data from the
repository into the shape’s shape data fields
and link attributes.
If you enter a search pattern, only those
processes in the repository matching the pattern will be displayed (there is no distinction
between upper and lower case letters, and no
wildcard characters are recognized). Click on
“Clear” to see the complete list of processes
again.
Options
In the “Options” dialog you
are able to specify the location
of the repository file - click on
“Browse” and choose the
desired Excel file.
It is possible to maintain
several Excel files as repositories, for example if you need
© IT Process Maps GbR
User Manual - YaSM® Process Map (MS Visio™ Version)
- 28 -
to maintain several repositories in different languages. In the “Options” dialog you can easily switch between repositories at any time.
In the “Options” dialog you can also switch between different
languages for the add-in’s toolbar and dialogs.
Finally, two settings control the behavior of the “Refresh” and
“Refresh File” commands:
— If the option “Show intermediate Messages during Refresh” is set,
intermediate messages will be shown before the update of individual diagrams; these messages make it possible to cancel the
update at various points during the refresh cycle. Disabling this
option means only one message will be shown at the end of the
refresh cycle.
— If the option “Refresh File updates all open Files” is enabled, “Refresh File” will update all files currently open in Visio (otherwise,
only the currently active file - i.e. the file that is currently visible in
Visio - will be updated). This allows you to open several files from
the YaSM® Process Map at the same time and perform an update
operation on all of these files in one go.
Note: A refresh cycle across several files may take several minutes
or longer to complete. Also, use this option with care as the add-in
will try to update all files currently open in Visio, including any files
which are not part of the YaSM® Process Map; this may lead to
unpredictable behavior.
Simple changes to the repository
Changing existing cell contents and inserting rows are the simplest
and the most likely modifications to occur - these changes are uncritical, as long as every row is identified with a unique ID in the “Unique
ID” column.
Please observe:
— Do not change the format of the Excel file (“Microsoft Excel 972003” format is required).
— Do not change the first three rows of the repository tables
(highlighted in blue).
— No empty rows are permitted between rows containing data.
— Texts in the “Note” field may be up to 2048 characters long; text
in all other fields may be up to 256 characters long.
© IT Process Maps GbR
User Manual - YaSM® Process Map (MS Visio™ Version)
- 29 -
— Hard line breaks within cells (inserted by “ALT-Return”) are not
supported (such line breaks are not supported by some Visio
versions and may show up as special characters in the shape data
fields).
— Double quotes (“) are not permitted within cells (the “ character is
used internally by Visio to delimit character strings); all text from
the repository is stripped of double quotes when writing it to the
shapes’ shape data fields. Single quotes (‘) are allowed.
— Always ensure that every row within one worksheet is identified
by a unique ID (every worksheet must have a first column labeled
“UniqueID” containing integer numbers [“IDs”]; IDs must be
unique within one worksheet only, not within the entire Excel
workbook; the IDs do not need to be continuous and do not have
to appear in any particular order).
— To check if two identical IDs are present in a table’s “UniqueID”
column, sort the rows according to the “UniqueID” column, or use
Excel’s conditional formatting feature for highlighting duplicate
values.
— Every worksheet must contain a second column labeled “Name”
containing the objects’ names.
Changing the unique IDs in the repository is possible but should be
done with care. Generally speaking, the idea behind using unique IDs
to identify objects is that they never change. We therefore recommend never to change the unique IDs but to use new ones if new
objects (represented by single rows in the Excel worksheets) must be
added to the repository.
After saving and closing the repository file, the modified contents
are immediately available in Visio, so you can proceed with updating
the process models using the “Refresh” command, or with inserting
new objects using “Select”.
Hint: When modifying the repository, it is generally a good idea to
create a copy of an existing repository file, perform the changes and
do some testing (you are always able to switch between different
repository files with the “Options” command).
© IT Process Maps GbR
User Manual - YaSM® Process Map (MS Visio™ Version)
- 30 -
Creating custom object types linked to the
repository
In its original state upon delivery, the YaSM® Process Map comes
with five standard object types which are configured for use with the
Excel repository: process, YaSM data object, “other data object” and
role shapes.
In addition to these pre-defined object types you can create your
own ones and use them in combination with the repository. For
every custom object type, this involves creating a new master shape
and inserting an additional worksheet or table into the Excel
repository.
The most important aspect to
understand when creating custom
objects is that a shape’s object type
and the name of the worksheet in
the repository must be identical
(see figure on the right):
— The object type of a Visio shape
is determined by the value of a
user-defined cell “User.Object
Type” (this value can be inspected and modified in the
shape’s shape sheet).
— The name of a worksheet in the
repository is determined by the
text shown on the worksheet’s
tab (it can be changed by
double-clicking on the tab).
Object type specified in a user-defined
cell in the shape sheet
is the
same as
Worksheet name in the
Excel repository
The recommended way for creating custom object types involves
copying and modifying existing master shapes and tables. The following example illustrates how a new object type, representing application systems in the process diagrams, can be created:
1. Create a new worksheet in the repository
— Copy an existing worksheet in the repository and rename it to
“ApplicationSystem”.
Note: Older versions of Excel truncate text in cells after 256
characters when copying worksheets. If you get to see such a
© IT Process Maps GbR
User Manual - YaSM® Process Map (MS Visio™ Version)
- 31 -
warning, create a new worksheet instead of copying an existing
one, name it “ApplicationSystem” and copy the contents of an
existing worksheet into it.
— Delete the contents of all existing cells in the new table but leave
the first three rows (highlighted in blue) intact, as they must be in
place in exactly this format for the repository feature to function.
2. Create a new Visio master shape
— Open the stencil file “YaSM_Process_Map.vss”, to be found in the
“Stencils” folder of your delivery archive (or create a copy of the
original stencil for experimenting); make the stencil editable by
right-clicking on its heading and selecting “Edit Stencil” from the
context menu.
— Create a copy of an existing master shape using “copy” and
“paste” (e.g., copy the “Attachment” master, then rename it to
“Application System”).
— Open the new master shape for editing by double-clicking on it.
— Change the appearance of the master as appropriate (the original
masters supplied with the YaSM® Process Map are actually groups
of basic shapes, so be careful not to destroy the group but to
modify the various elements of the group).
— Specify the new object type by opening up the master’s shape
sheet and changing the contents of the user-defined cell
“ObjectType” to “ApplicationSystem” (be careful to open the
group’s shape sheet, not the shape sheet of one of the group’s
member shapes); then close the shape sheet.
— Open the master’s shape data window and enter “Application
System …” into the “Name” field (this will be the default text
shown on the shape when creating a new “ApplicationSystem”
object in a Visio diagram).
— Save the changes to the master by closing the window.
— Right-click on the new master, then select “Edit Master - Master
Properties …” from the context menu; in the following dialog, tick
the box next to “Generate icon automatically from shape data”;
close the dialog - this will result in a new icon being created for
the new master, which should look similar to the new master
shape.
— Repeat the steps above, but this time uncheck “Generate icon
automatically from shape data”, to prevent that icons are repeatedly re-created.
© IT Process Maps GbR
User Manual - YaSM® Process Map (MS Visio™ Version)
- 32 -
— Save the stencil file by clicking on the diskette icon in its title bar.
3. Start using the new master shape
— Enter some data into the “ApplicationSystem” table in the repository (e.g., enter names of application systems into the “Name”
column, and their brief descriptions into the “Note” column);
make sure every row in the worksheet starts with a unique integer
in the “UniqueID” column; all other cells may be left blank, but obviously a repository item without a name would not be very
useful.
— Save and close the Excel repository.
— You can now add application system shapes to your Visio diagrams by dragging an “ApplicationSystem” master onto a Visio
process diagram from the stencil, then clicking on “Select” in the
“Add-Ins” tab on the ribbon - this brings up the list of application
systems from the repository, and you are able to select the
desired item.
— Check if all shape data fields and the link have been set correctly
with data from the repository.
© IT Process Maps GbR
User Manual - YaSM® Process Map (MS Visio™ Version)
- 33 -
Adding data fields
In its initial state, the repository is configured to
work with five types of
shapes: process, YaSM data
object, “other data object”
and role shapes. For each of
those types of shape there is
a table in the repository and
corresponding (master)
shapes in Visio.
The columns in the repository correspond to certain
attributes (“shape data
fields”) of the Visio shapes.
For example, the “Name”
column in the repository
corresponds to a shape data
field “Name” in Visio (see
figure on the right).
For the repository add-in
to work, the field names (i.e.
the column headings) in the
repository must adhere to
certain rules, and the Visio
shapes must be configured in a specific way:
— Field names in the Repository without any prefix correspond to a
shape data field of the same name in Visio.
Example: The contents of the repository field (column) “Reference” are written to the shape data field “Reference”.
— Field names in the Repository with the prefix “User.” correspond
to a user-defined cell, defined in the shape’s shape sheet.
Example: The contents of the repository field “User.ChangeDate”
are written to the user-defined cell named “User.ChangeDate”.
Hint: User-defined cells are normally invisible in Visio. They are
accessible by opening a shape’s shape sheet (if “Show Shape
Sheet” is not available in the shapes’ context menu, enable “Run in
developer mode” in the advanced Visio options).
© IT Process Maps GbR
User Manual - YaSM® Process Map (MS Visio™ Version)
- 34 -
— Field names in the repository with the prefix “Hyperlinkn.”
correspond to a shape’s hyperlink with index n.
Example: The contents of the repository field “Hyperlink2.
Address” are written to the shape’s Address attribute of its second
hyperlink. “Hyperlink2.SubAddress” corresponds to the
“SubAddress” field of the second hyperlink, and “Hyperlink2.
Descriptor” to the “Description” field of the second hyperlink.
As an example, the “Process” worksheet in the repository contains
in its original state nine columns (fields). The first six columns
correspond to the following shape data fields:
— “UniqueID” (unique integer ID for the process)
— “Reference” (reference tag or outline number of the process)
— “Name” (name of the process)
— “Note” (process objectives or description)
— “AssignedTo” (used to indicate the assignment of a process to a
superior process)
— “Status” (used to indicate, for example, if a process is active or in
the planning stage)
The last three columns contain link information which is written
into the shapes’ first set of link attributes (“Hyperlink1.Descriptor”,
“Hyperlink1.Address”, and “Hyperlink1.SubAddress”).
Using the information above, you can now start adding your own
data fields. For example, add a column “AssignedToBusinessUnit” to
the “Process” table in the repository, then add a shape data field
named “AssignedToBusinessUnit” to the Process master shape in
Visio. This allows you to manage an “AssignedToBusinessUnit”
attribute for your processes through the repository.
Background information on the repository
add-in
When loading data from the repository into a Visio shape, those
data are stored in a number of cells within the shape’s shape sheet.
Data records (rows) from the repository are selected using the
“UniqueID” field (the “UniqueID” field is the primary key). This is why
no duplicate unique IDs are allowed in the repository.
© IT Process Maps GbR
User Manual - YaSM® Process Map (MS Visio™ Version)
- 35 -
In its initial state after delivery, the Excel repository contains five
tables or worksheets, one for each type of Visio shape which is configured for usage with the repository feature (process, YaSM data
object, “other data object”, role and attachment shapes).
On the Visio side, all process, YaSM data object, “other data
object”, role and attachment shapes contain a user-defined cell in
their shape sheet called “ObjectType”. The content of the “Object
Type” cell tells the repository add-in what type of shape is present
and what worksheet (data table) in the repository holds the relevant
data.
Example: If the shape’s “ObjectType” cell contains the value “Process”, the repository feature knows that the shape at hand is a
process shape; accordingly, when looking for data in the repository,
the lookup will be performed in the “Process” worksheet.
The definition of valid object types is done implicitly by giving the
repository worksheets appropriate names. The shapes’ object types
must correspond to the worksheet names. This mechanism can be
used to create new types of shapes which use the repository feature,
as explained above.
The columns in the repository table don’t need to be in the same
sequence as the shape data fields in Visio, as the shape data fields
are addressed by their names.
However, every table in the Repository must have a first column
labeled “UniqueID” and a second column labeled “Name”.
The text in row 2 of the repository tables (“max. 255 chars -------…”) is some arbitrary text which helps the Excel database driver to
reserve sufficient memory while reading data from the repository. If
you add new fields to the repository, please follow our example and
enter some text containing the maximum number of characters for
the new fields. This precaution is necessary because, unlike in a
“real” database, there is no way in Excel to specify field lengths for
the database driver.
© IT Process Maps GbR
User Manual - YaSM® Process Map (MS Visio™ Version)
- 36 -
Using the YaSM® Process Map
with SharePoint
The YaSM® Process Map is often managed on a SharePoint4 server,
as this platform allows for the definition of access rights for specific
parts of the process documentation. All employees can thus, for
example, be granted read-only access to the process diagrams, while
only a small team is allowed to make changes.
If the aim is to merely store and manage the files on a SharePoint
server, no modifications are required, as in such a scenario locally
installed applications (Visio or Visio Viewer) are used to modify or
view the diagrams.
Since version 2010, however, SharePoint features the “Visio
Services”, including a “Visio Web Access Web Part” to present Visio
drawings directly in a web browser. With the Web Part, locally
installed applications are no longer necessary to view Visio diagrams
(Visio is still required for editing purposes). The Visio Web Part is
therefore a popular solution for publishing the process documentation within an organization.
Similar SharePoint Services and Web Parts are also available for
Excel and Word.
The YaSM® Process Map needs to be adapted for use with the
Web Parts, as the Web Parts do not support all features of the full
Microsoft Office products or work in a different way. These
adaptations (and the Web Parts’ limitations) are described below.
Modifications to the Visio diagrams
Conversion from VSD to VSDX or VDW format
All Visio files must be converted once from the standard VSD format to either VSDX or VDW format, in order for them to be compatible with the Visio Web Part (VSDX is the new format for Visio files
introduced with Visio 2013; VDW is the “Visio 2010 Web Drawing”
file format). To this end, the Visio files of the YaSM® Process Map
4
The information in this chapter relates to the more recent versions of
SharePoint 2010 and 2013.
© IT Process Maps GbR
User Manual - YaSM® Process Map (MS Visio™ Version)
- 37 -
need to be saved in VSDX or VDW format. The original VSD files then
become obsolete.
Note: The conversion and subsequent editing of Visio files in VDW
format requires at least Visio 2010 Professional.
Modification of hyperlinks
The YaSM® Process Map uses hyperlinks to navigate from one
diagram to another and to open linked documents. These links must
be adapted to the SharePoint environment.
Adapting links with the repository add-in
We recommend using the Excel repository and the repository addin to modify the links: Once the link information in the repository has
been changed, the links in the Visio diagrams can be updated with
the “Refresh file” command.
The following example highlights the required changes to the
repository. The first figure below shows the original state of the
repository:
This link information must be changed as follows (the URL pointing
to a SharePoint server location is only an example; it will look
different in your environment):
© IT Process Maps GbR
User Manual - YaSM® Process Map (MS Visio™ Version)
- 38 -
It is important that the “Address” column contains the full paths to
the VSDX or VDW files on the SharePoint server.
As for the “SubAddress” column,
— Links to overview diagrams (YaSM main processes) contain no
sub-address.
— Links to flowchart diagrams (YaSM sub-processes) contain only
the sub-address (the local name of the Visio diagram).
Links pointing to checklists need to be changed to work with the
Word Web Part. Here is an example for a link which will open a
checklist in the Web Part (the link will look different in your
SharePoint environment):
https://…/YaSM_Processes/_layouts/15/WopiFrame.aspx?&source
doc=/YaSM_Processes/Checklists/CL_Incident_Record.doc
Limitations to using hyperlink sub-addresses in the Visio Web Part
In its original state, links in the YaSM® Process Map pointing to
Visio files consist of two components: An address (specifying the Visio
file to be opened) and a sub-address (specifying the diagram or page
within the Visio file to be shown upon opening the file). This allows
for direct hyperlinks to specific diagrams in a Visio file, such as a link
to a particular incident resolution sub-process.
© IT Process Maps GbR
User Manual - YaSM® Process Map (MS Visio™ Version)
- 39 -
This works well with the full Visio application and the Visio Viewer,
but there is no proper support for sub-addresses in the Visio Web
Part: The Web Part will always open the first diagram of a Visio file,
even if the link contains a sub-address. Local links (links between
diagrams in the same Visio file) do not work.
Until these limitations are removed by a new version of the Visio
Web Part, we recommend implementing a workaround by deleting
either the sub-address or the address (as in the example above).
The following figure illustrates which types of links work with this
setup:
Diagrams in file: Resolve_incidents_and_service_requests.vsdx
Resolv e i nci dents and
service requests
LP4.6
Support incident and
service request
resolution
Log incidents and
service requests
LP4.6.1
LP4.6.2
Fulfill servi ce requests
Pro-act ively inform
users and client s
LP4.6.3
Resolv e major incident s
Resolve incidents in 1st
level support
LP4.6.5
LP4.6.6
LP4.6.4
1: Link to first diagram in file
2: Link to sub-process
Resolve problems
LP4.7
Pro-act ively identify
problems
Cat egorize and
priori tize problems
LP4.7.1
LP4.7.2
Analyze and resolve
problems
Monitor outstanding
problems
LP4.7.3
Close probl ems
LP4.7.4
LP4.7.5
3: Link within the same file
Diagrams in file: Resolve_problems.vsdx
— Links of type 1, pointing to the first diagram in a Visio file (for
example, a link pointing to the overview diagram of the incident
resolution process)
— Links of type 3, pointing from one Visio diagram to another one in
the same file (for example, a link between two incident resolution
sub-processes).
© IT Process Maps GbR
User Manual - YaSM® Process Map (MS Visio™ Version)
- 40 -
Links of type 2, pointing from outside to a specific diagram in a
Visio file, are not possible (for example, a link from problem
resolution to a specific sub-process in incident resolution). But this is
only a minor drawback since such links exist only in a small number of
places in the process model, for example in the process structure
diagrams.
Full path names vs. relative links
In its original state, the YaSM® Process Map contains relative
hyperlinks, so that Visio calculates the address of a linked file based
on the current file location. Using relative links has the advantage
that the links do not need to be modified when you move the whole
process documentation to a different location on your hard drive or
local network.
Unfortunately, relative links are not understood by the Visio Web
Part and must be replaced by full paths pointing to the exact link
targets on the SharePoint server. Every time the set of files is moved
to a different location on the SharePoint server, the links must be
adapted accordingly.
Modifications to the RACI matrix
As a first step, the matrix must be converted to XSLX format, since
this format is required for use with the Excel Web Part.
Then the links in the first column of the matrix, pointing to process
diagrams, need to be changed to full path names pointing to the
VSDX or VDW files on the SharePoint server (those path names are
the same ones as in the repository - see above).
Note: Please deactivate “Options - Advanced - Web Options Update links on save” in the Excel options, otherwise the links may be
changed unintentionally when saving the matrix on the SharePoint
server.
Some Excel features used in the RACI matrix must be removed as
they are not supported by the Excel Web Part (if the features are not
removed, this may result in error messages being shown or the
matrix not being displayed by the Web Part):
— Remove data validation (the drop-down lists in the matrix cells for
the selection of “R”, “A”, “C” or “I”).
© IT Process Maps GbR
User Manual - YaSM® Process Map (MS Visio™ Version)
- 41 -
— Change the vertical text alignment of the role names to horizontal
alignment (if required, adjust the column width).
— Delete all graphical objects.
Finally, the YaSM® Process Map contains a link from the Front Page
diagram to the RACI matrix. This link must be changed as follows for
the RACI matrix to open in the Excel Web Part (again, this link is only
an example, it will look different in your environment):
https://…/YaSM_Processes/_layouts/15/WopiFrame.aspx?&source
doc=/YaSM_Processes/RACI_Matrix/RACI_Matrix.xlsx
© IT Process Maps GbR
User Manual - YaSM® Process Map (MS Visio™ Version)
- 42 -
IT Process Maps GbR
Dipl.-Ing. Stefan Kempter & Dr. Andrea Kempter
Am Hoernle 7
87459 Pfronten
Germany
Tel. + 49-8363-927396
Fax + 49-8363-927703
Member of itSMF
© IT Process Maps GbR, 2015
[email protected]
it-processmaps.com | yasm.com
YaSM® is a registered trademark of IT Process Maps GbR.
Microsoft™, Word™, Excel®, Visio™ and SharePoint™ are registered
trademarks of Microsoft Corp.
All processes and methods in our products were compiled with the
greatest of diligence. Despite this fact, errors may not be ruled out. IT
Process Maps GbR therefore makes no guarantee nor accepts any
type of liability for consequences which may be associated with
incorrect statements.
Users must decide in their own particular case if the processes and
methods described are applicable to their organization or business.
© IT Process Maps GbR
User Manual - YaSM® Process Map (MS Visio™ Version)
- 43 -