1
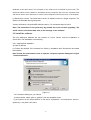
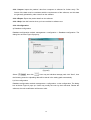
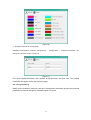
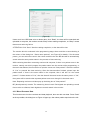
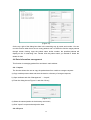
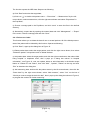
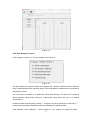
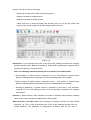
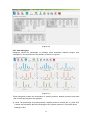
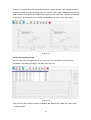
User Guide of PC Software
Version: A/0
Date: April 24, 2014
1
Contents
1 Introduction to Ambulatory Blood Pressure Monitoring ........................................................4
2 Software introduction ...............................................................................................................4
3 software installation .................................................................................................................5
3.1 Version Summary .............................................................................................................5
3.2 Install the software ............................................................................................................6
3.3 Uninstalling the software ..................................................................................................8
4 Use of ABPM software ............................................................................................................8
4.1 Menu and Toolbar introduction ........................................................................................8
4.1.1 Menu ...........................................................................................................................8
4.1.2 Toolbar ........................................................................................................................9
4.2 Software use .....................................................................................................................9
4.3 Menu introduction .............................................................................................................9
4.3.1 Exit ..............................................................................................................................9
4.3.2 Management...............................................................................................................9
4.3.3 Programming ............................................................................................................ 11
4.3.4 Read .......................................................................................................................... 13
4.4 Data information management ...................................................................................... 15
4.4.1 Import ........................................................................................................................ 15
4.4.2 Export ........................................................................................................................ 15
4.4.3 Delete and add ......................................................................................................... 16
4.5 Toolbar use...................................................................................................................... 17
4.5.1 Edit and study an ambulatory blood pressure ....................................................... 17
4.5.2 View Ambulatory Blood Pressure (ABP) study...................................................... 17
4.5.3 Edit an ambulatory blood pressure (ABP) study ................................................... 18
4.5.4 Adjust blood pressure Threshold ............................................................................ 20
4.5.5 View Analysis Function............................................................................................ 21
4.5.6 View Statistics in special period.............................................................................. 23
4.5.7 View Histogram ........................................................................................................ 24
4.5.8 View Pie chart .......................................................................................................... 25
4.5.9 Check Correlation .................................................................................................... 25
4.5.10 Check Hourly Average .......................................................................................... 26
4.5.11 Check Doctor’s advice ........................................................................................... 27
4.5.12 Edit details of patient ............................................................................................. 28
2
4.5.12 Create report .......................................................................................................... 29
4.5.12 Printing .................................................................................................................... 30
5 Event code, description and resolution ................................................................................ 30
6 Notice ...................................................................................................................................... 31
3
1 Introduction to Ambulatory Blood Pressure Monitoring
Ambulatory blood pressure monitoring is a diagnosis technology for collecting blood pressure
data at intervals for 24 hours, and a clinical tool for collecting many blood pressure data.
Currently, in clinic, the parameters widely-used in ABPM (ambulatory blood pressure monitor)
contain: systolic pressure (SBP), diastolic pressure (DBP), pulse rate (PR), mean blood
pressure, overnight changes in blood pressure, white-coat analysis, blood pressure variability,
blood pressure smoothness index, arterial stiffness index and morning peak index and so on.
Ambulatory blood pressure monitoring is superior in predicting target organ damage, morbid
events, or cardiovascular risk.
Scope of application:
Hingmed Ambulatory blood pressure monitor is an auxiliary diagnosis. Doctor could give
advice to use this medical device by his/her judgment if the patient is:
● Hypertension;
● Hypopiesis;
● Borderline hypertensive (BH), renal inadequacy;
● Control efficacy of anti-hypertension, drug evaluation and so on.
Users should refer to documents before application, the first document is “User Manual” which
is mainly about the application of pressure monitor host, and the second document is “User
Guide of PC software” which is mainly about the application of PC software.
2 Software introduction
The software is a simple, powerful application that allows maximum flexibility in the ambulatory
blood pressure study, interpretation, and reporting. The functions of the software include data
playback, management of medical advices and patient data, analysis of measuring records,
review of trend chart, comparison of patient data, and blood pressure values in different body
positions, report printing and so on.
The software is easy-to-use, that is, if only operator can operate computer and know the basic
operation of windows system. Users should read this user guide carefully before use.
The menu-driven design of the software enable user to analyze the ABP data in a number of
ways. User could decide the items of report by his or her demands. Overview of the blood
pressure characteristics in data analysis report could help to evaluate the blood pressure data.
Home page of the report supplies the basic blood pressure analysis and patient information.
4
Statistical analysis, histogram, hourly average, fitting chart and pie chart indicate the blood
pressure trend well to assist in patient treatment. Statistical calculations, including Difference
of Pulse Pressure and Pressure Rate Product, provide further analysis of patients.
The PDF report creates by the software makes it easy to share the information of the patient.
Any of the following combination could be contained in the report:
• Patient information on the home page, blood pressure data analysis, statistical result, trend
chart, and diagnosis and so on;
• Statistics;
• Histogram, pie chart and fitting chart;
•Hourly averages of collected ABP readings with additional statistical analysis;
•Detailed record of collected ABP readings.
Hingmed software has a good capacity of storage and retrieval of history data. The stored
data is never lost even if the software is reinstalled after uninstalling the software, which
attributes to the separation of software installation path and database path. Under fault
condition, the history data could be retrieved by restarting the software, even when monitor is
disconnected.
If the software failure is due to system problem or other problems, shut down the software and
restart it.
The software is open, it is no need to set the passwords or access authority.
Both Chinese and English versions are available; user could select a proper one by his or her
demand.
The minimum demands for computer configuration
• Windows 2003, Windows XP or more advanced Windows system
• The minimum display adapter (1024*768 resolutions) with at least one available USB port.
• Minimum 20M disk space.
3 software installation
3.1 Version Summary
There are two versions of the software: server version and stand-alone version. Customer
could choose one of the two. The details of version are as following:
a)Server version: Several customers in a Local Area Network (LAN) could access to a
5
database at the same time if one computer or the LAN server is installed of server-side. The
data that related to the software is shareable among computers. But once the computer host
with server-side or the LAN server is closed, other computers would not access. It fits hospital.
b) Stand-alone version: The stand-alone version is software used on a single computer. The
data is not shareable among computers.
Version information: Hingmed ABP software version 1.0, released at April 24, 2014.
Note: The information in the guide may lag behind due to the version upgrading. The
actual version and release date refer to the message on the software.
3.2 Install the software
The only difference between the two versions is: server version need the installation of
server-side. The installation is as following:
3.2.1 Install MySQL database
a) Input IP address.
b) Find the file (MySQL 5.5 Command Line Client) in installation disc. Double-click and install
the software.
Note: Follow the instructions in disc to operate, except the options displayed in Figure
1 need modification.
(Figure 1)
3.2.2 On above dialog box, you should:
a) In third option, select “gbk” or “gb2312” from the dropdown menu.
b) As Figure2, run the script “rbdb.txt” in the server “mysqlclient”, run command is: source +
space key + text path + text name.
6
(Figure.2)
The accomplishment of this step indicates the successful installation of server-side.
3.2.3 After installing the sever-side, the next steps of installing the sever version are the same
as stand-alone version, put the Installation CD into CD drive, then follow the steps below:
a) Open “my computer” or “computer”;
b) Click CD drive and find installation software “HingMed”, select server software version or
stand-alone software version according to your actual need;
c) Double-click the installation program and click→“next”→“next”. Select a language (Chinese
or English) and click “next” and continue to install. On the final dialog box, click “close” to finish
the installation as Figure3.
(Figure 3)
After installation, an icon as Figure.4 displays on the computer table. PC software of Hingmed
ABPM has been installed in your computer successfully.
7
(Figure 4)
3.3 Uninstalling the software
The uninstallation of the software is as same as that of common software:
a) Click “start”——find the icon of HingMed blood pressure software in program——click
“uninstall”;
b) Or, uninstall on “control panel”.
4 Use of ABPM software
The use of ABPM software is very simple and flexible.
• Connect the software to monitor by USB data wire;
• Collect and retrieve the records;
• Moreover, users could set the parameters through PC software to control the measuring
activity.
The first user should firstly set the database, i.e. patient information and medical history
database; the database path may be set based on his/her needs. (See the detail of path
establishment in this chapter: Software use → Menu → Management → Configuration →
Data Configuration)
4.1 Menu and Toolbar introduction
4.1.1 Menu
• Blood Pressure Data: Mainly patient information management, playback and view.
• Programming: Set blood pressure monitoring frequency and time; input patient information
and set functions and parameters for monitoring.
• Read: Upload the blood pressure records into computer after measuring.
• Management: Database path setting; Data exporting/importing, function configuration and
on-line help.
• Exit: Exit the software
8
4.1.2 Toolbar
• Trend charts: Display raw data, edit blood pressure threshold value, set statistical parameter
and show blood pressure trend curve.
• Statistics: Record and analyze blood pressure at different intervals, and count various
parameters for reference.
• Histogram: Distribution proportion of blood pressure records in different range.
• Pie Chart: Proportion of the blood pressure records which are beyond the standard setting.
• Scatter Plots: Linear fitting distribution of systolic pressure values relative to diastolic
pressure values and to heart rate values respectively, and correlation coefficient, and
distribution center points.
• Hourly Average: Analyze the average hourly of systolic pressure, diastolic pressure, mean
pressure, heart rate, pressure & rate product, and the comparison analysis of one patient in
distinct time.
• Medical Advice: Condition description, doctor’s diagnosis and prescription.
• Patient Details: Fill in patient information details and medical history.
• Printing: Print the reports
• Print Preview: Preview the report
• PDF Files: Report of Adobe Portable Document Format
• Exit: Exit current database
4.2 Software use
Connect the Hingmed Ambulatory Blood Pressure Monitor (ABPM) to computer through USB
data wire.
Make sure the monitor is removed from patient; and connect the ABPM to your computer by
USB data wire.
4.3 Menu introduction
The command functions in menu contain: Exit, Management, Programming, Read and Blood
Pressure Data.
4.3.1 Exit
Click “Exit” to exit the software after the operation finish.
4.3.2 Management
Mainly modify the configuration of the basic settings of the software. The command contains
some subcommands: Import, Export, Help and Configuration.
9
4.3.2.1 Import: Import the patients’ data from computer to software for further study. The
format of the data must be consistent with the requirements of the software, and this data
are generally uploaded by other users from the software.
4.3.2.2 Export: Export the patient data from the software.
4.3.2.3 Help: Use this function when you have troubles in software use.
4.3.2.4 Configuration:
a) Database configuration
Database configuration method: management-> configuration -> Database configuration. The
dialog box as below Figure.5 pops up.
(Figure5)
Select “
”, then click “
”. User may set individual storage path, click “Save”, then
the following search or uploading data will be stored in the setting path automatically.
b) Color configuration
Database configuration method: management-> configuration ->color configuration. The dialog
box as below Figure 6 pops up. Users may modify the color by their demands. Restart the
software, the color modification will become valid.
10
(Figure 6)
c)Hospital information configuration
Database configuration method: management → configuration → hospital information. The
dialog box as below Figure 7 pops up.
(Figure 7)
Fill in with hospital information, click “Update” at top left corner, and click “Exit”. The hospital
information will appear on the top of printing page.
4.3.3 Programming
Mainly set the monitoring frequency and time, import patient information and set the functional
parameters of monitor through PC software shown in Figure 8.
11
(Figure 8)
1. Patient No.: Patient number set by doctor or hospital system.
2. Name: Fill in the patient’s name which is required, or the programming will fail. There is no
limitation on patient name quantity.
3. Patient of same name: it locates on the left bottom corner,
, if
there are the same patient names in the system when inputting patient name, then the same
patient name will display in the blank. If the names are verified to be the same patient as the
current patient, then tick the box before the names, and the data of the current patient will be
saved in the original directory after retrieving data, If not, DO NOT tick the box.
4. HIS No.: The number of patient in HIS system of hospital. If the in-patient has not the
number, keep blank.
5. Type of time: Daytime is the time except of sleeping. Nighttime is the sleeping time.
Generally, time type is set in accordance with the patient’s sleeping habit. Special 1 to 3 are
additional periods by which doctor could monitor the blood pressure in wanted periods. If
doctor consider it is not necessary, keep the blanks “Null”.
6. Time interval: The interval between two successive measures. There are 5, 10, 15, 20, 30,
45, 60, 90 and 120 (min) options to choose from.
7. Maximum pressure setting: It can be set 40 mmHg higher than the possible maximum
systolic BP reading. Note that the setting maximum pressure doesn’t mean the cuff pressure
of each inflating; it’s just the upper limitation of inflation pressure in terms of safety purpose.
12
8. Study within 5min: Tick the box before it, then the monitor will start to measure
automatically within 5 min after programming. If do not select this item, user needs to press
“Start” key on the monitor manually to start the programming measurement.
9. Display: There are enable, disable options. If choosing “Disable”, the screen will only
display time, battery capacity and other general information, but do not display BP readings,
which can avoid unnecessary impaction to subjects who see the measuring results. Note that
the setting of disable will only start to work after 30 minutes later, within 30 minutes, screen
will still display the BP readings. If choose “Enable”, the screen will display BP readings
normally.
10. Keypad: There are enable, disable options. If choosing “Disable”, the functions of the keys
will disable except power on and power off, and measuring process will follow the
programming. Note that the setting of disable will only take effect after 30 minutes, user can
still start/stop measuring within 30 minutes.
11. Time Interval: Two modes are optional, i.e. “Standard” or “Fixed”. For “standard” mode,
there is +/-2min of deviation. For “fixed” mode, there is no deviation.
12. Daytime alarming: “Enable” or “Disable” is optional. Select “Enable”, the monitor will alarm
at daytime if the reading exceeds the setting value. Select “Disable”, there is no alarm.
13. Nighttime alarming: “Enable” or “Disable” is optional. Select “Enable”, the monitor will
alarm at Nighttime if the reading exceeds the setting value. Select “Disable”, there is no alarm.
14. Maximum systolic pressure setting: Upper limitation setting of systolic pressure alarming,
monitor alarms when the readings are higher than the upper limitation.
15. Maximum diastolic pressure setting: Upper limitation of diastolic pressure alarming,
monitor alarms when the readings are higher than the upper limitation.
16. Minimum systolic pressure setting: Lower limitation of systolic pressure alarming, monitor
alarms when the readings are less than the lower limitation.
17. Minimum diastolic pressure setting: Lower limitation of diastolic pressure alarming, monitor
alarms when the readings are less than the lower limitation.
18. Unit: “mmHg” or “Kpa” is optional, unit of the readings.
19. Complete other blanks. And Click
to upload the information to monitor. Monitor
sounds “beep” after successfully programming and at the same time the screen shows a
message “programming success”. No “beep” means a failed programming.
4.3.4 Read
This function searches the data in the monitor, meanwhile upload them to computer. Click
“Read”, dialog box as below Figure 9 pops up.
13
(Figure 9)
Users could use USB data wire to obtain data, click “Read”, the data will be searched and
uploaded to computer, the monitor sounds “Beep” when reading completion, no “Beep” means
timeout and retrieving failure.
ATTENTION: Click “Save” after the reading completion, or the data will be lost.
The monitor which is conducted in the programming stage, there would be a name checking in
the column of the dialog box: “Same name patients”, see Figure 8 for details, if it’s the same
person, you can select the name in the column and then the new BP data will be automatically
saved under the same patient name in the process of data retrieving.
While retrieving data after connecting monitor with computer, if there is no patient name in the
monitor, namely user didn’t program the patient name into the monitor while programming, or
the name was deleted, there would be a question comes out:”New patient?” Select the answer
of “Yes” to precede the data retrieving. After the data transition finished, please input the
patient name. If there is the same name in the computer, then it will ask “Is it the same
person?” If select answer of “Yes”, then the data will be saved under the same person. If “No”,
the system will be saved under separate patient name even though it’s the same name.
Note: Repeating retrieve would also pop up the dialog box of “New patient?”
BP (blood pressure) records: The measuring times in total. Red digitals are uploading records
from monitor to software, black digitals are records stored in the monitor.
4.3.5 Blood Pressure Data
This function can view the user data and data playback, also can edit user data. Press “Data”
at the top toolbar, the dialog box as Figure.10 pops up, then select patient required on the left.
14
(Figure 10)
On the top- right of the dialog box there is the searching way by name and number. You can
use this function when there are too many patients and it is difficult to find the target patients
through screen viewing. Input the patient name and/or number, the possible patients will
display on the “In searching” box. Double click the patient name you wanted to obtain the
details of data.
4.4 Data information management
This function is managing patient files and data in main window.
4.4.1 Import
The function allows the user to copy the patient data from outside to a target computer.
a) Copy outside pressure data and store the data in a directory of a target computer;
b) Open software and click “Management” → “Import”;
c) Enter the dialog box as Figure 11 and click “Query”;
(Figure 11)
d) Select the wanted patient in the directory and click it;
e) Click “Import” to open and analyze the data.
4.4.2 Export
15
The function exports the ABP data. Steps are as following:
a) Click “Data” and select the target data;
b) Click icon “ ” or double click patient name → “Room time” → “Measure time” by the left
mouse button, select measure time, click the right mouse button and select “Export data” in
the Pop-Menu;
c) Choose a storage path in the Pop-Menu, and click “store” to store the files in the defined
directory;
d) Alternatively, export data by opening the wanted data and click “Management” → “Export”
in the menu. Choose a storage path and click “Save”.
4.4.3 Delete and add
This function allows you to delete the data of one or several patients. All of the blood pressure
data of the patient will be deleted by this function. Operate as following:
a) Click “Data”, it pops up the dialog box as Figure 10.
b) Delete patient data: select the target patient, and click the right mouse button, then select
“Delete the patient” in dropdown menu to delete the data.
c) Add patient data: select the target patient, and click the right mouse button, then select “Add
being hospital” in dropdown menu, then it pops up a dialog box named “In Hospital
Information”, see Figure 12, user can update, delete or add information in the blanks except
blanks of “Patient ID” and ”Name”, then click “Add ”, “Update”, ”Delete” on the top, and click
“Exit” to shutdown the dialog box.
d) Add measuring data: double click the patient name by the left mouse button, then click the
“Room date” by the right mouse button, select “Add measure”, select “Yes” on the box of
“Would you want to empty the device’s data”, then it pops up the dialog box shown in Figure 8,
re-program the monitor for further measuring.
(Figure 12)
16
e) Double click “Room date” by the left mouse button, then click the “Measure Time” by the
right mouse button, then user can select the operations of “Export data”, ”Set standard
BP”, ”Set awake and asleep”, ”Delete the measure”.
Note: 1 Operation of “Program” can delete the data saved in the monitor;
2 After operation of “Read”, click “Save” on the dialog box, or the data would be lost.
4.5 Toolbar use
4.5.1 Edit and study an ambulatory blood pressure
Introduce the function of trend chart, select the patient data, double click “Room date”, and
double click “Measure Time”, then data trend chart shows on the software, see Figure 13.
(Figure 13)
4.5.2 View Ambulatory Blood Pressure (ABP) study
See Figure13, it displays all raw data in the left top area: systolic pressure, diastolic pressure,
heart rate, measuring time, body position and event code.
Below the table it is blood pressure trend chart. X-axis is time, and Y-axis is blood pressure
readings with the unit of mmHg or Kpa, and heart rate readings with the unit of bpm.
Beside the raw data area, there are two options: “Threshold” and “Analysis function”.
Click “Threshold”, there are two options: “Edit Awake/Asleep period” is used to set the
start/end time of day and night, see Figure 16; “Edit Thresholds” is used to set the analysis
standard of blood pressure values, see Figure 17. AHA/JNC7 is America Hypertension
Association standard, ESH is European Society hypertension standard. “Default” is used most
commonly for doctor. “Manual” means user can set a standard by oneself. User clicks
“Update” to confirm the settings.
“Analysis Function” allows users to select the wanted statistical items. Tick the box before the
item you want, which means the analysis results will follow the ticked items, and vice versa.
17
(Figure 14)
From Figure 14, the shaded area with different colors means the studying period. Default color
meanings are:
• Blue Shadow: White-coat period, it means one hour period after measuring;
• Light Gray Shadow: Asleep period;
• Green Shadow: Morning peak period.
The color could be changed, please see 4.3.2.4 - b for details of color configuration”.
Adjust the size of graph by:
a) Adjusting vertical axis: Move mouse pointer on vertical axis area. Press mouse left button;
pull the pointer upward or downward to adjust the size of graph when the pointer becomes
double-headed arrow.
b) Adjusting horizontal axis: Move mouse pointer on the area below horizontal axis. Press
mouse left button, pull the pointer on the left or right to adjust the size of graph when the
pointer becomes double-headed arrow.
Adjust the size of table by:
a) Moving the mouse pointer on the bottom lines.
b) Pull the pointer upward or downward to adjust the size when the pointer becomes
double-headed arrow.
4.5.3 Edit an ambulatory blood pressure (ABP) study
You could edit the ABP study when you view the historical data.
1 Exclude the records
In the trend tab, records marked “*” by monitor will not be analyzed, and will be neglected in
printing, user can also mark “*” by moving the cursor to the relevant box of “Tag” column, then
click by left mouse button, to exclude the data that will not be analyzed by user’s needs,
18
meanwhile, user can also delete “*” by clicking the left mouse button. If a measurement failure
without records occurs, the data will be marked with “!” in retrieving. The marked data will be
neglected in analysis, “!” could not be cancelled manually.
2 Select data
a) If select one reading in the form, there would be a vertical broken line on the trend chart
marked the reading points.
b) If select one reading point on the trend chart, there will be a vertical broken line, and the
relevant data in the form will become blue background.
3 Data in the table
a) The interpretation of the terms “Systolic Pressure, Diastolic Pressure and Heart Rate”,
sees the “View Hourly Average” in the guide.
b) Event code (EC): it is the code of event causes. Software identifies incorrect records
automatically during retrieving and marking with “*” or “!” in “Tag” column. The code will
be given in “EC” column, and the event causes will be listed in “Comment” column.
c) Body position: It is a characteristic feather of our monitor. Our monitor can judge the body
positions during the application. The body potion options are: “Stand/Sit”, ”Slight
Motion”, ”Lying” and ”Heavy Motion” etc.
d) Comment: it is written by doctor, doctor can make an option in accordance with patient’s
actual situations. Details refer to Figure 15.
(Figure 15)
4 Adjust daytime (awake)/nighttime (asleep)
“Daytime” and “nighttime” have been set in programming. You can change the setting later if
needed. Operation as follows:
a) Select “Threshold” on Trend chart;
b) Click “Edit Awake/Asleep Period” to adjust the awake time and asleep time;
c) As Figure16, you could move the Time-Slice to reset awake time and asleep time in the
tab. The dark part represents asleep time and white part represents awake time. The
clock is Beijing Time, i.e. 12:00 is noon, 18:00 is 6 p.m., 00:00 (or 24:00) is midnight.
d) Click “Update” for successful update.
19
(Figure 16)
4.5.4 Adjust blood pressure Threshold
Blood pressure threshold applies to all patient files and contains: JNC7/AHA, ESH, default
setting and user-defined.
JNC7/AHA: according to the Seventh Report of Joint National Committee of USA on the
Prevention, Detection, Evaluation, and Treatment of Hypertension, the threshold during
waking period is 135/85/85, and 120/75/75 for sleeping period.
ESH: The ESH (European Society of Hypertension) guides the threshold is 135/85/85 for
waking periods and 120/70/75 for sleeping periods.
Default setting: The default setting for Hingmed is 140/90/85 for waking periods and 120/80/75
for sleeping periods.
User-defined: It applies to all studies for a particular patient. The setting can be adjusted
individually in line with actual situations.
Operation as follows:
a) As Figure 17, select “Threshold”→ “Edit Thresholds” in Trend chart tab;
b) Select blood pressure threshold in line with actual situations;
c) Click “Update” for successful update.
20
(Figure 17)
4.5.5 View Analysis Function
Click “Analysis Function” on “Trend” interface, see Figure 18:
(Figure 18)
The tab contains five options: White-Coat analysis, BP variation coefficient, BP smoothness
index, Arteriosclerosis index, Morning Surge. (The interpretation of these terms is presented in
the following “Note”)
You can choose to enable or to disable the White-Coat analysis. The white coat syndrome
affects patients whose blood pressure is abnormally rising when they are in a medical
environments.
Enable the white-coat analysis by ticking “√” in the box, the other options are as the same. The
chosen indexes and their statistical result will be displayed in statistical table.
View statistics: Click “Statistics” →“Main statistics” in the toolbar and open the statistical
21
analysis. The tab as Figure 19 displays:
• Whole day: analyze all the data of measuring period;
• Daytime: the data of awaking period;
• Nighttime: the data of sleeping period;
• White coat time: If select the White-Coat Analysis, then you can get the “White coat
analysis” form which is based on the BP readings within first hour.
(Figure 19)
Asleep Dip: it is the analysis about how much dip the BP readings descend from sleeping
period to waking period. Base on this analysis, Hingmed BP program tell the patients which
situation they belong to in below options.
Note: The following statistical indexes just as a reference for medical staff!
• Reverse-dipper: A patient shows a decrease of 0% or less systolic or diastolic blood
pressure readings taken during sleep compared to readings taken when awake.
• Dipper (normal): A patient shows a decrease of 10% ~ 20% systolic or diastolic blood
pressure readings taken during sleep compared to readings taken when awake.
• Non-dipper (abnormal): A patient shows no decrease or less than a 10% decrease,
meaning his or her blood pressure does not fall during sleep compared to the readings
while awake.
Extreme: A patient shows a 20% decrease of systolic or diastolic blood pressure readings
taken during sleep compared to readings taken when awake.
Blood Pressure Load (BP Load): The percentage of readings exceeds the upper limited
threshold, e.g. 75.4% of BP Load means that 75.4% of the readings are above the upper
limited threshold. The possibility of hypertension correlates with the BP load, high
22
percentage of BP load means more possibility of hypertension. BP Load is counted in
distinct period based on different systolic pressure and diastolic pressure.
Blood pressure smoothness index (SI): SI is an index of evaluating the antihypertensive
effects. Ambulatory Blood Pressure Curve Smoothness Index is a ratio of the average of
hourly dropping values to standard deviation after 24 hours’ medical treatment. High SI
value means better and more balanced antihypertensive effects.
Blood Pressure Coefficient of Variation (CV): CV is a ratio of standard deviation to BP
hourly average decreasing. The index reflects the blood pressure fluctuation in a certain
period of short-term or long-term. The CV values of 24-hour, daytime or nighttime represent
blood pressure fluctuation of distinct period. SI=1/ CV, reflects the stability of blood pressure
decreasing.
Morning Surge (MS): The biggest fluctuation of blood pressure usually occurs in early
morning. At that time the patients become active from sleeping state and the blood
pressures rise rapidly up to a high level (even up to the highest level in a day). The MS is
the average value of systolic pressure readings within 2 hours from awaking minus the
average value of the lowest systolic pressure readings within one hour in sleeping state.
Ambulatory Arterial Stiffness Index (AASI): AASI is an index reflecting the arterial stiffness.
The index value is attained by processing and calculating the 24-hour’s ambulatory
monitoring data.
AASI is formulated as 1 – f, f is a regression slope of the diastolic blood pressure and systolic
blood pressure. It reflects the severity of arterial stiffness, AASI values approaches to 1 more
closely, it means the arterial stiffness is more severe, It reflects the stiffness of the whole
arterial system, not just some parts of the system.
4.5.6 View Statistics in special period
If you program the BP measuring in special period, then the software can count the readings
in the special period individually, click “Statistics”→“Time slice statistics”, see Figure 20:
23
(Figure 20)
4.5.7 View Histogram
Histogram shows the percentage of readings which distributes different ranges; click
“Histogram” in the second row of top-toolbar, as shown in Figure 21:
(Figure 21)
These histograms contain the information of systolic pressure, diastolic pressure and heart
rate in whole day, daytime and nighttime.
a) Y-axis: The percentage of systolic pressure, diastolic pressure or heart rate, e.g. 40% SYS
in whole day represents that the percentage of the systolic pressure in all systolic pressure
readings is 40%.
24
b) X-axis: it means blood pressure values or heart rate values. The unit of blood pressure is
mmHg or kPa, 1kpa=7.051mmHg.
Under the X-axis, the first row is the readings with unit mmHg and the second row is the
reading with unit kPa. i.e. 120 is 120mmHg, 16.0 is 16.0 kPa.
4.5.8 View Pie chart
The pie chart shows the percentage of readings which are beyond the setting standard blood
pressure values, click ”Pie Chart” in the second row of top-toolbar, as shown in Figure 22:
(Figure 22)
These Pie charts contain the information of systolic pressure, diastolic pressure and heart rate
in the whole day, daytime and nighttime.
a) The pie chart is based on the BP standard on the left. The data on the left of each pie chart
are the highest and lowest readings and happening time during related time slot.
b) The red part in the pie chart represents the proportion of readings beyond standard setting.
The green part represents the proportion within the standard setting.
c) Maximum represents the maximum reading during the measuring period. Minimum
represents the minimum reading during the measuring period.
d) The BP standard on the left side cannot be adjusted. If it needs to be adjusted, please go to
Trend - Threshold - Edit Threshold, see Figure 17 for details.
4.5.9 Check Correlation
User can check the linear fitting gragh of ABP study by clicking “Correlation” in the second row
of top-toolbar. See Figure 23.
Linear fitting gragh makes all the BP readings to fit linearly; it establishes the regression
25
equation to analyze the linear relationship between systolic pressure and diastolic pressure,
as well as systolic pressure and heart rate. For instance, in the data (120/80/65), respectively
means systolic blood pressure, diastolic blood pressure and heart rate, “120/80” corresponds
to one point in the left graph, and “120/65” corresponds to one point in the right graph.
(Figure 23)
4.5.10 Check Hourly Average
You can view hourly average readings by clicking the “Hour Average” in the first row of
top-toolbar. The readings display in the table. See Figure 24.
(Figure 24)
Users can tick and select the indexes of Systolic BP, Diastolic BP, Mean BP, Heart Rate and
SYS*Rate/1000.
26
• Systolic Blood Pressure (SBP): The highest arterial blood pressure reached when the
ventricles are contracting. WHO standard: hypertension (adult SBP ≥ 140mmHg or/and DBP ≥
90mmHg); borderline hypertensive (adult SBP: ≥130mmHg and ≤ 140mmHg); normal
pressure (adult SBP ≤ 130mmHg); ideal pressure (adult SBP ≤ 120mmHg).
• Diastolic Blood Pressure (DBP): The lowest arterial blood pressure when the ventricles are
relaxed and the arterial vascular walls elastically retract.
• Mean Arterial Pressure (MAP): It means the average value in the artery over the period of
one heart beat, its average value of normal adult is 70-105mmHg, it is calculated: MAP=
(SBP+2*DBP)/3, or MAP=DBP+1/3(SBP-DBP).
• Difference of Pulse Pressure: It is calculated by subtracting the diastolic from the systolic
reading. It is another hemodynamic parameter that may serve as an indicator for
cardiovascular risk.
• Heart Rate (HR): The number of heartbeats per unit of time, usually expressed as beats per
minute. The HR is 60-80 times per minute for normal people. Activity will increase the HR. The
HR of athlete is slower than normal people.
• Pressure Rate Product (PRP): This is the product by multiplying the average systolic reading
and the average heart rate, then divide by 1000. PRP strongly correlates to a patient’s action
and body position and may be a key indicator of cardiovascular risk.
• Comparison: It is to compare the BP readings collected at different dates on the same patient
based on the hourly average data, such as to compare the BP reading of today and two weeks
ago, then we can find if there would be BP reading improvement after two weeks treatment,
which can help doctor to make further diagnosis. The operation processes are: Open patient
data----click comparison on the hourly average screen—the screen gives options of different
measurement date---select one date to precede the comparison. Then the screen will give the
hourly average comparison of the two dates’ readings.
4.5.11 Check Doctor’s advice
You can check or edit doctor’s advice, prescription and the information of doctor in charge by
clicking “Dr. advice” in the second row of top-toolbar. Dialog box as Figure 25 pops up.
27
(Figure 25)
To edit “Advice” or “Medications”, please:
a) Select “Dr. advice”, input your advices in “Advice” column.
b) Increase the information of “medications”, please:
Firstly: Input medicine name to the blank of “Medications” in the bottom.
Secondly: Input “Dose”, “Frequency”, click “Add” to add the messages to above box.
c) Click “Save” after completion of inputting.
4.5.12 Edit details of patient
Depending on the actual conditions, users can edit Basic Information (Patient ID, Gender,
Name, HIS NO., Social security NO., Nationality, Phone NO., E-mail, Zip code, Identify NO.,
and Address etc.) and Hospitalization Information (Date, Weight, Room NO., Height,
Department, Medical history etc.). See Figure 26.
28
(Figure 26)
To edit details of patient, please:
a) Select “Patient” on second row of top-toolbar;
b) Then input the information in the blanks directly;
c) Click “Save” after updating the information.
4.5.12 Create report
Print preview
a) To create and view BP analysis report, click “Preview” on second row of top-toolbar, it
appears “Preview” dialog box, see Figure 27.
(Figure 27)
29
b) Select the items you want on the configuration box as shown in Figure 27. Home page is a
summary of the whole report, which contains details of patient information, trend chart, and
statistical analysis of blood pressure records, prescription and others such as detailed
Statistics, Histogram, Pie chart, Fitting chart, Hourly Average and detailed raw records.
c) Click “Preview” button to browse the report.
d) If need, you could click “Print Page” to print the current page, and click “Print” on the top left
corner to print the whole report.
4.5.12 Printing
If you want to print the data, please:
• Click “Print” in top toolbar directly. Select a proper printer in Pop-menu.
• Then click “Print” to complete. The report fully contains all details.
Store the report with PDF format: click “PDF File” and store the report in a defined directory
with PDF format, and users can also select the desinated store place by themselves. This
function is better for the sharing of patient information.
Exit the current patient data: click “
displaying;
” on second row of top-toolbar to exit the current
Exit Hingmed blood pressure software: click “
click “
” on first row of top toolbar. Alternatively,
” on top right corner of the software.
Introduction of symbols in printing report: The following symbols are shown in the original BP
data report pages:
Symbols
Explanation
“+”
Indicates that the reading was measured manually by pressing the Start/Stop
key on the monitor.
“r”
Indicates that this reading was a re-measuring reading, it starts measuring
blood pressure by pressing the Start/Stop key manually and obtains the
reading.
“*”
Indicates that the records exceed the standard setting.
5 Event code, description and resolution
Event
Code
Description
Resolution
EC 01
Loose cuff caused winding loose or cuff is
not winded
Retighten cuff or keep correct posture
when measuring
30
EC 02
Gas Leakage due to valve or air circuit
leaks
Tighten connector and check cuff and
hose. Contact with distributor if leakage
cannot be stopped
EC 03
Pressure error (valve does not open
normally)
Check whether electromagnetic valve
works normally or not
EC 04
Weak signal (too weak pulse or loose cuff)
Tighten cuff if it is too loose
EC 05
Blood pressure exceeds range, maybe the
subject’s BP pressure exceeds the
maximum measuring range.
Press [Start/Stop] button to measure
again. If problem persists, change a
monitor of larger range to retry
EC 06
Excessive motion, maybe signals contains
too much motion artifact or interference
Keep quiet and don not move the arm
with BP cuff in measuring
EC 07
Overpressure, in adult mode, the pressure
exceeds 290mmHg
Press [Start/Stop] button to measure
again
EC 08
Saturated signal (large signal amplitude
due to motion or other reasons)
Keep quiet, press [Start/Stop] button to
re-measure
EC 09
Measurement overtime (exceed 150s in
adult/children mode)
Keep quiet, Press [Start/Stop] button to
re-measure
EC 10
Manually stop
Keep quiet, Press [Start/Stop] button to
re-measure
EC 11
System error
Reopen device. If the error is frequent,
ask professional to maintain
EC 16
Cuff pressure exceeds the maximum
setting
Reprogram in PC software and raise
the maximum setting
EC 32
Handshaking communication failure
Press [Start/Stop] button to measure
again
EC 33
Safety pressure exceeds
cannot measure again
15mmHg,
Deflating until the pressure is lower
than 15mmHg and re-measure
EC 34
Measurement finish, measure again when
the pressure is still above 15mmHg
Deflating until the pressure is lower
than 15mmHg and re-measure
EC 35
No response after start measuring, and
measurement fails
Press [Start/Stop] button to measure
again
EC 36
Measuring results are unattainable
Press [Start/Stop] button to measure
again
EC 37
Measurement overtime
Measure again
EC 48
Full of internal memory, cannot measure
again
Empty the data after program the
monitor
*If the event could not be corrected, please call agent or after-service department of Hingmed for
help.
6 Notice
A) The software supports the analysis of 72-hour successive records at most, and the software
will not support the analysis of records which are exceeded 72 hours.
31
B) Technology assists to Hingmed ambulatory blood pressure monitoring software:
Installation
Firstly: Use the program supplied in setup disk to install Hingmed software.
Secondly: Please place setup disk in the CD drive of your computer. The CD will run
automatically, screen will display the installation instructions.
If the CD does not work automatically, operate as following:
a) Open “my computer”;
b) Double-click CD drive and open the CD;
c) Double-click to install the file of HingMed.EXE;
d) Operate by following the instructions on screen.
C) Technology statement about Hingmed Website
If you have any trouble in using our product, please refer to “Management” → “Help” on the
top toolbar of software, or log in our website: www.Hingmed.com for help. If the problems are
still unsolved, please contact after-service department of our company.
You can log in our website to download the latest version of software, or turn to the after-sale
department of HingMed for help.
Contact way:
Company: Shenzhen Hingmed Instrument Co., Ltd.
Address: 4F, Zhonghangfeixiang Building, NO.371, Guangshen Road, Bao’an District,
Shenzhen, China.
Telephone: 086 075523720600
Fax: 086 075523720602
E-mail: [email protected]
32