1
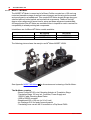
Thorlabs Beam
Beam Analyzing Software
BP104-UV, -VIS, -IR, -IR2
BP109-UV, -VIS, -IR, -IR2
Operation Manual
2011
Version:
Date:
4.0
22.02.2011
© 2011 Thorlabs
© 2011 Thorlabs
Table of Contents
Foreword
Part I General Information
4
5
1 Safety
................................................................................................................................... 5
Part II Getting Started
6
1 Ordering
...................................................................................................................................
Codes and Accessories
6
2 Unpacking
................................................................................................................................... 6
3 Preparation
................................................................................................................................... 6
4 Operating
...................................................................................................................................
Elements
8
Rotation mount
......................................................................................................................................................... 8
Mounting plate
......................................................................................................................................................... 9
Part III Operating the Beam Profiler
10
1 Requirements
................................................................................................................................... 10
2 Operation
...................................................................................................................................
Principle
10
3 Installation
................................................................................................................................... 11
Softw are Installation
......................................................................................................................................................... 11
Connection
.........................................................................................................................................................
to the PC
21
Start the Application
......................................................................................................................................................... 22
4 The
...................................................................................................................................
Graphics User Interface (GUI)
24
GUI Overview
......................................................................................................................................................... 24
Child Window
.........................................................................................................................................................
s
29
2D Reconstruction
.................................................................................................................................................. 30
3D Profile .................................................................................................................................................. 32
X,Y Profiles
.................................................................................................................................................. 33
Calculation..................................................................................................................................................
Results
34
Pass/Fail Test
........................................................................................................................................... 36
Plots
.................................................................................................................................................. 37
Plot Positions
........................................................................................................................................... 38
Plot Pow er........................................................................................................................................... 39
Plot Gaussian
...........................................................................................................................................
Fit
40
Beam Stability
........................................................................................................................................... 41
Save Settings
......................................................................................................................................................... 42
5 Measurement
...................................................................................................................................
with the Beam Profiler
43
Operating.........................................................................................................................................................
the Instrument
44
Device Settings
......................................................................................................................................................... 46
Application
.........................................................................................................................................................
Settings
49
User Pow er
.........................................................................................................................................................
Calibration
53
Measurement
.........................................................................................................................................................
Results
54
Save Measurement
.........................................................................................................................................................
Results
55
Pow er Ranges
......................................................................................................................................................... 60
Pulsed Laser
.........................................................................................................................................................
Sources
61
6 Beam
...................................................................................................................................
Quality (M²) Measurement
64
General ......................................................................................................................................................... 64
Selecting .........................................................................................................................................................
Focal and Stage Length
68
Extension.........................................................................................................................................................
Hardw are
71
BP1M2 Extension
..................................................................................................................................................
Set for M² Measurements
71
© 2011 Thorlabs
Recommended
..................................................................................................................................................
Accessories
72
M2SET - M2-Meter
.................................................................................................................................................. 74
Setup and ...........................................................................................................................................
Electrical Connections
75
Acceptable...........................................................................................................................................
Beam Diameters
76
Setting up......................................................................................................................................................... 79
Mechanical
..................................................................................................................................................
Setup
79
Electrical Connections
.................................................................................................................................................. 82
Installation ...........................................................................................................................................
of USB to RS232 Converter
82
M² Measurement
......................................................................................................................................................... 84
Initialize .................................................................................................................................................. 84
Beam Alignment
.................................................................................................................................................. 86
M² Panel .................................................................................................................................................. 91
M² Settings.................................................................................................................................................. 94
Running The
..................................................................................................................................................
Measurement
96
Numerical ..................................................................................................................................................
Results
98
Troubleshooting
.................................................................................................................................................. 102
Divergence
.........................................................................................................................................................
Measurement
103
Divergence
..................................................................................................................................................
Measurement Panel
103
Divergence
..................................................................................................................................................
Measurement Settings
105
Running The
..................................................................................................................................................
Measurement
106
Numerical..................................................................................................................................................
Results
107
Part IV Computer Interface
109
1 Libraries
................................................................................................................................... 109
2 Sample
...................................................................................................................................
Programs
111
3 Thorlabs
...................................................................................................................................
Beam Library
114
Part V Maintenance and Repair
115
1 Version
...................................................................................................................................
and other Information
115
2 Warnings
...................................................................................................................................
and Errors
115
3 Cleaning
................................................................................................................................... 116
4 Troubleshooting
................................................................................................................................... 117
Part VI Application Note
118
1 Coordinate
...................................................................................................................................
systems
118
2 Raw
...................................................................................................................................
Data Measurements
118
3 Ellipse
...................................................................................................................................
(fitted)
119
4 X-Y-Profile
...................................................................................................................................
Measurement
120
5 Gaussian
...................................................................................................................................
Fit Measurement
120
6 M²
...................................................................................................................................
Theory
121
Focal and.........................................................................................................................................................
stage length calculation
124
Part VII Appendix
125
1 Certifications
...................................................................................................................................
and Compliances
125
2 Warranty
................................................................................................................................... 126
3 Copyright
................................................................................................................................... 127
4 Technical
...................................................................................................................................
Data
128
Technical.........................................................................................................................................................
Data Beam Profiler
128
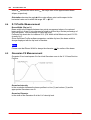
Typical Photodiode
.........................................................................................................................................................
Responce Curves
131
BP1M2 Extension
.........................................................................................................................................................
Set Components
133
© 2011 Thorlabs
M2SET M2-Meter
.........................................................................................................................................................
Components
134
Draw ings......................................................................................................................................................... 135
Beam Profiler
.................................................................................................................................................. 135
Slit and Photodiode
..................................................................................................................................................
Position
136
BP1M2 Mounting
..................................................................................................................................................
Adapter
137
Translation
..................................................................................................................................................
Stage VT-80
138
M2SET M2-Meter
.................................................................................................................................................. 139
5 Thorlabs
...................................................................................................................................
"End of Life" Policy (WEEE)
140
Waste Treatment
.........................................................................................................................................................
on your ow n Responsibility
140
Ecological
.........................................................................................................................................................
Background
140
6 Listings
................................................................................................................................... 141
List of Acronyms
......................................................................................................................................................... 141
List of Symbols
......................................................................................................................................................... 141
Thorlabs.........................................................................................................................................................
Worldw ide Contacts
142
Index
© 2011 Thorlabs
143
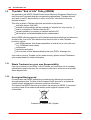
We aim to develop and produce the best solution for your application
in the field of optical measurement technique. To help us to come up
to your expectations and develop our products permanently we need
your ideas and suggestions. Therefore, please let us know about
possible criticism or ideas. We and our international partners are
looking forward to hearing from you.
Thorlabs GmbH
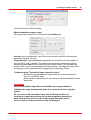
WARNING
Sections marked with this heading explain dangers that might result
in personal injury or death. Always read the associated information
carefully before performing the indicated procedure.
ATTENTION
Paragraphs preceeded by this symbol in the manual explain hazards
that could damage the instrument and connected equipment or may
cause loss of data.
NOTE
This manual also contains "NOTES" and "HINTS" written in this form.
© 2011 Thorlabs
General Information
1
General Information
This chapter contains general information about the Beam Profiler's safety, warranty
and waste treatment.
1.1
Safety
Attention
All statements regarding safety of operation and technical data in this
instruction manual will only apply when the unit is operated correctly as it
was designed for.
Before applying power to your PC system used to operate the Beam Profiler,
make sure that the protective conductor of the 3 conductor mains power
cord is correctly connected to the protective earth contact of the socket
outlet! Improper grounding can cause electric shock with damages to your
health or even death!
The Beam Profiler must not be operated in explosion endangered
environments!
The instrument must only be operated with a duly shielded and low
resistance USB cable delivered by Thorlabs.
Do not cover the Beam Profiler in order to prevent heating the instrument.
Changes to single components may be carried out or components not
supplied by Thorlabs be used. Only with written consent from Thorlabs may
This precision device is only transportable if duly packed into the complete
original packaging. If necessary, ask for a replacement package.
Be very carefully when removing one of the four filter holders on the filter
wheel, they act also as dust protection cover. Prevent any kind of dust
entering the entrance aperture!
Do not stick something into the aperture in the middle of the Beam Profiler
front! You may damage the thin-skinned slits, spoil the bearings of the motor
and/or blockade the rotating drum because there is no covering glass in
front of it.
© 2011 Thorlabs
5
6
2
Thorlabs Beam 4.0
Getting Started
This section is provided for those interested in getting the Beam Profiler up and
running quickly. The more detailed description and advanced features are described
in the following sections.
2.1
Ordering Codes and Accessories
Ordering code
BP104-UV
BP104-VIS
BP104-IR
BP104-IR2
BP109-UV
BP109-VIS
BP109-IR
BP109-IR2
Short description
Slit Beam Profiler, 200 - 1100 nm, 4 mm aperture, 2.5 µm slit
Slit Beam Profiler, 400 - 1100 nm, 4 mm aperture, 2.5 µm slit
Slit Beam Profiler, 700 - 1800 nm, 4 mm aperture, 2.5 µm slit
Slit Beam Profiler, 1000 - 2700 nm, 4 mm aperture, 2.5 µm slit
Slit Beam Profiler, 200 - 1100 nm, 4 mm aperture, 2.5 µm slit
Slit Beam Profiler, 400 - 1100 nm, 9 mm aperture, 5.0 µm slit
Slit Beam Profiler, 700 - 1800 nm, 9 mm aperture, 5.0 µm slit
Slit Beam Profiler, 1000 - 2700 nm, 9 mm aperture, 5.0 µm slit
For beam quality (M²) measurement, extension sets including a translation stage and
mounting adapter for the beam profiler are available:
Translation Stage Model
Travel range
BP1M2-50 BP1M2-150
50 mm
150 mm
BP1M2-300
300 mm
Please visit our homepage http://www.thorlabs.com for further information.
2.2
Unpacking
Inspect the packaging for damage. If the shipping container seems to be damaged,
keep it until you have inspected the contents and you have inspected the Camera
Beam Profiler mechanically and electrically.
Verify that you have received the following items:
Beam Profiler instrument as an external measurement head with dust cover
USB2.0 high speed cable
CD-ROM with all software included like graphical user interface with NIVISA® drivers and Beam Profiler driver to enable you to built your own
application program
Beam Profiler Operation Manual
2.3
Preparation
1. Install the Thorlabs Beam software to your computer as described in Software
Installation 11 .
2. Connect the Beam Profiler using the supplied USB cable to the PC as described
in Connection to the PC 21 .
© 2011 Thorlabs
Getting Started
3. Remove the dust cover.
4. Mount the Beam Profiler instrument so that its optical aperture is exposed to the
optical beam you like to measure.
5. Switch on your light source but be sure to not exceed the max. allowed optical
power to the instrument. See Power Ranges 60 for details.
Attention
Please, install the software prior to connect the instrument to your PC via
USB interface. Use only the supplied high speed (USB 2.0) cable, not full
speed (USB 1.1) cables or thin profile cables with increased resistance, this
can cause transmission errors and improper instrument operation!
© 2011 Thorlabs
7
8
Thorlabs Beam 4.0
2.4
Operating Elements
2.4.1
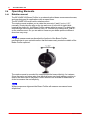
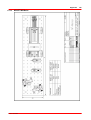
Rotation mount
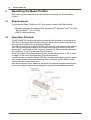
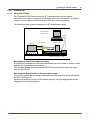
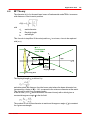
The BP104/BP109 Beam Profiler is an external optical beam measurement sensor,
and was designed for applications with an open beam.
The BP104/BP109 comes with a rotation mount.
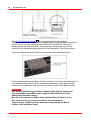
The rotation mount enables you to rotate the scan axis X and Y up to +/- 60°
manually. Simply take the plug on the top and move it to the left or right (while
keeping the mount fix) - the Beam Profiler rotates within its mount. For getting the
desired angle use the short markers every 10° and the long markers at 0° and 45°
on the rotation mount. So you are able to measure your beam profile at different
directions very easy.
Note
For good measurement results adjust the forefront of the Beam Profiler
perpendicular to your optical beam so that the beam nearly meets the middle of the
Beam Profiler aperture.
The rotation mount is essential for measurement the beam ellipticity, for instance.
Since the major and minor axis of an elliptical beam may have arbitrary position in
space, the scan axes of the Beam Profiler needs to be oriented to these axes in
order to measure the real ellipticity.
Note
Without scan axes alignment the Beam Profiler will measure erroneous beam
ellipticities!
© 2011 Thorlabs
Getting Started
2.4.2
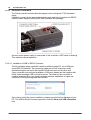
Mounting plate
On the bottom side the Beam Profiler has a mounting plate with 3 holes. Every hole
has a different thread - M6 midway, M4 rear and UNC8-32 ahead in the near of the
front side of the Beam Profiler.
Fix the Beam Profiler on your optical bench using post, post holder and base from
Thorlabs.
© 2011 Thorlabs
9
10
3
Thorlabs Beam 4.0
Operating the Beam Profiler
This section gives a more detailed description for operating the Thorlabs Beam
Profiler.
3.1
Requirements
To operate the Beam Profiler on a PC your system needs to fulfill the following
Operating system: Windows 2000®, Windows XP®, Windows Vista® (32 or 64
Bit), Windows 7® (32 or 64 Bit)
USB 2.0 high speed port
3.2
Operation Principle
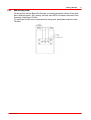
The BP104/BP109 uses the principle of scanning slits mounted on a rotating drum.
This drum is equipped with a position encoder, which delivers exact information on
the actual drum position to the analyzing software.
The slits are oriented orthogonal at angles +45° and -45° with respect to the rotation
axis. This scanning axis is tilted at 45° so that the scanning directions of the slits
appear as 0° (horizontal) and 90° (vertical), respectively. These scanning directions
are marked as X and Y on the front of the instrument.
Using the rotation mount these scanning axes can be tilted to within +/- 60° in order
to adapt it to the major and minor axes of an elliptical beam.
In addition there is a neutral density (ND) filter mounted on the drum which is used to
take integral power measurements during every revolution. So this Beam Profiler
can be used as a power meter too.
Note that the power meter readout is the result of a separate integral measurement
and is not a result of mathematical integration across the scanned beam profile.
© 2011 Thorlabs
Operating the Beam Profiler
3.3
Installation
3.3.1
Software Installation
11
Insert the "Thorlabs Beam CD 4.0" (or higher) CD-ROM in your CD/DVD drive. It
automatically starts up and displays the installation start screen.
In case this 'auto start' feature is disabled on your computer please execute the
"Autorun\Autorun.exe" file on the CD.
Quick Overview
The installation CD contains of 3 parts - Software and Drivers, NI-VISA Runtime and
Manual. Starting with the Topic"Install Software and Drivers", the Beam software is
being installed to your computer, with a subsequent check for NI-VISA Runtime: If no
NI-VISA Runtime is installed to your computer, or the installed version is older than 4.
x, you will be prompted to install it. Therefore you may use the appropriate installer
on the CD 4.0 (NI-VISA Runtime 5.0.2).
Finally, you can find this manual in PDF format on the CD.
Installation
The following procedure is described for installation to a Windows 7® operating
system.
Click to the first topic.
© 2011 Thorlabs
12
Thorlabs Beam 4.0
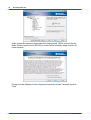
It is recommended to follow the recommended path, click Next.
Please read this license agreement carefully, choose "I agree" and click 'Next'.
© 2011 Thorlabs
Operating the Beam Profiler
13
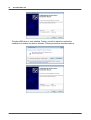
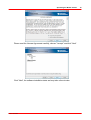
Click "Next", the software installation starts.
A new window appears, click "Next" to continue.
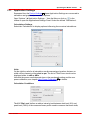
Windows Security will ask your confirmation to install the Thorlabs USB driver.
You may check the box "Always trust software from "Thorlabs GmbH", this will
shorten the installation. However, if you do not want to do that, please click the "Install
button.
© 2011 Thorlabs
14
Thorlabs Beam 4.0
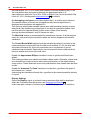
Thorlabs USB driver is now installed. Further, you will be asked to confirm the
installation of another two device software. Please proceed as described above.
© 2011 Thorlabs
Operating the Beam Profiler
Now, the Beam software including device drivers is installed to your computer.
Click "Next",
© 2011 Thorlabs
15
16
Thorlabs Beam 4.0
and "Close" to complete the software installation.
After finishing, the installer runs a check for installed NI-VISA Runtime. If you have a
Version 4.x up already installed to your computer, you can proceed immediately with
Connection to the PC 21 , else please proceed with second topic as per the
screenshots below.
Click to "NI-VISA Runtime 5.0.2."
The NI Installer comes up.
© 2011 Thorlabs
Operating the Beam Profiler
Click "Next"
It's recommended to install NI-VISA to the proposed folder, click "Next"
© 2011 Thorlabs
17
18
Thorlabs Beam 4.0
In this screen the required components are being selected. USB is required for the
Beam Profiler control, Serial (RS232) for control of the translation stage used for M²
measurements.
Please read the Software License Agreement carefully, choose "I accept" and click
"Next"
© 2011 Thorlabs
Operating the Beam Profiler
Please read the License Agreement carefully, choose "I accept" and click "Next"
Click "Next", the software installation starts and may take a few minutes.
© 2011 Thorlabs
19
20
Thorlabs Beam 4.0
Click 'Finish'. The installation has completed successfully.
© 2011 Thorlabs
Operating the Beam Profiler
3.3.2
21
Connection to the PC
Connect the Beam Profiler to a USB 2.0 high speed port of your computer. Use only
the cable that comes with the Beam Profiler or a cable qualified for high speed
USB2.0 standard.
Attention
Do not use low speed USB cables as this can cause transmission errors and
improper instrument operation!
After connecting the instrument to the PC the Windows 7® operating system will load
the appropriate USB drivers for the Beam Profiler instrument.
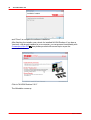
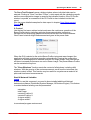
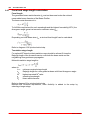
After connection, in the task bar will appear an icon, indication that the driver
installation is in progress. If click to this icon, the window below appears:
For verification purposes you might check the existence of this instrument in the
Device Manager of your computer.
From the Start button select Control Panel Device Manager
The following entry under the NI-VISA USB Devices group indicates that the
Thorlabs Beam Profiler device is properly installed.
If you cannot see such an entry please check the troubleshooting 117 chapter.
© 2011 Thorlabs
22
3.3.3
Thorlabs Beam 4.0
Start the Application
Access the Application Programs from the START button. Click the "Programs"
"Thorlabs" "Thorlabs Beam Application" entry.
Or simply click the appropriate
symbol added to your desktop.
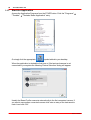
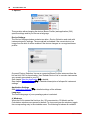
When the application is started the first time or if the last used camera is not
connected to your system the following 'Device Selection' dialog will appear:
Usually the Beam Profiler connects automatically to the first connected camera. If
you want to use another connected camera click onto an entry of the instrument to
mark it and click 'OK'.
© 2011 Thorlabs
Operating the Beam Profiler
With the next start of the Beam software and if the last used instrument is connected
with your system, the 'Device Selection' dialog is skipped and the Beam Profiler is
automatically used. When opening the 'Device Selection' dialog you will be
forwarded directly to the "BP10x Beam Profiler" settings tab.
Click on 'Refresh Device List' for an update in case you have very recently
connected to or removed a Beam Profiler instrument from your PC. If an expected
instrument is still missing check if the USB driver is properly installed (see chapter
Troubleshooting 117 ).
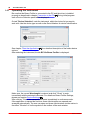
After selecting a Beam Profiler instrument the tab "Device Settings" is enabled so
that all available settings and adjustments to the Beam Profiler can be done. See
chapter Device Settings 46 for a detailed description.
It is advisable to read the steps described in chapter Measurement with the Beam
Profiler 84 carefully in order to setup your Beam Profiler device properly.
In case you do not have a Beam Profiler hardware available you may click on 'Load
Stored Image ...' to load a previously stored Beam Profiler image for interrogation.
Browse for an image in the "Image Selection" box.
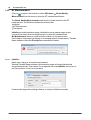
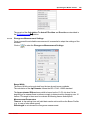
Click 'OK' to confirm your selection and the 'Device settings' panel will be closed.
When the Beam Profiler application is started the first time, three preselected
windows are opened and arranged automatically. Otherwise, the arrangement of the
last session (selected windows and its position) will be recovered. See chapter
Child Windows 29 for a detailed description of each window.
© 2011 Thorlabs
23
24
Thorlabs Beam 4.0
3.4
The Graphics User Interface (GUI)
3.4.1
GUI Overview
The main window consists of a menu bar, a tool bar, a status bar and common frame
for displaying several child windows.
A: Menu bar
All user activities can be done with items in the menu bar.
1. File
These menu entries deal with files or printing.
The first two entries Import and Export Configuration files (XML format) which
contain information about the chosen Beam Profiler device and its settings, file
export parameters and application settings. In order to copy the GUI appearance
and Beam Profiler settings to another PC you need to save the configuration file,
copy it and load it on the target system.
The second part allows you to import and export originally retrieved from the beam
profiler data in CSV format: Intensity values are saved to a text matrix.
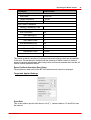
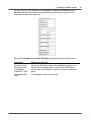
There are 4 columns:
Column
Content
1
X position in µm
2
Intensity at X position
3
Y position in µm
4
Intensity at Y position
The third block exports the currently displayed window content of the child windows.
With the Print Application Window a screenshot of the Beam Profiler application
is printed.
The Print Active Window entry prints the current active child window of the Beam
Profiler application. This function gives you the opportunity to print a specific child
window.
© 2011 Thorlabs
Operating the Beam Profiler
25
The Save Test Protocol opens a dialog window, where individual data can be
entered. Clicking to "Save" and then "Close", a test report with the calculation results
and the current projection image is saved to the indicated location. If the 3D Profile
window is opened, a screenshot of the 3D Profile is also included into the test
report.
See the some detailed examples for data export in chapter Save Measurement
Results 55 .
2. Control
Use the two first menu entries to start and pause the continuous operation of the
Beam Profiler device including retrieving measurement data, performing
calculations and displaying graphs and numerical results to the output windows.
'Next Frame' starts a single measurement and goes to the pause state.
When the GUI is started or the active Beam Profiler instrument was changed, the
application will start continuous operation automatically. Pausing the consecutive
operation is advantageous for detailed analysis of a single image. User interactions
will show increased performance on such a frozen image. The paused Beam Profiler
can be restarted at any time.
The "Clear Windows" function resets the content of all windows, including child
windows. With the receive of the next measurement result from the instrument, the
window content is filled. This function may be useful for a synchronous restart of all
plots and time-based measurements.
Start NI Network Variables
Note
In order to use this command, you need to have installed additional National
Instrument® software (Distributed System Manager, NI Runtime Engine). This feature
is a data interface handing over the parameters
saturation
total Power
centroid Position X
centroid Position Y
4-sigma width X
4-sigma width Y
to an external program environment.
© 2011 Thorlabs
26
Thorlabs Beam 4.0
3. Options
These entries allow changing the device (Beam Profiler) and application (GUI)
specific settings and let you choose a language.
Device Settings
The Device Settings window contains two tabs - Device Selection and a tab with
instrument specific settings. The second tab is disabled if the current device is a
image from the disk. It will be enabled if the device changes to a recognized beam
profiler.
On panel 'Device Selection' choose a connected Beam Profiler instrument from the
list and click 'OK' for its activation. Use 'Refresh Device List' to see also instruments
very recently connected to your PC.
See chapter Start the Application 22 for details.
See chapter Device Settings 46 for a detailed description of all specific instrument
settings.
Application Settings
See Application Settings
49
for detailed settings of the software.
Language
The current language of your operating system is selected.
4. Windows
When the GUI is started the first time, the 2D reconstruction, 3D Model and the
Calculations windows are opened by default. To close and open the windows, toggle
the corresponding entry in the windows menu. The following list shows all available
© 2011 Thorlabs
Operating the Beam Profiler
windows.
An open child window can also be closed by pressing the X in the upper right corner
of the child window.
5. Help
The first entry 'Contents' within the help menu or Key 'F1' will open the online help file
which contains the complete information of this manual.
With a click on the link Visit the Thorlabs Website the Thorlabs website is opened in
the standard browser.
ViewLicense Agreement will open the license file of the installer package.
About Thorlabs opens the about dialog panel which displays device information and
software versions details:
If you have trouble with the software, please submit the version of the application to
Thorlabs. This is helpful for resolving your problem.
© 2011 Thorlabs
27
28
Thorlabs Beam 4.0
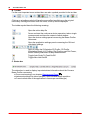
B. Toolbar
For the most important menu entries there are also symbols provided in the tool bar.
Clicking on a toolbar symbol will have the same effect as clicking on the original
menu entry. Moving the mouse over the icons, a tool tip will be displayed.
The toolbar symbol have the following meaning:
Open the online help file
Pause and start the continuous device operation, take a single
measurement and clear the content of each window
Open the device settings panel concerning the Beam Profiler
instrument
Open the application settings panel concerning the GUI and
calculation settings
Open or close the GUI window 2D Profile, 3D Profile,
Calculation Result, X-Y Profiles, Plot Position and Plot Power,
Beam Stability and Beam Quality Measurement.
Toggle Auto Scale To Peak On/Off
Toggle Max Hold On/Off
C. Status bar
The status bar is used to display important status information about the Camera
Beam Profiler concerning
Errors and warnings, see chapter Warnings and Errors 115
Instrument settings like taken samples, scan rate and target resolution
Current refresh rate of the application in frames per seconds (fps)
© 2011 Thorlabs
Operating the Beam Profiler
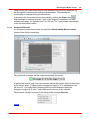
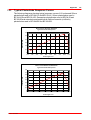
3.4.2
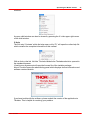
Child Windows
If the application starts the first time, three child windows are opened and arranged
automatically: "2D Reconstruction 30 ", "3D Profile 32 " and the "Calculation Results
34 ". The application provides further windows: "X Profile 33 ", "Y Profile 33 ", "Plot
Positions 37 ", "Plot Power 39 ", "Plot Gaussian Fit 40 ", "Beam Stability 41 " and "
Beam Quality (M²) 64 ". All these windows can be opened and closed with the
symbols in the toolbar or via the entries in the menu "Windows".
The appearance of the Thorlabs Beam software can be arranged according to
somebody's requirements and taste. All child windows can be sized and positioned
very flexible. Here is an example of arranging some child windows:
To close a child window deselect the menu entry or the appropriate toolbar symbol
or click the close button "X" in the upper right corner of the child window.
Each child window can be moved and resized. If a child window is closed its settings
are stored so that it will have the same position and size when it is reopened.
When the GUI application is closed and reopened also the main panel will have the
same child panels open at the former positions. To arrange the windows
automatically use the function "Tile View" from the menu.
© 2011 Thorlabs
29
30
3.4.2.1
Thorlabs Beam 4.0
2D Reconstruction
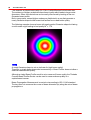
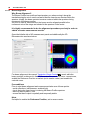
The 2D Reconstruction graph shows the image from the Beam Profiler indicating the
power intensity distribution.
This window can be opened and closed via the menu item "2D Reconstruction" in
the window menu or via the toggle button
in the toolbar. The window can also be
closed via the X button in the upper right corner of the child window.
As the window name indicates the 2d image is based on a reconstruction since a
slit beam profiler with two slits only provides two real cross section, i.e. x and y
profile. The remaining pixel values are calculated by multiplying the normalized cross
section values of the respective row and column. An additional bottom clipping is
done for restraining amplied noise.
Note
Remember, this is only a reconstruction of an assumed Gaussian-like profile, it does
not show a completely measured 2D cross section.
On the left side of the 2D Reconstruction window a toolbar is located with the
following toggle buttons:
Toolbar Symbol
data
Associated Action
Save diagram or Opens a dialog box to specify the properties of the saved
screenshots / diagrams.
Scale
Color
Peak
Centroid
Show or hides the x and y scale
Changes the color of the image from grayscale to rainbow
colors
Marks the Peak Position using a green cross
Marks the Beam Centroid using a blue cross within a blue
circle
© 2011 Thorlabs
Operating the Beam Profiler
Toolbar Symbol
Ellipse
Cross Hair
Reference
Position Editor
Profile Cross
Editor
Distance Editor
Associated Action
Displays the approximated Beam Ellipse in yellow color.
The ellipse is drawn corresponding to fitted or unfitted
numerical data. See Application Settings 49 to enable/
disable the ellipse fit.
The reference position has influence on the calculation
results. The peak and centroid position refer to the
reference position. The reference position can either be
the center of the sensor, the peak position, the centroid
position or a user defined position which can be set with
the reference position edit mode.
Draws X and Y Profiles into the 2D graph displaying the
power distribution within a horizontal and a vertical cross
section.
The positions of these X and Y cross sections are fixed to
the sensor center.
Set a user defined reference position with a click with the
left mouse button inside the projection image.
To select a user defined position simply click left onto the
image position. The selected pixel row will be the source
for the diagram in the X Profile windows and the selected
column for the diagram in the Y Profile window.
The distance measurement editor opens a table beside
the projection image. When drawing lines into the
projection image, the distance is inserted into the table. A
maximum of 10 distances can be drawn. Remove a
distance entry by selecting the entry and pressing the
"DEL" key or select the entry and choose the "Delete
Distance" entry from the context menu.
If the window height is smaller than the full toolbar, the lower symbols are packed into
a context menu which is accessible via a arrow button on the bottom of the toolbar.
© 2011 Thorlabs
31
32
3.4.2.2
Thorlabs Beam 4.0
3D Profile
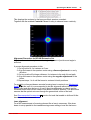
The 3D Profile illustrates the power density distribution of the measured optical
beam. Whereas the beam's cross-section is parallel with the x-y-plane the relative
power intensity is shown in the z direction (Pseudo 3D).
This window can be opened and closed via the menu item "3D Profile" in the
window menu or via the toggle button
in the toolbar. It can be closed via the X
button in the upper right corner of the child window.
The 3D profile can be moved, rotated and zoomed with the mouse interaction in the
window. Instructions how to manipulate the displayed graph within the window
Rotate:
Move:
Zoom:
Press right mouse button and move mouse
Press left mouse button and move mouse
Scroll mouse wheel
The following table summarizes the toolbar symbols available within the 3D Profile
window and its appropriate action.
Toolbar
Icon
Associated Action
Opens a dialog box to specify the properties of the saved screenshots /
diagrams.
Opens the 3D Profile Settings dialog box.
Toggles the appearance of the profile between solid to wired (default).
Resets the manipulations of translation, rotation and zoom to the default
view.
Position, size and rotation angle are also displayed within the 3D Profile Settings
dialog box. Here you can input numerical values to define the 3D Profile
appearance:
© 2011 Thorlabs
Operating the Beam Profiler
33
Note
If the slider "Speed - Quality" is in the very right position, the 3D image is
displayed with highest quality.
The higher the 3D image quality is set, the more system resources are used.
Depending on the system capabilities, the software may slow down.
3.4.2.3
X,Y Profiles
Each of the two windows can be opened and closed via the menu item "X Profiles"
or "Y Profiles" in the window menu or clicking on the appropriate toolbar symbols.
The windows can also be closed via the X button in the upper right corner of the child
window.
X and Y profiles display the intensity along the appropriate axes as marked on the
front panel of the beam profiler.
The yellow graph shows the measured profile, while the red curve shows the
approximated Gaussian fit function. If "Autoscale to Peak" is enabled , the measured
curve shows relative intensities from 0 to 100%, where 100% denotes the maximum
© 2011 Thorlabs
34
Thorlabs Beam 4.0
value of intensity on X and Y axis. The amplitude of the Gaussian fit curve may be
lower or even higher than the peak intensity of the measured curve.
The selected clip level (default 13.5%) is displayed, if the "Auto Scale to Peak"
function is enabled (button
).
The horizontal scale is displayed in pixels or µm, where the number of pixels results
from the settings of scan speed and target resolution, it is equal to the displayed vale
of "samples" - see Device Settings 46 ). The unit of the scale can be changed with
the Application Settings 49 dialog.
Toolbar
Icon
Associated Action
Opens a dialog box to specify the properties of the saved screenshots /
diagrams.
Opens a dialog box to save measurement data to XLS or CSV file.
Toggle button to display grid in the diagram. Default: grid is shown.
Zoom Home button
Toggle button to show or hide the cursor.
Toggle button to show or hide the Gaussian curve fit. Default: curve fit is
shown.
Zoom Mode
To zoom in the diagram, draw a rectangle with the left mouse button pressed.
Right click to the diagram undoes last zoom action.
"Home" button returns to display of the complete diagram.
Cursor Mode
Move the the mouse pointer close to the vertical cursor line, the mouse pointer
changes to . The cursor line can be moved with the left mouse button pressed to a
position inside the diagram. The current values at the cursor position are shown in a
rectangle next to the cursor in the colors of the plotted curve.
If the locate the mouse pointer over vertical or horizontal diagram axis and press left
mouse button, the mouse cursor changes to
or . Hold left mouse button
pressed and move the mouse, this will scroll through the diagram.
Return to default view using the Zoom Home button.
3.4.2.4
Calculation Results
In this window the result of the calculations are displayed. It can be opened and
closed via the menu item "Calculation Results" in the window menu or via the toggle
button in the toolbar
and closed via the X button in the upper right corner of the
child window.
Use the Application Settings
49
dialog to define the output parameters which will be
© 2011 Thorlabs
Operating the Beam Profiler
calculated and displayed here. There is also the possibility to change the units for
the calculations.
The width of the columns is predefined but can be resized.
All measurement parameters are described in chapter Measurement Results 54 .
© 2011 Thorlabs
35
36
Thorlabs Beam 4.0
3.4.2.4.1 Pass/Fail Test
The Calculation Results panel includes a pass/fail test.
For each parameter a minimum and maximum can be set.
Pass/Fail test result will be displayed only for those parameters, where the
appropriate box in Pass/Fail column is checked.
The test result status will be displayed beside the check box verbally and by red/
green color.
Note
Please note the following explanations to the parameter
Ellipse (fitted), Diameter (13.5%):
As per definition, the beam ellipse has a minor and a major axis, also known as
minimum and maximum ellipse diameter.
For pass/fail testing, for both diameters can be entered an upper and lower margin.
In the given above example, the "pass" ranges are:
- Min: minor axis (Min. diameter) must be between 5240 and 5440µm
- Max: major axis (Max. diameter) must be between 5455 and 5515µm
Only if both conditions are fulfilled, the test has been passed.
Toolbar
Symbol
Associated Action
Save diagram (screenshot) or measurement data (TXT, CSV and
XLS formats available)
Lock or unlock the test parameter
Load the test parameter configuration
Save the test parameter configuration
© 2011 Thorlabs
Operating the Beam Profiler
Save diagram or measurement data opens a dialog box to enter file properties
(name, format, comments)
Lock By default, pass/fail test parameters are unlocked. They can be locked in
order to prevent manipulation of margins and parameters included in pass/fail test.
Optionally, the lock can be secured by entering a password.
Note
A password can be entered only once and cannot be changed! In case of troubles,
please contact Thorlabs 142 for a solution.
Load / Save test parameter configuration
The Load and Save buttons in the Calculation Results toolbar allow to save and
load configuration of the pass/fail test.
In order to reconstruct a pass/fail test configuration automatically with the next
session, save the parameter to a test parameter configuration file. This file will be
loaded with the next start of the application. If there is saved more than one
configuration file, the most recently save file will be loaded automatically.
To load test parameter from a file push the "Load Test Parameter" button and select
the test parameter configuration file.
3.4.2.5
Plots
Thorlabs Beam software offers several additional plot windows to show the beam
behaviour:
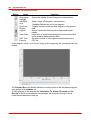
Plot Positions
Plot Power
Beam Stability
Plot Gaussian Fit
All plot windows are accessible via the "Windows" menu, the first 3 child windows
have also buttons in the toolbar.
The diagram can be cleared using the "Clear Windows" command (Menu Bar ->
Control or
button).
Comfortable view functions allow a detailed analysis of the parameter's behaviour
over time.
Display/hide a certain parameter: Above the diagrams appropriate buttons
are located.
Zoom: hold left mouse button pressed and mark the desired diagram area.
Undo zoom: right click to the diagram - the previous zoom status will be
reproduced
Scroll: Move the mouse pointer over time or parameter axis, the mouse
pointer changes to or , hold left mouse button pressed and scroll through
the diagram
Autoscale: This button in the left toolbar returns the diagram to default view
(auto scaled)
Cursor mode: If the mouse position is near to the vertical cursor line, the
© 2011 Thorlabs
37
38
Thorlabs Beam 4.0
mouse cursor changes to . The cursor line can be moved with the left mouse
button pressed to a position inside the diagram. The current values at the
cursor position are shown in a rectangle next to the cursor in the colors of the
plotted curve.
Below the individual plot windows are explained in detail.
3.4.2.5.1 Plot Positions
Toolbar:
Menu bar: Windows -> Plot Positions
The positions of X and Y peak and of X and Y centroid positions can be displayed
vs. time.
Toolbar
Icon
Associated Action
Opens a dialog box to specify the properties of the saved screenshots /
diagrams.
Toggle button to display grid in the diagram.
Auto scale
Show or hide the cursor
© 2011 Thorlabs
Operating the Beam Profiler
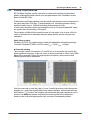
3.4.2.5.2 Plot Power
Toolbar:
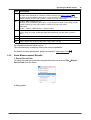
Menu bar: Windows -> Plot Power
The total power measured by the beam profiler vs. time can be displayed.
Note
Thorlabs Beam Profiler instruments are not calibrated for power wavelength
dependent. The power calculation is based on a typical responsivity curve of the
used sensor and manually entered wavelength (see Device settings 46 )
Toolbar
Icon
Associated Action
Opens a dialog box to specify the properties of the saved screenshots /
diagrams.
Toggle button to display grid in the diagram.
Auto scale
Show or hide the cursor
© 2011 Thorlabs
39
40
Thorlabs Beam 4.0
3.4.2.5.3 Plot Gaussian Fit
Menu bar: Windows -> Plot Gaussian Fit
This window plots the Gaussian Intensity value (see Calculation Results
shows the coefficient of determination of the fit.
Toolbar
Icon
34
) which
Associated Action
Opens a dialog box to specify the properties of the saved screenshots /
diagrams.
Toggle button to display grid in the diagram.
Auto scale
Show or hide the cursor
© 2011 Thorlabs
Operating the Beam Profiler
3.4.2.5.4 Beam Stability
Toolbar:
Menu bar: Beam Stability
Count: The actual count of displayed measurement results.
Max Count: Max count limits the number of displayed measurement points. If the
actual count reached the entered max count value (here: 100), in the diagram will be
displayed the recent 100 measurement results, previous results will be deleted.
Max. Distance to Reference: is given in distance (X), distance (Y) and as radial
distance (R)
Reference Position The reference point can be set either to the center of the data
cloud or the first measured centroid data is the reference.
Toolbar
Icon
Associated Action
Opens a dialog box to specify the properties of the saved screenshots /
diagrams.
Toggle button to display grid in the diagram.
Scale to all points are located in the diagram area
Zoom out to see the sensor dimension
Display results as dots or wired
Reset Data Counter
Show / hide legend
© 2011 Thorlabs
41
42
3.4.3
Thorlabs Beam 4.0
Save Settings
The actual settings of the GUI including configurations of the graphical displays and
the instrument setup are automatically saved when you exit the program. When
starting the Beam software again, the most recent settings are automatically loaded.
Exception: Gain, bandwidth and DC offset are set to "Auto".
Note
The stop state of the previous measurement will be ignored at a new start of the
Beam software because it always starts in continuous mode.
© 2011 Thorlabs
Operating the Beam Profiler
3.5
Measurement with the Beam Profiler
General guidelines for operating the Slit Scanning Beam Profiler BP10x
You should follow these basic guidelines to achieve correct and reliable
measurement results.
1. Provide stable Mounting 9 to the Beam Profiler using the appropriated
threads on its base plate.
2. Ensure to operate the instrument within the allowed Power Range 60 of the
instrument.
3. Align the beam to be measured perpendicular to the front face of the Beam
Profiler.
4. Minimize ambient light entering the Beam Profiler aperture.
Attention
Do not stick anything into the Beam Profiler aperture, you may damage the
thin slit foils, spoil the bearings of the motor and/or blockade the rotating
drum because there is no covering glass in front of it.
Higher beam power than the allowed power limit may damage the
instrument.
Prevent dust or other contaminations from entering the aperture!
Performance Optimization
As soon as a Beam Profiler is selected within the 'Device Selection' panel the
measurement starts in the continuous mode. It may be advantageous to stop the
continuous measurement for a detailed analysis of a beam profile captured with the
last camera image. Also, user interactions with the GUI will work more fluently when
the continuous flow of image data is stopped.
Measurement speed of the Beam Profiler is depending on various device settings
like scan rate (rotation speed of the scanning drum), target resolution, gain and
bandwidth of the amplifier. Also the number of open child windows used to visualize
the measured results and the number of activated numerical parameters to be
calculated may reduce the available measurement speed, depending on the
performance of your PC.
The update rate of all values is synchronised to the measurement speed of the
Beam Profiler. The display update rate is scan rate / average if standard average is
selected and scan rate if rolling average is selected.
Note
1. For accurate measurement results (correct power values) you must enter the
correct wavelength. Thorlabs Beam Profiler instruments are not calibrated for
power with respect to the wavelength. The power calculation is based on a
typical responsivity curve of the used sensor and manually entered wavelength
(see Device settings 46 )
2. Ensure to be within the allowed power range 60 .
3. Align the laser beam perpendicular to the front panel.
© 2011 Thorlabs
43
44
3.5.1
Thorlabs Beam 4.0
Operating the Instrument
Be sure that the Beam Profiler is connected to the PC and the driver is installed
properly as described in chapter Connection to the PC 21 . During initial program
start a Device Selection panel will be displayed.
On tab "Device Selection" mark the instrument within the device list you want to
work with. Use the device type as well as the Serial Number for device identification.
See chapter "Start the Application 22 " for a detailed description of the further device
options.
After selecting the instrument, the tab BP10x Beam Profiler is displayed.
Make sure, the correct Wavelength is entered, and click "Close" to work
immediately with the selected instrument. For details on Beam Profiler Settings,
please see section Device Settings 46 .
After clicking "Close" the measurement starts immediately in continuous mode.
If the application is started the first time, three child windows are opened and
arranged automatically. The user can open and close child windows via the entries in
the menu "Window" or via the symbols in the toolbar of the main window.
© 2011 Thorlabs
Operating the Beam Profiler
Window 2D Reconstruction 30 shows the measured intensity distribution across the
sensor area in gray or color scale whereas the 3D Profile 32 is obtained by
converting beam intensity into the 3rd dimension (Z scale). Numerical calculation
results are displayed in the appropriate Calculation Results 34 window. The number
of calculated parameters can be controlled in the Application Settings 49 panel.
All contents of the child windows including available options are explained in
chapter Child Windows 29 .
© 2011 Thorlabs
45
46
3.5.2
Thorlabs Beam 4.0
Device Settings
Prior to take proper measurements with the BP10x Beam Profiler some instrument
settings should be checked to fit your measurement application.
Open 'Options' 'Device Settings ...' from the Menu or click on
within the
toolbar to open the Device Settings Panel. Select the right tab 'BP10x Beam
Profiler'.
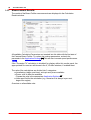
If this camera is connected the first time, the following instrument parameters are set
as default:
© 2011 Thorlabs
Operating the Beam Profiler
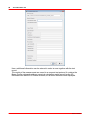
Parameter
47
Default value
Target Settings
Scan Rate
10.000 Hz
Target Resolution
1.20 µm
Wavelength
635nm
User Power Calibration
Factory Calibration in use
Gain And Bandwidth Control
Auto Gain Index
ON
Gain Index Slit X
12
Gain Index Slit Y
12
Gain Index Power
12
Auto Bandwidth [kHz]
ON
Bandwidth Slit X
150kHz
Bandwidth Slit Y
150kHz
Bandwidth Power
150kHz
Auto DC Offset
ON
This panel contains a number of important instrument settings which are accessible
to the user. Please become familiar with the meaning of these controls in order to
prevent improper adjustments which may lead to erroneous measurement results. All
visible controls explained below:
Beam Profiler Information (Read Only)
These data are read out from the BP10x instrument and cannot be changed.
Target and Applied Settings
Scan Rate
This is the rotation speed of the drum in Hz (s-1). Values between 1.5 and 20 Hz can
be entered.
© 2011 Thorlabs
48
Thorlabs Beam 4.0
Target Resolution
The achievable resolution depends on the slit width (2.5µm for BP104 models,
5.0µm for BP109) and on the actual scan rate. A target value can be entered;
depending on the recognized instrument and it's settings the software calculates the
achievable resolution, which is displayed below in the box Applied Settings.
Wavelength
Enter your operating wavelength in nm as a precondition for proper measurement of
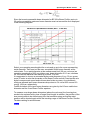
the Total Power. It enables consideration of the known response curve (see Typical
Photodiode Response Curve 131 stored within the Beam Profiler instrument. No other
result than Total Power is influenced by this setting.
The range of allowed wavelength values is limited to specified range of the
recognized beam profiler. Move the mouse pointer over the numeric box - a tooltip
appears showing the valid range.
Sample Rate
is calculated based on the scan rate and the resolution.
Samples
is the number of displayed data points, calculated based on scan rate, resolution
and slit width. The latter depends on the beam profiler type (BP104* -2.5µm;
BP109* - 5.0µm)
Gain and Bandwidth control
Each time the software is started, gain, bandwidth and DC offset are set to Auto.
This is the preferred setting for proper measurements. However, in some cases, e.g.
measurement of pulsed lasers 61 , it is recommended to change these settings
manually.
© 2011 Thorlabs
Operating the Beam Profiler
3.5.3
Application Settings
Separated from the Device Settings 46 these Application Settings are concerned to
calculation and graphical presentation options.
Open 'Options' 'Application Settings ...' from the Menu or click on
in the
toolbar to open the Applications Settings Panel. Select the left tab 'Calculations'.
Calculations Settings
Select tab 'Calculations' to display options influencing the numerical calculations.
Units
On the right the units for all calculation results expressing a location, distance or
width can be chosen to either pixel or µm. The unit of Total Power result can be
displayed either in mW or dBm.
Note that the power result depends also on the wavelength setting and the user
power calibration, see chapter User Power Calibration 53 for details.
Calculation Conditions
The X-Y Clip Level defines a relative intensity level between dark level (0%) and
peak level (100%) of the measured beam profile used to measure the beam width,
© 2011 Thorlabs
49
50
Thorlabs Beam 4.0
the default value 1/e² =13.5% of the peak intensity is recommended by ISO11146.
You may define other clip levels by entering the appropriate value in %.
Input values are valid from 5% to 95%. Click on Default (1/e²) to set the default Clip
Level of 13.5%. See Appendix Application Note 118 for details.
Set Averaging over frames to numbers higher than 1 to enable noise reduction.
The chosen number of frames are averaged and only the averaged frame is
displayed and calculations are applied to it.
This option is helpful under instable light sources with fluctuating intensity or beam
shape and if the update rate on the screen is too high for easy data readout. Also
use this option to suppress Beam Profiler noise in case of low intensity.
Average numbers between 1 and 25 frames are valid.
The Max Hold feature is recommended for pulsed laser sources. In all subsequent
scans for each pixel only the maximum values are stored, displayed and used for
calculation.
The Correct Beam Width option should be activated by default. It corrects for the
measurement error due to the finite slit width for all methods (13.5% clip level with
and without Gaussian fit). Since this convolution error is systematic it can be
calculated and eliminated. Especially for narrow beams the beam width result will
become smaller and closer to the real value.
Enable the Approximate Ellipse checkbox in order to get the best fitted beam
ellipse.
This setting provides more stable and reliable ellipse results. Otherwise, ellipse data
are retrieved from single minimum and maximum diameters of the elliptical beam
cross section. These results are more noisy and therefore less reliable than the fitted
results.
Enable the 'Autoscale To Peak' checkbox to scale the x-y-profiles to the peak of
the selected row / column.
Unchecking the checkbox will scale the x-y-profiles to the maximal possible intensity
of a pixel.
Display Settings
Select tab Display, check or uncheck beam parameters that shall be displayed
within the 'Calculation Results' window, see Measurement Results 54
In the lower part a number of different styles for 3D Display is listed for selection.
© 2011 Thorlabs
Operating the Beam Profiler
There are 3 different color scale types available:
- Logarithmic is recommended to view lower intensity values with a good resolution
- Linear
- Quad offers a better resolution for higher intensity values.
User-made Color Scales
If a certain color scale is required it is possible to create an own color scale which
can be loaded automatically by starting the application. To do so a few things have
to considered.
The application loads valid *.lut files from the folder
...\My Documents\Thorlabs\Thorlabs Beam\LUT
A valid *.lut file is an ordinary text file with nine columns and 256 rows. Values have
to be tab-separated. The first three columns have 256 entries, the last six columns
only 128. Each value represents a 8 bit intensity (0- 255) of R(ed), G(reen) and B
(lue), respectively.
The first three column represent the linear scale of a user-made color scale, the next
three columns the logarithmic scale and the last three columns the quadric scale.
Such a color scale could look like this (ignore the first two rows):
R
0
1
2
...
© 2011 Thorlabs
linear scale
G
255
255
255
...
B
0
0
0
...
logarithmic scale
R
G
B
0
255
0
1
255
0
2
255
0
...
...
...
quadric scale
R
G
B
0
255
0
3
255
0
10
255
0
...
...
...
51
52
Thorlabs Beam 4.0
127
128
129
...
255
255
255
255
...
255
0
0
0
...
0
255
255
0
255
255
0
... stands for the intermediary values.
© 2011 Thorlabs
Operating the Beam Profiler
3.5.4
User Power Calibration
The User Power Correction is used to align the total beam power measured by the
Beam Profiler to a known power level measured by a reference power meter.
Open 'Options' 'Device Settings ...' from the Menu or click on
within the
toolbar to open the Device Settings Panel. Select the right tab 'BP10x Beam
Profiler'.
Enter the operating wavelength of your laser source.
Enter the correct value into the 'Power meter value' control.
Click 'Apply' and both values will coincide. To manage this, an internal power
correction offset is calculated and recognized within each Total Power calculation.
This offset (in dBm) is stored within the Beam Profiler and will be read out and
activated automatically each time after connecting the instrument.
Click 'Close' to leave the "Device Settings" panel.
Note
The user calibrated power reading will loose accuracy when going to another
wavelength.
© 2011 Thorlabs
53
54
3.5.5
Thorlabs Beam 4.0
Measurement Results
The results of the Beam Profiler measurements are displayed in the Calculation
Results window.
All available Calculation Parameters are inserted into this table with the first start of
the Camera Beam Profiler. To reduce the number parameters, uncheck the
parameter in the Application Settings 49 . This will also increase speed performance.
Note
If the "Gaussian Fit" calculation is disabled for display within this results panel, the
appropriated fit curves are still shown in the X,Y Profile windows, if enabled there.
The units of the calculations are divided into 3 categories:
Localization (widths, positions): units pix and µm are available
Power: mW or dBm are available
Change the units in the appropriate Application Settings 49 .
Units specified for the calculation (e.g. Gaussian fit is always in per cent,
degree for angles)
Overview on all available units:
© 2011 Thorlabs
Operating the Beam Profiler
Unit Description
pix
Location, width or distance in pixels. The max. number of pixels depends on scan rate and
slit width and is displayed as "samples" in Device settings (see Device Settings 48 )
The origin of the coordinate system (X=0, Y=0) is the sensor center not the image center!
Positive X values go to the right, positive Y values to the top of the image.
µm
Location, width or distance in µm
The origin of the coordinate system (X=0, Y=0) is the sensor center not the image center!.
Positive X values go to the right, positive Y values to the top of the image.
Value range:
BP104* = -2000 to +2000; BP109* = -4500 to +4500
mW
The Total Power of the beam is calculated from measurement of the total photo diode
current, using it's typical wavelength dependent responsivity and the power correction
value.
dBm
The Total Power translated from mW into dBm: 10 * log(P[mW]). 0 dBm = 1 mW
%
Relative level between 0 and 100%
deg
Angle in degree with respect to the X axis, range -90 to +90 deg
If a calculation failed the value turns to "--".
The columns can be resized by moving the column separators.
For details on these parameters, please see section "Application Note 118 "
3.5.6
Save Measurement Results
1. Export Device Data
To export the data into a delimiter separated text document select 'File
Device Data' from the Menu.
A dialog opens:
© 2011 Thorlabs
Export
55
56
Thorlabs Beam 4.0
Only CSV (comma separated values) file format is available. Select the desired path
and a file name.
The comment "Not for import" is related only to Beam Software: A data file cannot
be imported in order to reconstruct a beam profile.
The data file contents of the header with common data and a table stating X and Y
positions with the appropriate relative intensity values.
© 2011 Thorlabs
Operating the Beam Profiler
57
Sequential Saving
By checking the Sequential Saving box, a series of measurement data in *.csv file
format can be saved.
The saving can be proceeded with a defined time interval (0 to 100.00 sec) or for
each nth measurement - here the value range is from 1 (saving every single
measurement) to 100.000 (99.999 measurements are being skipped).
The saving can be stopped by fulfilling one of three possible criteria: reaching a max.
memory space (0 to 100.000 MB), a max. saving time (0 to 100.000 sec, if 0 only 1
measurement is being saved) or a max. number of savings (up to 100.000 files).
The file name must be set in the appropriate box; a date and/or time stamp can be
added. In order to avoid doublets, a counter "_#xxx" is appended. This counter is
reset at each software restart.
2. Print screenshots
Select 'File Print Application Window' or 'File
screenshots of the appropriate window.
Print Active Window' to print
If a PDF creating software is installed as a printer, the screenshot can be printed
also as a PDF file.
3. Export a PDF Test Protocol
To save a test protocol in pdf format select 'File
A dialog box opens:
© 2011 Thorlabs
Save Test Protocol'.
58
Thorlabs Beam 4.0
Here, additional information can be entered in order to save together with the test
report.
The results of the measurement are saved to a compact test protocol. It contains the
Beam Profiler data and settings, numerical calculation results as well as the 2D
Reconstruction and the 3D Profile windows, so far these windows were displayed.
© 2011 Thorlabs
Operating the Beam Profiler
Example:
© 2011 Thorlabs
59
60
3.5.7
Thorlabs Beam 4.0
Power Ranges
Every Beam Profiler model has a different usable input power range (depending on
aperture and wavelength range).
For a each Beam Profiler type the usable input power range depends on the actual
beam with. As smaller the beam width as lower the maximum input power because
of the maximum absorbable power density of the photodiode - see diagram below.
Note
Please note that this diagram shows limits for detecting the beam profile using the
slits. The available power range for the power detector (total power) may be smaller.
In the case of overdriven power measurement range an error message will be
displayed in the status box but beam shape measurement are still feasible until the
upper limits for the X and Y slit measurement windows are reached.
© 2011 Thorlabs
Operating the Beam Profiler
3.5.8
Pulsed Laser Sources
BP10x Beam Profilers can be used also to measure the profile of pulsed laser
beams, although the better choice for such applications is the Thorlabs Camera
Beam Profiler BC106x.
Pulsed lasers with high repetition rate and short pulse duration can be measured in
the same way like a CW laser. Typical example is a femtosecond laser, having
repetition rates of up to 100MHz and pulse durations below 100fs.
In such case, the photo diode current amplifier due to it's limited bandwidth "sees"
not a pulse train, but virtually a CW signal.
The situation is different if the repetition rate is in the order of up to tens of kHz. In
order to illustrate how to optimally setup the beam profiler, below are given two
examples.
Used laser system
Thorlabs LPS-635-FC pigtailed laser diode with adjustable collimation package
Controller ThorIabs ITC4001 in QCW mode (frep = 1kHz, tpulse = 100µs)
Scan rate setting
The scan rate can be set between 1.5 and 20 Hz, so it cannot be set equal to the
pulse repetition frequency. In the a.m. case, if set the scan rate to 10Hz, each 100th
pulse will be scanned. Due to the high repetition frequency, also previous and
following pulses will be displayed:
If set the scan rate in such way, that in X and Y profile the pulses move through the
diagram (i.e., scan rate slightly differs from integer multiple), and activate the max
hold function
function, the software will accumulate the peak intensities over a
number of subsequent pulses, and finally, the beam profile will be displayed however, this is the averaged profile over a number of subsequent pulses.
© 2011 Thorlabs
61
62
Thorlabs Beam 4.0
Note
The user should decide, when the envelope shape smoothing can be considered to
be finished.
Bandwidth setting
It is recommended to set bandwidth manually. The guideline is the same as for CW
signals - the smaller the beam diameter, the higher the bandwidth is required: Small
beam diameters cause short photo diode current pulses when the slit is scanning it.
If the BW is set too low, the rising edge of the photo diode current is delayed, the
falling edge causes overshoots and the peak amplitude is lowered.
The X profile of a 130µm beam illustrates this:
Bandwidth - 150 kHz
Bandwidth - 10 kHz
At larger beam diameters, higher bandwidth results in a higher noise level - as can
be seen for a beam with of abt. 3mm:
© 2011 Thorlabs
Operating the Beam Profiler
Bandwidth - 10 kHz
Bandwidth - 150 kHz
Gain Index
For pulsed lasers, the gain index is recommended to be set manually in order to
avoid saturation of the amplifier.
© 2011 Thorlabs
63
64
Thorlabs Beam 4.0
3.6
Beam Quality (M²) Measurement
3.6.1
General
In laser science, the parameter M² is the ratio of the beam parameter product (BPP)
of an actual beam to that of an ideal Gaussian beam at the same wavelength. It is
often referred to as the beam quality factor, since its value can be used to quantify
the degree of variation the actual beam is from such an ideal beam. M² is a better
guide to beam quality than Gaussian appearance, however, since there are many
cases in which the beam can look Gaussian, yet have an M² value far from unity. As
well, a beam can appear very "un-Gaussian", yet have an M² value close to unity. For
a single mode TEM00 Gaussian Laser beam, M² is exactly one.
The value of M² can be determined by measuring 4σ diameter or "second moment"
width. Unlike the beam parameter product, M² is unitless and has no variance with
wavelength.
In laser science, the beam parameter product (BPP) is the product of a laser beam's
divergence angle (half-angle) and the radius of the beam at its narrowest point (the
beam waist).
The M² value is an important measure of beam quality. It is widely used in the laser
industry as a specification, and its method of measurement is defined in ISO 11146
standard. It is especially useful for determining the degree of beam divergence of
real laser beams and the minimum focussed spot size.
The Beam Profiler Series BP104 and BP109 are slit scanning beam profiler
instruments to measure the beam quality factor M².
For the measurement, the beam profiler is mounted to a software controlled
translation stage, moved step by step along the propagation axis of a focussed
beam and the beam diameter is measured at each position in order to find the
beam waist.
There are two associated product groups
M2SET is a complete ready to use M2-Meter instrument that already contains
the necessary equipment for beam alignment and focusing as well as the
Beam Profiler which is already mounted on the translation stage. All
components are mounted on a 600 x 150 mm (or 24 x 6 inch) breadboard
in a pre-aligned state. The M2-Meter is available in both metric and imperial
versions.
BP1M2 is just an Extension Set for an already existing Thorlabs Beam Profiler and
contains a translation stage of selectable length and a mounting adapter for
the Beam Profiler. Means for beam alignment and focusing are not supplied
with the Extension Set.
M2-Meter M2SET and BP1M2 Extension Set feature
- Accurate M² Measurements
- Measures Divergence, Waist Diameter, Rayleigh Range and Astigmatism
- Flexible Design
- Compatible with CW and Quasi-CW Pulsed Laser Sources
- Short Measurement Times
© 2011 Thorlabs
Operating the Beam Profiler
65
- Includes Laser Focusability Test
- ISO11146 Compliant
Motivation
Many laser applications require maximum optical power density at minimum beam
diameter. Not only the focusing optics but mainly the quality of the light source itself
has influence to the focusability. A high beam quality is a pre-condition for optimal
focusability.
What is Beam Quality
Beam Quality and its direct influence to focusability is a very important feature of
lasers.
Beam Propagation Measurements according to ISO 11146 standard disclose
beam quality and describes it as a single value either the Times-Diffraction-Limit
Factor M2 (also known as beam quality factor or beam propagation factor) or its
reciprocal Beam quality K = 1/M2 whereas the beam quality K is direct proportional
to the quality level (K=1 optimal, decreasing for worse quality), its reciprocal value M
2
(M2=1 optimal, increasing for worse quality) is used more often.
Please do not confuse beam quality (K≤1) and times-diffraction-limit factor (M2≥1).
Diffraction Limit
Depending on wavelength and beam divergence angle there is a limit for
minimum beam waist diameter d0 called diffraction limit which cannot be
decreased further more by theory.
M2 is an expression of how close the beam parameter product d0* is to the
diffraction limit of a perfect Gaussian beam. For beams of worse quality the product
d0* is increased by the factor M2
where d0 is beam waist at the focus point of the focussing lens.
M2 is also known as
the ratio of the waist diameter d0 of the measured beam to that of an ideal
Gaussian beam (TEM00) at same divergence angle .
the ratio of the divergence angle of the measured beam to that of an ideal
Gaussian beam (TEM00) at same waist diameter d0,
Worse beam quality is a result of laser imperfections like inhomogeneities which
lead to appearance of higher transversal modes.
How to measure Beam Quality
If only the fundamental mode TEM00 (which has an ideal Gaussian shape) is existing
© 2011 Thorlabs
66
Thorlabs Beam 4.0
- this ensures an ideal beam quality (K=1, M2=1) with diffraction limited waist size.
The existence of higher modes decrease beam quality which leads to larger waist
diameters. Often, such distortions can be easily discovered by looking at the non
Gaussian beam profile.
But in many cases, several higher modes are distributed in a way that generate a
nearly Gaussian shape but the beam itself suffers from a bad beam quality.
The following example shows a beam with nearly perfect Gaussian shape but having
a multi-mode origin leading to bad quality M2 = 1.79.
Note
A nearly Gaussian shape is not an indicator for high beam quality!
Therefore, a single beam shape shot measured by a Beam Profiler does not allow a
statement about beam quality.
Although a single Beam Profiler result is not a measure if beam quality, the Thorlabs
Camera Beam Profiler Series can be used to measure beam quality in a
sophisticated manner.
Beam Propagation Measurement is carried out according to ISO 11146 standard.
The key idea is to measure the course of beam diameter d(z) along the axis of beam
propagation z.
© 2011 Thorlabs
Operating the Beam Profiler
67
Measured beam
diameter samples
d(z)
z
Beam
waist
Focusing lens
The Beam Profiler is mounted on a translation stage which is controlled by the Beam
Profiler software too.
At several z positions the beam diameter and other parameters are measured and
stored.
Besides determination of the times-diffraction-limit factor M2 the Thorlabs Beam
Propagation measurement determines the following parameters of an optical beam:
beam waist width d0x, d0y
beam waist z-position z0x, z0y
Rayleigh range zRx, zRy
divergence angle x, y
beam pointing direction
waist asymmetry
divergence asymmetry
astigmatism
Note
The Thorlabs Beam Quality measurement tool handles cw sources and some pulsed
sources only! For more information about pulsed laser sources read chapter Pulsed
Laser Sources 61 .
© 2011 Thorlabs
68
3.6.2
Thorlabs Beam 4.0
Selecting Focal and Stage Length
Since the BP1M2 Extension Set does not include focusing elements, it has to be
selected and ordered separately.
The following guideline should help selecting the optimal focal length of the lens as
well as the optimal length of the translation stage.
Selecting the focal length
The following diagram A helps selecting the optimal focal length f depending on the
operating wavelength and the unfocussed beam diameter. See Focal and stage
length calculation124 for details.
Diagram A
Select your operating wavelength at the x-axis of diagram A and go up to the curve
representing your initial (unfocussed) beam diameter. Then read out the minimal
required focal length at the vertical axis. Round it up to the next available focal length
(e.g. 50, 100, 150, 200, 300 mm). Longer focal lengths generate waist diameters
above 30 µm and relax the measurement requirements to the Beam Profiler.
Refer to the 'Accessories' tab for recommended focusing lenses. Be sure to order
the appropriate AR-coating for your wavelength range of interest.
Selecting the translation stage length
It is advisable but not necessary to choose the translation stage length as long as the
focal length of the focusing lens. For correct M² detection the translation range has to
© 2011 Thorlabs
Operating the Beam Profiler
69
be at least 5 times the Rayleigh length of the focused beam to cover both the beam
waist and the neighboring divergent beam propagation. The Rayleigh length
depends strongly on the generated waist diameter and also linearly increases with
M². Therefore, the translation range needs to be longer for bad beam quality (K<<1,
M²>>1).
See Focal and stage length calculation124 for details.
Diagram B shows the minimal required stage length for M²=1 depending on the
expected waist diameter:
Diagram B
Select your operating wavelength at the x-axis of the diagram B and go up to the
curve representing your expected waist diameter. Then read out the minimal
required translation range at the vertical axis. Multiply this result with the highest
expected M² value of your laser source and round it up to the next available
translation stage length (50, 150 or 300 mm). Please note this length is a minimum
requirement for M² detection.
When a lens with the optimal focal length was selected according to diagram A, the
resulting waist diameter of 30 µm keeps the required translation range below 50 mm
even for M² values up to 5. As a disadvantage, for each application the short stage
carrying the Beam Profiler needs to be well positioned according to the beam waist
position.
Therefore, longer stage lengths of 150 mm or even 300 mm are advisable for
universal setups which are ready to use for various laser types, beam diameters,
wavelengths, M² values and focal lengths. Also, the entire diverging process on both
© 2011 Thorlabs
70
Thorlabs Beam 4.0
sides of the beam waist can be analyzed without the need to relocate a shorter
stage to the new focus position.
For these reasons, Thorlabs recommends a translation stage length at least as long
as the highest focal length that will be used in the setup.
© 2011 Thorlabs
Operating the Beam Profiler
3.6.3
Extension Hardware
3.6.3.1
BP1M2 Extension Set for M² Measurements
The BP1M2 M² Analysis Extension Set is comprised of a motorized Translation
Stage of selectable length, plus mounting accessories to be used with the BP100
Beam Profiler. The Beam Profiler itself and required means for beam alignment and
focusing are not supplied with the Extension Set and need to be ordered separately.
Three different models with different translation stage lengths are available:
Extension Set Model
Travel range
BP1M2-50 BP1M2-150
50 mm
150 mm
BP1M2-300
300 mm
Required Travel Length of the M² Extension Set
Please see the Selecting Focal and Stage Length 68 chapter for information on
selecting the model with a suited travel length for your particular application.
The following picture shows the largest 300 mm translation stage and controller, two
mounting base plates (left) and a mounting plate for the Beam Profiler (2 parts,
right). The supplied screw set, power supply and cables are not shown. See
Translation Stage drawing 138 for a detailed drawing.
The stage movement is fully controlled by the software module (included in BP100
software package V2.0 or newer) of the BP100 which allows it to take
measurements at different stage positions and perform a complete M² analysis. This
is done taking multiple measurements of the beam diameter of the collimated beam
at different positions along the beam propagation axis. A hyperbolic curve fit to the
© 2011 Thorlabs
71
72
Thorlabs Beam 4.0
measured data yields reliable and repeatable values for beam waist diameter and
position, Rayleigh range, divergence angle, beam pointing direction, waist
asymmetry, divergence asymmetry and astigmatism.
Extension Set consists of:
- Translation Stage of selectable length incl. controller
- Power Supply
- RS232 Cable
- USB to RS232 converter
- 2 Mounting Base Plates
- Adapter Plate to Beam Profiler
- Latest Beam Profiler Software CD
- Manual
NOTE
BP100 Series Beam Profiler as well as beam focusing and alignment means are
not included in the BP1M2 Extension Set and are sold separately. See Mechanical
Setup 79 for optional equipment.
3.6.3.2
Recommended Accessories
Depending on existing lab equipment additional parts may be required to
manipulate the laser beam for the M² measurements. To focus parallel laser beams
you will need an appropriate focusing lens and holder. Additional beam alignment
and redirection tools may be required to align your laser beam to the M² setup. The
following table suggests some accessories for this.
Lenses
LB1471BK7 B Coated Bi-Convex Lens, DIA = 25.40, f = 50.00
LB1676BK7 B Coated Bi-Convex Lens, DIA = 25.40, f = 100.00
LB1945BK7 B Coated Bi-Convex Lens, DIA = 25.40, f = 200.00
AR coatings of lenses have to be selected according the wavelength range of the
laser.
Suffix - needs to be replaced with -UV, -A, -B or -C.
Mechanical Accessories
(Metric parts versions - for imperial type delete "/M" appendix of the parts' name)
SM1L03
LMR1/M
SM1 Lens Mounting Tube, 0.30" (7.6mm) Bore Depth
Metric, Lens Mount for Ø 1" Optics
© 2011 Thorlabs
Operating the Beam Profiler
LM1XY/M
FM90/M
K6X
TR30/M
PH1.5/M
Translating Lens Mount
Flip Mount for easily inserting/removing a lens mount
6 Axis Kinematic Optic Mount (for lens alignment)
Post 30mm
Post Holder with Spring-Loaded Thumbscrew, L=40mm
For adapting the beam height and trajectory kinematic mirrors or a periscope
assembly is useful:
KM100
Kinematic Mirror Mount for 1 inch Optics
KM100-E02
Kinematic Mirror Mount with Visible Laser Quality Mirror
KM100-E03
Kinematic Mirror Mount with Near IR Laser Quality Mirror
RS99/M
Complete Periscope Assembly, Metric
PF10-03-P01
Protected Silver Mirror, Dia= 25.4 mm, Thickness = 6mm, for
periscope assembly
Attenuators might be required in case of high power optical beams.
ND20B
Unmounted Metallic ND Filter Ø 1", D=2.0
ND40B
Unmounted Metallic ND Filter Ø 1", D=4.0
LMR1/M
Metric, Mount for Ø 1" ND Filter
Other accessories:
MB1530/M Breadboard 150 x 300mm
MB1560/M Breadboard 150 x 600mm
TR30/M
Post 30mm
PH1.5/M
Post Holder
© 2011 Thorlabs
73
74
3.6.3.3
Thorlabs Beam 4.0
M2SET - M2-Meter
The M2SET M2-Meter is comprised of a Beam Profiler mounted on a 150 mm long
motorized translation stage as well as beam alignment and focusing tools mounted
and pre-aligned on a breadboard. This complete M2-Meter already brings along preselected and well suited optical and mechanical components. Thanks to its high
degree of pre-alignment it saves time for setup and beam alignment considerably.
All components of the M2-Meter are available either in imperial or metric versions for
compatibility to already existing lab components.
In total there are 4 different M2-Meter models available:
Imperial components
Metric components
BP109-VIS
M2SET-VIS
M2SET-VIS/M
BP109-IR
M2SET-IR
M2SET-IR/M
The following picture shows the ready to use M2-Meter M2SET-VIS/M.
See Appendix M2SET M2-Meter 139 for dimensions and a drawing of the M2-Meter.
The M2-Meter contains
- Beam Profiler BP109-x incl. Mounting Adapter to Translation Stage
- Translation Stage 150 mm incl. Controller, Power Supply and
RS232 Cable, Mounting Base Plates
- USB to RS232 converter
- Breadboard 600 x 150 mm (or 24 x 6 inch)
- Iris Diafragm ID12 for faster beam alignment
- Translating Lens mount LM1XY screwed on a Flip Mount FM90
© 2011 Thorlabs
Operating the Beam Profiler
75
- Two Lenses LB1945, f = 200 mm, AR coated for appropriate
wavelength range
- Two laser quality Silver Mirrors in two KM100 Mirror Mounts on
flexible post holders
- Latest Beam Profiler Software CD
- Manual
See a complete list of optical and mechanical M2-Meter Components 134 in
appendix.
The stage movement is fully controlled by the software module (included in BP100
software package V2.0 or newer) of the BP100 which allows it to take
measurements at different stage positions and perform a complete M² analysis. This
is done taking multiple measurements of the beam diameter of the collimated beam
at different positions along the beam propagation axis. A hyperbolic curve fit to the
measured data yields reliable and repeatable values for beam waist diameter and
position, Rayleigh range, divergence angle, beam pointing direction, waist
asymmetry, divergence asymmetry and astigmatism.
3.6.3.3.1 Setup and Electrical Connections
The Thorlabs M² Meter M2SET-x is delivered as a complete ready to use instrument.
Mount its breadboard onto a table with a stable mechanical connection to the laser
to be tested before you start beam alignment and measurement.
Do not direct the laser beam immediately to the Beam Profiler but use both
alignment mirrors to adjust for optimal beam height and pointing direction.
Follow the alignment steps described in chapter Beam Alignment 86 .
The M² Meter suited to adapt various beam properties:
- focussed beam, waist accessible
- divergent beam, waist not accessible
- parallel beam
Focussed beam, waist accessible
In case of measuring a focussed beam with accessible beam waist the focusing lens
integrated in the M² Meter is not required and needs to be flipped aside. Using the
applied tiltable mirrors the operator has to align the beam parallel to the translation
axis so that the beam centroid is always in the middle of the Beam Profiler aperture
for all z positions. The already existing beam waist needs to be positioned within the
translation range.
Divergent beam, waist not accessible or
Parallel beam
In these cases the integrated lens within the M² Meter is required to generate an
artificial beam waist within the moving range of the translation stage. Beam
alignment is done first without the lens and subsequently the lens is flipped back into
the beam and is also aligned for lowest beam displacement.
Selection of Focusing Lenses
Prior to start alignment and measurement with the M² Meter system check that the
© 2011 Thorlabs
76
Thorlabs Beam 4.0
wavelength range of the lens meets the wavelength of your beam under test. If the
laser wavelength is outside the range you need to exchange it by unscrewing the
lens tube out of the translating lens mount LM1XY and replace it with the appropriate
lens.
Lenses provided with M2SET-VIS
LB1945-A
BK7 B Coated Bi-Convex Lens, DIA = 25.40, f = 200.00,
AR coated 350 - 650 nm
LB1945-B
BK7 B Coated Bi-Convex Lens, DIA = 25.40, f = 200.00,
AR coated 650 - 1050 nm*
*Lens LB1945-B can be used up to 1100 nm with reflections below 1% to meet the
maximum wavelength of BP109-VIS.
Lenses provided with M2SET-IR
LB1945-B
BK7 B Coated Bi-Convex Lens, DIA = 25.40, f = 200.00,
AR coated 650 - 1050 nm
LB1945-C
BK7 B Coated Bi-Convex Lens, DIA = 25.40, f = 200.00,
AR coated 1050 - 1620 nm*
*Lens LB1945-C can be used up to 1800 nm with reflections below 1% to meet the
maximum wavelength of BP109-IR.
See the following graph for available AR coatings of lenses. Suffix -UV, -A, -B or -C
specifies the wavelength range.
Note
Be sure your laser wavelength is covered by the wavelength range of the selected
lens prior to start beam alignment and M² measurement. Otherwise, lens reflections
may lead to increased measurement errors!
Electrical Connections
Connect the Beam Profiler to your computer using the supplied high speed USB
cable as described in chapter Electrical Connections 82 .
3.6.3.3.2 Acceptable Beam Diameters
Depending on the focal length (f = 200 mm) of the focusing lenses supplied within
the M² Meter there is for a given wavelength a dependency between the applied
initial beam diameter dinit and the resulting waist diameter d0,min. The minimum waist
diameter is achieved for large input beam diameters and at best beam quality
(M²=1).
© 2011 Thorlabs
Operating the Beam Profiler
Since the lowest measurable beam diameter for BP109-x Beam Profiler series is
20 µm the acceptable maximum beam diameter must not exceed the limit displayed
in the following diagram.
Select your operating wavelength at the x-axis and go up to the curve representing
waist diameter. Then read out the max. acceptable initial beam diameter at the
vertical axis. For a waist diameter at the measurement limit (20 µm, red curve) an
operating wavelength of 633 nm yields a max. beam diameter of 8.1 mm, whereas
for 1064 nm the diameter can reach up to about 13.6 mm.
It is suggested to choose a somewhat higher waist diameter of (e.g. 30 µm, green
curve) in order to relax the demands on the Beam Profiler so that it can operate at a
higher measurement speed and achieves also better accuracy. As a drawback
maximum allowed input beam diameters drop down to 5.4 mm at 633 nm and 9.0
mm @ 1064 nm, respectively.
Further limitation of the input beam diameters are given by the 20 mm usable lens
diameter and the 9 mm Beam Profiler aperture.
To measure even larger beam diameters (above the red curve) the focusing lens
needs to be replaced with a lens of longer focal length. In addition, the position of the
lens mount needs to be shifted away from the translation stage so that the waist
position will be located again within the traveling range of the Beam Profiler. See the
Thorlabs catalog for suited lenses.
Note
© 2011 Thorlabs
77
78
Thorlabs Beam 4.0
The beam diameter applied to the M² Meter may exceed the input aperture diameter
of the Beam Profiler since the focusing lens reduces the diameter continuously
towards the beam waist and it is sufficient that the Beam Profiler only scans the
section of the linear divergence region adjacent to the waist position. Here, beam
diameters are much smaller than the Beam Profiler aperture and can be measured
with high accuracy.
Since beam diameters wider than half the aperture already lead to measurable
errors, the Beam software takes into account only beam diameters below 4.5 mm for
its hyperbolic curve fit.
© 2011 Thorlabs
Operating the Beam Profiler
3.6.4
Setting up
3.6.4.1
Mechanical Setup
79
The Thorlabs BP1M2 Extension set for M2 measurements is not a compact
instrument but consists of separate components which are built together. In addition,
means for beam alignment and focusing need to be ordered separately.
The following sketch gives an example of a M2 measurement setup.
Control software
running on a PC
RS232
USB
Laser source
Focusing lens
Beam Profiler
Translation stage with controller
Mounting the translation stage on a table
It is highly recommended to mount the translation stage onto a table to ensure a fixed
position and repeatable measurements.
Use the base plates delivered with the BP1M2 Extension Set to mount the stage
onto an optical table.
Mounting the Beam Profiler to the translation stage
First screw together the mounting adapter plate and the stop plate delivered with the
BP1M2 Extension set.
Then mount the Beam Profiler to the adapter plate by using the appropriate screws
designated in the following figure.
© 2011 Thorlabs
80
Thorlabs Beam 4.0
See BP1M2 Mounting Adapter 137 for a detailed drawing of the adapter.
First mount the Beam Profiler onto the adapter plate by using the appropriate M4x6
and #8-32x1/4" screws, delivered with the BP1M2 Extension Set. Then push it
slightly against the stop at the front. This guarantees orthogonal to the moving
direction of the translation stage adjustment of the instrument. Then fix the screws.
Now insert both dowel bolts into the mounting plate of the translation stage.
Put the adapter plate with the Beam Profiler mounted on it onto the mounting plate of
the translation stage so that the two dowel bolts guarantee a nearly free from play
connection. Fit both plates with 2 screws near the back plate of the Beam Profiler.
Attention
Be sure to mount the Beam Profiler's adapter plate with the designated
cap screws M4x10 and M6x8 only! Longer screws will block or even
damage the translation stage!
Be sure to mount the translation stage with the Beam Profiler on it in a
way that prevents any contact to ambient mechanical parts!
Lasers, lenses, holders or other mechanics may damage the Beam
Profiler and Translation Stage!
© 2011 Thorlabs
Operating the Beam Profiler
The following figure shows the fully assembled BP1M2 Extension Set.
© 2011 Thorlabs
81
82
3.6.4.2
Thorlabs Beam 4.0
Electrical Connections
The Pollux controller includes also the stepper motor driving the VT-80 translation
stage.
It needs to connect to the appropriate power supply and to the computer via RS232.
Use the cables supplied with your BP1M2 Extension Set package.
As soon as the power supply is connected to the controller a LED starts to blinking.
This indicates normal operation.
3.6.4.2.1 Installation of USB to RS232 Converter
The M² translation stage controller interfaces with the control PC via a COM port
(serial RS232 interface). The connecting cable has a RJ45 connector on the
translation stage's end and a 9pin female DSUB connector on the other end.
If your computer does not have available a COM port, please use the supplied with
the M² meter package USB to Serial converter. The driver for this converter is
installed automatically to your system with the software installation, so upon first
connection it's being recognized and installed:
If you wish to verify the correct installation, please open the Device Manager of your
PC. The USB-to-Serial Converter appears in both the Ports and USB controllers
lists:
© 2011 Thorlabs
Operating the Beam Profiler
If it does not appear in Ports list, right click to "USB Serial Converter" and in the
following dialog, select "Properties"
Select the tab "Advanced" and make sure, the Load VCP (Virtual COM Port - this driver
forces a USB device to appear as an COM port to the operating system) box is
checked:
Unplug the USB converter and connect it again - now it works as intended.
© 2011 Thorlabs
83
84
3.6.5
Thorlabs Beam 4.0
M² Measurement
Click on
symbol in the toolbar or select 'Windows
Beam Quality
Measurement' from the menu to enter the M2 measurement feature.
The Beam Quality Measurement window is the central control for the M2
measurement. The windows consists out of three tabs
Initialize
M2 Measurement
Divergence
Initialize provides translation stage initialization and a manual stage control,
necessary for beam direction alignment prior to start M² measurements.
M2 Measurement allows to measure beam quality of a focussed beam.
If the beam is unfocussed (diverging or converging without a beam waist), Thorlabs
Beam software offers the Divergence measurement feature:
3.6.5.1
Initialize
Make sure a stage is connected and powered.
Starting Thorlabs Beam software, the translation stage is being initialized and
zeroed automatically. This means, it's recognized in the tab Initialize and moves to
the Zero position, so far it's not yet there.
If connect the stage after starting software, it must be initialized manually.
© 2011 Thorlabs
Operating the Beam Profiler
85
Click to Refresh, then Select Stage.
Manual translation stage control
The controls are located in the lower part of the Initialize tab:
Velocity can be set between 1 and 13mm/s and remains valid for all subsequent
operations. Default: 10mm/s.
Target position and Increment are parameters for manual move of the stage for
use with the
and
buttons. The slider below shows the actual stage position.
Alternatively, the slider can be moved using the mouse pointer: Click and hold left
mouse button, move to the desired position and release - the stage will move to the
new target position. Movement can be stopped by clicking the button.
Troubeshooting: Translation Stage cannot be found
Be sure to have the translation stage powered on and connected to
your PC via RS232 cable.
Ensure that the selected port is not used by a different application at the
same time.
Attention
Once the translation stage has been initialized a program restart reinitializes the stage automatically when it is connected to the computer
system.
Be sure to have the translation stage with the Beam Profiler on it
mounted in a way that prevents any contact to ambient mechanical
parts while driving over the entire stage length! Otherwise lasers,
lenses, holders or other mechanics may be damaged!
© 2011 Thorlabs
86
3.6.5.2
Thorlabs Beam 4.0
Beam Alignment
Why Beam Alignment?
The Beam Profiler has a defined input aperture, so when moving it along the
translation stage's axis it must be ensured that the laser beam remains within the
aperture. Ideally, the beam centroid remains centered within the aperture during
movement of the beam profiler.
So prior to start M² measurement, the beam must be aligned parallel to the
movement axis of the stage and should hit the aperture in the center.
It is highly recommended to do the alignment procedure precisely in order to
obtain accurate measurement results.
Open the Initialize tab of M² measurement panel and additionally the 2D
Reconstruction as shown below:
For beam alignment, the manual Translation Stage Control 85 is used, while the
beam position is observed in the 2D Reconstruction panel. For more convenience,
enable the Reference Position crosshair (set to sensor center) and enable the
centroid cross.
Preconditions
Prior to start beam alignment and measurement take care of these points:
- avoid reflections, interferences, ambient light
- check that entire laser beam is entering the Beam Profiler aperture
- warm up laser system 1 hour
- ensure that laser output is spatially and temporally stable
Hints
It's helpful to enable the Reference Position, set to sensor center:
© 2011 Thorlabs
Operating the Beam Profiler
This displays the centered to the beam profiler's aperture crosshair.
Together with the enabled Centroid Cross it's easy to observe beam centricity.
Alignment Procedure for BP1M2 Extension Set
If the laser beam is already focussed a single alignment of position and angle is
sufficient.
A proven alignment procedure is this:
1. Go to position A, for instance at 0 mm.
2. Align the beam to the aperture center using a linear adjustment in x and y
direction.
3. Go to a position B at larger distance, for instance to the end of travel path.
4. Align the beam to the aperture center using the angular adjustment of the
beam.
5. Repeat steps 1 to 4 until the beam is centered in both positions.
For parallel or divergent beams an extra focusing lens is required, see Mechanical
Setup 79 . In this case it is recommended to do this alignment without the lens first
and to insert and align the lens in X and Y direction afterwards in order to get the
focussed beam back into the center of the Beam Profiler's aperture. This procedure
ensures that the optical axis runs through the geometrical center of the lens.
See Recommended Accessories 72 section for tools that enable to shift and tilt the
laser beam to be measured.
Lens alignment
For a M2 measurement a focussing element like a lens is necessary. If the laser
beam is set up parallel to the translation stage axes adding a lens into the beam
© 2011 Thorlabs
87
88
Thorlabs Beam 4.0
pathway is quite easy.
When inserting a lens the Beam Profiler should rather be at the end of the stage than
at the front. If the beam was centered before the lens was added the lens has to be
positioned in X and Y direction so that the beam in centered again. In doing so it is
crucial to avoid any tilt of the lens.
When the beam is still centered at all stage position the lens is well-aligned into the
optical path and the system is ready for Beam Quality Measurement.
Alignment Procedure for M2SET M² Meter
The test beam which is focused by the focusing lens needs to constantly meet the
center of the Beam Profiler aperture when it is moved along the beam
propagation axis. As a precondition, the unfocused beam direction needs to be
adjusted first with the focusing lens flipped aside. Thereafter, the lens is flipped into
the beam again and is centered to maintain the beam axis. In case the test beam is
already focussed the lens remains flipped aside.
Alignment tools
Two widely adjustable mirrors and an iris diaphragm are integrated into the M²Meter for making the beam alignment quick and easy. The following sketch
illustrates their position on the breadboard.
The beam is reflected successively at mirror 1 and mirror 2 in order to adapt beam
height and align its direction towards the Beam Profiler. Adjustment screws of both
mirrors are labeled within this figure according to its influence on the horizontal (1H,
2H) or vertical (1V, 2V) beam position and direction. These four adjustment screws
are labeled also in the following photograph:
© 2011 Thorlabs
Operating the Beam Profiler
All beam quality parameters including M2 remain unchanged by this beam
redirection using high quality mirrors.
Pre-Alignment of M2-Meter
In order to ease beam alignment and minimize the required time, the M2-Meter is
shipped with a high level of pre-alignment. Height and horizontal position of the iris
diaphragm, the focusing lens as well as the position of mirror 2 are already prealigned to the center of the entrance aperture of the Beam Profiler.
Note
Do not change height or position of these components accidentally.
Adjustment of a visible beam is easily done because its position is seen directly
onto the partly closed iris and the entrance aperture of the Beam Profiler.
For infrared beams use a IR viewing card or alignment disk for visualization. In
addition, the beam position is also displayed within the Beam Profiler software.
Follow these points for coarse beam alignment
1. Fix the laser under test and ensure a stable connection to the M2-Meter
breadboard.
© 2011 Thorlabs
89
90
Thorlabs Beam 4.0
2. Flip the lens mount aside to allow alignment of the unfocussed beam first.
3. Modify the height of mirror 1 so that the laser beam hits roughly its center. Direct
the beam to the center of mirror 2. For coarse alignment loose the post clamps
RA90 holding the KM100 mirror mounts and fix it in a suitable position. Set the
adjustment screws of the mirror mount to a position that allows further fine
alignment in both directions.
4. Align the angle of mirror 2 so that the beam is running centrically through the iris.
Check this by partly closing the iris aperture. The outer beam regions will produce
symmetrical pattern around the remaining hole.
5. Now check the beam position at the entrance aperture of the Beam Profiler which
was positioned at z = 100 mm. Since the alignment of beam position and angle
are coupled, it is required to align both mirror angles alternatively. Mirror 1 is used
for determining the beam position at mirror 2 and mirror 2 is used for aligning the
beam direction towards the Beam Profiler.
6. Repeat steps 4 and 5 until the beam running through the partly closed iris also
roughly meets the center of the Beam Profiler's entrance aperture.
Fine Beam Alignment
It is advantageous to do alignment steps for horizontal and vertical directions
separately. Use mirror adjustment knobs 1H and 2H for horizontal, screws 1V and 2
V for vertical beam alignment.
Lens Alignment
Now flip the lens back into the unfocussed beam. This leads to a reduce beam
diameter but the beam position remains nearly unchanged because the lens holder
is also pre-aligned. Use the alignment screws on the adjustable lens holders LM1XY
to bring the beam position back to the Beam Profiler center accurately.
Congratulation, you have finished all alignment steps and you are ready to start the
M2 measurements described in the next chapter.
Note
Be sure to have the iris diaphragm completely open during all following
measurements! It was just a helpful beam alignment tool.
© 2011 Thorlabs
Operating the Beam Profiler
3.6.5.3
M² Panel
This section concerns the M2 measurement and its settings. Click to
in the Beam Quality Measurement window to enter the M2 Measurement section.
Via Menu "View" -> M² Workspace"
can be accessed a convenient display, consisting of the Beam Quality Measurement
panel and 2D profile For more information about the 2D Reconstruction window,
see section 2D Reconstruction 30 . Both windows should be arranged that they can
be observed and controlled well.
4 buttons above the M² diagram allow to choose the displayed beam diameter (X, Y)
and the type of fit to be applied to the measured data. By default, both the X and Y
beam diameter will be displayed, and to both parameters, the hyperbolic fit will be
applied.
In the example below the "Hyperbolic Fit Y" is disabled.
© 2011 Thorlabs
91
92
Thorlabs Beam 4.0
In the case of a focussed beam, the hyperbolic data fit is recommended. In addition
to this fit selection the program is able to identify a coarse beam gradient. If the M²
measurement is chosen but the beam shows a linear slope with a beam width
variation of less than 50% the Beam software will suggest a linear fit.
If the program detects a (unfocussed) linear beam propagation instead of a
(focussed) hyperbolic one the software will recommend to proceed with Divergence
measurement perform a linear fit to the data points.
Toolbar
Button Name
Function
M2 Settings
Opens the settings for the M2 measurement
Play/Stop
Starts / stops a M2 measurement
Grid
Dots/Line
Display
Legend
Disables/Enables the grid in the diagram
Toggles between a line and dots diagram for the plotted
data
Opens a window extension with a legend and results panels
In the case of a successful M2 measurement this button
enabled and saves plot data.
Save Data
PDF Test
Protocol
Saves the results of a M2 measurement into a PDF file
In the diagram (which is of course empty at the beginning) the measured data are
plotted.
The Position Bar at the bottom shows the actual position of the translation stage as
seen before in the Initialize tab.
© 2011 Thorlabs
Operating the Beam Profiler
On the right side of the diagram the Calculation To Actual Z Position and the
Results of the M2 measurement are displayed; the boxes are empty so far no
measurement has been made yet.
The panel Calculation to Actual Z Position contains the following information:
Parameter
What does it show?
Position Z [mm]
Beam Diameter
X' [µm]Beam
Diameter Y' [µm]
Azimuthal Angle
[deg]
Shows the actual Z position of the translation stage in mm.
Shown value equals the min. or max. value of the ellipse,
where axes are identical to X and Y as marked on the front
panel.
The displayed value is not relevant.
© 2011 Thorlabs
93
94
3.6.5.4
Thorlabs Beam 4.0
M² Settings
For a successful and reliable measurement it is essential to adapt the measurement
settings.
Click on
to enter the M2 Measurement Settings dialog.
Beam Width
Beam Width Clip (1/e²): This is the value specified in ISO standard 11146. If a
different clip level was used for normal Beam Profiler operation this will be
overwritten by the M² measurement initialization.
Gaussian Diameter: The beam profile will be fitted using a Gaussian curve prior to
determination of the beam width. A Gaussian fit can reduce the impacts of noise
and/or unstable beam shape to the results.
Correct Beam Width: This option should be activated by default. It corrects for the
measurement error due to the finite slit width for all methods (13.5% clip level with
and without Gaussian fit). Since this convolution error is systematic it can be
calculated and eliminated. Especially for narrow beams the beam width result will
become smaller and closer to the real value.
© 2011 Thorlabs
Operating the Beam Profiler
95
Measurement Parameters
Setting the wavelength is mandatory for correct measured M². If the lasing
wavelength is unknown, measure the wavelength using a spectrometer.
Attention
Do not use the nominal wavelength but the actual (measured)
wavelength of the laser! Accuracy of this input determines the
measurement accuracy.
Timeout is the waiting time until valid data can be retrieved from the Beam Profiler
(e.g. in case of slow travel speed)
Scan Range
The Scan Range determines the range from where to where sleigh of the translation
stage is driven during a measurement. Start has to be at least 5 mm smaller than
Stop and greater-than-or-equal to 0 mm. Valid values for Stop are
5 mm < Stop < stage length.
The number of Min. Data Points give the (minimum) number of Z positions. The
actual number also depends on the Scan Method.
Scan Method
The software provides two different kinds of scan methods, the Normal Scan and
the Coarse Scan.
The Coarse Scan just takes the sleigh of the translation stage from Start to Stop
(or vice versa depending on the position of the sleigh before starting the
measurement). The number of recorded beam widths equates exactly to entered
number of Data Points.
© 2011 Thorlabs
96
Thorlabs Beam 4.0
The Normal Scan is in the first instance equal to the Coarse Scan but can add a
series of further data points if some conditions for an ISO compliant measurement
are not yet given. The ISO standard requires that
"at least 10 measurements shall be taken. Approximately half of the measurements
shall be distributed within one Rayleigh length on either side of the beam waist, and
approximately half of them shall be distributed beyond two Rayleigh lengths from the
beam waist."
This means the first run of the Normal Scan calculates a temporary Rayleigh length
and evaluates if enough data points are already measured. If yes a hyperbolic fit is
applied. If not a second run adds additional measurements within the Rayleigh length
on both sides and/or beyond two Rayleigh lengths.
For a M2 measurement the Normal Scan is highly advised. Only, for example, for a
first estimation position of the beam waist position or other simple applications the
Coarse Scan should be used.
Reset
Restores the default settings for M² settings:
Option
Beam Width
Wavelength
Timeout
Start
Stop
Min. Data Points
Scan Method
Default
Gaussian Diameter
635 nm
15 sec
0 mm
150 / 300 mm (depending on the stage length)
20
Normal Scan
Device settings
It is important to set Gain and Bandwidth of the Beam Profiler (see Device Settings
46 ) to Auto.
3.6.5.5
Running The Measurement
Prior to start measurement, make sure that
the beam is aligned properly. This means that the beam is completely on
the CCD sensor over the whole scan range. If not see chapter Beam
Alignment 86 for aligning the beam.
the right focal length is chosen. When driving the slider of the translation
stage from start to stop the beam width minimum should be approximately
in the middle of the scan range. Position the sleigh with help of the Position
Bar to check this.
© 2011 Thorlabs
Operating the Beam Profiler
reflections and interferences are avoided as far as possible.
the laser system is warmed up - depending on the source this might last up
to 1 hour.
the laser output is spatially and temporally stable.
Start the measurement by clicking on the Start button
.
While running the measurement most of the buttons and options are disabled, e.g.
the M² measurement settings and the toolbar. This prevents the modification of
settings during a measurement.
If necessary, the measurement can interrupted by clicking the Stop button
.
After starting the measurement the X axis of the diagram is adapted to the userdefined scan range, for example from 0 to 120 mm. The Y axis scales automatically
to the recorded beam widths.
If the Normal Scan is applied the diagram is zoomed in when the fine scanning
adds additional data points. After this step (at the end of the measurement) the full
scan range is shown again.
© 2011 Thorlabs
97
98
3.6.5.6
Thorlabs Beam 4.0
Numerical Results
If a M2 measurement was successful the Beam Quality Measurement window
looks like the one below.
The green bulb indicates that the measurement was successful and fulfills the ISO
11146 standards.
In general the axes X' and Y' do not coincides with the lab system which is described
by the axes X and Y. Furthermore the M² value for X' is independently from the one of
Y'. For highly elliptical beams like from semiconductor lasers M2X' and M2Y' differ
much more as in this example.
These values can also be found in the listing of the complete Results.
© 2011 Thorlabs
Operating the Beam Profiler
M²
Mean M² value (arithmetic average of M² X' and M² Y')
M² X' and M² Y'
M² value for X' or Y' axis, respectively, calculated from hyperbolic fit.
Beam Waist Postion X' (Y')
Z position of the beam waist (smallest beam diameter). This is the calculated beam
waist position in mm derived from the curve fit. This value may differ from the
position where the smallest beam width was measured.
Beam Waist Diameter X' (Y')
Beam diameter in X' and Y' direction in focal point. This is the calculated minimum
beam diameter in µm derived from the curve fit. This value may differ from the
smallest measured beam width.
Rayleigh Length X' (Y')
Rayleigh length is the calculated distance from the beam waist position in mm
derived from the curve fit where the beam diameter is 2 times wider than the waist
diameter. See also chapter M2 Theory 121.
Divergence Angle
Divergence angle of the focused beam is explained in chapter M2 Theory 121 .
Waist Asymmetry
Waist asymmetry stands for the ellipticity at the waist position. It results from the
waist diameters in both X' and Y' directions. A waist asymmetry of 1.0 indicates a
round beam spot.
© 2011 Thorlabs
99
100
Thorlabs Beam 4.0
Divergence Asymmetry
Divergence Asymmetry is the quotient of divergence angles in Y and X scan
directions. Values differing from 1.0 indicate that the beam ellipticity is changing with
z position, for instance an elliptical beam is focussed to a round spot.
Astigmatism
Astigmatism is known as the effect that the beam waist in X and Y scan direction is
not at the same z position. So there is a difference between the positions of minimal
spot diameters z0y and z0y.
Note
All results are calculated from the applied fit!
Save Test Results
Save measurement data as ASCII file (*.txt) or as EXCEL spreadsheet (*.xls).
Save measurement data as *.pdf file.
Zooming and panning the display
Both axes in M² measurement result display can be zoomed and also panned.
Panning: Place the mouse pointer onto the axis to be shifted. Press and hold left
mouse button - the pointer changes to
or depending on the axis direction.
Move the mouse as the mouse pointer arrows indicate in order to move through the
entire measurement data range for stage position resp. beam diameter.
Zoom: Place the mouse pointer onto the axis to be shifted. Press and hold right
mouse button - the pointer changes to
or depending on the axis direction.
Move the mouse as the mouse pointer arrows indicate in order to zoom in or out the
measurement data range for stage position resp. beam diameter.
Display of results at a certain Z position
After measurement is finished, the calculated data for Beam Diameter (X') and
Beam Diameter (Y') can be retrieved from the curve.
Therefore, move the mouse pointer over the M² curve. As soon as it hits a
measurement point, it's shape changes to
.
Then click to this point. In the Calculations to Actual Z Position panel will appear the
position according to the clicked point and the calculated values.
© 2011 Thorlabs
Operating the Beam Profiler
101
Note
Different from the Results pane, here results are calculated from the measured data
without hyperbolic fit. So it may happen, that in the waist position, at the actual
position are displayed diameter values less that the waist X' (Y') diameters.
In above example, the fitted Y' beam diameter (yellow) is larger than the measured Y'
diameter (blue); same is for X' diameters.
© 2011 Thorlabs
102
3.6.5.7
Thorlabs Beam 4.0
Troubleshooting
Some typical problems which might occur are discussed in the following.
The beam does not hit the aperture for all stage positions.
Aligning the beam is necessary, see section Beam Alignment 86 .
A timeout occurs during a measurement.
A timeout always occurs when the Beam Profiler does not deliver a valid image
within the set timeout interval. This may happen
if the photo diode of the beam profiler is saturated. Decrease incident
optical power, alternatively increase the focal length (which increases the
spot size of the beam) if possible.
if the beam power is too low.
if the beam size is too small and no ellipse could be calculated (if Clip
Level Ellipse is selected as beam width). Use a longer focal length to avoid
beam size which are too small.
if the beam is outside the aperture. Align the beam, see section Beam
Alignment 86 .
M² measurement is carried out, but
Make sure for correct Device Settings 46 .
is displayed, no M² results
The M² value differs extremely from the expected value.
For example, the beam has a nearly Gaussian intensity distribution and M² values
are larger than 1.1:
check set wavelength (see M² Settings 94 )
check Clip Level of the Calculation Area.
If the selected Clip Level is too high, the beam might be cut and will be
measured too small. This results in a too small beam waist and a too small
M2 (even below 1).
If the selected Clip Level is too small, this increases the Calculation Area,
captures noise around the beam and this way the measured beam width is
larger. This leads to an increased M².
M² is smaller than 1.0 - How can this be?
M² values < 1.0 are non-physical but may be due to
the accuracy of the measured result. A error of 5% should be considered.
incorrect wavelength setting. Set the wavelength to the correct value; M²
results will be corected without running a new measurement.
The beam profile looks distorted (particularly, at the end positions of the
stage).
Even if a laser is expected to produce a Gaussian beam with M² = 1.0, the beam still
can be influenced by every optical element between laser and Beam Profiler. For
instance, a focussing lens could be mounted with a tilt or could produce a height
distortion which results in optical aberrations.This reduces the beam quality.
Filters and mirrors may impact on the beam profile as well in the case that surfaces
are contaminated. Clean surfaces according to manufacturer's instructions.
© 2011 Thorlabs
Operating the Beam Profiler
3.6.6
Divergence Measurement
The following section concerns the Divergence Measurement and its settings.
Click on
in the Beam Quality Measurement window to enter the
corresponding section.
For an unfocussed beam the Divergence tab has to be chosen for measuring the
divergence angle of the beam (which could - of course - converge as well). In this
case a linear fit is applied to the measured data.
3.6.6.1
Divergence Measurement Panel
If you have selected the M² workspace
you can find two child windows on your program environment, the Beam Quality
Measurement and the 2D Reconstruction window. For more information about
the 2D Reconstruction window, see section 2D Reconstruction 30 . Both windows
should be arranged that they can be observed and controlled well.
Divergence tab:
Same as in the M² Measurement tab you find on the left hand side a Toolbar which
© 2011 Thorlabs
103
104
Thorlabs Beam 4.0
provide the following functionality.
Button
Name
Function
Divergence
Settings
Play/Stop
Opens the settings for the Divergence measurement
Grid
Disables/Enables the grid in the diagram
Toggles between a line and dots diagram for the plotted
data
Opens a window extension with a legend and results
panels
In the case of a successful divergence measurement this
button enabled and saves plot data.
Saves the results of a divergence measurement into a
PDF file
Dots/Line
Display
Legend
Save Data
PDF Test
Protocol
Starts / stops a Divergence measurement
In the diagram (which is of course empty at the beginning) the measured data are
plotted.
The Position Bar at the bottom shows the actual position of the translation stage as
seen before in the Initialize tab.
On the right side of the diagram the Calculation To Actual Z Position and the
Results of the M2 measurement are displayed; the boxes are empty so far no
measurement has been made yet.
© 2011 Thorlabs
Operating the Beam Profiler
105
The panels of the Calculation To Actual Z Position and Results are described in
the M² Measurement 91 section.
3.6.6.2
Divergence Measurement Settings
For a successful and reliable measurement it is essential to adapt the settings of the
software.
Click on
to enter the Divergence Measurement Settings.
Beam Width
The Beam Width can be selected from the two already known methods.
The calculation of the 4 Diameter follows the ISO 11146-1:2005 standard.
The Approximated Ellipse beam width is based on the 13.5% clip level. At the
beginning of a measurement a reference angle is determined by averaging over 10
frames. This angle is then used to evaluate all following frames and ellipses.
Measurement Parameters
Timeout is the waiting time until valid data can be retrieved from the Beam Profiler
(e.g. in case of slow travel speed)
Wavelength is not relevant for divergence measurement.
© 2011 Thorlabs
106
Thorlabs Beam 4.0
Scan Range
The Scan Range determines the range from where to where sleigh of the translation
stage is driven during a measurement. Start has to be at least 5 mm smaller than
Stop and greater-than-or-equal to 0 mm. Valid values for Stop are
5 mm < Stop < stage length.
Note
It is advisable to set up a larger scan ranges than 40 mm to ensure higher accuracy.
A scan over the entire translation length is often the best choice.
Reset
Restores the default settings for M² settings:
Option
Beam Width
Timeout
Start
Stop
Min. Data Points
Default
4-Sigma Diameter (ISO-Standard)
15 sec
0 mm
150 / 300 mm (depending on the stage length)
20
Device settings
It is important to set Gain and Bandwidth of the Beam Profiler (see Device Settings
46 ) to Auto.
3.6.6.3
Running The Measurement
The divergence measurement is thought to measure low divergent or convergent
beam propagations. Therefore, it is required to remove any focussing elements
which produce a beam waist within the scan range.
Prior to start measurement, make sure that
the beam is aligned properly. This means that the beam is completely on
the CCD sensor over the whole scan range. If not see chapter Beam
Alignment 86 for aligning the beam.
reflections and interferences are avoided as far as possible.
the laser system is warmed up - depending on the source this might last up
to 1 hour.
the laser output is spatially and temporally stable.
Start the measurement by clicking on the Start button
.
© 2011 Thorlabs
Operating the Beam Profiler
107
While running the measurement most of the buttons and options are disabled, e.g.
the Divergence measurement settings and the toolbar. This prevents the
modification of settings during a measurement.
If necessary, the measurement can interrupted by clicking the Stop button
.
After starting the measurement the X axis of the diagram is adapted to the userdefined scan range, for example from 0 to 120 mm. The Y axis scales automatically
to the recorded beam widths.
3.6.6.4
Numerical Results
If a divergence measurement was successful the Beam Quality Measurement
window looks like the one below.
The green bulb indicates that the measurement was successful.
In general the axes X' and Y' do not coincides with the lab system which is described
by the axes X and Y. Furthermore the divergence angle for X' is independent from
the one of Y'. For highly elliptical beams like from semiconductor lasers the
divergence angles of X' and Y' could differ much more as in this example.
These values can also be found in the listing of the complete Results.
Note
© 2011 Thorlabs
108
Thorlabs Beam 4.0
All results are calculated from the applied fit!
Divergence Angle X' (Y')
Divergence angle is explained in chapter M2 Theory 121 .
Asymmetry
Asymmetry is the quotient of divergence angles in Y and X scan directions. Values
differing from 1.0 indicate that the beam ellipticity is changing with z position, for
instance an elliptical beam is focussed to a round spot.
Save Test Results
Save measurement data as ASCII file (*.txt) or as EXCEL spreadsheet (*.xls).
Save measurement data as *.pdf file.
Zooming and panning the display
Both axes in M² measurement result display can be zoomed and also panned, see
M² Measurement results 100 .
© 2011 Thorlabs
Operating the Beam Profiler
4
109
Computer Interface
Thorlabs Beam software is a 32 bit Windows® application capable to recognize,
initialize and control scanning slit and camera beam profiler instruments. This
software was created in Visual Studio 2008 and uses QT libraries.
Instrument control via device drivers or VISA is executed in separated from the
software modules, located in dynamic libraries.
Upon start of Thorlabs Beam software the installation directory is being scanned for
libraries with a certain QT plug-in interface. If such libraries were found, the software
loads them in order to communicate with the device via this interface.
Individual applications can directly access the interface via the device modules by
loading the appropriate libraries using the QT plug-in procedure. Alternatively, the
ThorlabsBeamLibrary administrates these modules and this way enables a QT
independent access to connected beam profiler instruments.
4.1
Libraries
Thorlabs Beam software is split into 3 levels:
- 3rd party components (USB drivers, VISA)
- QT/C++ libraries (device modules directly accessing device drivers)
- Thorlabs Beam application (loads the modules and communicates with them
via QT plug-in interface) and Thorlabs Beam Library (shifts the functionality of
the Thorlabs Beam application into a C++ library)
For individual applications, there are two levels to set up:
- a QT application to communicate with the modules using the defined QT plugin interface
- an application using the Thorlabs Beam Library
1. QT Application
A QT application can be created in a development environment like QtCreator or
Visual Studio. QT libraries qtmain.lib, QtCore4.lib and QtGui4.lib
must be included.
Device modules include the „IBeamProfiler“ interface for accessing the modules.
© 2011 Thorlabs
110
Thorlabs Beam 4.0
This interface must be included in your application:
#include "IBeamProfiler.h"
To load modules, a QPluginLoader is used. It looks up in all libraries in the
addressed folder for QT plug-in interface and attempts to load the plug-ins:
QPluginLoader loader(fileName);
QObject *plugin = loader.instance();
If the plug-in has been loaded, the interface IBeamProfiler can be extracted from the
module:
IBeamProfiler* deviceClass = qobject_cast
<IBeamProfiler*>(plugin);
Now, all functions can be accessed via the interface.
The function deviceList() generates a list of all connected devices:
const QList<DEVICE_SETTINGS>* deviceList =
deviceClass->deviceList();
Device Settings include the essential device parameters. Not all beam profiler
devices support all Device Settings parameters. Some parameters are valid only for
the Camera beam profiler BC106* (Trigger, Exposure, Gain, Corrections), other
parameters only for the Scanning Slit beam profiler BP10x (Target Resolution, Scan
Rate, Auto Gain, Bandwidth and DC).
A set of device parameters is required to initialize a connected device:
DEVICE_SETTINGS deviceSettings = deviceList->at
(0);
deviceClass->initializeDevice(&deviceSettings);
When terminate your own application, devices must be released:
deviceClass->releaseDevice();
2. Thorlabs Beam Library application
Thorlabs Beam Library is a library handling the device modules and providing
simple functions for device access.
Prior to all, a library instance must be created. Device modules are searched and
loaded:
CreateThorlabsBeamInstance();
The function below returns the number of connected devices:
© 2011 Thorlabs
Computer Interface
111
GetConnectedDeviceCount();
A device is initialized with a device identifier. The ID is “0”, if only one device is
connected, and 0 or 1, if two devices are present:
InitDevice(unsigned long deviceID);
Prior to terminate the application. the library instance must be released:
ReleaseThorlabsBeamInstance();
Retrieve measurement results:
GetMeasurement()
Measurement results are created in the library, user access only by reference.
GetMeasurementCopy()
First, a result variable must be created; then the function copies the results from
library to the result variable. This function is required when a programming language
handels the memory managemenent independently and cannot access results by
refererence (e.g. LabVIEW®).
3. LabVIEW® application
For LabVIEW® programming VIs (converted from Thorlabs Beam Library functions)
are supplied. These VIs allow to use all Thorlabs Beam Library functions.
4.2
Sample Programs
C++ program sample with MFC
Sample program „ThorlabsBeamSamplec++MFC“ is a standard MFC application
with inserted Thorlabs Beam library functions. Modifications are bordered as below:
//*************** Thorlabs Beam ****************
[…]
//**********************************************
First, the Thorabs Beam library is included and an instance created:
#include "ThorlabsBeamLibrary.h"
CreateThorlabsBeamInstance();
If at least one device is connected, it is being initialized with standard settings.
int deviceCount = GetConnectedDeviceCount();
if (deviceCount > 0)
{
InitDevice(0);
}
© 2011 Thorlabs
112
Thorlabs Beam 4.0
In the message loop the PaintEvent is used to trigger the measurement cycle. To
keep it running, the PaintEvent is continously recalled:
InvalidateRect(msg.hwnd, &clientRect, false);
In PaintEvent a new result is requested:
CALCULATION_CLUSTER calcCluster;
unsigned char* imageData = NULL;
int width;
int height;
int lStride;
if(0 == GetMeasurement(&calcCluster, &imageData, &width, &height,
&lStride))
{
[…]
}
When terminate the program, devices and their drivers are being released:
ReleaseThorlabsBeamInstance();
© 2011 Thorlabs
Computer Interface
113
LabVIEW® program sample
Here, the Thorlabs Beam library functions are used via VIs. These VIs are located in
the „ThorlabsBeamLibrary.lvlib“ library.
Description of „ThorlabsBeamLabViewSample.vi“:
- at program start, the Thorabs Beam Library is initialized
- the number of connected devices is displayed in the „Connected Devices“ box
- the index entered to „Device ID“ box identifies which of the connected devices
shall be used
- by clicking to the „Initialize Device and Start Measurement“ button a
measurement cycle is started, results are written to the „calcCluster“ structure
and the image of the camera (or reconstruction of the slit beam profiler) is
displayed in the „Picture“ box.
- to exit the program:
switch off the button „Initialize Device and Start Measurement“,
click to „Release Device“
click „Quit“ button.
© 2011 Thorlabs
114
4.3
Thorlabs Beam 4.0
Thorlabs Beam Library
Function description of the Thorlabs Beam Library can be found in the file „
ThorlabsBeamLibrary.h“:
© 2011 Thorlabs
Computer Interface
5
115
Maintenance and Repair
Protect the beam profiler from adverse weather conditions. The beam profiler is not
water resistant.
Attention
To avoid damage to the instrument, do not expose it to spray, liquids or
solvents!
The unit does not need a regular maintenance by the user.
5.1
Version and other Information
The menu entry Help
About Thorlabs displays application relevant data.
In case of a support request, please submit the software version of the application.
This will help to locate the error.
Visit Thorlabs website www.thorlabs.com to download the latest updates of the
Beam Profiler Software.
5.2
Warnings and Errors
In order to prevent measurement errors the user will be informed about improper
Camera Beam Profiler measurement conditions using error and warning messages
within the status bar. In this case the user should take action immediately in order to
eliminate bad measurement conditions. Example:
Possible errors and warnings:
Scan speed not stabilized
© 2011 Thorlabs
116
Thorlabs Beam 4.0
Explanation
The detected drum rotation speed differs from the set value. Proper
measurements are impossible.
Resolving
This warning may appear shortly after the Scan Rate has been changed - the
drum's inertness causes a delay in reaching a new set value.
If this warning does not disappear, the Beam Profiler seems to be damaged
and need factory repair - please contact Thorlabs 142 for return instructions
Device in Pause Mode
Explanation
In the Menu bar, the Pause
Resolving
Press in Menu bar the Start
or Next Frame
button was pressed
button.
Attention
Calculation results are not reliable as long as an error or warning is
displayed within the status bar!
5.3
Cleaning
The Beam Profiler has sensitive to mechanical impacts parts (slits) mounted to the
drum. Do not attempt to clean the slits using tissue, cotton buds or compressed air the slit might be damaged. In case a visible contaminant is found, please return the
instrument to Thorlabs, see the appropriate Addresses 142 .
The instrument itself may be cleaned using a wet lint-free cloth.
© 2011 Thorlabs
Maintenance and Repair
5.4
117
Troubleshooting
Software Installation failed
Be sure to have administrative rights on your computer which enables you to
install software at all. Ask your system administrator to give you such rights or to
do the installation himself. See Software Installation 11 for details.
No beam profiler recognized
If after starting of Beam software no instrument was recognized, the Device
Settings button in the Menu bar will be
This will be the case also if no
instrument is connected to the PC.
Check the USB cable
Check proper driver installation
Check if the green LED lights up - LED off indicates that the Beam Profiler's
firmware isn't loaded.
See section Connection to the PC 21 for details.
You may unplug and reconnect the Beam Profiler to a different USB port or use a
different USB cable. Wait a few seconds, until the green LED lights up. Then
click 'Refresh Device List' within the Device Selection panel. See chapter Start
the Application 22 for a detailed description.
No translation stage recognized
If the M² translation stage was not initialized after Beam software start,
check if the stage is powered up (red LED blinking)
check the connection of the stage to the PC
check for proper USB-to-Serial converter driver installation, if used
See section Electrical Connections 82 for details.
Press the Refresh button
See section Initialize
84
for details.
No update of results and graphs
The device is in the pause mode, resume the device: Press in Menu bar the
Start
button.
The "Average over frame" rate might be high, check its value in the
Application Settings 49 .
© 2011 Thorlabs
118
6
Thorlabs Beam 4.0
Application Note
This chapter contains the background knowledge about the measurement methods
of beam profiles.
Beam profiles can be characterized by a number of different parameters. Our aim
was to offer measurement of all usual beam parameters based on ISO11146-1.
In the following sections detailed explanations are given to the measured
parameters.
6.1
Coordinate systems
Lab System
The lab system (AKA reference system) of coordinates is based on the true X and Y
coordinate orientation of the drum in accordance with the marking on the front panel.
Transformed System
The transformed system of coordinates is based on the calculated beam axes
(minor and major axes for elliptical fit or for 4 beam diameter).
6.2
Raw Data Measurements
Beam Width (4 )
Width on X and Y axes (centroids), based on the second moment calculation
d
d
x
y
4*
4*
x
y
4*
4*
(x
x centroid )2 * p ( x , y )
Sum _ Intensity
(y
y centroid )2 * p ( x , y )
Sum _ Intensity
Beam width (4 ) can be calculated also based using radial distance (pixel centroid; R).
According to ISO11146-1, if the ellipticity 119 is larger than 0.87, the beam profile
may be considered to be of circular symmetry at that measuring location. In this
case, ISO11146-1 allows to calculate only one common 4 beam width (4
simplified).
Peak Position
X, Y: position of the pixel with highest intensity (AD value) which is found first with
respect to reference position.
2
Y 2 = radial distance of same pixel from reference position
R= X
Reference position is the sensor's center.
Centroid Position
X, Y and R position (first moment), calculated over all pixels with respect to the
© 2011 Thorlabs
Application Note
119
above reference position.
X= SUM [x * p (x,y)] / I
Y= SUM [y * p (x,y)] / I
where:
p(x,y) intensity at location (x,y);
I
total intensity;
SUM of pixels taken taken over entire area
AD Saturation
Saturation level of the instrument's AD converter.
Total Power
Total power measured through the ND filter 10 in the drum (photo diode current with
respect to the typical wavelength dependant responsivity).
6.3
Ellipse (fitted)
The beam shape is being fitted to an ellipse using the set clip level (down from the peak).
Diameter (clip level) is given for the minor axis (min), major axis (max) and their
arithmetic mean value.
Ellipticity and Eccentricity of the beam are defined in ISO 11146-1 as
© 2011 Thorlabs
120
Thorlabs Beam 4.0
where dmin denotes the minor and dmax the major axes of the approximated beam
ellipse, respectively.
Orientation denotes the angle of the major ellipse axis is with respect to the
horizontal x axis and is within the range -90° < ≤ 90°.
6.4
X-Y-Profile Measurement
Beam Width Clip (xx%)
Beam width is the distance between two points on opposed edges of a captured
beam profile in X and Y axis whereas its height is defined by a certain percentage of
the peak power. This percentage is called clip level.
Preferred clip levels are for instance 50 % (Full Width at Half Maximum) and 13.53%
(exactly 1/e²).
Since the Beam Profiler software supports a variable clip level, the beam width is
always displayed with its clip level in brackets.
Note
Please note that 'Beam Width' is always the diameter, not the radius of the beam.
6.5
Gaussian Fit Measurement
Gaussian fit is a least-square fit of an ideal Gaussian curve to the X-Y Cross Section
Profiles.
Gaussian Intensity
is the correlation between the beam profiles in a line (X) and column (Y) and its
appropriate Gaussian curve fit
Gaussian Diameter
is the width of the Gaussian fit at the 1/e² intensity level
© 2011 Thorlabs
Application Note
6.6
M² Theory
The diameter d(z) of a focused laser beam of fundamental modeTEM00 increases
with distance z from its waist position.
with
d0
waist diameter
zR
Rayleigh length
wavelength
This formula is simplified. If the waist position z0 is not zero, z has to be replaced
with (z-z0).
M2 = 1
Fundamental
mode TEM00
z0
d0* 2
d(z)
d0
z
zR
Rayleigh length
Focusing lens
The Rayleigh length zR is defined by
and determines the distance from the beam waist where the beam diameter has
increased by a factor of 2 = 1,41 compared to the minimum diameter at the waist.
This formula is valid for a Gaussian beam.
In the far field, (z >> zR) beam diameter increases linearly with z which gives a
constant divergence angle in the far field.
The product of min. beam diameter at waist and divergence angle d0* is constant
for a given wavelength.
© 2011 Thorlabs
121
122
Thorlabs Beam 4.0
From this equation it is obvious that a smaller beam waist can only be achieved by
increasing the divergence angle. This implies using a lens with short focal length.
Also the wavelength determines the min. achievable spot size because beam waist
d0 is directly proportional to wavelength.
For higher modes than the fundamental mode TEM00 both the divergence angle
and the beam waist diameter d0 increase by a factor M.
Therefore the product d0* increases by a factor of M2.
Finally, the times-diffraction-limit factor M2 is calculated by
The reciprocal of this times-diffraction-limit factor M2 is called the beam propagation
factor or beam quality K.
The following table illustrates the relationship these parameters between a perfect
Gaussian beam and non-perfect beam.
Parameter
Gaussian beam
Times-diffraction-limit factor M2
Beam propagation factor = Beam quality K
Beam waist for given lens
Divergence angle at given beam waist d0
1
1
minimal
narrow
Bad
beam
>1
<1
broader
wider
quality
Reasons for non-ideal Gaussian Beam with M2 > 1
Gaussian beam is preferred to use because of its minimum divergence angle and
the ability to get the minimal focus diameter.
Differences to Gaussian shape can be due to
existence of higher modes
amplitude and phase distortions due to inhomogeneous gain medium in
lasers
occurrence of extraordinary beams
© 2011 Thorlabs
Application Note
123
These distortions lead to higher divergence and wider beam waist compared to
Gaussian beams when focused using the same lens. As a result the achievable max.
power density is reduced.
Comparison of propagation between fundamental mode TEM00 (ideal
Gaussian beam) and mode mixture beam
With a given divergence angle (i.e. knowing the focus of the lens) the fundamental
mode alone produces the smallest (theoretical limited) beam waist (green curve). If
beam quality gets worse (red curve) the beam waist becomes wider than before. If
divergence is fixed, beam waist is enlarged by the factor M2 and the appropriate
power density at z0 is reduced by a factor (M2)2.
M2 = 1
Fundamental
mode TEM00
1
=
z0
2
d01* 2
M2 > 1
Mode mixture
d02
d01
d02* 2
z
zR1
zR2
Rayleigh length
Focusing lens
The Rayleigh length may also be influenced due to the changed beam propagation
curve.
© 2011 Thorlabs
124
6.6.1
Thorlabs Beam 4.0
Focal and stage length calculation
Focal length
The generated beam waist diameter d0 must not decrease below the minimal
measurable beam diameter of the Beam Profiler.
The beam waist diameter d0 is:
To fulfill this requirement for each wavelength and the highest focusability (M2=1) the
divergence angle must not exceed a maximum value max.
Depending on initial beam size dinit, a minimal focal length f can be calculated.
Refer to diagram A for quick selection help.
Translation stage length
For optimal M2 detection the translation range should be at least 5 times the
Rayleigh length of the focused beam to cover both the beam waist and the
neighboring divergent beam propagation.
Minimal translation stage length is:
where is:
Lmin
zR
M2
d0
minimum required stage length
Rayleigh length for a non-gaussian beam with fixed divergence angle
highest expected M2 value
operating wavelength
beam waist diameter
Refer to diagram B for quick selection help.
Besides this minimum requirement, more flexibility is added to the setup by
selecting a longer stage.
© 2011 Thorlabs
Application Note
7
Appendix
7.1
Certifications and Compliances
125
The Thorlabs GmbH, Hans-Böckler-Strasse 6, D-85221 Dachau, declares under it's
own responsibility, that the products
Beam Profiler
BP104-UV, BP104-VIS, BP104-IR, BP104-IR2
BP109-UV, BP109-VIS, BP109-IR, BP109-IR2
fulfill the requirements of the following standards and therefore corresponds to the
regulations of the directive.
Category
Standards or description
EC Declaration of
Meets intent of Directive 2004/108/EC1 for Electromagnetic Compatibility.
Conformity - EMC
Compliance was demonstrated to the following specifications as listed in the
Official Journal of the European Communities::
EN 61326:1997
+A1:1998
+A2:2001
+A3:2003
Electrical equipment for measurement, control and
laboratory use – EMC requirements:
Immunity: complies with immunity test requirements for
equipment intended for use in industrial locations2.
Emission: complies with EN 55011 Class B Limits2.
FCC EMC
Compliance
IEC 61000-4-2
Electrostatic Discharge Immunity (Performance criterion B)
IEC 61000-4-3
Radiated RF Electromagnetic Field Immunity (Performance
Criterion A)
IEC 61000-4-4
Electrical Fast Transient / Burst Immunity (Performance
Criterion A)
Emissions comply with the Class B Limits of FCC Code of Federal Regulations
47, Part 15, Subpart B2.
EC Declaration of Compliance was demonstrated to the following specification as listed in the
Conformity - Low Official Journal of the European Communities:
Voltage
Low Voltage Directive 2006/95/EC3
EN 61010-1:2001 Safety requirements for electrical equipment for
measurement, control and laboratory use.
1 Replaces 89/336/EEC
2 Compliance demonstrated using a high-quality shielded USB cable shorter than 3 meters.
3 Replaces 73/23/EEC, amended by 93/68/EEC
© 2011 Thorlabs
126
7.2
Thorlabs Beam 4.0
Warranty
Thorlabs GmbH warrants material and production of the BC106 for a period of 24
months starting with the date of shipment. During this warranty period Thorlabs
GmbH will see to defaults by repair or by exchange if these are entitled to warranty.
For warranty repairs or service the unit must be sent back to Thorlabs GmbH
(Germany) or to a place determined by Thorlabs GmbH . The customer will carry the
shipping costs to Thorlabs GmbH, in case of warranty repairs Thorlabs GmbH will
carry the shipping costs back to the customer.
If no warranty repair is applicable the customer also has to carry the costs for back
shipment.
In case of shipment from outside EU duties, taxes etc. which should arise have to be
carried by the customer.
Thorlabs GmbH warrants the hard- and software determined by Thorlabs GmbH for
this unit to operate fault-free provided that they are handled according to our
requirements. However, Thorlabs GmbH does not warrant a faulty free and
uninterrupted operation of the unit, of the soft- or firmware for special applications
nor this instruction manual to be error free.
Thorlabs GmbH is not liable for consequential damages.
Restriction of warranty
The warranty mentioned before does not cover errors and defects being the result of
improper treatment, software or interface not supplied by us, modification, misuse or
operation outside the defined ambient conditions stated by us or unauthorized
maintenance.
Further claims will not be consented to and will not be acknowledged. Thorlabs
GmbH does explicitly not warrant the usability or the economical use for certain
cases of application.
Thorlabs GmbH reserves the right to change this instruction manual or the technical
data of the described unit at any time.
© 2011 Thorlabs
Appendix
7.3
Copyright
Thorlabs GmbH has taken every possible care in preparing this Operation Manual.
We however assume no liability for the content, completeness or quality of the
information contained therein. The content of this manual is regularly updated and
adapted to reflect the current status of the software. We furthermore do not
guarantee that this product will function without errors, even if the stated
specifications are adhered to.
Under no circumstances can we guarantee that a particular objective can be
achieved with the purchase of this product.
Insofar as permitted under statutory regulations, we assume no liability for direct
damage, indirect damage or damages suffered by third parties resulting from the
purchase of this product. In no event shall any liability exceed the purchase price of
the product.
Please note that the content of this User Manual is neither part of any previous or
existing agreement, promise, representation or legal relationship, nor an alteration
or amendment thereof. All obligations of Thorlabs GmbH result from the respective
contract of sale, which also includes the complete and exclusively applicable
warranty regulations. These contractual warranty regulations are neither extended
nor limited by the information contained in this User Manual. Should you require
further information on this product, or encounter specific problems that are not
discussed in sufficient detail in the User Manual, please contact your local Thorlabs
dealer or system installer.
All rights reserved. This manual may not be reproduced, transmitted or translated to
another language, either as a whole or in parts, without the prior written permission
of Thorlabs GmbH.
Status: 2010
© Thorlabs GmbH. All rights reserved.
© 2011 Thorlabs
127
128
Thorlabs Beam 4.0
7.4
Technical Data
7.4.1
Technical Data Beam Profiler
All technical data are valid at 23 ± 5°C and 45 ± 15% rel. humidity
Operating Temperature
+5 ... +35 °C
Storage Temperature
-40 ... +70 °C
Warm-up time for rated accuracy
15 min
Beam Profiler
Model
Wavelength
Range
BP104- BP104- BP104- BP104- BP109- BP109- BP109- BP109UV
VIS
IR
IR2
UV
VIS
IR
IR2
200 1100
nm
Detector Type Si, UV
enhance
d
400 1100
nm
700 1800
nm
Si
Ge
1000 2700
nm
200 1100
nm
400 1100
nm
700 1800
nm
10002700
nm
Si
Ge
InGaAs
extended
InGaAs
Si, UV
extended enhance
d
Aperture
Diameter
4mm
9mm
Slit Size
2.5µm
5µm
Minimal
Beam
Diameter
10µm
20µm
Maximal
Beam
Diameter
4mm
9mm*
0.5 … 38µm
(depending on scan rate)
1.1 … 38µm
(depending on scan rate)
Sampling
Resolution
Scan Rate
Power Range
1.0 ... 20.0 per s (continuously variable)
10nW ... 10W (depending on beam diameter and model)
Amplifier
Bandwidth
10, 20, ... , 150kHz (-1dB)
Sample
Frequency
0.0625 … 1.0MHz
Dynamic
Range
72dB (Amplifier Switchable)
Signal
Digitization
16bit
Head Size
Ø 80mm x 60mm (Ø 70mm without rotation mount)
Minimum
Pulse Rate
10 Hz
*BP109-UV, -VIS, -IR
BP109-IR2
beam diameter error <10% at 9 mm Ø.
beam diameter error <20% at 9 mm Ø for beam divergence <5°
© 2011 Thorlabs
Appendix
Additional data for M2SET M²-Meter
Model
Component Type
Breadboard Footprint
Beam Profiler
Wavelength range
M2SET-VIS
M2SET-VIS/M
M2SET-IR
M2SET-IR/M
imperial
metric
imperial
metric
600 x 150 mm
24 x 6"
BP109-VIS
BP109-IR
400 - 1100 nm
700 - 1800 nm
Beam Diameter Range
20 µm - 9 mm (at Beam Profiler Input Aperture)
Power Range
10 nW to 10 W, Depending on Beam Diameter
Translation range
150 mm
-100 mm to +50 mm from focal point
Lens focal length
200 mm
Optical axis height
M2 measurement range
Typical M2 and K
accuracy
Maximum Input Beam
Diameter
Accepted Beam Diameter
for 5% Accuracy
Minimum Detectable
Divergence Angle
Applicable Light Sources
Typical measurement
time
© 2011 Thorlabs
50 - 120 mm, further extendable
1.0 - no upper limit
5%, depending on optics and alignment
14 mm depending on
wavelength, see diagram
20 mm depending on
wavelength, see diagram
20 µm - 4.5 mm (at Beam Profiler Input Aperture)
<0.1 mrad
CW and pulsed sources
300kHz
20 - 40 sec. depending on beam shape and settings
129
130
Thorlabs Beam 4.0
Additional data for BP1M2 Extension Set based M²
Measurement
Model
Translation range
Translation stage
BP1M2-50
BP1M2-150
BP1M2-300
50 mm
150 mm
300 mm
VT-80 + Pollux controller
Optical axis height
90 mm
Wavelength range
see Beam Profiler range,
extension around nominal range allowed
M2 measurement range
Typical M2 and K accuracy
Accepted beam diameter for
5% accuracy
Typical measurement time
Applicable Light Sources
1.0 - no upper limit
5%, depending on optics and alignment
20µm - 2 mm (BP104)
20µm - 4.5 mm (BP109)
20 - 40 sec. depending on beam shape and settings
CW and pulsed sources
300kHz
© 2011 Thorlabs
Appendix
7.4.2
Typical Photodiode Responce Curves
The following diagrams showing typical response curves of UV-enhanced Silicon
photodiodes used in BP104-UV and BP109-UV, Silicon photodiodes used in
BP104-VIS and BP109-VIS, Germanium photodiodes used in BP104-IR and
BP109-IR and extended wavelength Indium Gallium Arsenide (x-InGaAs)
photodiodes used in BP104-IR2 and BP109-IR2.
Beam Profiler BP104-UV, BP109-UV
Typical Photodiode Response
0,6
response / A/W
0,5
0,4
0,3
0,2
0,1
0
200
300
400
500
600
700
800
900
1000
1100
w avelength / nm
Beam Profiler BP104-VIS, BP109-VIS
Typical Photodiode Response
0,8
0,7
response / A/W
0,6
0,5
0,4
0,3
0,2
0,1
0
400
500
600
700
800
w avelength / nm
© 2011 Thorlabs
900
1000
1100
131
Thorlabs Beam 4.0
Beam Profiler BP104-IR, BP109-IR
Typical Photodiode Response
0,9
0,8
response / A/W
0,7
0,6
0,5
0,4
0,3
0,2
0,1
0
700
800
900
1000 1100 1200 1300 1400 1500 1600 1700 1800
w avelength / nm
Beam Profiler BP104-IR2, BP109-IR2
Typical Photodiode Response
1,4
1,2
1,0
response / A/W
132
0,8
0,6
0,4
0,2
0,0
1000
1200
1400
1600
1800
2000
2200
2400
2600
w avelength / nm
© 2011 Thorlabs
Appendix
7.4.3
BP1M2 Extension Set Components
The following table lists all components supplied with the Thorlabs BP1M2-x
Extension Set.
© 2011 Thorlabs
133
134
7.4.4
Thorlabs Beam 4.0
M2SET M2-Meter Components
The following table lists all components supplied with the Thorlabs M2-Meter
M2SET-x.
© 2011 Thorlabs
Appendix
7.4.5
Drawings
7.4.5.1
Beam Profiler
© 2011 Thorlabs
135
136
7.4.5.2
Thorlabs Beam 4.0
Slit and Photodiode Position
Especially for highly divergent beams it is required that the entire beam power
enters the entrance aperture, is scanned by the slit and is detected by the
photodiode. To check for this condition the operator needs to know the positions
and distances of these elements.
P
S
photodiode
slit
All dimensions are defined by design and may differ about 0.20 mm tolerance.
Model
BP104-UV
BP104-VIS
BP104-IR
BP104-IR2
BP109-UV
BP109-VIS
BP109-IR
BP109-IR2
Distance
Front - Slit (S)
1.87 mm
1.87 mm
1.87 mm
1.87 mm
1.87 mm
1.87 mm
1.87 mm
1.87 mm
Distance
Front - Photodiode
(P)
6.90 mm
5.90 mm
7.40 mm
*
6.90 mm
6.90 mm
6.90 mm
*
Distance
Slit - Photodiode
5.03 mm
4.03 mm
5.53 mm
*
5.03 mm
5.03 mm
5.03 mm
*
* Beam Profiler models BP104-IR2 and BP109-IR2 use an aspheric collimating lens
behind the slit followed by a photodiode smaller than the entrance aperture.
© 2011 Thorlabs
Appendix
7.4.5.3
BP1M2 Mounting Adapter
© 2011 Thorlabs
137
138
7.4.5.4
Thorlabs Beam 4.0
Translation Stage VT-80
© 2011 Thorlabs
Appendix
7.4.5.5
M2SET M2-Meter
© 2011 Thorlabs
139
140
7.5
Thorlabs Beam 4.0
Thorlabs "End of Life" Policy (WEEE)
As required by the WEEE (Waste Electrical and Electronic Equipment Directive) of
the European Community and the corresponding national laws, Thorlabs offers all
end users in the EC the possibility to return "end of life" units without incurring
disposal charges.
This offer is valid for Thorlabs electrical and electronic equipment
sold after August 13th 2005
marked correspondingly with the crossed out "wheelie bin" logo (see fig. 1)
sold to a company or institute within the EC
currently owned by a company or institute within the EC
still complete, not disassembled and not contaminated
As the WEEE directive applies to self contained operational electrical and electronic
products, this "end of life" take back service does not refer to other Thorlabs
products, such as
pure OEM products, that means assemblies to be built into a unit by the user
(e. g. OEM laser driver cards)
components
mechanics and optics
left over parts of units disassembled by the user (PCB's, housings etc.).
If you wish to return a Thorlabs unit for waste recovery, please contact Thorlabs or
your nearest dealer for further information.
7.5.1
Waste Treatment on your own Responsibility
If you do not return an "end of life" unit to Thorlabs, you must hand it to a company
specialized in waste recovery. Do not dispose of the unit in a litter bin or at a public
waste disposal site.
7.5.2
Ecological Background
It is well known that WEEE pollutes the environment by releasing toxic products
during decomposition. The aim of the European RoHS directive is to reduce the
content of toxic substances in electronic products in the future.
The intent of the WEEE directive is to enforce the recycling of WEEE. A controlled
recycling of end of live products will thereby avoid negative impacts on the
environment.
Crossed out "Wheelie Bin" Symbol
© 2011 Thorlabs
Appendix
7.6
Listings
7.6.1
List of Acronyms
The following acronyms and abbreviations are used in this manual:
2D
3D
ADC
AR
BC
CA
cw
GUI
ND
PC
FPS
ROI
USB
UV
VIS
7.6.2
2 Dimensional
3 Dimensional
Analog to Digital Converter
Anti Reflection
Beam Profiler Camera
Calculation Area
Continuous Wave (constant power source)
Graphical User Interface
Neutral Density
Personal Computer
Frames Per Second
Region Of Interest
Universal Serial Bus
Ultra Violet (wavelength range)
VISible (wavelength range)
List of Symbols
The following symbols appear on the BC106 Beam Profiler or within this manual:
Symbol
Meaning
Universal Serial Bus (USB), a serial bus standard to interface
devices to a host computer.
The CE mark is a mandatory conformity mark on many
products placed on the single market in the European
Economic Area (EEA). By affixing the CE marking, the
manufacturer asserts that the item meets all the essential
requirements of the relevant European Directive(s). It does not
certify that a product has met EU consumer safety, health or
environmental requirements.
Crossed out "Wheelie Bin" symbol. Waste Electrical and
Electronic Equipment (WEEE) is a loose description of
surplus, obsolete, broken or discarded electrical or electronic
devices. See Ecological_Background 140
© 2011 Thorlabs
141
142
7.6.3
Thorlabs Beam 4.0
Thorlabs Worldwide Contacts
USA, Canada, and South America
Thorlabs, Inc.
435 Route 206
Newton, NJ 07860
USA
Tel: 973-579-7227
Fax: 973-300-3600
www.thorlabs.com
www.thorlabs.us (West Coast)
Email: [email protected]
Support: [email protected]
Europe
Thorlabs GmbH
Hans-Böckler-Str. 6
85221 Dachau
Germany
Tel: +49-8131-5956-0
Fax: +49-8131-5956-99
www.thorlabs.de
Email: [email protected]
UK and Ireland
Thorlabs Ltd.
1 Saint Thomas Place, Ely
Cambridgeshire CB7 4EX
Great Britain
Tel: +44-1353-654440
Fax: +44-1353-654444
www.thorlabs.com
Email: [email protected]
Support: [email protected]
France
Thorlabs SAS
109, rue des Côtes
78600 Maisons-Laffitte
France
Tel: +33-970 444 844
Fax: +33-811 381 748
www.thorlabs.com
Email: [email protected]
Scandinavia
Thorlabs Sweden AB
Box 141 94
400 20 Göteborg
Sweden
Tel: +46-31-733-30-00
Fax: +46-31-703-40-45
www.thorlabs.com
Email: [email protected]
Japan
Thorlabs Japan, Inc.
Higashi Ikebukuro
Q Building 1st Floor 2-23-2
Toshima-ku, Tokyo 170-0013
Japan
Tel: +81-3-5979-8889
Fax: +81-3-5979-7285
www.thorlabs.jp
Email: [email protected]
China
Thorlabs China
Oasis Middlering Centre
3 Building 712 Room
915 Zhen Bei Road
Shanghai
China
Tel: +86-21-32513486
Fax: +86-21-32513480
www.thorlabs.hk
Email: [email protected]
© 2011 Thorlabs
Appendix
DirectX Installation 11
Divergence Display
103
Divergence Measurement
103, 106
Divergence Setup 105
Divergence Workspace 103
Duster Spray
116
Index
-22D Profile Window
30
-E-
-33D Profile Window
32
-AAcceptable Beam Diameters
Accessories
6, 79
Acronyms
141
Adapter plate 79
Addresses
142
Alignment Example 86
Alignment Instructions
86
Aperture 76
Application Note 118
ASCII Text File 55
76
-FFile 24
Filter Graph Library
109
Filter Wheel 115
Focal length 68, 124
-G-
- BBC106 Selection 22
Beam Alignment
86
Beam propagation curve 121
Beam propagation factor K 121
Beam Propagation Theory
121
BP1M2 79
-CC++ example 109
C++ Libraries (*.dll) 109
Calculation Area 30
Calculation Results Window
Calculations Selection 49
Cannot Connect to Camera
Child Windows
29
Cleaning 116
Coaxial alignment
86
COM port
84
Computer Interface 109
Connection to the PC 21
Coordinate System 30
© 2011 Thorlabs
Gain and bandwidth 61
Gaussian beam 121
General Information 5
Germanium 131
Getting Started 6
GUI Overview
24
Guidelines for Operation 43
- HHelp 24
High ambient power level
115
-I34
117
Image Export
55
Installation of USB to RS232 Converter
Iris Diaphragm 86
-LLaserBeamAnalyser 109
Lens
75, 79
Lens diameter 76
Libraries
109
List of Acronyms
141
-M-
-DData Export
55
Direct Show Filter 109
Direct Show Filters (*.ax)
Ecological Background 140
Electrical connections
75, 79
Errors
115
Export a PDF Test Protocol 55
109
M2 Display
91
M2 Measurement
84, 96
M2 Setup 94
M2 Workspace 91
M2-Meter 74
82
143
144
Thorlabs Beam 4.0
M2-Meter Components
134
M2SET 74
Main Window
29
Maintenance and Repair 115
Manually moving the stage 84
MaxHold function 61
Measurement with the BC106 43
Mechanical Accessories
79
Mechanical Setup 75, 79
Media Control 24
Menu 24
Microsoft Excel File 55
Mirrors
86
Mode mixture beam 121
Mounting plate 9
Mounting the translation stage 79
- NNumerical Results
98, 107
-OOperating the Beam Profiler
Options
24
Ordering Codes
6
10
- PPerformance Optimization 43
Periscope assembly
79
Photodiode 131, 136
Pollux Coltroller 79
Position 136
Power too high 115
Power too low
115
Pre-aligned 74
Pre-Alignment of M2-Meter 86
Preparation 6
Program Start
22
Pulsed Laser Sources
61
- RRayleigh length 68, 121, 124
Reference Position 84
Requirements
10
Responce 131
Rotation mount
8
RS232 82
75
-TTarget Position 84
TEM00 121
Test Protocol 55
Times-diffraction-limit factor M2 121
Toolbar 24
Translation Stage 75, 79
Translation Stage Initialization 84
Translation stage length 68, 124
Troubleshooting 102, 117
- UUnpacking 6
USB Connection 21
USB Driver Installation 21
USB to RS232 Converter 75
USB to Serial converter 82, 84
-VVersion and other Informations
VT-80 79
115
-WWaist diameter 121
Warnings
115
Waste Treatment
140
Wavelength 121
WEEE 140
Windowless CCD sensor
Windows
24
116
-XX Profile Window
-SSafety
5
Save Measurement Results
Save Settings
42
Scan Rate 61
Scroll Bars
24
Selection of Focusing Lenses
Serial connection 84
Serial Interface 82
Silicon 131
Slit
136
Software Installation 11
Start the Application 22
Status Bar 24, 115
Symbols
141
Synchronization 61
33
-Y55
Y Profile Window
33
© 2011 Thorlabs