1
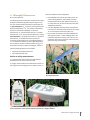
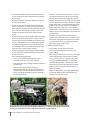
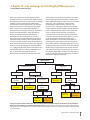
Chapter 13: Gas exchange and chlorophyll fluorescence Gemma Molero and Marta Lopes With recent advances in the development of field portable instruments, measurements of gas exchange and chlorophyll fluorescence have become increasingly valuable in precision phenotyping studies. Direct measurements of photosynthesis from gas exchange are performed with an infrared gas analyzer (IRGA) which measures the carbon dioxide flux within a sealed chamber containing a leaf sample. Chlorophyll fluorescence measurements, using a fluorometer, provide an indirect estimation of the different functional levels of photosynthesis: processes at the pigment level, primary light reactions, thylakoid electron transport reactions, dark-enzymatic stroma reactions and slow regulatory processes (Fracheboud, 2006). Both measurements are made at the single-leaf level for precision phenotyping of small populations (i.e., <100 genotypes) when other measurements are not sufficiently precise to detect genetic differences (e.g., to detect the initial stages of stress on photosynthetic metabolism) or are not informative. Photosynthesis measurements have been successfully used to demonstrate genetic diversity in performance and to explain physiological responses to environmental effects (e.g., light, temperature, carbon dioxide concentration, relative humidity, ozone etc.) and crop inputs (e.g., herbicides). However, gas exchange measurements in the field are laborious and expensive, require detailed expertise, and provide complex data of only a limited number of plants. In comparison, chlorophyll fluorescence measurements can be taken much more quickly (<30 seconds per plant vs. at least 2 minutes per plant), and the instrument itself is lighter and cheaper. It is therefore a good option for measuring most types of plant stress and monitoring plant health. However, chlorophyll fluorescence is not a straightforward protocol –leaves must be dark adapted, the fluorescence signal shows highly dynamic kinetics– and relationships with performance have not proven to be especially dependable. The decision matrix shown in Figure 13.1 will help select the appropriate technique/s for individual target environments. Target environment Yield potential Stressed environment Drought Heat Large and small population Large population Small population Light and dark fluorescence Light and dark fluorescence Resources available* Large population Small population Light and dark fluorescence Resources available* Low Low High Light and dark fluorescence Gas exchange and light and dark fluorescence Light and dark fluorescence High Gas exchange and light and dark fluorescence Figure 13.1. Decision matrix to select either both gas exchange and chlorophyll fluorescence measurements, or only chlorophyll fluorescence measurements, for individual target environments. Note that variation in dark fluorescence has been found only under very severe stress, and should therefore not be used under moderate drought or heat stress. *‘Resources available’ refers in particular to time and money. Photosynthesis and light interception 63 However, gas exchange and chlorophyll fluorescence are not typically used to screen large numbers of genotypes in breeding programs. Instead, breeders use quicker and cheaper proxy measurements correlated with photosynthetic performance, such as, in this volume: canopy temperature and stomatal conductance (correlated with photosynthetic rate; Chapters 1 and 2); carbon isotope discrimination (to integrate stomatal aperture over the lifetime of the crop; Chapter 6), vegetative indices (which correlate with the size of the photosynthetic canopy; Chapter 7); chlorophyll content (for photosynthetic potential; Chapter 9); senescence/ stay green (loss/maintenance photosynthetic capacity; Chapter 12); biomass (for cumulative photosynthetic activity over the lifetime of the crop; Chapter 15); and, water soluble carbohydrates (for the accumulation of photosynthates; Chapter 16). Site and environmental conditions Take measurements when the sky is clear and the leaves are well illuminated. Measurements can still be taken under cloudy skies (with self-illuminating instruments), and when there is wind; however, photosynthetic parameters require more time to attain stability. It is important that the plant surfaces are dry and not wet from dew, irrigation or rain. Time of day Take the majority of measurements as close to solar noon as possible; typically from 11:00h to 14:00h. For dark measurements (dark chlorophyll fluorescence and dark respiration), take measurements at night or during the day with adapted leaves (see details of how to adapt leaves below). Plant development stage Measurements can be taken at any developmental stage from mid seedling development to mid grain-filling, depending on the experimental objectives/timing of peak stress: • Early evaluation of a population: take simultaneous measurements for all genotypes of gas exchange and/ or chlorophyll fluorescence at the 3-4 leaf stage. • Maximum photosynthetic capacity in a yield potential trial: take measurements of gas exchange and/or chlorophyll fluorescence at anthesis +7 to 14 days. 64 Physiological Breeding II: A Field Guide to Wheat Phenotyping • Stress tolerance: i. Heat stress tolerance - take measurements of gas exchange and/or chlorophyll fluorescence at, or shortly after, peak temperature. ii. Drought stress tolerance - take measurements of chlorophyll fluorescence only during the period of stress (gas exchange measurements are not recommended due to stomatal closure). Number of samples per plot For chlorophyll fluorescence: take measurements from 3-5 leaves per plot. For gas exchange: take measurements from at least 2-4 leaves per plot. Procedure General advice on taking measurements Note that these instruments are very sensitive and time should be taken to read the user manual carefully. The following procedures describe taking measurements separately; however, many gas exchange photosynthesis systems allow simultaneous measurements of leaf gas exchange and chlorophyll fluorescence (e.g., LI-COR 6400-XT, GFS-3000, CIRAS-2 and LCpro-SD) which is recommended to avoid spatial variation within a leaf. For both measurements: select the youngest, fully expanded leaf (typically the flag leaf once emerged) receiving sunlight to the upper surface. The leaves must be clean, dry, green, with no sign of disease or damage, and should be selected from plants that are representative of the plot. Ensure to select leaves of similar age, life history, position and orientation as photosynthesis parameters are sensitive to light intensity and temperature variation. Handle the leaf as little as possible, and avoid shading the leaves during measurement. It is necessary to control for phenology in populations with diverse anthesis dates as plants under different stages of development present physiological differences in photosynthesis (due to the stage of leaf development, plant and leaf architecture (e.g., leaf angle) and sourcesink relationships) which may confound the analysis. This is especially important in environments where the temperature is linearly increasing (e.g., during the grain-filling phase). This can be corrected by splitting the population into early and late lines, and therefore making different populations to be screened. A range of up to 10 days in anthesis date is quite reasonable. A. Chlorophyll fluorescence measurements Recommendations for dark adaptation: • Dark adaptation of a wheat plant takes at least 20 minutes during daytime. Alternatively, pre-dawn The following procedure describes measurements using a measurements can be taken (before sunrise) for F0, Fluorpen FP 100 chlorophyll fluorometer (Figure 13.2). Fm values which can be used to calculate other dark (A) The most used chlorophyll fluorescence parameters for: adaptation parameters. (a) light adaptation: ФPSII (quantum yield of photosystem • Use dark adaptation leaf clips either provided with (PS) II photochemistry – i.e., the number of fluorescent instrument or self-made (using aluminum foil, Figure events for each photon absorbed); Fo’(minimal 13.3; or laminated carton and a paper clip). fluorescence); Fm’ (maximal fluorescence); Fv’ (variable • Do not allow illumination of the dark adapted leaf fluorescence); Fv’/Fm’ (PS II maximum efficiency); and, (b) during measurement – if dark adapting with a selfdark adaptation: Fo (minimal fluorescence); Fm (maximal made dark adaptation leaf clip, then ensure to use fluorescence); Fv (variable fluorescence) and Fv/Fm a blackout cloth covering the plant, instrument and (maximum quantum efficiency of PS II photochemistry – operator during measurement. (B) i.e., the maximum efficiency at which light absorbed by PS II is used for reduction of Plastoquinone-A (QA)). For more details see Lopes, Molero and Nogues, Volume 1. Take the following equipment to the field: • Hand-held chlorophyll fluorometer • Dark adaptation leaf clips Advice on taking measurements (C) It is important that both the light and dark adapted measurements are taken on the same leaf. It is highly recommended to use fluorometers which are able to generate saturating pulse over 4,000 μmol m-2 s-1. Figure 13.3. A self-made dark adaptation leaf clip using aluminum foil. (ii) (i) (A) (B) Figure 13.2. Hand held chlorophyll fluorometer Fluorpen FP-100: (A) showing (i) PAR sensor, and (ii) sample leaf in sensor chamber; (B) field measurements in daylight conditions. Photosynthesis and light interception 65 If required, pre-program the instrument with measurement parameters, protocol and settings according to the user manual (e.g., for light adapted protocol mode: set the intensity, duration, frequency and gain of the measuring, actinic, saturating and far-red lights). Use the ‘Settings’ sub-menu to set the light color, light intensity, number and frequency of measurements, date, time and sound mode. 3. Place the leaf into the sensor head at the mid-point of the leaf and ensure that the selected area of the leaf completely covers the aperture of the sensor. 4. Press ‘SET’ to run the light fluorescence measurement. 5. Remove the leaf from the sensor head, and place a dark adaptation leaf clip onto the leaf at this point. 6. Repeat light fluorescence measurements for 3-5 leaves per plot. 7. Allow leaves at least 20 minutes for dark adaptation. 8. After which time, return to the previously measured leaves. 9. Press ‘MENU’ and select ‘FT’ or ‘OJIP’ for dark measurements. 10. Carefully perform the dark fluorescence measurement, ensuring to avoid illumination of the dark-adapted leaf. Trial measurements Final measurements and completion 1. Hold the ‘SET’ key for 1 second to turn the fluorometer on, then allow the instrument to equilibrate with the ambient temperature for around 10 minutes. 2. Select the ‘MEASURE’ menu and press the ‘SET’ key once. Press ‘MENU’ to scroll down in the main menu, and press the ‘SET’ key to select the option. For light measurements select the ‘QY’, ‘NPQ’, ‘LC1’ or ‘LC2’ mode according to the measurements being performed. 11. After measuring the whole trial. Go to ‘RETURN’, press the ‘SET’ key. Press the ‘MENU’ key to scroll down and select ‘TURN OFF DEVICE’ by pressing the ‘SET’ key. 12. Saved data can be downloaded with the software supplied with the instrument. Data is typically downloaded as a ‘comma delimited’ text file and imported into MS Excel. • It is highly recommended to use an instrument which provides far red pre-illumination for dark adaptation measurements (for a rapid transfer of electrons to PS I allowing the rapid re-oxidation of PS II). • Ensure that the measuring light is not actinic (i.e., not light which stimulates photosynthesis). Preparations Ensure that batteries are fully charged, and there is sufficient memory to record measurements. 66 Physiological Breeding II: A Field Guide to Wheat Phenotyping B. Gas exchange measurements The following procedure describes the measurements using a LICOR LI-6400 XT gas exchange photosynthesis system (Figures 13.4 and 13.5). The most used gas exchange parameters are: Anet (net CO2 assimilation rate); Amax (light-saturated net CO2 assimilation rate); gs (stomatal conductance); Ci (intercellular CO2 concentration) and E (transpiration rate). • Take the following equipment to the field: • Gas exchange photosynthesis system • Battery (use a car battery for long periods of field measurements) Advice on taking measurements • It is important to perform all measurements with the same setting parameters, and as close as possible to the actual crop environmental conditions and the target environment: ○ Relative humidity: set value to 50–80%. ○ Temperature: set the block temperature to equal air temperature. To measure the leaf temperature, do not change the leaf temperature settings as this will become constant across your measurements. For A/Ci curves, 25°C is preferred for the calculation of Rubisco kinetics. ○ CO2 concentration: set value to 350-400 ppm. ○ Air flux: set to 400 μmol s-1. (i) (ii) • • • ○ Light: Conduct a light curve before beginning any gas exchange measurements to determine the saturation point. Wheat is usually grown under high radiation environments and shows saturating photosynthesis rate below 1500 μmol m-2 s-1. ○ Leaf fan: set to fast. ○ Stomata ratio: Set to 1 (if the stomatal ratio is unknown), or determine the actual stomata ratio (although this is time-consuming). It is strongly recommended to use a compressed CO2 cylinder to reduce any problems associated with slight fluctuations in the concentration of incoming CO2. Avoid condensation inside the cuvette or tubes as humidity can damage the instrument. It is strongly recommended to perform an A/PAR curve before beginning gas exchange measurements to determine the photosynthetic active radiation (PAR) intensity inside the chamber in order to obtain the saturating photosynthetic rate (Amax). For A/Ci curves it is important to consider leaks in the leaf chamber within the sensor head (for details on how to minimize the error generated by such leaks, see Long and Bernacchi, 2003; Flexas et al., 2007; Rodegheiro et al., 2007). Preparations • Ensure that batteries are fully charged. • Ensure that the chamber and sensor are free of dust, pollen etc., and that the seals and gaskets are well placed and not damaged. (iii) (i) (iv) (A) (i) (B) (v) (vi) Figure 13.4. Console of a portable photosynthesis system LICOR LI-6400XT, showing: (A) (i) CO2 cartridge holder and regulator; (ii) screen and keyboard; (iii) fluorometer chamber connection; and (iv) tubes and connectors to the sensor head; and (B) (v) H2O desiccant tube; and (vi) CO2 scrub tube. Photosynthesis and light interception 67 • Check the connections between the chamber and the console, making sure that these are all well connected with no leaks. • Check that the instruments have sufficient memory to save all measurements. • Ensure that the ‘drierite’ (water desiccant) and soda lime (CO2 absorbant ‘scrubber’) are fresh and reactive. These chemicals typically have color indicators to show their condition: drierite turns from blue to pink, and soda lime turns from white to lilac when no longer useful. • Remove the previous carbon dioxide cylinder and attach a new one. Check the status of the ‘O’ rings – replace with new ones if these are swollen. Be careful to never remove a full cylinder from the console as the gas will be released at high pressure which can be dangerous. It is advisable to allow the cylinder to discharge slowly, 2. and once empty it can be safely removed. 1. After turning the gas exchange photosynthesis system on, the instrument should be allowed to warm-up for around 20 minutes. Check the following parameters: ○ Pressure: set to 100 kPa (exact pressure varies according to altitude – check user manual). ○ Light: check that this is working and that the LEDs are not damaged. ○ Thermocouple: check that this working by touching the sensor with a finger. Then disconnect thermocouple to check that the leaf temperature is equal to the block temperature (TªLeaf = Tªblock), if not adjust accordingly. (vii) ○ Flow rate: increase this to the maximum, turn the CO2 and H2O desiccants to full bypass, and check that the flow rate does not change; then turn the CO2 and H2O desiccant to full scrub, and check again that the flow does not change. If the flow rate does change more than 1-2 units then check that the air mufflers in the chemical tubes are not blocked or broken. Now set the flow rate to zero and switch off the leaf fan. If the flow value at this stage is not close to zero, go to the calibration menu and re-zero the flow meter. ○ Check that there are no leaks: breathe near the chamber, CO2 and H2O desiccant, connection tubes and console. Check that CO2 values do not increase more than 2 ppm. If so, try to localize the leak by breathing through a plastic straw. Calibrate the IRGA to zero: ○ The chamber must be empty and closed. ○ Fresh CO2 and H2O desiccants must be in ‘full bypass’ setting. ○ Wait until the reference CO2 is close to 5 μmol mol-1, and the reference H2O is close to 0.3 mmol mol-1. ○ If CO2_R or CO2_S are >5, or H2O_R or H2O_S are >0.3, go to ‘CALIBRATION MENU’ > ‘ZERO IRGA’ and follow the instructions. Wait until the values are stable: first zero H2O and wait for 1 minute to stabilize, and then zero CO2 and again wait for 1 minute to stabilize. ○ Return to ‘MAIN MENU’, and select ‘MATCH IRGA’, so that both IRGAs (sample and reference) are calibrated with the same values. (viii) (x) (ix) (xi) (A) (B) Figure 13.5. Sensor head of a portable photosynthesis system LICOR LI-6400XT, showing: (A) (vii) leaf chlorophyll fluorometer (LCF; optional extra); (viii) PAR (photosyntheticallly active radiation) sensor; (ix) tubes and connectors to the console; (x) leaf within the sensor head; and (xi) chamber fan; and (B) in-field use. 68 Physiological Breeding II: A Field Guide to Wheat Phenotyping Trial measurements Data and calculations 3. Open a new file: in the ‘New Measurements’ mode, press ‘1’ and then ‘F1’ (Open LogFile). Enter the trial name and press ‘ENTER’. 4. Define parameters: PAR (photosynthetically active radiation), FLOW, CO2, TEMP, RH (relative humidity), according to the experiment. Remember, to turn drierite tube to full bypass and check for the corresponding humidity readings. Adjust the humidity to the desired value by adjusting the drierite screw (observe the humidity changes while adjusting). If working with a compressed CO2 cylinder, then keep the CO2 screw in the full scrub position. 5. Match IRGAs once the humidity has stabilized. 6. Place the leaf in the sensor head and adjust: it is important that the leaf covers the whole area of the chamber or cuvette. If this is not possible (e.g., small leaves, drought stress, etc.) it is necessary to measure the area of leaf enclosed in the chamber and make adjustments to calculated values. 7. Wait until the values are stable (usually around 2 minutes) and record the value (press ‘1’ and then ‘F1’), or activate the saturating flash (press ‘0’ and the ‘F3’ or ‘F4’) to obtain simultaneous chlorophyll fluorescence measurement (recommended) and record the values. 8. Repeat gas exchange measurements for 2-4 leaves per plot. 9. Once all measurements have been taken, close the file. Press ‘ESCAPE’ to return to the ‘New Measurements’ mode, then press ‘1’ and select ‘CLOSE_FILE’ (F3). For most measurements, calculations are given directly by the instruments. Typical values for the most used gas exchange and chlorophyll fluorescence parameters for wheat in irrigated or stressed environments are shown in Table 13.1. Final measurements and completion 10. With the chamber empty and closed and the system still on, turn the drierite screw to the full scrub position and increase the flow to maximum, then wait until the relative humidity falls below 10%. 11. Turn off the system. Leave the CO2 cylinder attached, so that any remaining CO2 is released slowly. Ensure that the screws of the chamber and desiccants are loose when the system is not in use to avoid damaging the chemical tubes. 12. Saved data can be downloaded with the software supplied with the instrument. Data is typically downloaded as a ‘comma delimited’ text file and imported into MS Excel. Table 13.1. Typical data for gas exchange and chlorophyll fluorescence measurements in irrigated and stressed environments. Gas exchange: Irrigated Anet gs Stressed 15-30 μmol m-2 s-1 5-20 μmol m-2 s-1 300-700 mmol m-2 s-1 <300 mmol m-2 s-1 Chlorophyll fluorescence: Irrigated Stressed Fv/Fm PSII Close to 0.83 0.4-0.5 <0.75 <0.4 NPQ* 0.5-3.5 >3.5 * Non-photochemical quenching (NPQ) estimates the non-photochemical quenching from Fm to Fm’. To monitor the apparent rate constant for heat loss from PSII. References Fracheboud, Y. (2006) Using chlorophyll fluorescence to study photosynthesis. Institute of Plant Sciences ETH, Universitatstrass, CH8092 Zurich. Long, SP. and Bernacchi, CJ. (2003) Gas exchange measurements, what can they tell us about the underlying limitations to photosynthesis? Procedures and sources of error. Techniques 54(392), 2393–2401. Flexas, J., Díaz-Espejo., A, Berry, JA., Cifre, J., Galmés, J., Kaldenhoff, R., Medrano, H. and Ribas-Carbó, M. (2007) Analysis of leakage in IRGA’s leaf chambers of open gas exchange systems: quantification and its effects in photosynthesis parameterization. Journal of Experimental Botany 58(6), 1533–1543. Rodeghiero, M., Niinemets, U. and Cescatti, A. (2007) Major diffusion leaks of clamp-on leaf cuvettes still unaccounted: how erroneous are the estimates of Farquhar et al. model parameters? Plant, Cell and Environment 30(8), 1006–1022. Useful references Evans, JR. and Santiago, L. (CSIRO Publishing) A guide to measuring gas exchange and performing A/PAR and A/Ci curves with the LI-COR 6400. Available at: http://prometheuswiki.publish.csiro.au/ (accessed 30 August 2011). Sharkey, TD., Bernacchi, CJ., Farquhar, GD. and Singsaas, EL. (2007) In Practice: Fitting photosynthetic carbon dioxide response curves for C3 leaves. Plant, Cell and Environment 30(9), 1035–1040. Maxwell, K. and Johnson, GN. (2000) Chlorophyll fluorescence – a practical guide. Journal of Experimental Botany 51(345), 659–668. Photosynthesis and light interception 69 Troubleshooting Problem Chlorophyll fluorometer Solution Variable Fv’/Fm’ Make sure that the sample leaves are equally exposed to the light, and remember to measure the part of the leaf that is exposed to the light. Check that the saturating flash of light is sufficiently intense. Some instruments have very soft saturating flashes which do not permit good light measurements. Check that the fibre optics are working properly. Check that your PAR sensor is measuring correctly. If PAR readings are not correct, then there is no way to ensure that light fluorescence measurements are being performed at the same light intensity. Variable Fv/Fm Leaves were not completely dark adapted. Leaves should be in complete darkness for at least 20 minutes. If dark adapting with a self-made dark adaptation leaf clip, then ensure to use a blackout cloth covering the plant, instrument and operator when removing the clip to measure the leaf. Leaves are damaged and/or were handled excessively before measurements were taken. Infrared gas analyzer The equipment is making a ‘beep’ sound. Check the batteries. Flow values are not stable. Air mufflers in the chemical tubes are clogged or broken. Change or clean the tubes. Breathing into the chamber or console, causes the CO2 to increase more than 2 ppm. There is a leak - breathe through a plastic straw near the chamber, CO2 and H2O desiccant, connection tubes, and console to localize the leak. Values are not stable. Check for leaks. Is the IRGA warmed-up and ready? Wait for 20 minutes and check again. Anomalous values of photosynthesis. The instrument may not be calibrated correctly. Repeat the calibration process to zero and match the IRGAs. CO2 is not stable. Use a compressed CO2 cylinder. PAR is lower than defined. Check the LEDs are working, and that none are broken. gs values are not stable. Check that the sensor is working - touch it with a finger, if the leaf temperature does not change, then replace the sensor. The ambient humidity is too low and the relative humdity needs to be set to >50% when the drierite is in full bypass. Add 10 mL of water to the soda lime and wait 30 minutes for the H2O_S and H2O_R to become stable. CO2 of the reference and sample is too low. Change the compressed CO2 cylinder. 70 Physiological Breeding II: A Field Guide to Wheat Phenotyping