1
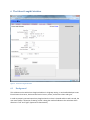
Peak Discharge The runoff, Q, at the site, in ft3/s or m3/s Viewing the report will show the intermediate variables Q (runoff depth) and S (potential retention) 5.4
InformationPanel
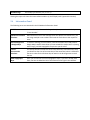
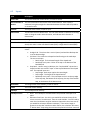
The following items are contained in the SCS Method Information Panel: CN Table A table of curve numbers and soil type descriptions, to assist with the input “Curve Number.” Hybrid Curve Number When different areas of the drainage basin have different characteristics, you Calculator can assign multiple curve numbers and scale the final value to the respective areas. View Drainage Area in Google Maps To assist in choosing a curve number, CulvertPro contains this handy feature. Google Maps’ satellite view shows you how wooded or treed a basin is (among other things), and the topographic map shows you the relief. Time of Concentration Calculator This handy calculator utilizes the three most commonly used methods to help you determine the time of concentration of the watershed, which is defined as the time it takes for the furthest drop of water in the drainage area to reach the site. USGS Topographic Maps Since you will want to see some topographic maps, if you don’t already have them, we have included the link to the American ones right in the software.