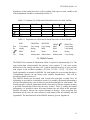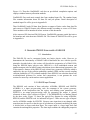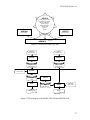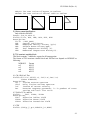
1
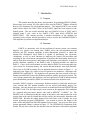
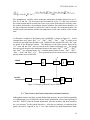
PU/NE-00-20 (Rev. 4)
DRAFT
11/01/04
GenPMAXS
Code for Generating the PARCS
Cross Section Interface File PMAXS
T. Downar
Y. Xu
Purdue University
School of Nuclear Engineering
November, 2004
i
PU/NE-00-20 (Rev. 4)
ABSTRACT
The Purdue Macroscopic cross section, XS (PMAXS) was developed in order to
provide an interface between lattice physics codes and the PARCS. PMAXS provides the
principal macroscopic cross sections, the microscopic cross sections of Xe/Sm, and the
group-wise form functions with several different branch states for the appropriate fuel
burnup states. The GenPMAXS program (Generation of the Purdue Macroscopic XS set)
was written specifically to generate the PMAXS file from other macroscopic cross
section libraries and the results of any lattice code, such as HELIOS, TRITON, and
CASMO. This manual describes the representation of the cross sections and major
methodologies employed in the PMAXS format, as well as input data for the
GenPMAXS code and the results of the some benchmark problems.
2
PU/NE-00-20 (Rev. 4)
TABLE OF CONTENTS
ABSTRACT........................................................................................................................ 2
LIST OF TABLES.............................................................................................................. 5
LIST OF FIGURES ............................................................................................................ 6
1. Introduction..................................................................................................................... 7
1.1. Purpose..................................................................................................................... 7
1.2. Overview.................................................................................................................. 7
2. Purdue Macroscopic Cross Section file, PMAXS .......................................................... 9
2.1. Cross Section Representation .................................................................................. 9
2.2. PMAXS Content .................................................................................................... 11
2.3. Procedures for generating cross section data in all branches................................. 12
2.3.1 Reference Branch............................................................................................. 12
2.3.2 Control Rod Branches...................................................................................... 12
2.3.3 Moderator Density Branches ........................................................................... 12
2.3.4 Soluble Boron Branches .................................................................................. 13
2.3.5 Fuel Temperature Branches ............................................................................. 13
2.3.6 Moderator Temperature Branches ................................................................... 13
2.4. Tree structure and linear interpolation between branches ..................................... 14
2.5. Tree structure and linear interpolation for history states ....................................... 16
3. Special treatments for cross sections in GenPMAXS................................................... 18
3.1. Scattering Cross Sections Treatment in the GENPMAXS Code........................... 18
3.2 Generation of Reflector Cross Sections.................................................................. 18
4. The GenPMAXS Code ................................................................................................. 24
4.1. Introduction to the GenPMAXS Code................................................................... 24
4.2. GenPMAXS Code Structure .................................................................................. 24
5. Generate PMAXS from results of HELIOS.................................................................. 25
5.1. Introduction............................................................................................................ 25
5.2. HELIOS Input Concept.......................................................................................... 25
5.3. Cross-section Definitions....................................................................................... 28
5.3.1. The Effective Xenon/Samarium Yield............................................................ 28
5.3.2. Delayed neutron data ..................................................................................... 29
5.3.3. Form Function for Pin Power Reconstruction ................................................ 30
5.4 The ZENITH Output Keywords for the GenPMAXS Code............................... 31
5.5. HELIOS-to-PMAXS Code Structure..................................................................... 33
6. Benchmark .................................................................................................................... 34
6.1. Benchmark 1: Generate PMAXS from HELIOS calculation ................................ 34
APPENDIX A PMAXS and XSEC Format...................................................................... 38
1) XS Control Information........................................................................................ 39
2) Branches information ........................................................................................... 39
3) Burnup information .............................................................................................. 40
4) XS Set identification............................................................................................. 40
5) History case identification .................................................................................... 41
6) T/H invariant variable block................................................................................. 41
7) State identification................................................................................................ 42
8) XS data block........................................................................................................ 42
Appendix B Input Manual of GenPMAXS....................................................................... 44
3
PU/NE-00-20 (Rev. 4)
1. Input Description .......................................................................................................... 44
1.1. JOB_TITLE ........................................................................................................... 44
1.2. JOB_OPTION........................................................................................................ 45
1.3. DAT_SRC.............................................................................................................. 46
1.4. HEL_FMT.............................................................................................................. 46
1.5. BRANCHES .......................................................................................................... 47
1.6. STATE ................................................................................................................... 47
1.7. SCT_FAC .............................................................................................................. 48
2. The Samples input of GenPMAXS code ...................................................................... 49
2.1. The Sample Input for HELIOS .............................................................................. 49
2.2. The Sample Input for convert raw cross section to partials................................... 49
2.3.The Sample Input for convert from old format to new format PMAXS ................ 49
2.4.The Sample Input for generate corner reflector cross section ................................ 50
4
PU/NE-00-20 (Rev. 4)
LIST OF TABLES
Table 2.1 Parametrics for Cross Section Dependence Study............................................ 10
Table 2.2. Variation (%) of Kinf and its Partial Derivative for Each Variable ................ 11
Table 2.3. Dependencies of Kinf and its Partial Derivative to Each Variable................. 11
Table 5.1. Recommended Decay Constants (/sec)............................................................ 29
Table 5.2. Delayed Neutron Yield Data............................................................................ 30
Table 5.3. Delayed Neutron Decay Constant (1/sec)........................................................ 30
Table 6.1. Reference and branches states ......................................................................... 34
5
PU/NE-00-20 (Rev. 4)
LIST OF FIGURES
Figure 1.1 Overview of PARCS package for core depletion analysis................................ 8
Figure 2.1 Example of Branch Cases in PMAXS............................................................. 14
Figure 2.2 Example of computing XS at point 1 .............................................................. 16
Figure 2.3 Multi-dimensional Linear Interpolation for History States ............................. 17
Figure 3.1. Reflector Models ........................................................................................... 19
Figure 4.1. Overall Flow in GenPMAXS ......................................................................... 24
Figure 5.1 Overview of HELIOS Code ............................................................................ 27
Figure 5.2 Flow Diagram of AURORA, HELIOS and ZENITH code............................. 27
Figure 5.3. Code structure of HELIOS-to-PMAXS.......................................................... 33
Figure 6.1. PARCS model for benchmark problems ........................................................ 34
Figure 6.2. BWR assembly in benchmark1 ...................................................................... 35
Figure 6.3. PARCS and HELIOS K-inf for BWR assembly in benchmark1 .................. 36
Figure 6.4. PARCS and HELIOS K-inf difference for BWR assembly in benchmark1 .. 37
6
PU/NE-00-20 (Rev. 4)
1. Introduction
1.1. Purpose
This manual describes the theory and procedure for generating PMAXS (Purdue
Macroscopic cross section, XS) files which can be used by PARCS1) (Purdue Advanced
Reactor Core Simulator) for core depletion analysis. The original PARCS cross section
model which utilizes the XSEC block in the PARCS input has been retained as the
default option. The new model described here uses PMAXS in lieu of XSEC and is
initiated using 2 new cards in the PARCS CNTL input block (TREEXS and
DEPLETION). This manual provides a detailed description of the methods for
generating cross sections and the procedures used to execute the GenPMAXS/PARCS
code sequence to perform core depletion analysis.
1.2. Overview
PARCS is a neutronics code for the prediction of nuclear reactor core transient
behavior at a specific core burnup state. PARCS solves the time-dependent neutron
diffusion and SP3 transport equations in three-dimensional geometry to obtain the
neutron flux distribution. Since PARCS is capable of performing core eigenvalue
calculations, as well as such functions as analyzing the control rod movement and
searching for the critical boron concentrations, it possesses the functionality necessary to
analyze both short term (kinetic) and longer term (depletion) core behavior. In order to
provide depletion capability to the PARCS code, a depletion module was added to
PARCS. A new cross section module was also added to PARCS to retrieving node-wise
cross section for its burunp history and current thermal-hydraulic state from PMAXS.
The overview of PARCS package for core depletion analysis is shown in figure 1.1. As
indicated in the Figure, two codes are used to perform core depletion: a depletion code
(DEPLETOR), and PARCS. The depletion code generates the cross-sections of the new
burnup state and PARCS solves the diffusion equations with the given cross sections. The
cross sections generated by the depletion code are transferred to PARCS and the neutron
power distribution generated by PARCS is transferred back to the depletion code.
Currently, PARCS employs a macroscopic depletion method in which the microscopic
cross sections and fuel number densities are not tracked individually during core
depletion. Only the macroscopic cross sections are transferred between DEPLETOR and
the PARCS code. The fuel macroscopic cross sections at the appropriate fuel conditions
are prepared using any lattice physics code such as HELIOS3), CASMO4), etc. The
PMAXS code is constructed using the output of the lattice code and provides the cross
section data in the specific format that can be read by the macroscopic depletion code
DEPLETOR. Because the output format of the each lattice code is unique, the cross
section processing program, GENPMAXS, was written to process the output of the
lattice codes and prepare the PMAXS formatted cross section. An overview of the cross
section generation scheme is shown in Figure 1.2. The GENPMAXS (Generation of the
Purdue XS set) code is therefore the interface between the lattice code and the depletion
7
PU/NE-00-20 (Rev. 4)
code. It processes the output of the lattice code and generates the PMAXS formatted files.
More detailed guidelines for execution the GENPMAXS/DEPLETOR/PARCS code
system are provided in Appendix E.
Lattice code
Output files
GenPMAX
PMAXS
T/H
Code
Node-wise
Power
DEPLETION
Module
PARCS
History for
each region
Cross Section
Module
TRACE
or
RELAP5
Neutronics
Calculation
Node-wise
Cross Section
T/H state
Figure 1.1 Overview of PARCS package for core depletion analysis
8
PU/NE-00-20 (Rev. 4)
2. Purdue Macroscopic Cross Section file, PMAXS
2.1. Cross Section Representation
PMAXS is structured in a macroscopic cross section format to be read by the
PARCS depletion routine. It has been developed for representation of the macroscopic
K
cross sections as a function of the state variables, such as the control rod poison ( α ),
moderator density (Dm), soluble boron concentration (Sb), fuel temperature (Tf),
moderator temperature (Tm), and burnup ( B ). Since the macroscopic cross sections are
strongly dependent on history effects, especially for the BWR, up to two history variables
(H1,H2) have also been introduced in the most recent version of the PMAXS format. The
two history variables can be any combination of control rod history (HCR), moderator
density history (HMD), Soluble Boron history (HSB), fuel temperature history (HTF) or
moderator density history. Two history variables together with the fuel burnup
K
determines the history state, H = ( B, H 1, H 2) . Because the absorption cross sections of
Xenon and Samarium are considerably larger than other isotopes and are strongly
dependent on the flux level of each node, the absorption cross sections of the Xenon and
Samarium are represented by their microscopic cross sections and number densities. The
typical representation form of the macroscopic cross section at a certain state is given by:
K
K
K
K
K
K
l
l
Σ l (α , Dm, SB, Tf , Tm, H ) = Σ E ,l (α , Dm, SB, Tf , Tm, H ) + N Xe
σ Xe
(α , Dm, SB, Tf , Tm, H )
K
K
l
l
+ N Sm
σ Sm
(α , Dm, SB, Tf , Tm, H )
(2.1)
where Σ E is the macroscopic cross section, which does not include Xenon, Samarium
The superscript l and the various subscripts denote the node index and isotope name
respectively. To make use of these macroscopic cross sections in the depletion code, they
must be determined systematically for each of the state variables.
The macroscopic cross sections of in PARCS are constructed with the assumption of
linear superposition of the partial cross sections on a base reference state. PMAXS
supports all information which is required in representing macroscopic cross-sections
using this approximation as:
K
K
K
∂Σ
K
K
Σ(α , Dm, Sb, Tf , Tm, H ) = Σ r ( H ) + ∑ α i ∆Σ i ( H ) + ∆Dm
K
∂Dm (α , Dm m , H )
i
+ ∆Sb
∂Σ
∂Σ
∂Σ
K
K + ∆ Tf
m K + ∆Tm
K
K
K
m
∂Sb (α , Dm, Sb , H )
∂Tm (α , Dm, Sb, Tf , Tm m , H )
∂ Tf (α , Dm, Sb, Tf , H )
(2.2)
where a reference cross section Σ r (first term on the right hand side) is modified with
contributions from the control rod insertion, ∆Σ i , moderator density, Dm, the boron
concentration, Sb, the fuel temperature, Tf, and the moderator temperature, Tm.
9
PU/NE-00-20 (Rev. 4)
For the control rod cross section contribution (second term on the right hand side), the
partial cross section is provided simply as a perturbation of the cross section α i ∆Σ i .
The weighting fraction, α , indicates the insertion fraction for each node and is provided
K
for each control rod type, i. In the equation above α is a vector with contents of each
α i , since there are multiple control types in some BWR models (e.g. Ringhalls). If the
α is flux weighted then the control rod effect is non-linear. If flux weighting is not
available or not used, then the control rod effect is linear. Most all standard codes used
in the industry (e.g. CASMO/SIMULATE) employ linear weighting [Reference:
Simulate User Manual, SOA-92/02, p. 2-33]
The contributions from the other independent variables (terms three, four, five, and six on
the right hand side) are determined using the product of a partial cross section, ∂ Σ ∂x ,
and the amount of the perturbation for each independent variable:
∆Dm = Dm − Dm r
∆Sb = Sb − Sb r
∆Tf = Tf − Tf r
∆Tm = Tm − Tm r
Dm m = ( Dm + Dm r ) / 2 = Dm r + ∆Dm / 2
Sb m = ( Sb + Sb r ) / 2 = Sb r + ∆Sb / 2
Tf m = (Tf + Tf r ) / 2 = Tf r + ∆Tf / 2
Tm m = (Tm + Tm r ) / 2 = Tm r + ∆Tm / 2
The superscript, m, denotes the midpoint of two data points in the pre-tabulated cross
section data. This provides a second order accurate estimate of the cross section. The
Partial cross sections are obtained by piecewise interpolation of the pre-tabulated data
using a “tree structure”, which will be discuss in detail later in the document.
The microscopic cross sections of Xenon and Samarium have same representation as Σ E
and in (2.2) and hereafter, Σ represents both Σ E and the microscopic cross sections of
Xenon and Samarium. The sequence of independent variables in equation 2.2 is fixed. It
was established based on study in which a pin cell model was analyzed with each
combination of the parameters shown in Table 2.1.
Table 2.1 Parametrics for Cross Section Dependence Study
Independent
Variable
Dm(g/cc)
Sb(ppm)
Tf ( K )
Tm(K)
Low value
Middle value
High value
0.1
0
0.5
1000
30
0.9
2000
40
450
600
25
300
The partial derivatives of the cell k-infinite with respect to each independent variable
were evaluated and the variations of the partial derivatives are shown in Table 2.2. The
10
PU/NE-00-20 (Rev. 4)
dependency of the partial derivatives of the k-infinite with respect to each variable to all
of the independent variables is summaried in Table 2.3.
Table 2.2. Variation (%) of Kinf and its Partial Derivative for Each Variable
Dm
Sb
Tf
Tm
Kinf
∂Kinf/∂Dm
∂Kinf/∂Sb
39.4
21.5
4.4
74
42
6
0.4
1
∂Kinf/∂Tm
70
27
8
∂Kinf/∂ Tf
24
24
8
148
127
70
2
2
196
Table 2.3. Dependencies of Kinf and its Partial Derivative to Each Variable
Dm
Sb
Tf
Tm
Kinf
∂Kinf/∂Dm
∂Kinf/∂Sb
Very strong
strong
Mild
Very strong
Strong
Weak
Very Strong
Mild
Weak
Weak
Almost none Almost none
∂Kinf/∂Tm
∂Kinf/∂ Tf
Mild
Mild
Weak
Very strong
Very strong
Strong
Almost none
Very Strong
2.2. PMAXS Content
The PMAXS file contains all information which is required to implement Eq.(2.2). The
cross section data, which includes the reference cross sections ( Σ r ), the cross section
differences for the control rod states ( ∆Σ i ), and the partial derivatives of cross sections
with respect to the feedback variables ( ∂Σ / ∂Dm , ∂Σ / ∂Sb , ∂Σ / ∂Tf , ∂Σ / ∂Tm ), are
listed sequentially as branches in PMAXS. For each branch, the cross section data have a
3-dimensional structure for the history state variables dependencies. This will be
described in detail in section 2.5.
The PMAXS format was developed with several basic principles in mind. First, all
information is provided in a hierarchical system. For example, the branch information is
provided first and then the cross sections are provided sequentially for each branch. The
second principle is that all information which is necessary to allocate computer memory
is provided first and then followed by the cross sections. Thus, by reading the branch
information, it is possible to know how many branch cases are stored in this particular
PMAXS file and to allocate the required amount of memory. After processing this
information for all cases, the cross sections for each branch of the fuel assembly are read
sequentially. The detail structure of the PMAXS format is given in Appendix A.
11
PU/NE-00-20 (Rev. 4)
2.3. Procedures for generating cross section data in all branches
This section will describe the methods used to treat the dependence of the instantaneous
variable dependents. The method for treating history variables is described in section 2.5.
The number or arrays in this section can be extended to 3 or more dimensions.
In the treatment of the control rods it is assumed that a rod is either fully withdrawn or
fully inserted in the fuel node. Flexibility is provided to treat different types of control
rods and control rods with heterogeneous compositions. The variable (Cr) is used to
represent the control rod states:
K
⎧0, if α = 0
Cr = ⎨
⎩i, if α i = 1
2.3.1 Reference Branch
r
The cross sections at the reference state ( Cr r , Dm r , Sb r , Tf , Tm r ) are directly stored in
the reference branch.
2.3.2 Control Rod Branches
r
The states with reference parameters ( Dm r , Sb r , Tf , Tm r ) but control rods inserted are
called control rod branches. The cross section differences between each control rod
branch and the reference branch are computed and stored.
r
r
∆Σ i = Σ(Cr = i, Dm r , Sb r , Tf , Tm r ) − Σ r ( Dm r , Sb r , Tf , Tm r )
(2.3)
The only instantaneous variable which control rod branches depend on is the control rod
state (Cr).
2.3.3 Moderator Density Branches
r
The states with reference parameters ( Sb r , Tf , Tm r ) but a Dm different from the
reference Dmr are called moderator density branches. The cross section partial
derivatives with respect to moderator density are evaluated using Eq. 2.4 and are stored.
r
r
Σ(Cr , Dm, Sb r , Tf , Tm r ) − Σ(Cr , Dm r , Sb r , Tf , Tm r )
∂Σ
=
∂Dm (Cr , Dm m )
∆Dm
(2.4)
The instantaneous variables which moderator density branches depend on are Cr and Dm.
The first term on the left hand side of Eq. 2.4 is the cross section at the current branch,
12
PU/NE-00-20 (Rev. 4)
the second term is the cross section from either the reference state or from the control rod
branches in which the control rod state is the same as that of the current state.
2.3.4 Soluble Boron Branches
r
The states with reference parameters ( Tf , Tm r ) but with Sb different from the
reference Sbr are called soluble boron branches. The cross sections partial derivative with
respect to soluble boron concentration are evaluated using Eq. 2.5 and are stored.
r
r
Σ(Cr , Dm, Sb, Tf , Tm r ) − Σ(Cr , Dm, Sb r , Tf , Tm r )
∂Σ
=
(2.5)
∂Dm (Cr , Dm, Sb m )
∆Sb
The instantaneous variables which the soluble boron branches depend on are Cr, Dm, and
Sb. The first term on the left hand side of Eq. 2.5 is the cross section at the current branch
and the second term is the cross section from either the reference state, the control rod
branch state, or the moderator density branch, at which the control rod state and the
moderator density are the same as those of the current state.
2.3.5 Fuel Temperature Branches
The states with reference parameters ( Tm r ) but with a
Tf different from the reference
r
Tf are called fuel temperature branches. The cross section partial derivatives with
respect to fuel temperature are evaluated using Eq. 2.6 and are stored.
r
Σ(Cr , Dm, Sb, Tf , Tm r ) − Σ(Cr , Dm, Sb, Tf , Tm r )
∂Σ
(2.6)
m =
∂ Tf (Cr , Dm, Sb, Tf )
∆ Tf
The instantaneous variables which fuel temperature branches depend on are Cr, Dm, Sb
and Tf. The first term on the left hand side of Eq. 2.6 is the cross section at the current
branch and the second term is the cross section from either the reference state, the control
rod branches, the moderator density branches, or the soluble boron branches at which the
control rod state, the moderator density, and the soluble boron concentration are the same
as those of the current state.
2.3.6 Moderator Temperature Branches
The states with a Tm different from the reference Tmr are called the moderator
temperature branches. The cross section partial derivatives with respect to the moderator
temperature are evaluated using Eq. 2.7 and are stored.
13
PU/NE-00-20 (Rev. 4)
Σ(Cr , Dm, Sb, Tf , Tm) − Σ(Cr , Dm, Sb, Tf , Tm r )
∂Σ
(2.7)
=
∂Tm (Cr , Dm, Sb, Tf , Tm m )
∆Tm
The instantaneous variables which moderator temperature branches depend on are Cr,
Dm, Sb, Tf and Tm. The first term on the left hand side of Eq. 2.7 is the cross section at
the current branch and the second term is the cross section from either the reference state,
the control rod branches, the moderator density branches, the soluble boron branches, or
the fuel temperature branches at which the control rod state, the moderator density, the
soluble boron concentration, and the fuel temperature are the same as those of the current
state.
An illustrative example of the branch cases in PMAXS is shown in Figure 2.1. In this
example there are 6 states “Ref”, “Cr1”, “Dm1”, “Dm2” , “Dm3” , “Dm4”, at which cross
sections are provided from the lattice code. In PMAXS, the original XS at the “Ref” state
are stored as the Reference branch. The difference of the cross sections between the
“Cr1” state and the “Ref” state are stored in the control rod branch case. The partial
derivatives with respect to the moderator density at the states “Dm1m”, “Dm2m” , “Dm3m”
and “Dm4m” are computed using Eq. 2.5 and the data from the 6 states “Dm1”, “Dm2” ,
“Dm3” , “Dm4” and “Ref”, “Cr1”. These partial derivates are then stored as 4 moderator
density branch cases in PMAXS.
Dm1
Dm4m
Cr1
Ref
Dm2m
unrodd
Dm3
Dm1m
rodded
Dm3m
α
Dm4
Dm2
ρ
Figure 2.1 Example of Branch Cases in PMAXS
2.4. Tree structure and linear interpolation between branches
Although the branch cases have a multi-dimensional structure, they are listed sequentially
as 1-dimensional cases in PMAXS with the branch information given at the beginning of
each file. PARCS reads the branch information, allocates memory, and then constructs
the “tree structure” for the partial derivatives. After the tree structure is constructed, the
partial derivatives required in Eq. 2.2 are then obtained by multi-dimensional linear
14
PU/NE-00-20 (Rev. 4)
interpolation in PARCS. Figure 2.2 illustrates the procedure for using Eq. 2.8 to compute
a cross section for a specified state. In the example, the cross section is computed for
r
point 1 at which (α , Dm, Sb r , Tf , Tm r ) .
r
Σ(α , Dm, Sb r , Tf , Tm r ) = Σ r + α∆Σ1 + ( Dm − Dm r )
∂Σ
(2.8)
∂Dm (α , Dm m )
The first term on the right hand side of Eq. 2.8, Σ r , is the cross section at the reference
state. The second term, α∆Σ1 , is the contribution from control rod insertion and is
depicted as point 2 in Figure 2.2. ∆Σ1 is computed as the difference between the ‘Ref’
state and the control rod insertion state, and is stored as a control rod branch. The third
term is the moderator density term, and is computed as the difference between point 1
∂Σ
. The partial derivative with respect to
and point 2, ( Dm − Dm r )
∂Dm (α , Dm m )
moderator density at point 3,
∂Σ
, is obtained by linear interpolation between
∂Dm (α , Dm m )
the partial derivatives with respect to moderator density at “Dm1m”, “Dm2m” , “Dm3m” ,
“Dm4m”, which are stored in 4 moderator density branches. The formula for computing
the partial derivative is given by Eq. 2.9:
∂Σ
∂Σ
∂Σ
= w1
+ w2
m
1m
∂Dm (α , Dm )
∂Dm (α = 0, Dm )
∂Dm (α = 0, Dm 2 m )
(2.9)
∂Σ
∂Σ
+ w3
+ w4
3m
∂Dm (α = 1, Dm )
∂Dm (α = 1, Dm 4 m )
where the weights for the four points are determined by linear interpolation:
w1 = (1 − α )
w3 = α
Dm − Dm 2
Dm1 − Dm 2
Dm − Dm
Dm3 − Dm 4
4
⎛
Dm − Dm 2 ⎞
⎟
w2 = (1 − α )⎜⎜1 −
1
2 ⎟
⎝ Dm − Dm ⎠
⎛
Dm − Dm 4 ⎞
⎟
w4 = α ⎜⎜1 −
3
4 ⎟
⎝ Dm − Dm ⎠
(2.10)
15
PU/NE-00-20 (Rev. 4)
1
Dm1
Cr1
3
Dm1m
unrodde
d
Dm4m
Dm3
Dm4
2
Ref
α
Dm2m
rodded
Dm3m
α
Dm2
ρ
Figure 2.2 Example of computing XS at point 1
Even though the derivatives are defined at the mid-point, the state variable values for the
mid-point are not used in the interpolation. Only the values of the original states are used,
and therefore only the values of original states are stored as branch information in
PMAXS. The other partial derivatives which are required in Eq.2.2 are obtained by
multi-dimensional linear interpolation using equations similar to Eq. 2.9 and 2.10.
It should be noted that the branches do not need to form a regular grid, and the points in
each linear interpolation do not need to be equidistant. This is why the method here is
referred to as a ‘tree’ structure instead of a table.
2.5. Tree structure and linear interpolation for history states
An example of the method used to compute the history dependence of the XS in PMAXS
is depicted in Figure 2.3. The locations of the history state point in PMAXS can be
irregular, and are stored in a tree structure. In the example shown in Figure 2.3, HCR and
HMD are taken as the first and second history variables. The fuel burnup is always the
last history variable in the tree structure of PMAXS. The points are cataloged into
branches based on the value of their first history variable. In the example here, there are
two HCR branches, HCR1=0, HCR2=1. The points in each branch are then cataloged
into sub-branches based on the values of their second history variable. As shown in
Figure 2.3, there are 3 sub-branches in the HCR1 branch, and 2 sub-branches in the
HCR2 branch. If there are two history variables other than burnup, then the tree structure
is 3-dimensional and each sub-branch contains a series of burnup points. Otherwise the
burnup will be stored as the second or first history variable and the interpolation schemes
will be much simpler.
16
PU/NE-00-20 (Rev. 4)
HCR
HMD5
8
10
HCR2=1
5
14
7
13
6
HMD4
15
HMD
HMD3
HMD2
HCR1=0
HMD1 1
12
3
4
9
11
2
Burnup
Figure 2.3 Multi-dimensional Linear Interpolation for History States
To obtain the cross section set at point 15 in the example shown in Figure 2.3, a classical
3-dimensional linear interpolation scheme is as follows:
1) The adjacent points 1~8 are computed.
2) Four linear interpolations with respect to burnup are performed to obtain cross sections
sets at points 11~14. For example, linear interpolation between 2 burnup points is given
as:
B −B
B − Bn
(2.11)
Σ( B ) = Σ( Bn ) n +1
+ Σ( Bn +1 )
Bn +1 − Bn
Bn +1 − Bn
where: Σ represents the node XS and the derivatives at the reference state
Bn , Bn +1 are assembly burnups of two cross section sets in PMAXS.
3) Two linear interpolations respect to the second history variable are performed to obtain
cross sections at point 9 and 10, similar to the procedure in Eq. (2).
4) One linear interpolation is performed to obtain the cross section set at point 15.
This interpolation process involves 7 linear one-dimensional linear interpolations, at a
cost of 14 multiplications for each element in the cross section set.
A more efficient interpolation scheme, which generates same results as previous classical
3-dimensional linear interpolation scheme, is implemented in PARCS as follows:
1) The adjacent points 1~8 are computed.
17
PU/NE-00-20 (Rev. 4)
2) Determine linear combination weights for points 1~8.
3) Compute each type of cross section by combining cross section from points 1~8
linearly.
By this scheme, cross section at point 9~14 are not explicitly computed, hence the
computation cost and memory are saved.
3. Special treatments for cross sections in GenPMAXS
3.1. Scattering Cross Sections Treatment in the GENPMAXS Code
Most diffusion codes for analyzing light water reactors do not consider up-scattering
because its effect may be negligible in the standard two group energy group solution.
However, it is inaccurate to neglect upscattering in multi-group calculations and in most
multigroup applications upscattering data is provided. However, in some cases the user
may choose to treat upscattering implicitly for the multigroup calculation and that option
is provided in GENPMAXS. Using the concept of conservation of neutron spectra, the
down-scattering cross-sections can be modified to treat the up-scattering effect implicitly.
In the GenPMAXS code, the down-scattering cross-sections can be corrected by using
the P0-scattering cross section and flux data:
Σ 's , g ← g ' = Σ 's , g ← g ' − Σ s , g '← g
φg
, for g ' < g ,
φg '
(3.1)
Where φg , φg ' are the spectra flux either provided by lattice code or obtain from infinite
spectra computed in GenPMAXS.
3.2 Generation of Reflector Cross Sections
In order to conserve the neutron reaction rate at the interface between the core and
reflectors, it is necessary to provide both the effective macroscopic cross sections of the
homogeneous reflector and the assembly discontinuity factors (ADF). Codes such as
CASMO-3, MASTER, ANS, etc., obtain the effective homogenized reflector cross
sections including ADF by solving the one-dimensional spectral geometry problems as
shown in Figure 3.1.
18
PU/NE-00-20 (Rev. 4)
Side
Corner
(a) Actual core geometry
reflective
(b)Heterogeneous Model
Φ (∞)=0
J(0)=Jhet
Vacuum
Reflective
reflective
(c) 1-D Homogeneous Model
Figure 3.1. Reflector Models
19
PU/NE-00-20 (Rev. 4)
The effective homogeneous cross-sections are generated using the 1-D heterogeneous
model of the reflector. However, because the surface averaged fluxes of the
homogeneous reflector are not explicitly provided in most lattice calculation, an alternate
method is used to determine the assembly discontinuity factors. The surface averaged
fluxes of the homogeneous reflector are determined by solving the 1-D diffusion
equations in the homogeneous reflector region. In the homogeneous reflector, the multigroup diffusion equations are given by;
∂ 2Φ
= D −1M Φ
2
∂x
(3.2)
⎡ Σ r1
⎡ φ1 ⎤
⎢ −Σ
⎢φ ⎥
2⎥
2 <−1
⎢
, M =⎢
where Φ =
⎢ #
⎢#⎥
⎢
⎢ ⎥
⎢⎣ −Σ g <−1
⎢⎣φ g ⎥⎦
−Σ1<−2
Σr 2
#
−Σ g <−2
" −Σ1<− g ⎤
" −Σ 2<− g ⎥⎥
, D = diag ( D1 , D2 ...Dg )
%
# ⎥
⎥
"
Σ rg ⎥⎦
g
Σ ri = Σ ai − Σi <− i + ∑ Σ j <− i
j =1
⎡ D1−1Σ r1
⎢ −1
−D Σ
−1
A = D M = ⎢ 2 2<−1
⎢
#
⎢ −1
⎢⎣ − Dg Σ g <−1
Assume the matrix A
V such that:
⎡λ1 0
⎢0 λ
2
−1
V AV = Λ = ⎢
⎢# #
⎢
⎣⎢ 0 0
− D1−1Σ1<−2
D2−1Σ r 2
#
−1
− Dg Σ g <−2
" − D1−1Σ1<− g ⎤
⎥
" − D2−1Σ 2<− g ⎥
⎥
%
#
⎥
"
Dg−1Σ rg ⎥⎦
is positive definite and diagonalizable, then exist invertible matrix
" 0⎤
⎡ B1
⎢
⎥
" 0⎥
0
2
=B =⎢
⎢#
% #⎥
⎢
⎥
" λg ⎥⎦
⎢⎣ 0
0
B2
#
0
" 0⎤
⎥
" 0⎥
% # ⎥
⎥
" Bg ⎥⎦
where Bi = λi
Then
(3.3)
∂ 2V −1Φ
= V −1 AVV −1Φ = ΛV −1Φ
2
∂x
Differential equation (3.7) has the analytic solution:
V −1Φ = e− Bx C + e Bx F
C , F will be determined by boundary conditions.
2
(3.4)
(3.5)
(3.6)
(3.7)
20
PU/NE-00-20 (Rev. 4)
Incorporate with the right boundary condition:
Φ (∞ ) = 0
We get
And
F =0
Φ = Ve− Bx C
Incorporate with the left boundary condition:
∂Φ
J (0) = − D
= DVBe− B×0C = ( DVB)C
∂x
−1
C = ( DVB ) J (0)
Finally, we obtain the analytic solution
Φ ( x) = Ve − Bx ( DVB) −1 J (0)
And the homogenous flux at left surface
Φ (0) = V ( DVB) −1 J (0)
(3.8)
(3.9)
(3.10)
(3.11)
(3.12)
(3.13)
(3.14)
Therefore, the assembly discontinuity factors of the reflector can be given as:
φ Het (0)
ADFk = k
, k = 1,2,...g .
(3.15)
φ k (0)
As there is no fission in reflector, the matrix A is in block lower triangle form:
⎡ A1,1
⎢A
2,1
A=⎢
⎢ #
⎢
⎣⎢ An ,1
0
A2,2
#
An ,2
0 ⎤
" 0 ⎥⎥
% # ⎥
⎥
" An ,n ⎦⎥
"
(3.16)
where Ai,i is square matrix with order li. An efficient algorithm can be used for this
problem which avoids computing all eigenvectors of matrix A.
From now on, all vectors and matrices are presented in block form. Such as:
Φ = [φ1 , φ2 ,..., φn ] , where φi is vector with length li.
Assume the matrix A is positive definite and diagonalizable, then there exists invertible
matrices Vi, i=1,n, such that:
Vi −1 Ai ,iVi = Λ i = Bi2
(3.17)
where Bi, i=1,n, are positive definite diagonal matrice.
21
PU/NE-00-20 (Rev. 4)
Considering the right boundary condition, Φ (∞) = 0 , the analytic solution can be express
as:
k
φk = ∑ Fk ,iVi e − B x Ci
(3.18)
i
i =1
where Fi,i is identical matrix with order li.
Substitute (3.18) into (3.2)
∑(
k
i =1
∑(
k
j =1
k
k
i
⎛
⎞
−B x
Fk ,iVi Bi2 e − Bi xC = ∑ Fk ,i Ai ,iVi e− Bi x Ci = ∑ ⎜ Ak ,i ∑ Fi , jV j e j C j ⎟
i
i =1
i =1 ⎝
j =1
⎠
k −1
i
k −1
⎛
⎞
⎛ k −1
⎞
( Fk , j Aj , j − Ak ,k Fk , j )V j e− B j xC j = ∑ ⎜ Ak ,i ∑ Fi, jV j e− B j xC j ⎟ = ∑ ⎜ ∑ ( Ak ,i Fi, j )V j e− B j xC j ⎟
i =1 ⎝
j =1
⎠ j =1 ⎝ i = j
⎠
)
(
(
)
)
(
)
)
For 1 ≤ j < k :
k −1
Fk , j Aj , j − Ak , k Fk , j = ∑ Ak ,i Fi , j
(3.19)
i= j
Elements of matrix Fk , j can be solved from (3.19) which is a system of lk× lj linear
equations.
Incorporate with the left boundary condition:
k
∂φ
Dk −1 J k (0) = − k = ∑ Fk ,iVi Bi Ci
∂x i =1
k −1
⎛
⎞
Ck = (Vk Bk ) −1 ⎜ Dk −1 J k (0) − ∑ Fk ,iVi Bi Ci ⎟
i =1
⎝
⎠
(3.20)
(3.21)
All of coefficients in flux solution (3.18) can be computed sequentially. With this method,
instead of the eigenvectors of matrix A, the eigenvectors of Diagonal blocks are needed.
The eigenvectors of diagonal blocks which is normally lower order are much easy to be
computed.
If there is no up-scattering, matrix A becomes a lower triangle matrix. All blocks have
size of 1×1, the algorithm becomes even simpler:
k
φk = ∑ Fk ,i e− B x
(3.22)
Bk = Ak ,k
(3.23)
⎛ J (0) k −1
⎞
− ∑ Bi Fk ,i ⎟
Fk ,k = ( Bk ) −1 ⎜ k
i =1
⎝ Dk
⎠
(2.24)
i
i =1
Fk , j = ( Aj , j − Ak ,k )
−1
k −1
∑A
i= j
k ,i
Fi , j
(2.25)
22
PU/NE-00-20 (Rev. 4)
Typically, four types of reflector cross sections are required for three dimensional core
calculations: top, bottom, side and corner. The structures of the top and bottom reflectors
can be different and they may have different cross sections. However, the cross sections
for the axial reflector can usually be used for the top reflector since there is typically a
small difference in the respective cross sections which will have little influence on the
neutronics behavior in the axial reflector region. The 1-D reflector model shown in
Figure 3.1 is generally adequate to generate the cross sections for side reflectors.
However, it is cumbersome to solve the 2-D homogeneous diffusion equation for the
corner reflector region and it has been shown that the corner reflector cross section can be
well represented by correcting the scattering cross sections. Therefore, the corner
reflector cross section is easily obtained by modifying the scattering cross section with a
correction factor5);
r2 D =
PFA − d
,
PFA
(3.26)
where PFA , and d denote the fuel assembly pitch and shroud thickness, respectively.
23
PU/NE-00-20 (Rev. 4)
4. The GenPMAXS Code
4.1. Introduction to the GenPMAXS Code
GenPMAXS (Generation of the Purdue XS set) is the interface between lattice codes and
PARCS, which generates the macroscopic cross section file, PMAXS. It reads other
macroscopic cross section libraries and the results of any lattice code, such as HELIOS,
TRITON, and CASMO, and produces the macroscopic cross section file in the PMAXS
format. GenPMAXS was written in FORTRAN 90 and Figure 4.1 shows the overall flow
of GenPMAXS.
Read Input:
Read control
from standard
data
input
Read XS data from libraries
or Output of lattice codes
from data file and convert
to PMAXS format
read_pmaxs_file
HELIOS_to_PMAXS
CASMO_to_PMAXS
WIMS_to_PMAXS
Derivational XS
calculate the
partial
Write_pmaxs_file
Figure 4.1. Overall Flow in GenPMAXS
4.2. GenPMAXS Code Structure
Because GenPMAXS was written in FORTRAN 90, memory can be allocated or deallocated in any of its subroutines without restriction using the modularity concept of
FORTRAN 90. There are two modules for data structure in the code: xsblock_data and
pmaxs_data modules, which define the data structure consistent with PMAXS format and
provides the memory allocation which is performed after reading the proper inputs (see
24
PU/NE-00-20 (Rev. 4)
Figure 4.1). Therefore GenPMAXS code has no pre-defined compilation options and
employs standard memory allocation methods.
GenPMAXS first reads main control data from standard input file. The standard input
files contains information about XS data file and job options. Detail description of
standard input file will be given in Appendix B.
Then GenPMAXS reads XS data from libraries or output of lattice codes from data file
and convert to PMAXS format with different module according to source of XS data.
These modules will be introduced in later sections of this document.
After converted XS data into PMAXS format, GenPMAXS generates partial derivatives
for branches and write them into PMAXS file. The format of PMAXS file will be given
in Appendix A.
5. Generate PMAXS from results of HELIOS
5.1. Introduction
The PMAXS file can be constructed using any lattice physics codes. However, to
demonstrate the functionality of PMAXS and to familiarize the user with the specific
principles described above, this section will describe the preparation of a PMAXS file
using the HELIOS lattice physics code. HELIOS is a well established neutron and
gamma transport code for lattice burnup calculations in two-dimensional geometries. One
of the attractive features of the HELIOS code is that it has a geometric flexibility which is
enabled by the use of the collision probability method (CPM) and the current coupling
collision probability (CCCP) solution methods. Since HELIOS can calculate almost any
two-dimensional geometry for various fuel compositions, it can generate the cross
sections for most any current nuclear reactor application.
5.2. HELIOS Input Concept
The HELIOS code consists of three sub-codes: AURORA, HELIOS, and ZENITH.
AURORA is a input pre-processing code for treatment of the system geometry,
assignment of the composition into the region, and defining some parameters, etc.
ZENITH is an output post-processing code for generating the output. A general
schematic of these codes is shown in Figure 3.1. The HERMES file is a database shared
by the three codes. Figure 3.2 shows the typical flow diagram for using AURORA,
HELIOS, and the ZENITH code. As indicated in Figure 3.2 there are two types of inputs:
one for AURORA another for ZENITH. Because some input data is not changed while
some data may be specific to the the type of calculations or geometric modeling, the input
is divided into an expert and short input. The expert input is a large input deck and
contains the unchangeable properties. The short input contains the changeable properties
25
PU/NE-00-20 (Rev. 4)
such as the fuel loading pattern, the fuel enrichment, fuel geometry data, etc. Therefore, if
the expert input is constructed for a particular fuel assembly type, then various
calculations are possible by just changing the short input. Appendix C describes the
sample inputs for the typical 17x17 PWR fuel assembly and 8x8 BWR fuel assembly,
respectively. In Figure 3.2, there is an additional code, ORION, which is an input
checking tool which draws the lattice shape from the AURORA input.
26
PU/NE-00-20 (Rev. 4)
HELIOS
general property overlays
subgroup resona method
general 2D geometry
current coupling
collision probabilities
free branching
depletion
gammas
AURORA
ZENITH
input processor
output processor
HERMES
- data base
Figure 5.1 Overview of HELIOS Code
AURORA
Short Input
AURORA
Expert Input
ZENITH
Expert Input
AURORA
AURORA
AURORA Sets
(Hermes file)
ZENITH Sets
(Hermes file)
AURORA
Update AURORA
Sets
HELIOS
ORION
HELIOS output
(Hermes file)
Figures
(Postscript file)
ZENITH
AURORA
Short Input
Output
Output
Output
Figure 5.2 Flow Diagram of AURORA, HELIOS and ZENITH code
27
PU/NE-00-20 (Rev. 4)
5.3. Cross-section Definitions
The definitions of the principal cross sections used in HELIOS3) are consistent with
industry standards. However, some data are not generated by the default output
procedures of HELIOS, such as the effective Xenon/Samarium yield, the effective
delayed neutron decay constant, the group-wise form functions, etc. This section provides
the definitions of these specific data.
5.3.1. The Effective Xenon/Samarium Yield
Because the absorption cross sections of Xenon and Samarium are represented by their
microscopic cross sections and number densities, the fission yields of Xenon and
Samarium are important to accurately model the absorption due to Xenon and Samarium.
In the typical PWR case, Xenon and Samarium reach an equilibrium state very quickly
and the effective fission yield of Xenon and Samarium can be calculated from the
equilibrium number densities. In the equilibrium steady state, the number density of the
Iodine, Xenon, Promethium and Samarium of a node are given by
γ IΣ fφ
,
λI
(γ I + γ Xe )Σ f φ
,
N Xe =
λ Xe + σ Xe,aφ
γ Pm Σ f φ
N Pm =
,
λPm
γ Pm Σ f
λ N
,
N Sm = Pm Pm =
σ Sm,aφ
σ Sm ,a
NI =
(5.1)
(5.2)
(5.3)
(5.4)
where
Σ f = node average macroscopic fission cross section ,
φ = node average flux,
γ = effective fission yield,
λ = decay constant (/sec),
N = node average number density (/cm3).
After the node average number densities, macroscopic fission cross sections, and flux at
the equilibrium state are obtained using the lattice code, the effective yield data can be
generated as follows:
γI =
λI N I
,
Σ fφ
(5.5)
28
PU/NE-00-20 (Rev. 4)
(
)−γ
N Xe λ Xe + σ Xe,aφ
γ Xe =
Σ fφ
I
,
(5.6)
N Smσ Sm.a
.
Σf
γ Pm =
(5.7)
To insure consistency with the PARCS code, it is recommended that Table 3.1 values are
used as the decay constants of Eqs. (5.5) ~ (5.7).
Table 5.1. Recommended Decay Constants (/sec)
Isotope
Xe-135
I-135
Pm-149
decay constant
2.09167E-05
2.89500E-05
3.55568E-06
5.3.2. Delayed neutron data
Because HELIOS code does not calculate the adjoint fluxes, the effective delayed
neutron fraction in HELIOS for delayed neutron group d is given by
β eff ,d
∑ β υΣ φ V
,
∑ υΣ φ V
g ,d
kx
=
k
fg
g
g
fg
(5.8)
g
g
where
k=
∑ υΣ
fg
φg
g
∑ (Σ
ag
+ DB 2 )φ g
,
(5.9)
g
β g ,d =
∑ ∑∑ β
r
g '∈g i
N i ,r (υσ ) fg φ grVr
i ,r
i ,d
∑ ∑∑ N i,r (υσ ) fg φ grVr
i ,r
.
(5.10)
g '∈g i
r
In Eqs. (5,8) ~ (5.10), the r, i, and g denote the region, isotope and neutron group,
respectively, and k x is the same as Eq. (5.9), except that the summation over g is for the
groups below about 0.45MeV. The decay constants of the delayed neutrons are calculated
using the following equations:
λd =
∑β
i
i
d
N iσ if
β di N iσ if
∑i λ i
d
,
(5.11)
29
PU/NE-00-20 (Rev. 4)
where
β di = d group delayed neutron yield fraction from isotope i,
λid = decay constant of d group delayed neutron from isotope i.
Values of λid , y i , and adi can be taken from a textbook or a topical report and typical
values are given in Table 5.2 and 5.3.
Table 5.2. Delayed Neutron Yield Data
isotope
Th232
U233
U235
U238
Pu239
Pu240
Pu241
Pu242
β1i
β 2i
β 3i
β 4i
β 5i
β 6i
7.43E-04
2.55E-04
2.40E-04
2.13E-04
8.15E-05
9.20E-05
9.92E-05
1.20E-04
2.57E-03
6.80E-04
1.24E-03
1.72E-03
5.31E-04
7.28E-04
1.23E-03
1.42E-03
3.06E-03
5.28E-04
1.18E-03
2.00E-03
4.02E-04
4.34E-04
7.84E-04
7.70E-04
8.99E-03
1.04E-03
2.65E-03
5.88E-03
7.34E-04
9.49E-04
1.92E-03
2.00E-03
3.39E-03
3.39E-04
1.09E-03
3.88E-03
3.82E-04
5.16E-04
1.09E-03
1.38E-03
1.65E-03
1.21E-04
4.56E-04
1.57E-03
1.16E-04
1.57E-04
3.75E-04
4.39E-04
Table 5.3. Delayed Neutron Decay Constant (1/sec)
Isotope
Th232
U233
U235
U238
Pu239
Pu240
Pu241
Pu242
λ1i
1.31E-02
1.29E-02
1.33E-02
1.36E-02
1.33E-02
1.33E-02
1.36E-02
1.36E-02
λi2
3.50E-02
3.47E-02
3.27E-02
3.13E-02
3.09E-02
3.05E-02
3.00E-02
3.02E-02
λi3
1.27E-01
1.19E-01
1.21E-01
1.23E-01
1.13E-01
1.15E-01
1.17E-01
1.15E-01
λi4
3.29E-01
2.86E-01
3.03E-01
3.24E-01
2.93E-01
2.97E-01
3.07E-01
3.04E-01
λi5
9.10E-01
7.88E-01
8.49E-01
9.06E-01
8.57E-01
8.48E-01
8.70E-01
8.27E-01
λi6
2.8203E+0
2.4417E+0
2.8530E+0
3.0487E+0
2.7297E+0
2.8796E+0
3.0028E+0
3.1372E+0
5.3.3. Form Function for Pin Power Reconstruction
The purpose of the form functions is to generate the local pin power distribution and to
treat the local heterogeneous flux distribution in the fuel assembly. Two types of form
functions are required to provide the heterogeneous power and the group-wise flux
distributions in the fuel assembly. The power form function is defined by the normalized
power distribution in the fuel assembly, and the group-wise flux form function is defined
group-wise as:
30
PU/NE-00-20 (Rev. 4)
f g ( x, y ) =
κΣ fg ( x, y )φ g ( x, y )
,
κΣ fg φ g
(5.13)
where
κΣ fg = g-th group, assembly averaged fission yield energy,
φ g = g-th group, assembly averaged fluxes ,
κΣ fg (x, y) = g-th group, cell averaged fission yield energy at the position (x,y),
φ g ( x, y ) = g-th group, cell averaged fluxe at position (x,y),
(x,y) = the center of fuel cell.
5.4 The ZENITH Output Keywords for the GenPMAXS Code
In order to insure the consistency of HELIOS output with PMAXS, GENPMAXS
requires several keywords from ZENITH in order to interpret the HELIOS output. These
are shown in Table 5.4. The GENPMAXS code provides two output files: the PMAXS
formatted file and an execution summary for GENPMAXS (See the GENPMAXS input
description in Appendix B).
Guidelines for the overall execution of the
HELIOS/GENPMAXS/DEPLETOR/PARCS code system are provided in Appendix E.
Table 5.4. The ZENITH Output Keywords for the GENPMAXS Code.
Keyword
%FILE_CONT 1
%FILE_CONT 2
%STAT_**** #
Purpose
File control flag. It contains number of neutron groups, number
of fuel pins, etc.
File control flag. It contains the minimum energy bound of each
neutron group.
Branch state flag. **** will have BRBS, BRSB, BRTM, BRTF,
BTMD, BRCR. And # denotes the sequential number of the same
branch state.
BRBS = reference state.
BRSB = soluble boron branch case.
BRTM = moderator temperature branch case.
BRTF = fuel temperature branch case.
BTMD = moderatore density branch case.
BRCR = control rod branch case.
31
PU/NE-00-20 (Rev. 4)
Principle cross section flag. **** will have KINF, VEL, CHI,
STR, SNG, SFI, SKF, SNF, SNU, SDF.
KINF = infinit multiplication factor.
VEL = group wise neutron velocity.
CHI = fission spectrum.
STR = transport cross section.
%XS_PRIN %****
SAB = absorption cross section.
SFI = fission cross section.
SKF = kappa-fission cross section.
SNF = nu-fission cross section.
SNU = prompt neutron yield per fission.
SDF = discontinuity factor.
%XS_SCT %SCT 1 Scattering cross section flag. Up-scattering is ignored.
Xe/Sm cross section flag. *** will have YLDXE, YLDID,
YLDPM, XENG, SMNG, XEND, SMND.
YLDXE = effective yield of Xe-135.
YLDID = effective yield of I-135.
%XS_XESM
YLDPM = effective yield of Pm-149.
%****
XENG = microscopic absorption Xs of Xe.
SMNG = microscopic absorption XS of Sm.
XEND = assembly averaged Xe-135 number density.
SMND = assembly averaged Sm-149 number density.
Soluble boron cross section flag. *** will have SBNG, SBND.
%XS_SB %****
SBNG= microscopic absorption XS of natural boron.
SBND= number density of natural boron in coolant.
Effective delayed neutron flag. **** will have DCAYB, BETA.
%XS_BETA
DCAYB = decay constant of delayed neutron.
%****
BETA = effective beta.
Power form function flag. *** will have PAXIS 1, PAXIS 2,
PFF.
%XS_PFF %****
PAXIS 1 = x-axis coordinate of fuel pin.
PAXIS 2 = y-axis coordinate of fuel pin.
PFF = power form function.
Group-wise form function flag. *** will have FAXIS 1, FAXIS
2, GFF.
%XS_GFF %***
FAXIS 1 = x-axis coordinate of pin cell.
FAXIS 2 = y-axis coordinate of pin cell.
gfF = power form function.
32
PU/NE-00-20 (Rev. 4)
5.5. HELIOS-to-PMAXS Code Structure
The module HELIOS-to-PMAXS reads XS data from output of HELIOS code and
converts to PMAXS format. The code structure of HELIOS-to-PMAXS is shown in
figure 5.3.
Get default values
Scan HELOIS file
Get dimension data
Memory allocation
Read HELIOS file
Check the keywords
Read XS data
Post processes:
Correct down scattering
Solve infinite spectra
Correct down scattering
Reflector ADF
solve 1-D reflector model
get the ADF of reflector
Extract Xe/Sm absorption
Figure 5.3. Code structure of HELIOS-to-PMAXS
HELIOS-to-PMAXS module consists with three major subroutines, Get-default-value,
Scan-HELIOS-file, and Read-HELIOS-file.
In subroutine Get-default-value, the dimensions and some control flags are set to default
value according to assembly type, fuel assembly or reflector. In subroutine ScanHELIOS-file, the information about dimensions of XS data are scanned and memory are
allocated according to these dimensions.
In subroutine Read-HELIOS-file, the XS data are read by first check the keywords
described in section 5.4. After read XS data, three post processes, correct down scattering,
generate ADF for reflector and extract Xe/Sm absorption may be performed. The XS data
are stored in PMAXS data structure and ready for generating partial derivatives and print
into PMAXS file.
33
PU/NE-00-20 (Rev. 4)
6. Benchmark
In order to verify whole procedure of lattice calculation, GenPMAXS, PMAXS and
depletion module in PARCS, several benchmark problems were developed:
1) Generate PMAXS from HELIOS calculation
2) Generate PMAXS from TRITON calculation
3) Generate PMAXS from CASMO calculation
A simple PARCS model shown in figure 6.1 is used to reproduce k-infinites of
assemblies with PMAXS generated from lattice codes with infinite spectrum.
Reflective on
all 6 surfaces
Figure 6.1. PARCS model for benchmark problems
6.1. Benchmark 1: Generate PMAXS from HELIOS calculation
A BWR fuel assembly with 10x10 fuel bundle shown as figure 6.2 is calculated with
HELIOS code. This fuel assembly is depleted at reference state and restart for 10
branches calculation. The reference and branches states are described in table 6.1. In
order to provide reference for PARCS calculation, all HELIOS calculation are performed
with infinite spectrum.
Table 6.1. Reference and branches states
Branches
Reference
Control rod
Moderator
Density
Soluble
Boron
Fuel
Temperature
I
n
d
1
1
2
3
4
1
2
3
1
2
Control
Rod
State
0
1
0
0
0
0
0
0
0
0
0
Moderator
Density
(g/cc)
0.456652
0.456652
0.177504
0.317078
0.596226
0.7358
0.177504
0.456652
0.7358
0.456652
0.456652
Boron
Fuel
Moderator
Concentrati Tmepearture Tmepearture
on (ppm)
(K)
(K)
933
0
561.22
933
0
561.22
933
561.22
0
933
561.22
0
933
0
561.22
933
0
561.22
933
1000
561.22
933
1000
561.22
933
561.22
1000
0
0
561.22
2000
561.22
561.22
34
PU/NE-00-20 (Rev. 4)
Figure 6.2. BWR assembly in benchmark1
The HELIOS output is processed with GenPMAXS to generate PMAXS file. The input
file for GenPMAXS is given in section 2.1 of appendix B.
Two PARCS cases have been run for this benchmark A depletion case for reference state
and a restart case for low moderator density branch.
The first depletion case has verified procedure of selecting HELIOS output, reading
HELIOS output and generating PMAXS by GenPMAXS, and reading and using PMAXS
by PARCS. It also has verified following functions in PARCS:
1) Depletion capability in PARCS
2) Equilibrium Xe/Sm calculation
The second restart case has verified following more function in PARCS:
3) Restart from provided depletion states
4) Interpolation for burnups
5) Retrieve cross section from reference cross section and partial derivatives.
The K-inf from HELIOS and PARCS calculation for BWR assembly are shown in figure
6.3. Their differences are shown in figure 6.4. Figure 6.4 shows the maximum k-inf
difference between PARCS and HELIOS is less then 4 pcm for reference state, less than
10 pcm for low moderator density branch. Figure 6.3 shows the k-inf from PARCS are
right on the curve of k-inf from HELIOS even for the points at which k-infs from
HELIOS are not provided.
35
PU/NE-00-20 (Rev. 4)
The input and output files of HELIOS and GenPMAXS for this benchmark are store in
GenPMAXS repository. The input and output files of PARCS are store in PARCS
repository.
1.2
1.15
1.1
1.05
Kinf
1
0.95
0.9
0.85
HELIOS: Reference State
PARCS: Reference State
HELIOS: Low Moderator Density Branch
PARCS: Low Moderator Density Branch
0.8
0.75
0.7
0
10
20
30
Burnup (GwD/T)
40
50
60
Figure 6.3. PARCS and HELIOS K-inf for BWR assembly in benchmark1
36
PU/NE-00-20 (Rev. 4)
Kinf Difference between PARCS and
HELIOS (pcm)
8
6
4
2
0
0
10
20
30
40
50
60
-2
-4
-6
-8
Reference State
Low Moderator Density Branch
-10
Burnup (GwD/T)
Figure 6.4. PARCS and HELIOS K-inf difference for BWR assembly in benchmark1
37
PU/NE-00-20 (Rev. 4)
APPENDIX A PMAXS and XSEC Format
(version 2.0, revision-01, 10/1/03)
PMAXS file contains XS for one set, which may have one or more history cases and
burnup points. XSEC file contains XS for one or more sets. There are 3 cards, i.e. Burnup
Information, History case identification and Burnup point identification, are needed in
PMAXS file only. The NSET in XS Control Information means number of history cases
in PMAXS and means number of XS sets. Everything else is common.
Existence
1 XS Control Information
Always
2 Branches Information
Optional
3 Burnup Information
PMAXS
XS Set/(History case) wise data
Always
4 XS Set identification
Always
5 History case identification
PMAXS
6 T/H invariant variable block(repeat for burnup)
Always
6.1
Chi, Chid, inV, Det
Optional
6.2
Yield
Optional
6.3
CDF
Optional
6.4
Group-wise form function
Optional
6.5
Beta of Delayed neutron
Optional
6.6
Lambda of Delayed neutron
Optional
6.7
Decay heat data
Optional
Reference state data
Always
7
State identification
Always
8
XS Data Block (repeated for burnup points)
Always
8.1 Principal cross sections (tr,ab,nf,kf,fi,chi,inv,xe,sm)
Always
8.2 Scattering cross sections
Always
8.3 ADF
Optional
8.4 Direct energy deposition and J1 factors
Optional
Control rod branch cases (same structure with Ref. state case)
IBCR>0
Moderator density branch cases (same structure)
IBMD>0
Soluble Boron branch cases (same structure)
IBSB > 0
Fuel temperature branch cases (same structure)
IBTF>0
Moderator temperature branch cases (same structure)
IBTM >0
*The data in XS Block are original data for reference state, and partials for other
branches
38
PU/NE-00-20 (Rev. 4)
1) XS Control Information
Format:(A, 8I,14L/5(A/))
Fields:Title NSET NGROUP MDLAY MDCAY MADF MCDF MRODS MCOLA
ladf lxes lded lj1f lchi lchd linv ldet lyld lcdf
lgff lbet lamb ldec/
Comment1/Comment2/coment3/comment4/comment5/
Description:
Title
=’GLOBAL_V’
NSET
number of history cases in PMAXS. number of XS sets
in XESC.
NGROUP Number of energy groups.
MDLAY Maximum number of delay neutron groups for all XS
set.
MDCAY Maximum number of decay Heat groups for all XS set.
MADF
Maximum number of ADF in each group for all XS set.
MCDF
Maximum number of CDF in each group for all XS set.
MRODS Maximum number of rods in computed part of assembly
for all XS set.
MCLOA Maximum number of rod columns in whole assembly for
all XS set.
The following logical flags indicate PMAXS contains the corresponding data, if it is ‘F’,
then default values, which are given in following table, will be used in PARCS.
Ladf
Assembly discontinuity factor
Lxes
Microscopic cross section of Xe and SM
Lded
Direct energy deposition fraction,default value 0
Lj1f
J1
factor
for
minimal
critical
power
ratio,default:1
Lchi
Fission spectrum, default X(1)=1
Lchd
Delay neutron fission spectrum, default Xd(i)=X(i)
Linv
Inverse velocity
Ldet
Detector response XS, no default
Lyld
yield values of I, XE, Pm, the default values:
0.06386,0.00228,0.0113
Lcdf
Corner discontinuity factor, default 1
Lgff
Group wise power form function, default 1
Lbet
Beta, default:0.0002584,0.00152, 0.0013908
0.0030704,0.001102,0.0002584
Lamb
Lambda, default: 0.0128,0.0318,0.119,
0.3181,1.4027,3.9286
Ldec
Decay heat beta and lambda, default:
Beta: 2.35402E-02,1.89077E-02,1.39236E-02
6.90315E-03,3.56888E-03,3.31633E-03
Lamb: 1.05345E-01,8.37149E-03,5.20337E-04
4.73479E-05,3.28153E-06,1.17537E-11
Comment1~ Comment5
five line comments for describing
content of PMAXS
2) Branches information
If this block is default, then IBCR=IBMD=IBSB=IBTF=IBTM=0
Format:(A8,6I4/(2x,A8,2I4,4F10.5)
Fields:Title,IST,IBCR,IBMD,IBSB,IBTF,IBTM
39
PU/NE-00-20 (Rev. 4)
(name,ind,CR(i), MD(i), SB(i), TF(i),TM(i),i=1,NBRA)
Description:
Title =’BRANCHES’
IST
Branches structure index
IBCR
number of control rod branch cases.
IBMD
number of moderator density branch cases.
IBSB
number of soluble boron branch cases.
IBTF
number of fuel temperature branch cases.
IBTM
number of moderator temperature branch cases.
NBRA=1+IBCR+IBMD+IBSB+IBTF+IBTM
If NBRA=1, the late part of this block can be defaulted.
Name
=’REFE’/’CRBR’/’MDBR’/’SBBR’/’TFBR’/’TMBR’/
Ind
index of branches
CR
control rod state.
MD
Moderator density (g/cc).
SB
Soluble boron concentration (ppm).
TF
Fuel Temperature (K).
TM
Moderator Temperature (K).
3) Burnup information
If this card is default, then NBset=1, NBP(1)=1,BURN(1,1)=0
Format:(A8,I4/(2I4,10F8.3/(8x,10F8.3/)))
Fields:Title,NBset/
(i,NBP(i),(Burn(j,i),j=1, NBP(i)))
Description:
Title =’BURNUPS’
NBset number of Burnups sets, default=1
I
index for Burnups set
NBP(i) Burnup points in Burnups set i
Burns(j,i)
Burnup values.
4) XS Set identification
Format:(A,7I,8F)
Fields:Title,Series,IST,NADF,NCDF,NCOLA,NROWA,NPART,
PITCH,XBE,YBE,iHMD,Dsat,ARWatR,ARByPa,ARConR
Description:
Title =’XS_SET’
Series XS set series number
IST
Branches structure index
NADF
Number of ADF in each group.
NCDF
Number of CDF in each group.
NCOLA Number of rod columns in whole assembly
NROWA Number of rod rows in whole assembly
NPART Index for computed part of assembly
0/1/2/3:
whole/half/quarter/eighth
See next picture
PITCH rod lattice pitch(cm)
XBE
start position for first column rods
YBE
start position for first row rods
iHMD
initial heavy metal density (g/cc)
Dsat
the saturated moderator density
ARWatR the area ration of water rods to coolant
40
PU/NE-00-20 (Rev. 4)
ARByPa the area ration of bypass to coolant
ARConR the area ration of control rods to coolant
5) History case identification
Only needed in PMAXS
Format:(A8,I4,4F10.5)
Fields:Title, HCR, HMD, HSB, HTF, HTM
Description:
Title =’HST_CASE’
HCR
Control rod history
HMD
Moderator density history (g/cc)
HSB
Soluble boron History(ppm).
HTF
Fuel Temperature History (K).
HTM
Moderator Temperature History(K).
6) T/H invariant variable block
This block contains 7 subblocks, repeats for all burnup points
The format of T/H invariant variable block and XS block are depend on NGROUP as
following:
NGROUP
Format
n<3
8E12.5
n=3
6E12.5
n=4
8E12.5
n>4
nE12.5
6.1 Chi, Chid, inV, Det
Fields:Chi(1:n),Chid(1:n),inV(1:n),Det(1:n)
(where n=NGROUP)
Description:
Chi
fission neutron spectrum
Chid
Delay fission neutron spectrum
inV
inverse of netron velocity
Det
Detector response parameter, it is product of cross
section and local flux ratio.
6.2 Yield of I, Xe, and Pm
Fields:
YLDI, YLDXe, YLDPm
Description:
YLDI
Effective Iodine Yield
YLDXe Effective Xenon Yield
YLDPm Effective Promethium Yield
6.3 CDF
Fields:(CDF(g,j),g=1,NGROUP,j=1,NCDF)
41
PU/NE-00-20 (Rev. 4)
Description:
CDF
Corner discontinuity factor.
For Cartesian:
If NCDF=8: j=1/2/3/4 = NW/SW/SE/NE
/5/6/7/8
/W /S /E /N
If NCDF=5: j=1/2/3
= NW/SW/SE
/4/5
/W /S
If NCDF=4: j=1/2/3/4 = NW/SW/SE/NE
If NCDF=3: j=1/2/3
= NW/SW/SE
If NCDF=2: j=1/2
= corner/mid
If NCDF=1: j=1
= corner
6.4 group-wise form function
Fields:((GFF(g,j),g=1,NGROUP),j=1,NRODS)
Description:
GFF
group-wise form function from left to right, from
top to bottom. It is product of pin flux and
fission cross section.
6.5 Beta of Delayed neutron
Fields:BETA(1:NDLAY)
Description:
BETA
Effective delayed neutron fraction
6.6 Lambda of Delayed neutron
Fields:LAMBDA(1:NDLAY)
Description:
LAMBDA Decay constant of delayed neutron (/sec).
6.7 Decay heat data
Fields:DBET(1:NDCAY)
DLAM(1:NDCAY)
Description:
DBET
Fraction of the total fission energy appearing as
decay heat for decay group i.
DLAM
Decay constant of decay heat group i. [/sec]
7) State identification
Format:(A8, 2I4)
Fields:Title, index, IBSET
Description:
Title =’REFERENC’/’CRBRANCH’/’MDBRANCH’/’SBBRANCH’
/’TFBRANCH’/’TMBRANCH’/
index Branch case index
IBSET Burnups Set index
8) XS data block
This block contains 4 subblocks, repeats for all burnup points
The XS block are depend on NGROUP as following:
NGROUP
Format
n<3
8E12.5
42
PU/NE-00-20 (Rev. 4)
n=3
n=4
n>4
6E12.5
8E12.5
nE12.5
8.1 Principal cross sections
Fields:STR(1:n),SAB(1:n),SNF(1:n),SKF(1:n),XENG(1:n),SMNG(1:
n),SFI(1:n)
Description:
STR
Transport cross section
SAB
Absorption cross sections.
SNF
Nu-fission cross section
SKF
Kappa-fission cross section
XENG
Microscopic capture cross section of Xenon
SMNG
Microscopic capture cross section of Samarium
SFI
Fission cross section
8.2 Scattering cross sections
Fields:((SCT(j,i),j=1,NGROUP),i=l,NGROUP)
Description:
SCT(j,i)
scattering xs from group j to group i.
8.3 ADF
Fields:((ADF(g,n),g=1,NGROUP) ,j=1,NADF)
Description:
ADF
Assembly discontinuity factor.
For Cartesian:
If NADF=4: j=1/2/3/4 = W/S/E/N
If NADF=2: j=1/2
= W/S
If NADF=1: j=1
= average
8.4 Direct energy deposition and J1 factors
Format: (8E12.5)
Fields:
DED(1:4),J1F(1:4)
Description:
DED(1) the ratio of DED fraction in coolant and its
density
DED(2) the ratio of DED fraction in water rod and its
density
DED(3) the ratio of DED fraction in bypass and its density
DED(4) DED fraction in control rod.
J1F(1) Local Power Peaking Factor.
J1F(2) Inner J1 factor (for Critical Power Ratio)
J1F(3) Side
J1 factor (for Critical Power Ratio)
J1F(4) Corner J1 factor (for Critical Power Ratio)
43
PU/NE-00-20 (Rev. 4)
Appendix B Input Manual of GenPMAXS
1. Input Description
GENPXS uses an input files, following the standard I/O rules of Windows 98/NT or
UNIX system. There are several keywords to describe the in the GENPXS input file,
which identify the special meaning of input followed by several data. The Table D.1
shows the keywords and the meanings of the data.
Table B.1. The keywords of GENPXS input and their meaning.
Index
1
keyword
%JOB_TIT
Problem title
Meaning
2
%JOB_OPT
The options of GenPMAXS program.
3
%DAT_SRC
The File contains XS data.
4
%HEL_FMT
Format of HELIOS output file.
5
%BRANCHES
6
7
%SCT_FAC
%JOB_END
Numbers of branches, and State information for reference
state and all branch cases
Scattering cross section modification factor
Job ending flag.
In the GENPXS inputs, there are some general rules. The basic rule is that the all data is
given by free format except to the keywords.
1.1. JOB_TITLE
Keyword, PMAXS_file, comments
Format: (8E12.5)
- Format
%JOB_TIT
Variable
Description
PMAXS_file
The name of the output PMAXS format file. The
maximum length is 40.
Character.
Comments
- Example
%JOB_TIT
PMAXS.C01
“17x17” SMART CORE FUEL ASSEMBLY "08/03/2000"
In the above example, in order to distinguish the integer and character-string, the
character strings starting with a numeric data are closed by the double quotation mark.
The output PMAXS format file will be created in the name of PMAXS.C01.
44
PU/NE-00-20 (Rev. 4)
1.2. JOB_OPTION
- Format
%JOB_OPTION
Ladf Lxes Lded Lj1f Lchi Lchd Linv Ldet Lyld Lcdf Lgff Lbet Lamb Ldec iups
The logical flags indicate write or not write corresponding data in
to PMAXS file. If the flag is ‘F’, the PMAXS will not contain the
corresponding data, and default values, which are given in following
table, will be used in PARCS. If the values from XS file are same as
default values, user may take ‘F’ to reduce computation cost.
Regardless what the values are given in input file, all logical flag
except Ladf will be force to be ‘F’ for reflector.
Variable
Ladf
Lxes
Lded
Lj1f
Lchi
Lchd
Linv
Ldet
Lyld
Lcdf
Lgff
Lbet
Lamb
Ldec
Iups
Description
Assembly discontinuity factor
Microscopic cross section of Xe and SM, No default
value
Direct energy deposition fraction,
default value 0
J1 factor for minimal critical power ratio,
default:1
Fission spectrum, default X(1)=1
Delay neutron fission spectrum, default Xd(i)=X(i)
Inverse velocity, no default value, must be ‘T’ for
transient
Detector response XS, no default
yield values of I, XE, Pm, the default yield values
are:0.06386,0.00228,0.0113
Corner discontinuity factor, default 1
Group wise power form function, default 1
Beta, default:0.0002584,0.00152,0.0013908
0.0030704,0.001102,0.0002584
Lambda, default:
0.0128,0.0318,0.119,0.3181,1.4027,3.9286
Decay heat beta and lambda, default:
Beta: 2.35402E-02,1.89077E-02,1.39236E-02
6.90315E-03,3.56888E-03,3.31633E-03
Lamb:1.05345E-01,8.37149E-03,5.20337E-04
4.73479E-05,3.28153E-06,1.17537E-11
Integer
0 keep up scatter XS
1 remove up scatter XS, modify down scatter XS
with HELIOS spectrum
2 remove up scatter XS, modify down scatter XS
with infinite medium spectrum
- Example
%JOB_OPTION
T T F F F F F F F F F F F F 2
45
PU/NE-00-20 (Rev. 4)
1.3. DAT_SRC
- Format
%DATA_SRC
SRC_kind
XS_file
Variable
Description
SRC-kind
IF -1, PMAXS file with raw cross section data
IF 0, PMAXS file with derivatives
IF 1, HELIOS output
Character.
The XS file name for making PMAXS file
XS-file
- Example
%DAT_SRC
1
ZENITH.A01
In the above example, there is 1 source file which name is ZENITH.A01 and this file
contains the HELIOS results.
1.4.—1.6 these section are used for generate PMAXS from HELIOS output
1.4. HEL_FMT
- Format
%HEL_FMT
FA-kind Label Width Column XS-file
Variable
Description
FA_kind
Integer. The flag of assembly type.
IF 1, fuel assembly.
If 0, reflector.
Integer. Width of label column in Characters.
Integer. Width of each date columns in Characters.
Integer. Number of date columns in one block.
Label
Width
Column
- Example
%HEL_FMT
1 24 13 8
In the above example, the HELIOS output file contains the HELIOS results of the fuel
assembly, not reflector assembly. The labels takes 24 columns, and there are at most 8
data in a row, the width for each data is 13 columns.
46
PU/NE-00-20 (Rev. 4)
1.5. BRANCHES
- Format
%BRANCH
IBCR IBMD IBSB IBTF IBTM
Variable
Description
IBCR
Integer. Number of control rod branch cases.
IBMD
Integer. Number of moderator density branch cases.
IBSB
Integer. Number of soluble boron branch cases.
IBTF
Integer. Number of fuel temperature branch cases.
IBTM
Integer. Number of moderator temperature branch cases.
NBRA=1+IBCR+IBMD+IBSB+IBTF+IBTM
- Example
%BRANCHES
1 1 4
1
0
1.6. STATE
- Format
%STATE
(name,ind,CR(i), MD(i), SB(i), TF(i),TM(i),
Name
ind
CR
MD
SB
TF
TM
i=0,NBRA)
=/’HIST’/’REFE’/’CRBR’/’MDBR’/’SBBR’/’TFBR’/’TMBR’/
index of branches
control rod state.
Moderator density (g/cc).
Soluble boron concentration (ppm).
Fuel Temperature (K).
Moderator Temperature (K).
- Example
%STATE
HIST
REFE
CRBR
MDBR
MDBR
MDBR
MDBR
SBBR
TFBR
1
1
1
1
2
3
4
1
1
0.000000
0.000000
1.000000
0.000000
0.000000
0.000000
0.000000
1.000000
0.000000
0.456652
0.456652
0.596226
0.177504
0.317078
0.596226
0.7358
0.7358
0.456652
0.000
0.000
0.000
0.000
0.000
0.000
0.000
1000.000
0.000
900.000
900.000
900.000
900.000
900.000
900.000
900.000
900.000
561.220
561.220
561.220
561.220
561.220
561.220
561.220
561.220
561.220
561.220
47
PU/NE-00-20 (Rev. 4)
1.7. SCT_FAC
- Format
%SCT_FAC
sfac
Variable
Description
sfac
Real. Default value 1.0
The scattering cross section factor. If ‘sfac’ is
different from 1, then the scattering cross section
will be multiply by ‘sfac’.
This factor is designed for generate cross section
for corner reflector as described in section 3.2.
The modification factor can be computed as Eq.
(3.26).
For example, the fuel pitch and the thickness of
shroud are 21.607 and 2.23398 cm, respectively. So
the correction factor is 0.8966
- Example
%SCT_FAC
0.8966
48
PU/NE-00-20 (Rev. 4)
2. The Samples input of GenPMAXS code
2.1. The Sample Input for HELIOS
%JOB_TIT
'bwr_hel.PMAX' BWR 10X10 FUEL ASSEMBLY
%DAT_SRC
1 'Zenith.out'
%JOB_OPT
T T T F F F T F T F F T TF 1
!ad,xe,de,j1,ch,Xd,iv,dt,yl,cd,gf,be,lb,dc,ups
%HEL_FMT
1 23 13 8
%BRANCH
1 4 3 2 0
%STATE
HIST 1 0.000000 0.456652 0.000 933.000 561.220
REFE 1 0.000000 0.456652 0.000 933.000 561.220
CRBR 1 1.000000 0.456652 0.000 933.000 561.220
MDBR 1 0.000000 0.177504 0.000 933.000 561.220
MDBR 2 0.000000 0.317078 0.000 933.000 561.220
MDBR 3 0.000000 0.596226 0.000 933.000 561.220
MDBR 4 0.000000 0.7358
0.000 933.000 561.220
SBBR 1 0.000000 0.177504 1000.000 933.000 561.220
SBBR 2 0.000000 0.456652 1000.000 933.000 561.220
SBBR 3 0.000000 0.7358 1000.000 933.000 561.220
TFBR 1 0.000000 0.456652 0.000 561.220 561.220
TFBR 2 0.000000 0.456652 0.000 2000.000 561.220
%JOB_END
2.2. The Sample Input for convert raw cross section to partials
%JOB_TIT
'Assembly.PMAX'
%DAT_SRC
-1 'Transformer.out'
%JOB_END
2.3.The Sample Input for convert from old format to new format PMAXS
%JOB_TIT
'bwr_hel.PMAX' BWR 10X10 FUEL ASSEMBLY
%DAT_SRC
0 ' old.PMAX '
%JOB_END
49
PU/NE-00-20 (Rev. 4)
2.4.The Sample Input for generate corner reflector cross section
%JOB_TIT
'corner.PMAX' corner reflector
%DAT_SRC
0 'siderflector.PMAX'
%SCT_FAC
0.8966
%JOB_END
50