1
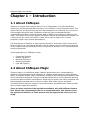
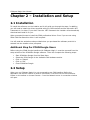
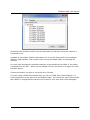
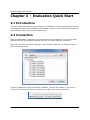
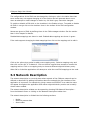
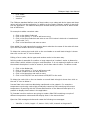
CANopen Magic User Manual Manual Revision 2.00 CANopen Magic User Manual Information in this document is subject to change without notice and does not represent a commitment on the part of the manufacturer. The software described in this document is furnished under license agreement or nondisclosure agreement and may be used or copied in accordance with the terms of the agreement. It is against the law to copy the software on any medium except as specifically allowed in the license or nondisclosure agreement. No part of this manual may be reproduced or transmitted in any form or by any means, electronic or mechanical, including photocopying, recording, or information storage and retrieval systems, for any purpose other than the software purchaser’s use, without prior written permission. Every effort was made to ensure the accuracy in this manual and to give appropriate credit to persons, companies and trademarks referenced herein. © Embedded Systems Academy, Inc. 2002-2012, All Rights Reserved Microsoft® and Windows™ are trademarks or registered trademarks of Microsoft Corporation. PC® is a registered trademark of International Business Machines Corporation. CANopen® is a registered trademark of CAN in Automation User's Group. For support contact [email protected] CANopen Magic was developed by Embedded Systems Academy. Embedded Systems Academy provides training and consulting services, specializing in CAN and CANopen. For more information visit www.esacademy.com Page 2 CANopen Magic User Manual Contents Contents...................................................................................................................3 About This Manual......................................................................................................5 Chapter 1 – Introduction.............................................................................................6 1.1 About CANopen..................................................................................................6 1.2 About CANopen Magic.........................................................................................6 1.3 Obtaining Compatible CAN Interfaces...................................................................7 Chapter 2 – Installation and Setup...............................................................................8 2.1 Installation........................................................................................................8 Additional Step For PCAN Dongle Users....................................................................8 2.2 Setup...............................................................................................................8 Chapter 3 – Evaluation Quick Start.............................................................................10 3.1 Introduction.....................................................................................................10 3.2 Connection......................................................................................................10 3.3 Trace..............................................................................................................11 3.4 Start Simulated Node........................................................................................11 3.5 Read From Node..............................................................................................12 3.6 Network Overview............................................................................................13 3.7 PDO Configuration............................................................................................13 3.8 Trace Export....................................................................................................14 Chapter 4 – Core Functionality...................................................................................15 4.1 User Interface Overview....................................................................................15 4.2 Network Management.......................................................................................17 4.3 Reading from a Node........................................................................................17 4.4 Writing to a Node.............................................................................................18 4.5 Trace..............................................................................................................19 4.6 Network Overview............................................................................................20 4.7 Transmit CAN Messages....................................................................................21 4.8 Preferences.....................................................................................................21 Chapter 5 – Advanced Functionality............................................................................23 5.1 Trace Filtering, Recording and Export..................................................................23 5.2 PDO Configuration............................................................................................25 5.3 Network Description.........................................................................................26 5.4 Process Data Display........................................................................................28 5.5 Layer Setting Services......................................................................................30 5.6 Read/Write Node Configurations.........................................................................31 5.7 SDO Channels..................................................................................................32 5.8 Scripting.........................................................................................................33 5.9 CANopen Manager............................................................................................33 5.10 Log Player.....................................................................................................33 5.11 Device Profile Support.....................................................................................34 5.12 Node Setup....................................................................................................34 5.13 Node Selection...............................................................................................34 Chapter 6 – Simulation..............................................................................................35 6.1 Overview.........................................................................................................35 6.2 Adding Simulation Nodes...................................................................................35 6.3 Process Data Display........................................................................................35 Chapter 7 – Command Line........................................................................................38 Page 3 CANopen Magic User Manual 7.1 Overview.........................................................................................................38 7.2 Interrogation...................................................................................................38 7.3 Tasks..............................................................................................................39 NMT..................................................................................................................39 SDODOWNLOAD.................................................................................................40 SDOUPLOAD.......................................................................................................40 7.4 Examples........................................................................................................41 7.5 CANopen Magic Pro Library................................................................................41 Chapter 8 – Scripting................................................................................................42 8.1 Overview.........................................................................................................42 8.2 Editing............................................................................................................42 8.3 Debugging.......................................................................................................42 8.4 Objects...........................................................................................................42 Message............................................................................................................42 Page 4 CANopen Magic User Manual About This Manual This manual follows some set conventions with the aim of making it easier to read. The following conventions are used: 0x italictext [] a|b … Hexadecimal (base 16) values are prefixed with “0x”. Replace the text with the item it represents Items inside [ and ] are optional a OR b may be used One or more items may go here. This manual frequently uses CANopen terminology as defined by the CANopen standard CiA301 (see www.can-cia.org for more info). Readers that are not yet familiar with all the CANopen terms may want to consider reading a book like www.canopenbook.com or the official standard to update their knowledge on CANopen technology and terminology. Page 5 CANopen Magic User Manual Chapter 1 – Introduction 1.1 About CANopen CANopen is a higher layer protocol that runs on a CAN network. The CAN specification defines only the physical and data link layers in the ISO/OSI 7-layer Reference Model. This means that only the physical bus and the CAN message format is defined, but not how the CAN messages should be used. CANopen provides an open and standardized but customizable description of how to transfer data of different types between different CAN nodes. This allows off the shelf CANopen compliant nodes to be purchased and plugged into a network with the minimum of effort. It also can be used in place of an in-house proprietary higher layer protocol development. The development of CANopen is supervised by the CAN in Automation User's Group and is being turned into an international standard. Use of CANopen does not require the payment of any royalties and the specification may be expanded or altered to suit if closed networks are being developed. Typical applications for CANopen include: Commercial Vehicles Medical Equipment Maritime Electronics Building Automation Light Rail Systems 1.2 About CANopen Magic CANopen Magic is a professional grade CANopen development tool, indispensable for assisting in the development and debugging of CANopen based networks. Using CANopen Magic, a CANopen network may be monitored, configured and analyzed and CANopen nodes can be tested and integrated. Timings of message transmissions can be observed, allowing comparison against network specifications. Nodes may be quickly and easily configured and test messages generated with a minimum of effort. New nodes may be simulated individually and as part of a network of real nodes and/or simulated nodes. Network traffic can be traced, logged and replayed. There are three versions of the application available, each with different feature sets. Please visit canopenmagic.com for a comparison table. This manual covers the superset of features, so some sections may not apply to the version you are using. Page 6 CANopen Magic User Manual 1.3 Obtaining Compatible CAN Interfaces CANopen Magic supports CAN interfaces from several vendors. At the time of writing the following are supported: • • • PEAK-System Technik CAN Interfaces Kvaser CAN Interfaces VSCOM CAN to Ethernet bridges Embedded Systems Academy recommends the PCAN-USB Pro interface from PEAK as it provides timestamps with 1us accuracy in a metal casing with two CAN channels available. Page 7 CANopen Magic User Manual Chapter 2 – Installation and Setup 2.1 Installation To install the software run the installer and it will guide you through the steps. In addition you will need to install the drivers supplied with your CAN interface and the Microsoft .NET Framework 4.0 or later. If you don't have the .NET framework the installer will automatically download and install it for you. When prompted choose to install the PEAK professional driver. Even if you are not using PEAK CAN interfaces this driver is still required. You will need the activation code provided when you purchased the software, and this is entered into the installer when prompted. Additional Step For PCAN Dongle Users Before using the PCAN Dongle interface with CANopen Magic, it must be removed from the setup window of the PCANView Dongle software. To do this complete the following steps: Start PCANView Dongle from the Start Menu Select the PCAN Dongle in the Available CAN Hardware section Click on "Delete" Click on "OK" Close PCANView Dongle 2.2 Setup When you run CANopen Magic it is not connected to any CAN interface. Before the application can send or receive it must be connected. To do this click on the connection button on the toolbar or choose Connect... from the Network menu. A connection window will open. Page 8 CANopen Magic User Manual Choose the CAN interface vendor from the drop down list and then choose the network or bus speed to use. Loopback is a simulation CAN bus that allows you to use the functionality of the software without a CAN interface. This is useful when running simulated nodes or evaluating the software. For some CAN interfaces the available networks or bus speeds can be edited. If this option is available then the Edit... button will be enabled. Click on the button to configure the CAN interface options. Choose the network you wish to use and click on Connect. If you are using a PEAK CAN interface then you can run PCAN-View, PCAN-Explorer or a custom application at the same time as CANopen Magic. Just choose the same CAN interface and network in all applications and they will be able to “see” each other's CAN messages. Page 9 CANopen Magic User Manual Chapter 3 – Evaluation Quick Start 3.1 Introduction This quick start guide introduces key features of software in a step by step manner and can be followed by users of the evaluation and ultimate versions. It can be followed by users of other versions if they have a real CANopen node. 3.2 Connection When the application is started it is not connected to a CAN interface. For this quick start guide we will use the loopback interface, which is an internal CAN bus simulation. Open the connection window by clicking on the Connect toolbar icon or choose Connect... from the Network menu. Choose Loopback for the driver and then CANopen_1000 for the network. Then click on Connect. The bottom of the main window will now show the current connection. Page 10 CANopen Magic User Manual 3.3 Trace The trace window should already be displayed at the bottom of the main window. If it isn't choose Trace... from the Add menu. Start the trace window recording by clicking on the record button The trace window will now show the messages on the CAN bus. 3.4 Start Simulated Node Add a simulation node by clicking on the simulation node toolbar icon or choosing New Simulation Node... from the Simulation menu. This will open a simulation node window which defaults to simulating an I/O node based on the MicroCANopen Plus communication stack. Page 11 CANopen Magic User Manual Click on the Start button to start the simulated node. At this point the Process Image tab will show the contents of the object dictionary and the trace window will show the bootup messages from node id 0x01. 3.5 Read From Node Open a read window by clicking on the read toolbar icon or choosing Read From Node... from the Add menu. A read window will open. The default configuration is to read the device type of node id 0x01. Click on the read button to read the device type of the node. The read window will show the 32-bit device type value in hexadecimal and the trace window will show the expedited SDO access. Page 12 CANopen Magic User Manual 3.6 Network Overview Open the network overview window by choosing Network Overview... from the View menu. Click on the Scan Network button to look for nodes on the network. Our single simulation node will be found. The NMT status will be shown as unknown because this feature relies on seeing a bootup, heartbeat or node guarding messages. We can turn heartbeats on by clicking on the Set Heartbeats button. You will now see a heartbeat message being transmitted once a second from the node showing that it is in pre-operational state. The network overview window will also show the node as being in pre-operational state. 3.7 PDO Configuration Open the PDO configuration window by clicking on the PDO toolbar icon or choosing PDO Configuration... from the Add menu. The window will open. Click on the Read button to read the current PDO configuration of the node. The table will fill with entries as a result of interrogating the node. The trace window will show a large number of SDO transfers as the node was read. Page 13 CANopen Magic User Manual The PDO settings can be changed by clicking in the cells of the table. 3.8 Trace Export The final step in this quick start guide shows you how to export the contents of the trace window to a CSV file. This is useful when sharing debugging information with colleagues, engineers at other companies or documenting node and network testing. Stop the trace recording by clicking on the stop button. For performance reasons the export feature is only enabled when the trace recording is stopped. For other options please see the advanced functionality chapter of this manual. Click on the export button in the toolbar of the trace window. Choose a location to save the CSV file. Page 14 CANopen Magic User Manual Chapter 4 – Core Functionality 4.1 User Interface Overview The user interface is divided into four areas, menus/toolbars, status bar, documents and docked windows. All windows in the application are divided into two types – document or dockable. Documents appear in the central document area of the user interface and can be switched between using the tabs above each document. Dockable windows are attached (docked) to one side of the main window and can be moved outside of the main window if desired. Document windows can be reordered by holding down the left mouse button on the tab and dragging it left or right. If too many documents are open then the tabs can be scrolled to view them all by clicking on the arrows to the right of the tabs. The document area can be subdivided creating subgroups of tabs. To do this hold down the left mouse button over a tab and drag towards the center of the main window. A group of small blue symbols will appear. Move the pointer over one of these symbols and release the mouse button. Page 15 CANopen Magic User Manual The dockable windows have a large amount of flexibility in how the user interface can be arranged. For example hold down the left mouse button with the pointer over a docked window title bar. Drag towards the center of the main window and a group of small blue symbols will appear. Move the pointer over one of these symbols and release the mouse button. The window will then appear in the new position. If you release the mouse button when the pointer is elsewhere then the window will be split out of the main window. It can then be placed on a second monitor for example. The following screenshot gives a taste of how flexible the user interface can be by positioning read and write windows side-by-side and moving the trace window out of the way. Dockable windows can be hidden. When the application is started the network management window is also opened but it is hidden on the left side and shown as a tab. Click on the network management tab to pop open the window. Click elsewhere to hide it again. When the window is open you can interact with it just like any other window. Clicking on the small pin icon at the top left of the window causes the window to stay open, and it can then be docked like any other dockable window. Page 16 CANopen Magic User Manual Clicking on the pin icon in any dockable window hides it to one side. The default user interface layout can be restored by choosing New Project from the File menu or clicking on the new project toolbar icon. 4.2 Network Management When creating a new project the network management window is opened and hidden on the left side of the main window. Click on it's tab to expand the window. If you have closed the window then it can be reopened by choosing Network Management... from the View menu. This window allows you to send NMT messages to nodes on the network. Choose a specific node from the drop-down list or select the All Nodes option. Next click on the button corresponding to the NMT command you wish to send. 4.3 Reading from a Node To view the read window choose Read From Node... from the Add menu or click on the read toolbar icon. The read window allows you to access the object dictionary of a node using SDOs. If possible expedited SDOs will be used, otherwise segmented or block transfers will take place depending on the application preferences. Choose a node to access from the drop-down list. Next click on the Select... button to choose an object dictionary entry. If the entry you want to access is not shown then you can manually enter the index and subindex at the bottom. The contents of this window can be customized by specifying an EDS or DCF for the node in the Network Description window. If you are not sure what the type of the custom entry is then choose Domain. Choose a suitable display data type. If unsure choose Domain. This defaults to match the type of the object dictionary entry you have selected. After reading the data the type can be changed to view the data in different ways. Finally click on the Read button to perform the read. The read data will be displayed. If the operation takes too long to complete it can be canceled by clicking on the cancel button in the toolbar or choosing Cancel Current Task from the Network menu. By choosing the Save Data option the read data can be stored in a binary file. Click on the Browse... button to choose a file. Page 17 CANopen Magic User Manual It is possible to start the read using a trigger. A trigger is a condition that causes an operation (such as reading from a node) to start. Triggers should be used with caution as they can cause heavy bus load and bursts of back to back messages. To configure the trigger click on the Edit... button. There are several trigger options available and more than one option can be used at the same time. Click the checkboxes to enable the options and then configure then appropriately. Once the trigger window is closed it will take immediate effect. To disable the triggers go back to the edit window. 4.4 Writing to a Node To view the write window choose Write To Node... from the Add menu or click on the write toolbar icon. The write window allows you to access the object dictionary of a node using SDOs. If possible expedited SDOs will be used, otherwise segmented or block transfers will take place depending on the application preferences. Choose a node to access from the drop-down list. Next click on the Select... button to choose an object dictionary entry. If the entry you want to access is not shown then you can manually enter the index and subindex at the bottom. The contents of this window can be customized by specifying an EDS or DCF for the node in the Network Description window. If you are not sure what the type of the custom entry is then choose Domain. Choose a suitable entry data type. If unsure choose Domain. This defaults to match the type of the object dictionary entry you have selected. Enter the data into the window in a format that is suitable for the data type you have chosen. A table at the end of this section shows examples for formatting that is supported. Finally click on the Write button to perform the write. If the operation takes too long to complete it can be canceled by clicking on the cancel button in the toolbar or choosing Cancel Current Task from the Network menu. By choosing the Load Data option the data can be read from a binary file. Click on the Browse... button to choose a file. It is possible to start the write using a trigger. A trigger is a condition that causes an operation (such as writing to a node) to start. Triggers should be used with caution as they can cause heavy bus load and bursts of back to back messages. To configure the trigger click on the Edit... button. There are several trigger options available and more than one option can be used at the same time. Click the checkboxes to enable the options and then configure then Page 18 CANopen Magic User Manual appropriately. Once the trigger window is closed it will take immediate effect. To disable the triggers go back to the edit window. Data Type Boolean Octet String Example User Input true false 12345 0xA7B1 1.3526 10.6E-2 A q 1A 2B 3C 4D Visible String Richard of York gave battle in vain Unicode String Richard of York gave battle in vain Time of Day 03/02/2020 14:32:21.362 Time Difference Domain 3.14:32:21.362 1A 2B 3C 4D Unsigned8, Unsigned16, etc. Real32, Real64 Visible Char Notes Case insensitive 0x means hexadecimal Always hexadecimal but without the 0x prefix. Spaces are optional Each character is stored in one byte Each character is stored in two bytes ISO8601 or RFC1123 formats are supported d.hh:mm:ss.iii Always hexadecimal but without the 0x prefix. Spaces are optional 4.5 Trace The trace window is your view onto the CAN bus and is essential for all development and debugging tasks related to CANopen. To view the trace window choose Trace... from the Add menu or click on the trace window toolbar icon. The trace window has two modes, stopped and running. Initially the window is stopped and if there are no messages then it will appear blank. Click on the start button in the window to start recording. When recording any messages that appear on the CAN bus are shown in the window. For performance reasons scrolling to view old messages is not allowed while recording. During recording the window shows the current, peak and average bus loads. These are estimations based on looking at messages on the bus in one second time slices. The peak and average values are reset each time the trace recording is started. To stop the recording click on the stop button. When stopped the vertical scroll bar is enabled and all messages in the trace buffer can be viewed. To clear the trace at any time click on the clear button. Message timestamps have two modes, relative and absolute, and the mode may be chosen at any time by using the drop-down list. In absolute mode the timestamp of each message Page 19 CANopen Magic User Manual is measured from a single common starting point. In relative mode the timestamp shows the time since the last message on the bus. The trace display has two modes, sequence and fixed, and the mode may be chosen at any time by using the drop-down list. Changing the display mode clears the trace window. In sequence mode each message is shown individually. When a new message is placed onto the bus it appears at the bottom of the trace window and older messages are shuffled up. In fixed mode each row corresponds to a specific message identifier. When a new message is placed onto the bus and the identifier has not been seen before then it will appear on a new row in the trace window. However if the identifier has been seen before then it will overwrite the previous message with that identifier. The Cnt column shows the number of messages with that identifier which have been received. The following screen shot shows the trace window configured for fixed mode and how it would look after a NMT reset and a series of SDO transfers: You can see that there has been one NMT master request, one emergency message and one bootup message. However you can also see there have been 38 transmit SDOs and 38 receive SDOs. Only the contents of the last message for each identifier are shown. Also note that the identifiers are ordered with the lowest at the bottom of the trace window and the highest at the top. 4.6 Network Overview The network overview window displays a summary of all nodes on the network. To view the window choose Network Overview... from the View menu. Click on the Scan Network button to find all nodes on the network. For each node the device type and identity information will be read. The NMT status will show unknown until the application sees a bootup, heartbeat or node guarding message for the node. The heartbeat producer time for all nodes can be set in one go using this window. Enter a time into the box and click on the Set Heartbeats button. Some nodes support saving the communication parameters into non-volatile memory. By clicking on the Store Configs button each node in the list will be sent the save command. Optionally the timestamps of the save can be written to a configuration manager on the network. Page 20 CANopen Magic User Manual 4.7 Transmit CAN Messages The CAN messages window allows plain CAN messages to be created and transmitted, with optional transmission triggers. This is typically used for protocols running alongside CANopen or for transmitting PDOs or test messages. To view the window choose CAN Messages... from the View menu. To create a new message click on the add icon on the toolbar in the CAN messages window. Enter the details of the message and click on the OK button to create it. By entering a name for the message this name will appear where appropriate throughout the application, including in the trace window. Even if the message will not be manually transmitted using this window, it can be very useful to give names to messages when analyzing and debugging a network. If the timestamp option is selected then the message data will contain a six-byte Time of Day value each time it is transmitted. Typically this is used in conjunction with the Timestamp message identifier 0x100. Enabling trigger options allows the message to be transmitted under certain conditions, for example at a predictable rate, when a function key is pressed or when a particular message is seen on the CAN bus. Once a message has been created it can be transmitted manually by clicking on the button next to the message entry in the window. There is also a toolbar icon to transmit the currently selected message. The message can be edited by right-clicking on the message and choosing Edit... from the menu, or by clicking on the toolbar icon with the message selected. There are toolbar icons to delete messages and transmit all defined messages. 4.8 Preferences View the preferences window by choosing Preferences... from the View menu or by clicking on the preferences toolbar icon. The options shown in the preferences window vary according to the version of the application. Most of the options are self-explanatory however a few will be described here. When transferring more than four bytes to or from a node's object dictionary SDO segmented mode will be used as nodes must support it. For more than 28 bytes it is more efficient to use SDO block mode, which some nodes will support. To enable block mode check the Use SDO block transfers option. The parameters for the block mode can be configured. When project files are saved they may contain references to other files, for example EDS/DCFs or images. The default is for these paths to remain relative to the project file. Page 21 CANopen Magic User Manual This is useful when moving the project to a different PC or a different folder and the referred files are moved with it. Sometimes it may be useful to keep the referred files in a central location and only move the project file. To enable this check the option Use absolute paths under the Project tab and re-save the project file. Page 22 CANopen Magic User Manual Chapter 5 – Advanced Functionality 5.1 Trace Filtering, Recording and Export The trace buffer can be exported to a CSV log file for documentation or further analysis in a spreadsheet. The export functionality is enabled when trace recording is stopped. To export the trace click on the export toolbar button in the trace window and choose a location to save to. The trace window supports long-term recording. This saves messages to a CSV log file when they are received while the trace window is recording. To enable click on the continuous recording toolbar button in the window and select a location to save to. To disable click again on the continuous recording toolbar button. Note that the CSV log files saved from the trace window can be replayed using the log player. See the log player section of this chapter for details. Each trace window features it's own filter. This allows selection of which messages should be displayed. If there are multiple trace windows open then each one can have a different filter. For example one can show SDOs and another can show PDOs. The export and continuous recording will save the output of the filter. To configure click on the configure filter toolbar icon in the window and the edit window will be displayed. While recording click on the enable/disable trace filtering toolbar button to turn the filtering on and off. The filter is divided into three sections, each of which can be individually enabled. When a section is disabled it is not involved in the filtering. The diagram at the bottom of the window shows the relationship between the sections. Page 23 CANopen Magic User Manual Messages are received from the CAN bus and passed to block 1. If they are allowed through the filtering in block 1 they are passed to block 2. If they are allowed through block 2 then they are passed to the script. If they are allowed through the script then the messages are shown in the trace window. Block 1 and block 2 are functionally identical. Each block can be configured as a pass filter or a stop filter. A pass filter allows any message through that matches one of the rules. A stop filter blocks any message that matches one of the rules. Up to three rules can be enabled and consist of a range of message identifiers. Predefined ranges of identifiers can be chosen from the drop-down lists. For example to show only PDOs: 1. 2. 3. 4. Enable block 1 Set block 1 to a pass filter Enable block 1, rule 1 Choose PDOs in the drop-down list for block 1, rule 1 To show all SDOs except for the SDOs belonging to node 0x01: 1. Enable block 1 2. Set block 1 to a pass filter 3. Enable block 1, rule 1 4. Choose SDOs in the drop-down list for block 1, rule 1 5. Enable block 2 6. Set block 2 to a stop filter 7. Enable block 2, rule 1 8. Enter 0x581 in both boxes for block 2, rule 1 9. Enable block 2, rule 2 10. Enter 0x601 in both boxes for block 2, rule 2 A python script can be used to implement sophisticated filtering. The application contains a built in script editor which can be opened by choosing New Script from the Scripts menu or clicking on the New Script toolbar icon. Here is an example script: # Test trace filter script import sys print "Parameters = %s" % Parameters def OnMessageReceiving(Message): if Message.Id.Id == 0x000: return False else: return True def OnMessageReceived(Message): if Message.Id.Id == 0x100: Page 24 CANopen Magic User Manual print “Saw timestamp message” Two functions must be defined, OnMessageReceiving and OnMessageReceived and are called as messages are passed to the script section of the filter. OnMessageReceiving is called first and performs the actual filtering. Returning False will stop the message and it won't be shown in the trace window. Returning True will allow the message through. In this example NMT messages are not allowed through the filter. OnMessageReceived is called second and only for those messages that were not filtered out. It allows optional post processing to be performed. In this example a message is printed to the script console when a timestamp message is seen. Print statements send output to the script console, which can be opened by choosing Script Console from the Scripts menu. This is useful for debugging. Note that each trace window defines two trace buffers which use the same filter, one for display and one for continuous recording. This means that the script is executed twice for every message received, therefore any messages printed to the script console will appear twice. It is recommended to use tabs for indentation as any mistakes with the indentation in a python script can cause it to function incorrectly. If the script is modified while using the script trace filtering feature, click on the enable/disable filtering button in the trace window twice to use the new script. Please refer to the scripting chapter for full details on what is supported in the trace filtering scripts. 5.2 PDO Configuration To view the PDO configuration window choose PDO Configuration... from the Add menu or click on the PDO configuration toolbar icon. This window allows you to read and modify the PDOs defined in a node. Choose a node to access from the drop-down list. Click on the Read button to read the PDOs from the node. The results will be displayed in a table. The contents of the table can be exported to a CSV file by clicking on the export icon at the top of the PDO configuration window. This is useful for documenting nodes or sharing configurations with colleagues. Page 25 CANopen Magic User Manual The configurations of the PDOs can be changed by clicking on cells in the table. Note that some nodes may not support changing all of the options and will generate abort errors when an attempt to make changes is made. Any cell that is gray cannot be changed. To enable or disable a PDO click on the checkbox in the Enable column. To enable or disable all PDOs in one go click on the checkbox icons in the toolbar of the PDO configuration window. Names are given to PDOs by defining them in the CAN messages window. See the section later in this chapter for details. Disabled data mappings are shown in read. Enabled data mappings are shown in green. If the node supports changing the data mappings then click on the mappings cell to edit it. Click on the yellow plus symbol to add a new mapping entry. Select a mapping entry and then click on the red “X” to delete it. Click on the blue up and down arrows to reorder the mapping entries. Click on a mapping entry to choose a different object dictionary entry. When OK is clicked the application will attempt to write the new PDO mappings to the node. 5.3 Network Description The network description is a central place where aspects of the CANopen network can be defined or described. By adding information about the network the user interface of the application is improved. For example by giving a name and EDS/DCF to a node the name will appear throughout the application and custom object dictionary entries can be easily chosen when needed. The network description window can be opened by choosing Edit Network Description... from the Network menu or clicking on the Network Description toolbar icon. The network description is divided into the following sections: • • • Nodes Network process data Abort codes Page 26 CANopen Magic User Manual • • • Error codes Device types Vendors The CANopen standard defines a set of abort codes, error codes and device types and these values are built into the application. In addition a set of basic CANopen vendors is also built into the application. The network description window allows you to override or add to these lists of definitions. For example to add a new abort code: 1. Click on the Abort Codes tab 2. Click on the yellow “+” icon to add a new entry 3. Click in the Abort Code box and enter a new 32-bit value in decimal or hexadecimal (prefix with “0x”) 4. Click in the Name box and enter a name Once added if a node transmits the custom abort code then the name of the code will show up in the trace window and error messages. To delete the custom abort code click on the row header so a small black triangle is shown then click on the red “X” icon to delete it. Editing of error codes, device types and vendors works in the same way. Defining nodes is essential for medium or large network as it makes it easier to determine which node is which without relying on node identifiers. It is not required to define a node in the network description in order to access it, but it does make it easier. To define a node: 1. 2. 3. 4. 5. Click on the Nodes tab Click on the yellow “+” icon to add a new node Choose a node id from the drop-down list Click in the Name box and enter a name Click in the EDS/DCF box and choose a EDS/DCF for the node To delete the node click on the row header so a small black triangle is shown then click on the red “X” icon to delete it. Process Data is the real-time data being transferred on the network. For example a temperature monitoring node might periodically transmit a PDO containing the current temperature. By working with the Process Data section of the Network Description it is possible to display these values in the application. To illustrate how this works we are going to create a fake PDO containing a couple of different temperature values and then display them in the trace window. Open the CAN messages window and create the following two messages: • Identifier = 0x181, length = 2, data = 0x00, 0x00, transmit on keypress F1 Page 27 CANopen Magic User Manual • Identifier = 0x181, length = 2, data = 0xFF, 0x03, transmit on keypress F2 Connect to a network, start the trace recording and press F1 then F2. You will see two TPDOs from node 1 transmitted. The first contains the value zero. The second contains the value 1023. This might come from a 10-bit ADC for example. In the Network Description window complete the following steps: 1. 2. 3. 4. 5. 6. Click on the Network Process Data tab Click on the yellow “+” icon to add a new entry Click in the Name box and enter “Temperature” Click in the PDO Message ID box and enter “0x181” Make sure Start Bit is set to zero Choose “Unsigned16” as the type from the drop-down list. This will set the bit size to 16. 7. Keep the Pre Offset and Post Offset at zero. 8. Click on the Scale Factor box and enter “0.195503” 9. Click in the Units box and enter “F” 10. Click elsewhere in the window to ensure the changes are used If you now look at the Process Data column in the trace window it will show the temperature contained in the PDOs. Using the scale factor we can see that the maximum raw value of 1023 corresponds to a real value of 200 degrees Fahrenheit. Note that the process data column is included in exports of the trace recording, which is ideal for documentation, debugging and analysis of the network. The start bit corresponds to a bit in the PDO. PDOs can contain up to 64 bits of data so this value can be in the range zero to 63. The diagram at the bottom of the Network Description window shows how the offsets and scaling factor are applied. Raw data is received from the CAN bus and the pre offset is added. Next the value is multiplied by the scaling factor. Finally the post offset is added to obtain the real value to be shown in the trace window. 5.4 Process Data Display The Process Data window shows real time data in graphical formats, such as meters and graphs. To use this window the process data must have been previously described in the Network Description window. Page 28 CANopen Magic User Manual To open the window choose Process Data... from the View menu. The window has two two modes, locked and unlocked. When locked the graphical controls cannot be edited. When unlocked the controls can be edited. The mode is toggled by clicking on the padlock icon on the toolbar in the window. Initially the window is locked so click on the icon to unlock it. When the window is unlocked a grid will be shown. Controls will snap to the grid when moved or resized. To change the size of the grid choose a new setting from the drop-down list in the toolbar in the window. Choosing None disables the grid and snapping feature. To add a new control click on one of the toolbar icon and then click anywhere on the grid. The control will be added. To move a control drag it around with the left mouse button pressed. To resize a control click on it to show a highlighted border and then drag the border in any direction. To delete a control right-click over the control and choose Delete from the menu. Controls generally should not be overlapped however the order of overlapping can be modified by right-clicking on a control and choosing Bring to Front or Send to Back. Once a control has been added it can be customized and associated with process data that has been defined in the network description. To edit a control right-click over it and choose Edit... The features enabled in the edit window depend on the type of control and are selfexplanatory. The update of the controls in the window with process data can be enabled or disabled. This is useful to allow pausing of the display for analysis. To enable or disable click on the run/stop icon in the toolbar in the window. The following short tutorial follows on from the steps in the Network Description section, which described how to create a PDO containing a temperature value and display the value in the trace window. 1. 2. 3. 4. 5. Unlock the Process Data window by clicking on the padlock icon Click on the meter toolbar icon then click on the grid to add a meter Resize the meter so it is a size you like Right click on the meter and choose Edit... from the menu Click on the Process Data tab and from the drop-down list choose “Temperature (0x181, Unsigned16)” 6. Click on the Scale 2 tab 7. Set the start value to zero, end value to 200, Maj Interval to 20 and Min Interval to 2. 8. Change the end of the red range from 100 to 200. The color can be changed if desired by clicking on the red area. Page 29 CANopen Magic User Manual 9. Click on OK 10. Lock the window by clicking on the padlock icon. 11. Ensure the window is “running”. If it is not click on the start process update toolbar icon in the window 12. Press F1 and F2 to see the meter change value. 5.5 Layer Setting Services There are two different types of Layer Setting Services (LSS) supported in the application, standard and FastScan. To view the LSS window choose Layer Setting Services... from the View menu. Detecting all LSS slaves on a network using standard LSS is slow. LSS slaves can therefore be manually entered or detected one at a time. To manually enter a standard LSS slave: 1. Click on the Standard LSS tab 2. Click on the yellow “+” button to add a new slave 3. Click in the boxes in turn and enter decimal or hexadecimal (prefixed with “0x”) values that match the slave's identity 4. Choose an ID to be assigned to the slave from the drop-down list To detect a single standard LSS slave make sure that only one unconfigured LSS slave is on the network and click on the Autodetect Slave button. The found slave will be added to the table. Choose an ID to be assigned to the slave from the drop-down list. The network selection choice will be set to the current network. If the slaves should be reconfigured for a different baudrate then choose the new network from the drop-down list. To assign node IDs to the slaves and optionally reconfigure baudrates click on the Config button or the Config and Store button. The Config and Store button instructs the slaves to store the ID and baudrate in non-volatile memory. Page 30 CANopen Magic User Manual If you choose to reconfigure the baudrates of the slaves then the application will switch to the new baudrate at the end of the procedure. This option should only be used if the network consists of only unconfigured LSS slaves. FastScan LSS offers improvements over the standard version, including faster discovery of LSS slaves on the network. To detect and configure all FastScan LSS slaves in one go choose a starting node ID and click on Scan and Config. 5.6 Read/Write Node Configurations The object dictionary of a node can be saved into a Device Configuration File (DCF). Conversely a DCF can be used to write a configuration to a node. The application supports both scenarios. To view the Node Configuration window choose Node Configuration... from the View menu. Before a DCF can be generated the EDS or DCF of the node must be specified in the network description. This tells the application what object dictionary entries the node supports. To save the configuration of a node into a DCF choose the node from the drop-down list and then click on Save DCF... To update the configuration of a node using a DCF choose the node from the drop-down list and then click on Load DCF... The application also supports the concept of Network Description Files (NCF). A NCF is a single text-based file that contains multiple DCFs one after the other. The structure of an NCF contaning the DCFs of nodes 0x01 and 0x02 would be as follows: [DCF 0x01] ; DCF for node 0x01 goes here [DCF 0x02] ; DCF for node 0x02 goes here NCFs can be easily manually created using Notepad. To generate a NCF click on the Save NCF... button. All nodes on the network must have an EDS or DCF defined in the Network Description. To write a NCF to nodes on the network click on the Load NCF... button. The area at the bottom of the window shows status and error messages. Page 31 CANopen Magic User Manual 5.7 SDO Channels The default configuration is to use the standard SDO channels for accessing SDO servers, which is 0x580 + node ID and 0x600 + node ID. The current SDO configuration is shown in the status bar at the bottom of the main window. The default configuration is suitable for the vast majority of networks but sometimes other SDO channel configurations are needed. The application allows the following choices: • • • Request SDO channels from an SDO manager CiA447 Car Add-on Devices Custom SDO channels To view the SDO Channels window choose SDO Channels... from the View menu. If the network features a node which acts as the SDO manager then no other application or node on the network can access object dictionaries without first requesting a free SDO channel from the SDO manager first. To use this mode choose Request SDOs from SDO Manager from the drop-down list. In order for the application to perform the request it must appear as a minimal SDO server on the network. To configure the minimal SDO server open the Preferences window (Preferences... on the View menu) and click on the SDO Manager tab. Some device profiles implement “fully-meshed” communication. This assigns an SDO channel to every possible combination of node pairs. For example there is an SDO channel for node 0x01 (the client) to access the object dictionary in node 0x02 (the server) and another channel for the reverse situation. This means that the application must act as one of the clients and use the set of SDO channels assigned to that client. The CiA447 Car Add-on Devices device profile is one such profile. When using a CiA447 network one of the CiA447 SDO channel configurations must be chosen by using the dropdown list. Any pair of message identifiers can be used as a custom SDO channel. To define a custom SDO channel: 1. Click on the yellow “+” icon to add a new custom SDO channel 2. Click in the Name box and enter a name for the channel 3. Click in the SDO Request ID and SDO Response ID boxes and enter message identifiers 4. Choose the custom SDO channel from the drop-down list Page 32 CANopen Magic User Manual 5.8 Scripting Python scripts can be created, opened and saved in the application using the built in editor. The scripts are used in the application to provide more flexibility in specific areas, for example the trace filtering. To create a new script choose New Script from the Scripts menu. An editor will open. A script that has been modified and not saved has a “*” shown after it's name. To save the current script choose Save Script or Save Script As... from the Scripts menu. To open a script choose Open Script... from the Scripts menu. It is recommended to use tabs for indentation as any mistakes with the indentation in a python script can cause it to function incorrectly. Scripts can execute the print statement to generate output. The output appears in the script console window, which can be opened by choosing Script Console... from the Scripts menu. Care should be taken when using this feature as it requires significant execution time and may slow the application down. For details of what objects are available in the scripting environment please see the scripting chapter in this manual. 5.9 CANopen Manager The CANopen Manager window shows information about a CANopen manager on the network. To view the window choose CANopen Manager... from the View menu. Upon opening the application will attempt to read the configuration of a CANopen manager at node ID 0x7E. To read a different manager choose a node ID from the drop-down list and click on the Re-Read Manager button. 5.10 Log Player Previously saved trace recording can be replayed. This is useful for quickly generating background traffic to be used during testing. Trace recordings can be generated by exporting from the trace window or using the continuous recording feature, also in the trace window. Trace recordings are saved as CSV files. To view the Log Player window choose Log Player... from the View menu. Click on the Browse... button to choose a trace recording. Click on the play, fast forward and rewind buttons to control the replaying. Page 33 CANopen Magic User Manual 5.11 Device Profile Support Some device profiles require CANopen messages to be interpreted or used in different ways. To choose a device profile to use open the Preferences window (choose Preferences... from the View menu), click on the CANopen Protocol tab and choose a device profile from the drop-down list. If the device profile you are using is not shown choose Generic. 5.12 Node Setup The node setup window allows basic configuration of a node. To view the window choose Node Setup... from the Add menu. To read the configuration of a node choose it from the drop-down list and click on the Read button. To set the message identifiers and heartbeat producer times enter the desired values and click on the Write buttons. If the node supports the heartbeat consumer functionality then entries will appear in the table. Choosing a node from the drop-down list and enter a time will cause the new configuration to be immediately written to the node. If the node supports the emergency consumer functionality then entries will appear in the table. Click in the table cells to enter the configuration, which will be immediately written to the node. 5.13 Node Selection Many windows in the application feature a drop-down list of nodes, allowing you to choose a specific node to access. The default is to show all 127 nodes however this list can be customized in two ways. Right click over the drop-down list to view a menu of options. Choosing Show Named Nodes will show only those nodes with names. To give a name to a node add it to the network description as described earlier in this chapter. Choosing Show Recently Used Nodes will show those nodes that you have been using. Every time a node is selected from a drop-down list it is added to the recently used list, which is shared throughout the application. To clear the list choose Clear Recently Used Nodes from the same menu. In the drop-down list an icon is shown next to each node entry. The icon reflects the current mode of the list. For example a star indicates that it is showing recently used nodes. Page 34 CANopen Magic User Manual Chapter 6 – Simulation 6.1 Overview The simulation system is a sophisticated method of creating and testing CANopen nodes. The system runs multiple copies of the MicroCANopen Plus CANopen stack at full speed allowing for accurate testing. A network can consist of a mixture of simulated and real nodes communicating with each other. The suggested development process is as follows: • • • • Compile the CANopen stack into the nodes needed for the network Simulate and test Retarget nodes for a microcontroller Final testing on hardware The CANopen stack is compiled into a DLL with an API that can be used by the application to execute it. Some example simulation nodes are provided. Purchasing MicroCANopen Plus allows custom nodes to be developed. 6.2 Adding Simulation Nodes To add a simulation node choose New Simulation Node... from the Simulation menu. The simulation node window will open. Choose an identifier to use for the node. Click on the Configure... button to choose a different simulation node DLL and serial number, if desired. To start the node click on the Start button. To stop the node click on the Stop button. If the node does not use Layer Setting Service then a boot up message will be transmitted onto the CAN bus. The feature of the application can then be used to access the node. Once running the Process Image tab in the simulation node window will show the contents of the object dictionary entries containing read/write data. 6.3 Process Data Display The state of process data (real time data) inside the node while it is running can be displayed. To define new process data entries click on the Node Process Data tab in the simulation node window. The default MicroCANopenPlusCiA401.dll simulation node uses a counter to continually increment a 16-bit value stored in the object dictionary entry [0x6401,0x01]. This can be seen by scrolling down the object dictionary table under the Process Image tab. The following steps will illustrate how to add a process data entry for this value. Page 35 CANopen Magic User Manual 1. 2. 3. 4. 5. 6. 7. 8. Click on the Node Process Data tab Click on the yellow “+” icon to add a new entry Click in the Name box and enter “Analog Input” Click in the Entry box and choose entry [0x6401,0x01] Keep Start Bit at zero. Choose Unsigned16 for the type. The bit size will change to 16. Keep the Pre Offset and Post Offset at zero. Enter “0.015259” into the Scale Factor box. Next click on the Visual tab. This section of the window has two two modes, locked and unlocked. When locked the graphical controls cannot be edited. When unlocked the controls can be edited. The mode is toggled by clicking on the padlock icon on the toolbar in the window. Initially the window is locked so click on the icon to unlock it. When the window is unlocked a grid will be shown. Controls will snap to the grid when moved or resized. To change the size of the grid choose a new setting from the drop-down list in the toolbar in the window. Choosing None disables the grid and snapping feature. To add a new control click on one of the toolbar icon and then click anywhere on the grid. The control will be added. To move a control drag it around with the left mouse button pressed. To resize a control click on it to show a highlighted border and then drag the border in any direction. To delete a control right-click over the control and choose Delete from the menu. Controls generally should not be overlapped however the order of overlapping can be modified by right-clicking on a control and choosing Bring to Front or Send to Back. Once a control has been added it can be customized and associated with process data that has been defined under the Node Process Data tab. To edit a control right-click over it and choose Edit... The features enabled in the edit window depend on the type of control and are self-explanatory. The update of the controls in the window with process data can be enabled or disabled. This is useful to allow pausing of the display for analysis. To enable or disable click on the run/stop icon in the toolbar in the window. The following short tutorial follows on from the previous steps where a process data item for the analog input was created: 1. Unlock the Visual section by clicking on the padlock icon 2. Click on the meter toolbar icon then click on the grid to add a meter 3. Resize the meter so it is a size you like Page 36 CANopen Magic User Manual 4. Right click on the meter and choose Edit... from the menu 5. Click on the Process Data tab and from the drop-down list choose “[0x6401,0x01] Analog Input (Unsigned16)” 6. Click on the Scale 2 tab 7. Set the start value to zero, end value to 1000, Maj Interval to 200 and Min Interval to 20. 8. Change the end of the red range from 100 to 1000. The color can be changed if desired by clicking on the red area. 9. Click on OK 10. Lock the window by clicking on the padlock icon. 11. Ensure the window is “running”. If it is not click on the start process update toolbar icon in the window The needle on the meter will slowly increase from zero to 1000 and then swing back to zero when the 16-bit counter wraps around. It is also possible to simulate inputs. The Visual section contains a toggle switch which can be associated with boolean process data, and a dial which can be spun around. Page 37 CANopen Magic User Manual Chapter 7 – Command Line 7.1 Overview Some CANopen Magic functionality is available via a command line interface, allowing usage from batch files or custom applications. The command line interface is called using CANopenMagicCL.exe and has the following command format: canopenmagiccl.exe [options] where [options] is a space separated list of options to use. Options have a long format and sometimes a short format. Long formats start with two hyphens. Short formats start with a single hyphen and use one letter. For example the following two options are the same: --network=”CANopen_1000” -n=”CANopen_1000” Please note that you must provide on a single command line all the necessary options for the application to connect and use the network. Each time you run the application it does not remember how it was last used. To get help use the --help option: canopenmagiccl.exe --help The order of options is important. For example using: --nmt=”0,reset” --nmt=”1,operation” will first reset all nodes and then place node 0x01 in operational state. If these two options were reversed then they would be executed in the reversed order producing a different result. 7.2 Interrogation In order to use the command line interface it must select a specific driver, CAN interface and network, all of what are defined by their names. It is possible to read out the supported driver, interface and network names using the command line application. For example to show the drivers currently available: canopenmagiccl.exe --listdrivers Page 38 CANopen Magic User Manual To choose the loopback driver and then list the available CAN interfaces for that driver: canopenmagiccl.exe --driver=”Loopback” --listinterfaces To choose the loopback driver and the internal CAN interface and then list the available networks: canopenmagiccl.exe --driver=”Loopback” --interface=”Internal” --listnetworks Finally to connect to the loopback driver, internal CAN interface and 1Mbps network then send an NMT command: canopenmagiccl.exe --driver=”Loopback” --interface=”Internal” --network=”CANopen_1000” --nmt=0,reset” This can be shortened to: canopenmagiccl.exe -d=”Loopback” -i=”Internal” -n=”CANopen_1000” --nmt=0,reset” 7.3 Tasks Tasks are options that may appear more than once on a command line and cause something to happen on the CAN bus. This section describes each supported task in turn. NMT The NMT task sends out NMT messages to the network and has the following format: --nmt=”nodeid,state” nodeid is a node ID or zero to choose all nodes on the network. It can be a decimal number or a hexadecimal number with a “0x” prefix. state can be one of the following: • • • • • operational preoperational stop reset resetcomm Examples: --nmt=”0,reset” --nmt=”3,operational” --nmt=”0x5F,stop” Page 39 CANopen Magic User Manual SDODOWNLOAD This task writes data to a node and has the following format: --sdodownload=”nodeid,index,subindex,data,length” --write=”nodeid,index,subindex,data,length” -w=”nodeid,index,subindex,data,length” nodeid is the ID of the node to write to. It can be a decimal number or a hexadecimal number with a “0x” prefix. index is the 16-bit object dictionary entry index. It can be a decimal number or a hexadecimal number with a “0x” prefix. subindex is the 8-bit object dictionary entry subindex. It can be a decimal number or a hexadecimal number with a “0x” prefix. data is a path and name of a binary file containing data to write, or a decimal or a hexadecimal number with a “0x” prefix. If a decimal or hexadecimal value then the maximum size is 64-bits of data. length is the length of data to write in bytes. It can be a decimal number or a hexadecimal number with a “0x” prefix. If a file is being written to the node then set this value to zero. Examples: --sdodownload=”0x01,0x1017,0x00,1000,2” -w=”0x5B,0x2000,0x01,../testdata/myfile.bin,0” SDOUPLOAD This task reads data from a node and stores it into a file. It has the following format: --sdoupload=”nodeid,index,subindex,filename” --read=”nodeid,index,subindex,filename” -r=”nodeid,index,subindex,filename” nodeid is the ID of the node to read from. It can be a decimal number or a hexadecimal number with a “0x” prefix. index is the 16-bit object dictionary entry index. It can be a decimal number or a hexadecimal number with a “0x” prefix. subindex is the 8-bit object dictionary entry subindex. It can be a decimal number or a hexadecimal number with a “0x” prefix. filename is the path and name of the file to store the read data in. Page 40 CANopen Magic User Manual Examples: --sdoupload=”0x01,0x1000,0x00,devicetype.bin” -r=”0x5B,0x2000,0x00,../testdata/myfile.bin” 7.4 Examples Here are some examples of complete command lines. Reset all nodes, read device type of node 0x01 and node 0x4B: canopenmagiccl.exe -d=”Loopback” -i=”Internal” -n=”CANopen_1000” --nmt=0,reset” -r=”0x01,0x1000,0x00,node1_devicetype.bin” -r=”0x4B,0x1000,0x00,node4b_devicetype.bin” Make all nodes operational and set the heartbeat time for node 15 to 500ms: canopenmagiccl.exe -d=”Loopback” -i=”Internal” -n=”CANopen_1000” --nmt=0,operational” -w=”15,0x1017,0,500” 7.5 CANopen Magic Pro Library For developing your own CANopen applications there are two choices: • • Call the command line interface from your application Use the CANopen Magic Pro library (available separately) The command line interface is included with CANopen Magic and is easy to use, however it has some limitations when it comes to developing custom CANopen applications: • • • • Results of operations are human-friendly and not so easy to automatically parse Each execution requires reconnecting to the CAN interface which has a delay involved The functionality is basic and is intended for simple production-line tasks Windows only The CANopen Magic Pro library is a set of C or .NET libraries providing a large amount of CANopen functionality already developed and tested. It can run on Windows or Linux (with SocketCAN). Applications developed with the library can have sophisticated user interfaces constructed with better error detecting and reporting. For more information see: http://www.canopenstore.com/pip/canopen-magic-pro-dll.html Page 41 CANopen Magic User Manual Chapter 8 – Scripting 8.1 Overview When a script is loaded or reloaded it is immediately executed. This means that global variables will be initialized. After loading the application calls functions in the script depending on the script's purpose. The sections of this manual that describe features which use scripts detail the names of functions that are called and how they can be used. 8.2 Editing Python scripts can be created, opened and saved in the application using the built in editor. To create a new script choose New Script from the Scripts menu. An editor will open. A script that has been modified and not saved has a “*” shown after it's name. To save the current script choose Save Script or Save Script As... from the Scripts menu. To open a script choose Open Script... from the Scripts menu. It is recommended to use tabs for indentation as any mistakes with the indentation in a python script can cause it to function incorrectly. 8.3 Debugging If a script uses the print statement then the output will be displayed in the script console. To view the console choose Script Console... from the Scripts menu. Using the print statement can affect performance of the entire application and should therefore be used with care. 8.4 Objects Message This object is used to describe a CAN message, for example it is passed to the functions involved in trace filtering. Fields: • • • • • Length = length of data in bytes Flags = message flags, one or more of: None, Rtr, ErrorFrame Data = byte array Timestamp = date and time of message Id = message identifier Page 42 CANopen Magic User Manual • Name = name of message The message identifier field Id has the following fields: • • Id = message identifier value Ext = true if using 29-bit identifier, false if using 11-bit identifier For example to access the identifier value of a message use: message.Id.Id Page 43