1
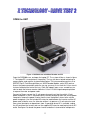
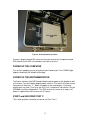
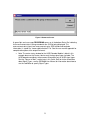
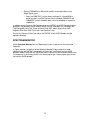
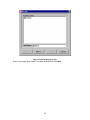
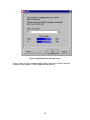
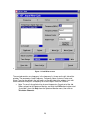
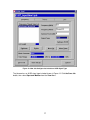
DSS5800 Quick Start Instructions
For Software Version 2, starting with Release 20d
OPEN the UNIT
Figure 1: DSS5800 case with Meter Decoder and PC
Open the DSS5800 case, and open the laptop PC. The system will be as shown in figure
1. The laptop PC is mounted on a hinged tray. The tray can be un-locked rotated up to
expose power cords and the instrumentation below. The instrumentation consists of an
RMT507 Opt S, Field Strength Meter, an 8VSB Decoder Module, and a GPS receiver.
Access the power connection rotate the tray up, you must first un-lock the 1/4 turn transit
fastener located at the front of the tray. Close the laptop if open, use a screwdriver or a
coin to rotate the fastener counter clockwise 1/4 turn. Lift the hinged computer platform
to expose the meter and power cords.
Connect to Power, remove the 12 volt power plug and insert into the vehicle 12 volt
power receptacle. If the 12 volt power cord is not long enough to reach the vehicle power
receptacle, remove the power inverter from the case and place it closer to the vehicle
power receptacle. Use the included AC extension cord between the inverter and the AC
power cord inside the case. An alternate solution is to procure a 12 volt extension cord
from a local electronics or department store. If operating where AC is available, unplug
the AC cord from the Inverter and use the supplied AC extension cord to plug into an AC
outlet. See figure 2 to locate the power inverter and other instrumentation components.
2
Figure 2: Instrumentation Locations
Connect a properly located RF antenna to the meter and connect a properly located
GPS antenna to the GPS unit located on right side of the case.
POWER UP THE COMPUTER
Turn on the Laptop by pressing and releasing the Power button. The COMPAQ logo
appears followed by the Window 98 Desktop.
POWER UP THE INSTRUMENTATION
The Power switch on the 8VSB Decoder Module controls power to the decoder as well
as the meter. Turn the Decoder Module power switch on. The switch will and the meter
front panel will illuminate. "1 Port" will appear on the meter display. If the meter
display does not show “1 Port” then the Drive Test 2 software will not initialize. See the
DSS5800 User Manual Appendix A. The GPS receiver will remain on as long as AC
power is supplied from the inverter or an AC source.
START and USE DRIVE TEST 2
This section provides information on how to use Drive Test 2.
3
Start the Drive Test 2 Program by double clicking on the Drive Test 2 shortcut
on
the Desktop. The program will start up immediately. It first initializes the meter and
communicates with the GPS receiver. The Following screen appears.
Figure 3: Drive Test 2 program started
The initial screen shows the Data Tab. The top of the screen shows the job that
is selected, in this case Factory. The center of the screen shows a blue
background area where measured data is displayed. The bottom of the screen
shows a Meter, and GPS status window. A communication icon located at the
bottom left of each status window indicates communication with that device. The
GPS communication icon flashes green indicating there is communication traffic
to the PC from the GPS. Additional information can be obtained by parking the
cursor over the icon, a tool tip message appears indicating the communication
status. To begin collecting measurement data click the Record Continuous
Button. The Factory Job file will automatically be loaded. The Factory job file is
configured such that each time a recording is made it will be preceded with a
user entered comment. Enter a comment in the comment screen then click OK to
continue.
4
Figure 4: Comment Screen
A green light and a message RECORDING comes on in the bottom Status Bar indicating
that measurement data is being recorded to the JOB file being displayed. This
measurement data (signal level measurements plus GPS latitude and longitude
information) is stored in a "comma delimited text" File. See the user manual appendix for
complete description of the output file format.
Note: The center status window for the 8VSB Decoder Module is blank in this
example because the Factory Job has only Analog signal types included. The
8VSB decoder contributes measurement information only to 8VSB signal types.
See the “Figures of Merit” section later in this Quick Start for further information
about Signal Types, see the DSS5800 User Manual for information about how to
use the Job Editor to specify Signal Types.
5
Figure 5: First Recording Screen
Click the Stop Measurements button to stop.
PLOTTING DRIVE TEST 2 DATA
Besides collecting and recording of RF measurement data, Drive Test 2 features a
Plot screen that allows the viewing of recorded data on simple street maps. The map
may be viewed both while measurements are being recorded and after recording has
stopped. Plotting while recording is useful to monitor vehicle movement and visually
verify that the GPS is correctly tracking the vehicle location. Plotting while recording
is stopped allows the program to assign colors to the dots at measurement locations.
The color of the dot represents the magnitude of the measured parameter at that
location.
Click on the Record Continuous button then drive a short distance while recording,
then pull off the road in a safe location. Click the Stop Measurements button, and
then click on the Plot tab. A plot screen similar to the screen below in Figure 6
appears. It shows a colored dot trail over the road or region that was driven.
6
Figure 6: Plot Screen
A colored dot trail has been created. The colors of the dots indicate the magnitude of
the measured parameter according to the palette shown in the bottom right in the
Properties Tab.
A bulls eye
indicates the current GPS location.
Right click on a dot or hold the right mouse button down and drag a box around a
group of dots, and the Drill Data tab automatically appears at the right. The Drill
Data tab displays specific measurement information about the selected dot(s).
Tool bar buttons at the top allows user control of plot features. Park the cursor over
each of the tool bar buttons at the top of the Plot Tab. A tool tip (a text message)
appears describing the function of the button.
Each button, left to right is described next.
Map tracking settings.
7
The checkbox for automatically loading maps as vehicle moves pertains only to
changing from one region (or state) to the next. When a job is started region (or
State) maps will be loaded based on the current GPS location regardless of this
function being enabled or disabled.
Map properties.
8
The map zooms out to show the entire earth.
The map zooms to current country.
The map zooms to current region.
The map zooms to include the entire extent of the drive.
The map zooms to current GPS location.
Zooms the map out (Alt-Arrow Up).
Zooms the map in (Alt-Arrow Down).
The next three buttons defines the meaning of a left mouse click.
Drag a box to Zoom in.
Add a transmitter icon to map.
Manually load region map.
Plots are invaluable for visual representation of the data, easy presentation of data, and
for a fast check of the integrity of data during drive test sessions.
9
Figure 7: Plot of completed Drive Test 2 Example
PRINT OR SAVE COLORED DOT PLOTS
To save colored plots to a file, click on the Capture Screen button in the main tool bar.
This uses a third party screen capture program called SnagIt. A numbered .jpg file will
be written into the jobs DT_Output folder. Example
C:\DT_Output\Factory\SnagIt0001.jpg. The .jpg file can be viewed, manipulated or
printed by graphic image program. By default Microsoft Internet Explorer will display .jpg
images.
Note: A second alternative is to use the Windows Clipboard. Save the window
image to the windows clipboard by pressing ALT PRTSCRN then paste the
image into a program such as Paint. Use the Paint features to print or save to a
file.
To paste into Microsoft Windows applications such as Paint, Word or
PowerPoint first display the screen to be pasted, then press ALT PRTSCRN,
next open the target application, then select Edit:Paste from the applications
menu or use the keyboard shortcut Ctrl V.
10
FIGURES OF MERIT
RF signals come in a variety of formats. Simple CW signals are relatively stable and
constant and can be measured by a simple process of setting a frequency and making a
measurement. However even simple signals may have complex properties. Signals that
are pulsed, or broadcast over a spread spectrum introduce other measurement
complexities. In order to make automated measurements of both simple and complex
RF signal properties from a moving vehicle Z Technology has categorized many signal
properties and grouped them in entities called Signal Types. Each signal type has
important characteristics that can be measured however it may require a huge number
of measurements. The RMT507 Field Strength Meter is capable of generating the
necessarily large amounts measurement data. To make the data easy to visualize and
evaluate, Z Technology has introduced the Figures of Merit (FOM) concept. Figures of
Merit summarize large amounts of measurement data into a few numbers that can easily
be plotted on a map, and viewed to determine signal usability or quality. See the
DSS5800 user manuals for Signal Type and Figure of Merit definitions.
The RMT507 Field Strength Meter is an integral part of DSS5800 Drive Test system.
The meter has three basic measurement modes. These modes are useful in measuring
and characterizing different signal types. The modes are:
1. Set Frequency, Read Meter
•
Used by S5005GPS, S5006GPS, S5007GPS, S5010STR, DVS5100, and
DSS5800 systems.
•
One piece of measurement information (Signal) is recorded to the .dto file
per record, therefore only one item to plot per record in .dto file.
2. Set Frequency, Stream
•
Used by S5010STR system.
•
~230 measurements per second stream from meter to PC.
•
One record written to .dto file per GPS location or user specified time or
distance.
•
Several statistical Figures of Merit (FOM) items to plot per record in .dto
file. Min, Max, Average, Standard Deviation, and High Low Difference.
•
See the S5010STR user manual for specific information about using
streaming signal types.
3. Set Frequency, Sweep
•
Used by DVS5100 and DSS5800 system
•
500 measurements per half second while sweeping a 5, 10, or 20 MHz
band about that frequency.
•
One record written to .dto file per sweep.
•
Several statistical Figure of Merit (FOM) items to plot per record in .dto
file. Integrated Power, Peak Power, High Low Difference, Tilt, and
Standard Deviation.
11
•
See the DSS5800 User Manual for specific information about using
Swept Signal types.
•
Note: the S5007GPS system allows viewing of 5, 10 and 20 MHz
band, but does not allow Figure of Merit recording. S5005GPS and
S5006GPS system hardware does not have sweeping or streaming
capabilities.
In addition to the Figures of Merit generated by the RMT507 the 8VSB Decoder module
generates the following Figures of Merit which are also recorded in the .dto output file.
Tap Energy(dB), Main Tap, Signal to Noise Ratio SNR, Mean Square Error MSE,
Segment Error Rate SER, Sync Lock, and Equalizer Lock.
Each of the Figures of Merit from either the RMT507 or the 8VSB Decoder may be
plotted individually.
SPECTRUM MONITOR
Select Spectrum Monitor from the View menu to view a spectrum of the measured
frequency.
In Figure 8 below, the top half of the Spectrum Monitor Display shows the swept
spectrum from the RMT507, the bottom half shows the Tap Display from the 8VSB
decoder module. Note that the Tap display and its figures of merit are blank because the
first frequency in the factory job file is an analog signal type. Analog signal types do not
activate the 8VSB decoder.
12
Figure 8: Spectrum Monitor Display of an Analog Signal
To view an 8VSB signal we need to create a job that uses and 8VSB signal type. Close
the spectrum monitor by clicking on the
box in the upper right corner, then select the
Data Tab on the main Drive Test 2 page. Click on the New Job button to start a new job
you will see the following screens.
13
Figure 9: New Job Naming Screen
Enter a new name (here “New1” has been entered) then click Next
14
Figure 10: Block Converter Selection screen
If your system has been configured with a Block Converter this Block Converter
Selection screen appears. Click the OK button to continue.
15
Figure 11: Job Editor screen
The new job contains one frequency in the frequency list shown on the left side of the
window. The parameters listed Frequency, Frequency Name, Antenna Factor, and
Signal Type can be edited in the text boxes on the right side of the window. Lets edit
these text boxes and put in a frequency for a local Digital Television Channel.
Note: To see a listing of television channel frequencies Cancel out of the Job
Editor, go back to the Spectrum Monitor, and click the LIVE button to take out of
“Live mode”, then click Help from the Spectrum Monitor menu, then click on
Television Channels.
16
Figure 12: New Job Configured to include an 8VSB Signal Type
The job now has an 8VSB signal type included shown in Figure 12. Click the Save Job
button, then select Spectrum Monitor from the View Menu.
17
Figure 13: Spectrum Monitor of an 8VSB Signal Type
Figure 13 shows the Spectrum Monitor with an 8VSB Signal Type. The Tap display
generated by the 8VSB decoder is now active, and the 8VSB decoder figures of merit
are displayed on the bottom right sided of the window.
Note: Both the Sync and EQ Lock lights are green. This indicates that a DTV
receiver would get a picture.
Close the Spectrum Monitor, and re-select the Factory Job from the Job drop down box
on the main Data tab to continue.
EXITING DRIVE TEST 2
When the drive test is complete, exit the DRIVE TEST 2 Program by selecting EXIT from
the FILE menu or clicking on the
box in the upper right corner. Exiting will return to
the Windows Desktop.
DRIVE TEST 2 – FILE MANAGEMENT CONCEPTS
DriveTest 2 keeps track of data by creating a directory structure on the hard disk.
The concept of jobs is used. Each job has a unique name, and represents a group of
user selectable meter settings and a frequency list. If Drive Test 2 doesn’t find any
18
job files in the C:\DT_Input directory, it creates FACTORY.JOB. This file sets factory
defaults, and may be used as a template to create other job files by clicking on the
Edit Job button changing the frequency list and other settings, then clicking the
SAVE AS button and entering an new job name.
Each job has an input file in C:\DT_Input. With a .job extension and an output folder
in C:\DT_Output. Each output folder contains one Drive Test 2 Output file (.dto
extension), a datalayer (consisting of three files .dbf, .shp, and .shx extensions), a
usage and error log file (.pgm extension) and a map properties file containing a list of
states or countries encountered in the job (.ini extension).
The .dto file is the master data output file. The datalayer is the information that
makes up the colored dots showing measurements on the map. If datalayer files are
removed from the output folder, they will automatically be recreated from the .dto file
next time Drive Test 2 selects that job. Using this feature it is possible to deselect a
job, remove the map layer data files, edit the .dto file to remove unwanted data
records, then select that job and automatically re-create the datalayer files which
updates the plots.
HELPFUL SUGGESTION
Until familiar with the drive testing process, an operator may want to divide large
area drives into several smaller driving segments. As a first step, start with a 10
minute drive segment, and work up to more extended sessions. The only limit on
how long a drive session can be is determined by the amount of available disk
space. 2.5 Megabytes per hour is a conservative estimate of disk space usage.
A complete drive test can be done in as many segments as needed. Each segment
is appended to the .dto output file. The factory job output file is
C:\DT_Output\Factory\Factory.dto.
For jobs that create datalayer files larger than 10 Megabytes, you may find that
response to button clicks are sluggish, or the system starts to get behind in
refreshing the map. If this occurs you may want to consider one the following
options to improve responsiveness.
1. View the Data Tab while recording measurements.
2. Turn off the datalayer. Do this by clicking on the Map Properties button in the
PLOT tab, then click the Data selection then uncheck the Show box.
3. Start a new identical job to record data into. To do this, Click on the Edit Job
button. Then click on the Save As button, Click OK to the message that
appears. Enter an appropriate job name then click OK. Record data into the
new job. When your job is complete you can copy the new recorded data from
it’s .dto file into the original job’s .dto file delete the original jobs datalayer files,
then select that job, DriveTest will re-create the datalayer files with all your
recorded data, then your entire drive will be visible on the PLOT tab for analysis.
If you start a job and the GPS bullseye shows that you are on a bridge, an island, or on
water (due to course or low resolution region/state/country boundries or outline map
layers) The GPS bulleyes may not be located within a defined region and local region (or
State) maps will not load. To manually load these maps click on the
19
Load Maps
Manually button in the Plot Tab toolbar, then click on an area of the map that is clearly
within the region of maps you want to load.
START A NEW JOB
Click the New Job button to start a new job, enter a name for the job.
Example: Enter a new job name New1. A new .job input file in the DT_Input folder is
automatically created. When the Record Once or Record Continuous button is clicked
a new output folder and .dto output file is automatically created in the DT_Output folder.
The new output path and file is C:\DT_Output\New1\New1.dto
TURN OFF THE SYSTEM
The computer will automatically turn off when it is shutdown. Use the normal Windows
shutdown procedure. Click the START button, then select Shut down. Click the Shut
down radio button, then Click OK.
The meter can be turned off by depressing the red POWER button on the face of the
meter.
The GPS receiver will remain on until power is removed from the power inverter or the
AC plug.
Drive Test 2 Export Wizard (DTExport) and Optional Microsoft
MapPoint
This product includes an Export Wizard called DTExport (Drive
Test Export) that allows Drive Test 2 data to be exported into
simple columnar comma delimited text files (.txt extension) with
field headings.
The user may select the fields at the time of export from a list of available fields. The
fields may be exported in any user selected order. The available fields depend on the
Signal Type. “Signal”, all GPS parameters, and all Figure of Merit parameters are
available for Export.
DTExport was specifically designed to create data files that can be imported into spread
sheets, data bases, and CAD or GIS programs.
DTExport includes a special MapPoint format that creates data files compatible for
import into Microsoft MapPoint. When the Microsoft MapPoint option is installed, a
MapPoint button appears on the Drive Test 2 main tool bar and DTExport automatically
defaults to MapPoint export format.
To display measurement data on the Microsoft MapPoint map, data must first be
exported from Drive Test 2 using the MapPoint format, then Imported to MapPoint.
To export data for MapPoint, click the Export Lat, Lon button in the Drive Test main
toolbar. The first DTExport screen shows a list of frequencies that may be exported.
20
Each frequency may be exported separately to a different file, all export files are
automatically named and written to the jobs DT_Output folder. The name of the exported
file is based on the original job name, the frequency, the frequency name, the signal
type, and the export format. The export format codes are “MP” for MapPoint, “Gen” for
Generic format. Example: C:\DT_Output\Factory\Factory, 100.000000,FREQ
1,ANALOG,MP.txt.
See the User manual for a more in depth explanation of the DTExport Wizard
capabilities.
Figure 14: DTExport – Frequency selection screen
Select a frequency then click the Next button a new screen appears with
Latitude, Longitude, and Signal parameters automatically loaded into the right
hand Parameters to Export box.
21
Figure 15: DTExport – Left Screen- Analog Signal Type, Right Screen 8VSB
Signal Type parameters to export
Click OK to advance to Complete the Export. If MapPoint is not installed, the
Export format defaults to Generic. The Generic format allows the user to
export in any number of fields in any order from right hand Parameters
Available box to a columnar comma delimited text file with field headings.
Use the Generic export format to create import files for other applications and
databases.
A completion bar follows the progress of the export. When complete the user
may exit or select another frequency to export.
Figure 16: DTExport – Completion, Exit or select another Frequency
Exit by clicking N .
The Drive Test 2 screen re-appears.
Click on the MapPoint Button.
MapPoint starts up.
Select Data: Import Data Wizard from the MapPoint main menu.
22
Figure 17: MapPoint – Data: Import Data Wizard Menu item
23
Figure 18: Import Data Wizard - .txt data file type
The MapPoint Data Import Wizard automatically displays a browse window to locate the
file to be imported. Set the import file type to (.txt)
Browse to the current Job DT_output folder.
Figure 19: Import Data Wizard – Browsing to the current Job DTOutput folder
24
Double click on the current DTOutput Folder, in this case Factory. An separator
character screen appears.
Figure 20: Import Data Wizard - choose separator character
Click Next to continue. Another import screen appears
Figure 21: Import Data Wizard - Column Headings
25
Click Finish to complete importing the data. A completion bar indicates the data
being imported into MapPoint. After the data has been Imported, a screen
appears to query how you would like MapPoint to display the data.
Figure 22: Data Mapping Wizard - Choosing Map Type
Select the Multiple Symbols button, then Click Next. A Data Fields screen
appears next to display the fields to be imported.
26
Figure 23: Data Mapping Wizard - Data Fields
Clicks Next to continue. A Legend screen appears.
27
Figure 24: Data Mapping Wizard - Legend
The Legend screen allows you to change the number of ranges, the colors and
how the data is plotted.
Click Finish to use the defaults.
Completion bars display as the data is drawn on the map.
28
Figure 25: MapPoint displaying Imported Data
The map automatically zooms into the area of the data.
Zoom and Pan on the data, analyze as you wish using the MapPoint user
interface.
When done exit the program by selecting File: Exit from the main menu. A Save
Changes screen appears.
29
Figure 26: MapPoint – Save Changes?
If you choose Yes, the next time MapPoint is started it will zoom to the current
position and zoom setting, and display the imported data.
If you choose No it will start up its previous position and zoom setting.
30