1
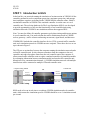
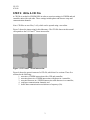
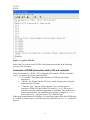
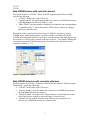
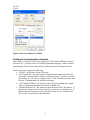
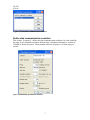
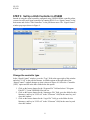
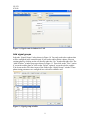
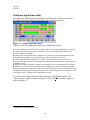
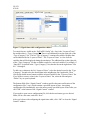
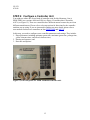
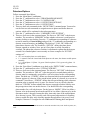
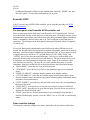
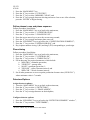
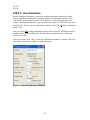
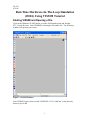
CE 474
8/31/06
Real-Time Hardware-In-The-Loop Simulation
(HILS) Using VISSIM Tutorial
Starting VISSIM and Opening a File
Click on the Windows START button, go to the All Programs menu and find the
PTV_Vision directory. Start VISSIM by selecting the executable file. The following
window will open on your screen.
Figure 1, VISSIM Window.
Once VISSIM is open, browse to the VISSIM file “US12_3rdSt.inp” in the directory
shown to you in lab.
1
CE 474
8/31/06
STEP 1: Introduction to HILS
In the last lab, you practiced running the simulation of an intersection in VISSIM. All the
controller parameters (such as minimum green time, maximum green time, and passage
time) and phase sequence are defined in the VISSIM NEMA controller editor, which is
an emulated controller in VISSIM. This emulated controller is not the same as a real
controller unit. The real-time hardware-In-The-Loop Simulation (HILS) was developed
to provide opportunities to fully test the functionality of real controller units using
simulation networks. VISSIM is one simulation software that supports HILS.
Note: You need to define all controller parameters such phase timing and detector options
in a real controller unit. You need to define the traffic simulation network in VISSIM
such as geometry , traffic volumes and turning movements, signal heads, and detectors.
VISSIM HILS includes the controller interface device (CID), an actual traffic controller
unit, and a simulation network in VISSIM run on a computer. These three devices are set
up as shown in Figure 2.
The CID acts as an interface between the computer running the simulation network and a
real traffic controller unit. It relays detector actuations from the computer to the real
controller unit and relays phase status from the real controller unit to the computer. It
allows actual traffic controller units to replace emulated controllers in simulation models
by exchanging information between simulation model and actual traffic controller unit
through two-way communication channels. A VISSIM simulation network with multiple
intersections can be connected to multiple CIDs and controller units.
Computer running VISSIM
simulation network
Controller unit
CID
Detector
actuations
Detector
actuations
Phase status
Phase status
Figure 2, HILS setup.
HILS needs to be run in real-time to coordinate VISSIM simulation and real controller
units, which means the simulation speed in VISSIM should be set as 1 simulation second
per second.
2
CE 474
8/31/06
STEP 2: Write A CID File
A CID file is needed in VISSIM HILS in order to associate settings in VISSIM and real
controller units with each other. These settings include phase and detector setup and
communication channels.
Note: CID files are text files (*.cid), which can be opened using a text editor.
Figure 3 shows the intersection for this laboratory. The CID file shown in this tutorial
corresponds to the US12 and 3rd Street intersection.
Figure 3, US12 and 3rd Street intersection.
Figure 4 shows the general content of a CID file, which has five sections. These five
sections do the following:
1. associate a VISSIM intersection with a CID and controller;
2. associate phases in a VISSIM intersection with phases in a controller;
3. associate detectors in a VISSIM intersection with detectors in a controller;
4. configure communication channels; and
5. define data communication resolution as a frequency (Hz).
3
CE 474
8/31/06
Figure 4, A generic CID file.
Each of the five sections in the CID file is described in more detail in the following
sections of the discussion.
Associate a VISSIM intersection with a CID and controller
In the first section of a CID file, “SCJ Assignment [SCJ number, CID-ID, ControllerType]”, you need to specify the following fields:
• “SCJ number”: the signal control number in VISSIM for the subject
intersection;
• “CID-ID”: the ID index for the CID in use, which is displayed in red on the
right side of the CID; and
• “Controller-Type”: the type of the controller. There are four types of
controllers: NEMA TS1 and NEMA TS2 (mode 0, 1, or 2). Each type of
controller represents a different generation of controllers. Four numbers are
used to represent these four controller types separately and they are 1, 2, 3,
and 4, respectively. You need to use 1 for “Controller-type”.
If the signal control number in VISSIM is 1 for the subject intersection, the CID ID index
is 1, and the controller type is 1, then the first section should be set as “1,1,1” as shown in
Figure 4.
4
CE 474
8/31/06
Map VISSIM phases with controller phases
The second section of a CID file, “Phases [CID-ID, SignalGroup-ID, Phase-Called]”,
specifies the following:
• “CID-ID”: the ID index of the CID in use;
• “SignalGroup-ID”: the signal group number for a phase in a VISSIM intersection
as the highlighted field shown in Figure 5 ; and
• “Phase-Called”: the phase number configured in a controller unit corresponding to
a “SignalGroup-ID”. Later in this tutorial, STEP 4 shows you how to configure
phases in a controller unit.
Each phase needs a separate line in this section of a CID file. A good way to map
VISSIM phases with controller phases is to follow NEMA conventions in both the
VISSIM intersection and controller unit. If there is an intersection with eight phases, then
this section of a CID file can be written as shown in Figure 4. For example, defining the
connection between the VISSIM signal group 2 for intersection 1 and phase 2 in the
controller would be (1, 2, 2).
Figure 5, Signal head window.
Map VISSIM detectors with controller detectors
The third section of a CID file, “Detectors [CID-ID, Detector-Number, Detector-Length,
Channel-ID]”, specify the following:
• “CID-ID”: the ID index of the CID in use;
• “Detector-Number”: detector number for a detector in a VISSIM intersection as
the highlighted field shown in Figure 6;
• “Detector-Length”: the length of the subject detector as specified in the second
field of the detector window as shown in Figure 6, in meters; and
• “Channel-ID”: the channel ID index in the CID that relays actuations on a
detector in a VISSIM intersection to a controller unit.
5
CE 474
8/31/06
Figure 6, Detector window in VISSIM.
Configure communication channels
This section, “Channels [CID-ID, SCJ-Channel-ID, CID-Channel-ID/Phase, ChannelDirection-1/0]” is usually used in a VISSIM programming language, vehicle actuated
programming (VAP) for providing external vehicle input and collecting traffic data.
Fields in the section specify the following:
• “CID-ID”: the ID index for the CID in use;
• “SCJ-Channel-ID”: the signal control communication channel specified in the
“Controller Communication” window as shown in Figure 7. In order to activate
this window, you can click on “Signal Control” in the VISSIM main menu, then
click on “Communication” in the pull-down menu.
• “CID-Channel-ID/Phase”: the channel of the CID corresponding to the signal
control communication channel specified in VISSIM; and
• “Channel-Direction-1/0”: the input and output direction of the CID channel. “1”
indicates the channel is used to relay detector actuations to a controller unit. “0”
indicates that the channel is used to relay phase status out of a controller unit.
This section is not needed for this laboratory.
6
CE 474
8/31/06
Figure 7, Controller communication window.
Define data communication resolution
This section, “Frequency”, defines the data communication resolution. Its value should be
the same as the simulation resolution defined in the “Simulation Parameters” window in
VISSIM as shown in Figure 8. The maximum value for frequency is 10 time steps per
second.
Figure 8, Simulation parameters window.
7
CE 474
8/31/06
STEP 3: Set Up a HILS Controller in VISSIM
Instead of using the signal controller configured using VISSIM NEMA controller editor,
you need to add a new signal controller for running HILS. Go to “Signal Control” in the
main menu and click at “Edit Controllers” in the pull-down menu. The “Signal Control”
window pops up as shown in Figure 9.
Figure 9. Signal control window.
Change the controller type
In the “Signal Control” window, go to the “Type” field at the upper right of this window
and select “VAP” in the pull-down menu. Available options at the right side of the
“Signal Control” window changes to what is shown in Figure 10. Select the “Controller
(VAP)” option and fill in the three fields below this option.
1. Click on the browse button for the “Program File” field and select C:\Program
Files\PTV_Vision\VISSIM410\Exe\cid.exe.
2. Click on the browse button for the “Interstages File” field, go to the folder for this
laboratory, and key in “US12.cid” in the “File name” field, hit the enter key, and
close this window.
3. Click on the browse button for the “Logic File” field, go to the folder for this
laboratory, and key in “US12.cid” in the “File name” field, hit the enter key and
close this window.
8
CE 474
8/31/06
Figure 10, Signal control window for VAP.
Add signal groups
Select the “Signal Groups” tab as shown in Figure 10. You only need to have phases that
will be configured in the controller unit. If you need to add or delete a phase, select an
existing phase by clicking on the cell directly under the “No.” header and right click. The
“Add or Delete” window pops up as shown in Figure 11. Then click on the “New” option
if you need to add a phase or click on the “Delete” option if you need to delete a phase.
You do not need to fill values in any of the fields in the “Signal Groups” window. These
phase timing parameters are configured in a real traffic controller unit.
Figure 11, Signal groups window.
9
CE 474
8/31/06
Configure signal times table
The signal times table displays signal display, detector status, and other user defined
information graphically during the simulation run as shown in Figure 12.
Figure 12, A sample signal times table.
Different colors in a signal times table have the following meanings1:
The colors indicate the current state of the signal control. The current simulation time step is on
the right. If detectors are shown in the signal times table, the following colors indicate the
detector occupancy conditions:
► Change from empty (black line) to light blue: A vehicle passes the detector within one time
step resulting in an impulse increase and decrease within one simulation second.
► Change from dark blue to light blue: A vehicle leaves the detector and a new vehicle is
detected within the same time step resulting in an impulse decrease and increase within the same
simulation second.
► Multiple seconds of light blue: multiple events similar to the color change black to light blue.
► Dark blue: A vehicle is detected at the end of the time step. Therefore, a change from empty
(black) to dark blue represents an arriving vehicle that does not leave the detector within the same
simulation second; a longer dark blue bar represents a vehicle waiting on top of the detector. This
corresponds to the ‘|’ symbol in the Signal/Detector record
To create or edit a signal timing table file, open the tab “SigTimTbl Config” in the
“Signal Control” window as shown in Figure 10. The “SigTimTbl Config” appears as
shown in Figure 13.
1
VISSIM 4.10 User Manual, PTV Vision
10
CE 474
8/31/06
Figure 13, Signal times table configuration window.
Two main lists are visible in the “SigTimTbl Config” tab. One is the “Layout of Lines”
list and the other is “Type (Category)”. There is an additional list on the right side of the
“Type (Category)” list. The list “Type (Category)” contains all available variables that
can be added to the list “Layout of Lines”. The “Layout of Lines” is a list of all the
variables that will be displayed during the simulation. The additional list on the right side
of the “Type (Category)” list has available records for a selected variable. For example, if
“State Det” is selected in the “Type (Category)” list, then the list on the right shows “Det
No.” 1 through 8.
To add a new column to the list “Layout of Lines”, select the desired record in the “Type
(Category)” list and select the desired data in the neighboring list if applicable. Then
click on the double arrow button to add the selected variable to the “Layout of Lines” list.
If you’d like to remove a line in the “Layout of Lines” list, select the line and press
“Delete” key on your keyboard.
The bottom field of the “Signal Control” window specifies the name and location of the
configuration file (*.szp), which contains a specified layout of lines. An existing
configuration file automatically saves the most recently specified layout of lines after you
click “OK” at the bottom of the “Signal Control” window.
If you need to create a new configuration file, click the browse button, go to a desired
folder, fill in a file name, and click “Save”.
After you’re done with configuring the signal times table, click “OK” to close the “Signal
Control” window.
11
CE 474
8/31/06
Configure signal display and detector status file
Configure the signal display and detector status file (*.ldp) and save the configuration as
directed in the VISSIM tutorial file for laboratory 2.
12
CE 474
8/31/06
STEP 4: Configure a Controller Unit
You might use either one of two kinds of controller units for this laboratory. One is
PEEK LMD (two versions: 8000 and 9200, see Figure 14) and the other is Econolite
ASC2 (see Figure 15). These two controllers have different menus because they are from
different manufacturers. Please refer to relevant sections for directions for the controller
unit that you are using. If you are interested in finding out more details, please refer to
user manuals for these two controllers on line (PEEK LMD and ASC-2).
In this step, you need to configure some controller parameters and settings. They include:
1. Phase parameters including minimum green time, maximum green time, passage time,
yellow clearance time, and all-red clearance time;
2. Phasing and sequence; and
3. Detectors and options.
Figure 14, The front panel of a PEEK LMD9200 controller unit.
13
CE 474
8/31/06
Figure 15, The front panel of an Econolite ASC2 controller unit.
PEEK LMD Instructions
Note: if you are using an Econolite ASC2 controller, please skip this part and go to
Econolite ASC2.
The front panel of a PEEK LMD9200 controller unit
There are three parts on the front panel of a PEEK LMD9200 controller unit. The first
one is the display window on the upper left of the front panel. The display window can be
programmed to shows phase status, the reasons why phases terminate (phase termination
status), coordination, detector status, and so on. The second part on the front panel is
connectors. The third part on the front panel is a data input keyboard, which is composed
of various pushbuttons.
Go over the data input keyboard and become familiar with the different pushbuttons and
where they are located.
Note: if the display window is dark, press the “Display Light” pushbutton on the upper
right side of the data input keyboard and press “Display Contrast” pushbutton to adjust
the display contrast if necessary.
Clear controller settings
If clearing controller settings is necessary, follow the procedures listed below:
1. Press the “Main Menu” pushbutton;
2. Press the “3” pushbutton to select “3. UTILITIES”;
3. Press the “1” pushbutton to select “1. BACKUP/CLR/RESTART/COPY”;
4. Press the “2” pushbutton to select “2. CLEAR”; and
5. Press the “1” through “5” pushbuttons to clear all controller data and press the
“Enter” pushbutton to confirm data clearing.
14
CE 474
8/31/06
Define phases in use and phase sequence
Before programming a controller unit, there are several notes that you need to be aware
of.
Note 1: if you need help with any command, press the “Help” pushbutton on the data
input keyboard while the display window is showing that specific command. Use the
“PgDn” or “PgUp” to page down or up as needed. After you’re done with reading the
help, press the “Help” pushbutton to return to the command status.
Note 2: At any time, press the “Prior Menu” to go back to the immediate upper level of
command menu and press the “Main Menu” pushbutton to go back to the main menu.
Note 3: You need to press the “Enter” pushbutton on the data input keyboard to confirm a
setting that you have defined right before leaving a command window. Otherwise, the
last setting that you have defined will be lost.
Follow the instructions listed below:
1. Press the “Main Menu” pushbutton if the display window is not showing the main
menu;
2. Press the “2” pushbutton to select “2. PROGRAM/READ MODE”;
3. Press the “2” pushbutton to select “2.CONTROLLER”;
4. Press the “3” pushbutton to select “3.PHASING/SEQUENCE”;
5. Use arrow pushbuttons to move the cursor among different phases;
6. Press the “1” pushbutton to turn a phase off and press the “2” pushbutton to turn a
phase on;
7. Press the “PgDn” pushbutton to define phase sequence; and
8. Press the “2” pushbutton if you want to choose the standard NEMA dual ring phase
sequence. The “8.LEAD/LAG” option is used to define lead and lag protected left
turning movements. Press the “8” and “PgDn” pushbuttons to explore this option.
Phase timing
Follow commands listed below:
1. Press the “Main Menu” pushbutton;
2. Press the “2” pushbutton to select “2.PROGRAM/READ MODE”;
3. Press the “2” pushbutton to select “2. CONTROLLER”;
4. Press the “2” pushbutton to select “2.PHASE TIMING”;
5. The first line shows different phases. Use arrow pushbuttons to move the cursor
around;
6. Press numeric pushbutton on the data input keyboard to assign values to phase timing
parameters. The parameters that you need to define are:
a. “MGR”: minimum green;
b. “PSG”: passage time;
c. “YEL”: yellow clearance interval;
d. “RED”: all-red clearance interval;
e. “MX1”: maximum green 1; and
f. Set all other parameters as zero in the “PHASE TIMING” command window.
15
CE 474
8/31/06
Detectors/Options
Follow commands listed below:
1. Press the “Main Menu” pushbutton;
2. Press the “2” pushbutton to select “2.PROGRAM/READ MODE”;
3. Press the “2” pushbutton to select “2. CONTROLLER”;
4. Press the “6” pushbutton to select “6. DETECTORS/OPTIONS”;
5. Press the “6” pushbutton to select “6. DETECTORS”:
6. There are three sub-commands in the “DETECTORS” command menu. You need to
use the first two sub-commands to assign detectors to phases and define detector
options, which will be explained in the subsequent steps.
7. Press the “1” pushbutton to select “1. MEMORY/CALL/EXTEND”;
8. There are four rows in the command menu. The first row “DET INP” is the detector
numbers. The second row “MEMORY” defines whether a detector is configured as
memory locking or non-locking. Press the “1” pushbutton corresponding to a detector
to turn its memory off (non-locking) and press the “2” pushbutton corresponding to a
detector to turn its memory on (locking). The third row “CALL PH” defines the
phase that a detector calls. The fourth row “EXT/SW” defines the phase that a
detector extends or switches. Note: put in 0 if no phase is called, extended or
switched. The phase that a detector switches is an alternative phase that the detector
extends if its extended phase is not currently on. Some examples for “EXT/SW”
settings are2 :
•
•
•
0/0 = no extension phase, no switch phase;
1/1 = normal. Since the extend and switch phase are the same, the detector would operate
normally;
1/6 = extend phase 1 if phase 1 is green. Switch to phase 6 if it is green only (phase 1 is
not green).
9. Press the “Prior Menu” pushbutton to go back to the “DETECTORS” command menu;
10. Press the “2” pushbutton to select “2. DELAY/STR/DIS”;
11. There are four rows in the command menu. The first row “DET INP” is the detector
numbers. The second row “DELAY” is the time period in seconds during which a
detector must be continuously occupied for a call to be placed on the corresponding
phase. The third row “STR/DIS” defines two functions which are dependent on the
detector options of a detector. If the extend/switch option of a detector is set as true in
command 7 listed above, “STR/DIS” defines the time period during which a detector
actuation pulse is retained once it is gone. If a detector is set as call only, then the
third row “STR/DIS” defines whether the detector responds to further vehicles once
the passage timer times out on this detector. You should fill in the corresponding
phase number for a call only detector. For the last row “MODE”, fill in 0 to define a
detector to be in the normal stretch mode and fill in 9 to define a detector to be in the
disconnect mode. 1 through 8 means the delay timer only times if the enabled phase
for a detector is green. This is usually used with a protected/permissive left turning
phase to enable the delay only when the opposite through phase is in green. For an
example, if detector 5 is assigned to call northbound left turning phase and phase 6
2
Operation Manual – LMD 9100/9200 Menu Driven Actuated controller Units, Peek Traffic Systems, Inc.,
1994.
16
CE 474
8/31/06
(southbound through) is filled in as the enabled phase under the “MODE” row, then
the call to phase 5 is only delayed when phase 6 is in green.
Econolite ASC2
Note: If you are using a PEEK LMD controller, please skip this part and go to PEEK
LMD Instructions .
The front panel of an Econolite ACS2 controller unit
There are three parts on the front panel of an Econolite ACS2 controller unit. The first
one is the display window on the upper left of the front panel. The display window can be
programmed to shows phase status, the reasons why phases terminate (phase termination
status), coordination, detector status, and so on. The second part on the front panel is
connectors. The third part on the front panel is data input keyboard, which is composed
of various keys.
Go over the data input keyboard and become familiar with where different keyss are
located. On the right side of the keyboard are numbers 0 through 9, which can be used for
data entry, selecting an option, and placing simulated calls. The “0” key can also be used
to toggle between yes and no or “X” (on) and blank (off). The “SPEC FUNC” and
“CLEAR” keys are not relevant to this laboratory. Two keys are in the middle of the
keyboard, which are the cursor arrows key and enter key. The cursor arrows key is used
to control the movement and positioning of the screen cursor. It also confirms a data
entry similar to an enter key. The enter key is used to confirm data entry or execute
commands. Some keys on the left side of the keyboard have the following meanings:
• “MAIN MENU”: press this key to go to the main menu;
• “SUB MENU”: press this key to go back to the immediate upper level command
menu;
• “DISPLAY ADJUST”: adjust the display contrast of the display window;
• “STATUS DISPLAY”: press this key and the display window shows phase status,
detector actuation status, the reasons why phases terminate (phase termination status),
and other relevant information;
• “NEXT SCREEN”: press this key, then press the cursor arrows key corresponding to
the desired direction;
• “NEXT DATA”: press this key to search for non-zero data and goes to that field;
• “NEXT PAGE”: press this key to go to the next page. Press the cursor arrows key to
indicate the desired direction; and
• “HELP”: press this key for help information for any command or function that is
displayed in the display window. Press the “HELP” key or “CLEAR” to exit the help
status.
Clear controller settings
If clearing the controller settings is necessary, then follow the procedures listed below:
17
CE 474
8/31/06
1.
2.
3.
4.
Press the “MAIN MENU” key;
Press the “8” key to select “8. UTILITIES”;
Press the “2” key to select “MEMORY CLEAR”; and
Press the “0” key to toggle between selecting an item to clear or not. After selection,
press the “ENTER” to begin clearing.
Define phases in use and phase sequence
Follow procedures listed below:
1. Press the “MAIN MENU’ key to go back to the main menu;
2. Press the “1” key to select “1. CONFIGURATION”:
3. Press the “2” key to select “2. PHASES IN USE”;
4. Press the cursor arrows key to move the screen cursor around;
5. Press the “0” key to toggle and turn a phase on or off;
6. Press the “SUB MENU” key to go back to the “CONFIGURATION SUBMENU”;
7. Press the “1” key to select “CONTROLLER SEQ”; and
8. Key in phase numbers in ring 1 (R1) and ring 2 (R2) corresponding to your design.
Phase timing
Follow procedures listed below:
1. Press the “MAIN MENU’ key to go back to the main menu;
2. Press the “2” key to select “2. CONTROLLER”;
3. Press the “1” key to select “1. TIMING DATA”;
4. Fill in data entry for required parameters, which include:
a. “MIN GRN.”: minimum green time;
b. “VEHI EXT.”: passage time;
c. “MAX1”: maximum green time 1;
d. “YELLOW”: yellow clearance interval; and
e. “RED CLR.”: all-red clearance interval;
5. Set all other parameters to zero except the pedestrian clearance time (“PED CLR.”),
whose minimum value is 7 seconds.
Detectors/Options
Assign detector to phases:
1. Press the “MAIN MENU’ key to go back to the main menu;
2. Press the “6” key to select “6. DETECTORS”;
3. Press the “2” key to select “2. PHASE ASSIGN”;
4. Press the “0” key to assign detectors to desired phase;
Configure detector options:
1. Press the “SUB MENU” key to go back to the “DETECTOR SUBMENU” window 3;
2. Press the “1” key to select “ TYPE/TIMERS”;
3
Press the “HELP” key for definitions for each column.
18
CE 474
8/31/06
3. Select detector type (0 -9) under the “TYPE” column (See class handout or press the
“HELP” key on the keyboard for definitions for different types). Note: ten types of
detector are available, which offers many options. However, this is also confusing.
You can try the following examples to set several different types of detector:
• Call only: select type 6;
• Extend only: select type 1 and input 200 seconds under the “DELAY” column;
• Extend and call: select type 1 and input the extend and delay times as needed.
4. Specify a detector to be memory locking (X) or non-locking (.) under the “LOCK”
column;
5. Input the extend time if needed under the “EXTEND” column. Extend time is the
time during which a call is held, which begins timing when the call is dropped;
6. Input the delay time if needed under the “DELAY” column. Delay is the time during
which a detector must be continuously occupied before a call is placed on a phase;
7. Use the “0” key to specify whether a detector resets vehicle extension.
8. Specify actuations on a detector to be recorded in data logging under the “SYSLOG
ENABLE” column.
19
CE 474
8/31/06
STEP 5: Run Simulation
Before running the simulation, you need to configure simulation parameters, which
include simulation time duration, simulation speed, and simulation resolution. Go to
“Simulation” in the main menu and click “Parameters” in the pull-down menu. The
window “Simulation Parameters” pops up as shown in Figure 16. Fill in 900 in the third
field “Period”. Fill in 10 in the “Simulation resolution” field. Fill in 1 in the “Simulation
speed” field.
Note: please do NOT change simulation speed in order to keep the VISSIM simulation
and the controller unit synchronized. The simulation speed needs to be 1 simulation
second per second.
After you’re done, click “OK” to close the “Simulation Parameters” window. And click
on the play button on the toolbar to run the simulation.
Figure 16, Simulation parameters window.
20
CE 474
8/31/06
STEP 6: View Phase Status on the Front Panel of A
Controller
PEEK LMD9200 controller unit
If you press the “Run Status” pushbutton on the front panel, the display window shows
phase status, detector actuations, minimum green timer timing, maximum green timer
timing, the cycle in effect, and offset in effect and its timer. The first row “PHASE/OL”
has different phase numbers and overlap phase letters. The second row “SP0” indicates
that the normal NEMA settings are in effect. Below each phase, any of the following may
appear2:
• r = a phase is in red (while other phases are in service);
• R = a phase is in its red clearance interval;
• Y = a phase is in its yellow clearance;
• W = a phase is in its walk interval;
• D = a phase is in its don’t walk interval;
• G = a phase is in its green interval; and
• N = this phase is the next phase to receive service.
The decimal dot shown before a phase indicate detector actuations on that phase. Other
displayed parameters including cycle and offset are not relevant with operations of an
isolated intersection. You may see CKSUM FAIL on the right side of the display window,
which doesn’t affect the HILS of this laboratory.
Econolite ASC2 controller unit
If you press the “STATUS DISPLAY” key the display window shows phase status,
detector actuations, minimum green timer timing, maximum green timer timing, passage
timer timing, coordination information, priority information and other relevant
information. The second row shows different phase numbers. The phase numbers shown
directly below the “PHASE” label are those that are in green. You may the following
headers and indicators for timing and detector actuations below different phases 4:
•
•
•
•
•
•
•
•
T/N = Timing/next indicators;
VEH C = Vehicle call or vehicle phase recall;
PED C = Pedestrian call or pedestrian phase recall;
T = Phase timing;
N = Phase to time next, indicated during yellow and red of previous phase timing;
C = Call from associated phase detector;
R = Recall to an actuated phase; and
N = Recall to a non-actuated phase;
The following indicators for timing intervals might appear in the display window:
• MGRN = Minimum green timer timing;
4
Advanced System Controller ASC/2 Family Programming Manual, Econolite Control Products, Inc.
21
CE 474
8/31/06
•
•
•
•
•
•
MAX1 = Maximum timer timing;
YEL = Yellow clearance interval timing;
VEXT = passage timer timing;
RED = All-red clearance interval timing;
GRN HOLD = Phase in hold in green; and
GRN REST = Phase is rest in green.
Other indicators in the display window are not relevant to this laboratory. Please refer to
the provided Econolite controller manual for more details.
22
CE 474
8/31/06
STEP 7: Finish the Following Tasks After Completing the Tutorial.
1. Set the stop bar detector locking/non-locking setting to locking for the eastbound
and westbound right-turn lane.
2. Set the detector delay for the same lane as above to zero.
3. Run the simulation, verifying that your changes have taken effect by viewing the
animations of the simulation run. You will need to make two simulation runs, one
with the detectors set to non-locking and the detector delay set to a value that
seems appropriate to you and the other after having made the changes described
in tasks 1 and 2.
4. Use the node file to access the average delays for each of the turning movements
for both runs. You should see that the delays are different between the two runs.
Explain the differences in terms of the detector settings, traffic operations, and the
resulting controller operations.
5. Evaluate the intersection detection configuration and settings as shown in
VISSIM using Parsonson's six criteria.
23