1
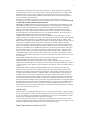
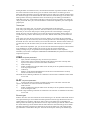
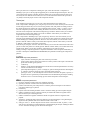
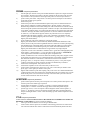
1
The MAGMAS framework: user manual
author: Guy A. E. Vandenbosch
date last modification:18 May 2004
2
TABLE OF CONTENTS
1.
INTRODUCTION
4
1.1
Intended readership
4
1.2
Applicability statement
4
1.3
Purpose
4
1.4
How to use this document
4
1.5
Related documents
4
1.6
Conventions
4
1.7
List of acronyms and abbreviations
4
1.8
Problem reporting instructions
4
2.
OVERVIEW SECTION
5
2.1
Definition of the general physical structure
5
2.2
Overview of the analysis
5
2.3
Information to be supplied to the software (input)
5
2.4
Information supplied by the software (output)
2.4.1
network parameters
2.4.2
radiation parameters
3.
5
5
5
INSTALLATION SECTION
5
3.1
Directory and file information
6
3.2
file creation information
6
4.
4.1
INSTRUCTION SECTION
Starting up information
4.2
The user interface
4.2.1
General information
4.2.2
The main window
4.2.3
The file menu
4.2.3.a Creating a new structure
4.2.3.b Loading an existing structure
4.2.3.c Saving the current structure
4.2.3.d Saving under another name
4.2.3.e Quitting the MAGMAS User Interface
4.2.4
The edit menu
4.2.4.a Frequency parameters
4.2.4.b Physical parameters
6
6
6
6
7
7
7
7
7
8
8
8
8
8
3
4.2.4.c Excitation parameters
4.2.4.d General parameters
4.2.4.e Numerical parameters
4.2.4.f Optimization parameters
4.2.5
The calculate menu
4.2.6
The View menu
4.2.6.a Network parameters
4.2.6.b Radiation parameters
4.2.6.c Currents
4.2.6.d Optimization plots
4.2.7
The Print menu
4.2.7.a Printing a graph
4.2.7.b Writing the graph data in a file
4.2.7.c Exporting an S matrix to ADS
4.2.7.d Configuring the default printer
4.2.8
The Info menu
5.
MAGMAS MESSAGES, WARNINGS AND ERRORS
16
17
17
18
19
19
19
20
20
20
20
20
21
21
21
21
21
5.1
Messages
21
5.2
Warnings
21
5.3
Errors
5.3.a
Memory violation errors
5.3.b
Input errors
Physical error
Numerical error
6.
REFERENCES
21
21
22
22
22
22
4
1.
Introduction
1.1
Intended readership
This document explains how to use the MAGMAS software. It is intended to be used by new users
while getting started and as a reference by experienced users.
1.2
Applicability statement
This user manual applies to the MAGMAS 3D release.
1.3
Purpose
The goal of this user manual is to explain how users have to work with the MAGMAS software. The
manual can be used in two ways. For new users, the fastest way to get acquainted with the software is to
read the instruction section while running the software and to try out all interactions between software
and user described in this section. For experienced users the user manual can serve as a reference.
The MAGMAS software is the implementation of the MAGMAS framework. This framework was
developed to analyze general multilayered planar and quasi-3D structures. The detailed description of
what a multilayered planar or quasi-3D structure is can be found in [1].
1.4
How to use this document
This manual is written under the assumptions that you have access to the MAGMAS software and that
you run the MAGMAS software while reading or consulting this manual. The set up of this manual is
thus based on interactivity. The MAGMAS software consists of a user interface and an analysis engine.
This manual mainly describes the interactive actions with the user interface and the messages, warnings,
and errors, produced by the engine.
1.5
Related documents
Within this manual it is assumed that you are familiar with the terminology used for planar and quasi3D structures. In case you are not familiar with this terminology, you can consult the report on the
physical structures which can be modeled with the MAGMAS framework [1]. There the planar
structures themselves are explained in more detail.
1.6
Conventions
italic: The italic style is used for text which has to be inserted by the user.
bold: The bold style is used for text which has to be replaced by the appropriated information.
Example: filename has to be replaced by the correct name of the file under consideration.
<key>: This is a reference to the key on the keyboard with the name mentioned.
“button” or “menu”: This is a reference to a button or a menu within the MAGMAS software.
1.7
List of acronyms and abbreviations
(S)EEF: (Subsectional) Edge Expansion Functions
GF: Green’s Function
IM: IMaginary part of a complex number
MAGMAS: Model for the Analysis of General Multilayered Antenna Structures
ADS: Advanced Design System, software package to design microwave circuits distributed by Agilent
N parameter: Natural network parameter
RE: REal part of a complex number
1.8
Problem reporting instructions
In case the software shows a problem, this can be reported to the MAGMAS developing team by
phone/fax/email. Their representative is:
Prof. Guy A. E. Vandenbosch, ESAT-TELEMIC
5
Kasteelpark Arenberg 10, B-3001 Leuven, Belgium
Tel. 32-16/32.11.10
Fax. 32-16/32.19.86,
email [email protected].
2.
Overview section
The MAGMAS software is being developed to analyze general planar and quasi-3D structures. The
output consists of: network parameters (S matrix, Z matrix, Y matrix) and radiation parameters (far
field patterns, both co- and cross-polar components, gain and axial ratio).
2.1
Definition of the general physical structure
See the report on the general physical structure [1]. This report allows the user to get an idea on which
physical structures can be analyzed with the MAGMAS framework. The report does not bother with the
details on how to insert these physical structures. This is described in full detail in the instruction
section of this manual.
2.2
Overview of the analysis
This analysis is done by solving Maxwell’s equations for these structures. For experts in the field, a
complete description of the solving procedure is given in the report on the modeling procedure [2].
2.3
Information to be supplied to the software (input)
The information to be supplied to the software mainly consists of the physical structure to be analyzed,
the frequencies at which it has to be analyzed, and the numerical parameters determining the accuracy
of the analysis. A detailed description of all input information can be found in the instruction section of
this document.
2.4
Information supplied by the software (output)
The output of the software concerns the important properties used by designers in the field to
characterize planar structures: network parameters (important for all planar circuits) and radiation
parameters (important for planar antennas).
2.4.1 network parameters
N parameters over a frequency band
S parameters over a frequency band
Z parameters over a frequency band
Y parameters over a frequency band
2.4.2 radiation parameters
far field pattern at specific frequencies
gain at specific frequencies
radiation efficiency at specific frequencies
3.
Installation section
The MAGMAS framework software consists of a user interface and an analysis engine. The MAGMAS
user interface is written for X-Windows, the graphical shell of Unix or Linux. This means that at this
moment MAGMAS only runs on Unix and Linux systems. At this moment it has been successfully
installed on HP-stations, SUN-stations, and on PCs running Linux (several kernels). If you run an older
version of Linux, it may be necessary to install extra files: libc.so.6, libm.so.6, and ld-linux.so.2 in the
directory lib. It is necessary to have a matlab5 license or a gnuplot license available on the computer
where MAGMAS is installed (either matlab or gnuplot is used for visualization, matlab is commercially
available, gnuplot is freeware).
6
3.1
Directory and file information
It is assumed that MAGMAS has been installed in the proper way on your computer. This means that
there is a directory with the name ‘magmasv’ (v is the version number of the MAGMAS software),
which has a subdirectory called ‘interface’. In the magmasv directory, the analysis engine executable
(called magmas.eng) is put. In the interface directory, the user interface executable (called magmas.int)
is put. If ftp is used, be sure that the transfer is done in binary mode. Also check the permissions of the
executable files before starting to work with MAGMAS. If matlab is used for visualization, it is
assumed that matlab is available under the directory ‘/software/matlab’. If matlab is not available under
this directory, this directory has to be created and a link to the real matlab directory has to be made. In
some cases the system manager of the computer system under consideration has to make a specific link
(as root): type “ln -s /software/matlab/extern/lib/lnx86/lib* /usr/lib”. This link is to solve an internal
matlab problem. If gnuplot is used for visualization, please be sure that it is installed properly during
the linux installation. It is always possible to start the MAGMAS software from any other directory by
typing within the call the correct path to the interface directory. To ease the calling of the MAGMAS
engine it is advised that the system manager sets a link (as root): type “cd /bin” and “ln –s
pathofengine/magmas.iem .”. It is also recommended to enclose the directories of the interface and the
engine in the paths of each MAGMAS user.
3.2
file creation information
Running MAGMAS causes a creation or reading of files. Input files for the transfer of data from the
user interface to the analysis engine, intermediate results files, output files for the transfer of data from
the analysis engine to the user interface. The input and output files are created within or read from the
directory specified by the user within the user interface. The intermediate results files are created within
the directory from where the MAGMAS software was called.
4.
Instruction section
At the top instruction level the MAGMAS software is very simple. Basically the only tasks to
accomplish are:
1. the insertion of the physical structure to be analyzed, the frequencies considered, and the numerical
parameters determining the accuracy, a few parameters steering the solving procedure (the insertion
is done with the user interface)
2. the starting of the analysis (the analysis is performed with the engine)
3. after the analysis has been completed, the selection of the output parameters to be visualized (this is
done with the user interface)
4.1
Starting up information
Once logged in, you have to open a Terminal. You can go to any directory you prefer and can start
MAGMAS by typing path/magmasv/interface/magmas.int. The name magmas.int can be replaced by a
user-defined name just by renaming the magmas.int executable file. As a result the main MAGMAS
window should pop up.
Starting up options:
• to choose a user-defined program title in stead of “MAGMAS User Interface” start up with
path/magmasv/interface/magmas.int -title program title
• to choose a background color for all MAGMAS windows start up with
path/magmasv/interface/magmas.int -bg color
• to choose a foreground color start up with path/magmasv/interface/magmas.int -fg color
• to choose a different letter type start up with path/magmasv/interface/magmas.int -fn letter type
• multiple options are allowed, the order of the options is arbitrary.
4.2
The user interface
4.2.1 General information
Choosing from a menu is done by putting the mouse cursor on the menu, by pushing the left mouse
button, and while keeping this button pushed, going with the mouse cursor to your choice in the menu
and letting go the left mouse button.
7
To give input you first put the mouse cursor on the appropriate input location and then you insert the
input parameter using the keyboard.
Input with a certain dimension can be given in a user preferred unit, e.g. a length of 0.1 m can be
inserted by typing 0.1 (meter is the standard unit used within the MAGMAS software) or 0.1 m or 10
cm or 100 mm, etc., and a frequency of 10 GHz can be inserted by typing 1.e10 (Hertz is the standard
unit used within the MAGMAS software) or 10 GHz or 10000 MHz or 1.e7 kHz, etc..
When the input is complex, it has to be inserted by its real (marked RE) and imaginary (marked IM)
part.
Whenever you have to give input to the interface, you will always find two buttons: “OK” and
“Cancel”. The “OK” button is for acknowledging the input given. In case you push this button the
interface really accepts the (new) input. The “Cancel” button is for canceling the input given. In case
you push this button the interface does not replace the old input by the input just given.
In many cases input parameters cannot be chosen completely freely. There is only a limited number of
possibilities for the input. This is automatically taken into account by the interface by using the buttons
“Previous” and “Next”. Pushing these buttons you can only choose between the possible input
quantities.
Parameters which belong together are put in a frame with in many cases a frame title. The title refers to
the type of information within the frame.
Input in a window can only be given when all subwindows of this window are closed.
4.2.2 The main window
Within the main menu, you find six menus; the “File” menu, the “Edit” menu, the “Calculate” menu, the
“View” menu, the “Print” menu and the “Info” menu.
4.2.3 The file menu
Within MAGMAS a structure is named. The input and output parameters of this structure are put in
files with names derived from this structure name.
If it exists in the directory, the structure ‘default’ is the structure that is used by MAGMAS as default,
i.e. the structure automatically loaded whenever MAGMAS is started. This can thus be used to make
user-defined pre-settings of the input parameters.
4.2.3.a Creating a new structure
Choose the button “New”. If you were busy with another structure and did not save the input, you first
get a window with three buttons. “Save”: save the previous structure input, “Discard”: continue with the
creation of a new structure without saving, and “Cancel”: cancel the decision to make a new structure.
The selection of “New” generates a ‘File Requester Window’, which allows to go through the directory
structure of the disk. In this way you can select the directory in which the new structure has to be put.
Once arrived in the right directory, you will get a list of all structures already available in that directory.
You can choose from this list, in case you want to redefine this structure completely, or at the right you
can enter a new name. At the top you will find the complete path of the directory you’re in.
4.2.3.b Loading an existing structure
Choose the button “Load”. If you were busy with another structure and did not save the input, you first
get a window with three buttons. “Save”: save the previous structure input, “Discard”: continue with the
loading of the existing structure without saving, and “Cancel”: cancel the decision to load the existing
structure. The selection of “Load” generates a ‘File Requester Window’, which allows to go through the
directory structure of the disk. In this way you can select the directory in which the existing structure is
put. Once arrived in the right directory, you will get a list of all structures already available in that
directory. You can choose from this list or at the right you can enter the name. At the top you will find
the complete path of the directory you’re in.
4.2.3.c Saving the current structure
Choose the button “Save”. If a name was not yet chosen for the structure (then the structure is named
“Untitled”), see ‘Saving under another name’.
8
4.2.3.d Saving under another name
Choose the button “Save as”. The selection of “Save as” generates a ‘File Requester Window’, which
allows to go through the directory structure of the disk. In this way you can select the directory in which
the structure has to be put. Once arrived in the right directory, you will get a list of all structures already
available in that directory. You can choose from this list, in case you want to redefine this structure
using the current input, or at the right you can enter a new name. At the top you will find the complete
path of the directory you’re in.
4.2.3.e Quitting the MAGMAS User Interface
Choose the button “Quit”. If changes have been made and you did not save the current structure, you
will get a window offering the possibility to cancel the quitting in order to be able to save the current
structure.
4.2.4 The edit menu
Under this menu the physical structure is inserted (for a new structure) or edited (for an existing
structure). This editing is subdivided in six parts: the frequency part, the physical parameters part, the
excitation part, the general parameters part, the numerical parameters part, and the optimization part.
4.2.4.a Frequency parameters
Choose the button “Frequency Parameters” to enter the frequency window.
In the top part of the window, the frequency band of interest to the user can be inserted in two ways.
The first is the standard way: by providing the begin frequency, the end frequency, and the number of
frequency points. After pushing the button “Fill Band”, in this case an equidistant frequency distribution
will be calculated within the user interface. This list can be further modified by choosing within the
frequency window the “Edit” button. Within the subwindow appearing then, you can add frequency
points (“Add Before” means just before the current frequency point in the list, “Add Behind” means just
behind the current frequency point in the list) or delete frequency points. The second is the direct using
of the subwindow to insert the frequency points of interest.
In the bottom part of the window, the frequencies at which the far field and the output parameters
derived from it have to be calculated are inserted separately. THE LIST OF FREQUENCIES
DEFINED HERE HAS TO BE A SUBLIST OF THE LIST OF FREQUENCIES DEFINED IN THE
FREQUENCY BAND OF INTEREST PART. Here the standard way is to define a frequency point list
by adding frequency points (“Add Before” means just before the current frequency point in the list,
“Add Behind” means just behind the current frequency point in the list) and deleting frequency points.
The alternative way is taken by choosing the “Fill Band” button and by inserting a begin frequency, an
end frequency and a number of frequency points. In this case an equidistant frequency distribution will
be calculated within the user interface.
4.2.4.b Physical parameters
If you are not familiar with the structure terminology used within the MAGMAS framework, please
refer to [1], where a detailed description is given.
Choose the button “Physical Parameters” to enter the physical parameters window. The window is
subdivided in eight parts. Left at the top is the ‘Layer Structure’ part. Below this you can find the
‘PTLS Type’ part, the ‘Element Type’ part, the ‘Place Elements’ part, and left at the bottom the
‘Connect Elements’ part, respectively. Right at the top are the graphical representation of the layer
structure, below this the graphical representation of the planar structure, and right at the bottom the
layer structure parameter view part.
Layer structure
The positive coordinate system used within MAGMAS is defined with respect to the layer structure.
The z axis is directed normal to the layer structure. The x and y axis are directed parallel to the layer
structure.
Textual part
LAYER PARAMETERS: these parameters are the permittivities and permeabilities parallel
(transversal) and normal (longitudinal) to the layer structure, and the thickness. In the case of a
9
shielding layer the permittivities are real and the conductivity is the layer parameter that models the
losses in the layer. In the case of a common dielectric layer the permittivities may be complex, which
models the losses in the layer, and no conductivity can be inserted. Only in the case of a uniaxial
dielectric layer the transversal and longitudinal quantities differ. In the case of an isotropic dielectric
layer or a conductor they are identical.
The “Planar”/“Conformal” toggle allows to choose the type of layer structure. In the case of a
conformal layer structure, the radius of the inner cylindrical layer has to be inserted. ONLY PLANAR
LAYER STRUCTURES ARE IMPLEMENTED YET.
SHIELDING LAYERS: With the top “Previous” and “Next” buttons the current shielding layer is set.
The rightmost shielding layer is by definition shielding layer 0. The shielding layers are counted from
right to left. The current shielding layer can be edited by choosing the “Edit” button. This button
generates a subwindow where the layer parameters can be modified. The rightmost and leftmost
shielding layers of the complete structure are HALF SPACES. They extend up to infinity. Although
these half spaces have an infinite thickness you can enter a different thickness. This however has no
effect because MAGMAS always assumes an infinite thickness.
SUBREGIONS: With the bottom “Previous” and “Next” buttons the current subregion is set. The
rightmost subregion is by definition subregion 1. The subregions are counted from right to left. With the
“Add Before” button a subregion can be added at the right of the current subregion, with the “Add
Behind” button a subregion can be added at the left of the current subregion. With the “Delete” button a
subregion can be deleted. With the “Edit” button a subregion can be edited. Adding a subregion
generates a subwindow where the parameters of the new shielding layer can be inserted. When this is
done a new subwindow is generated where the number of dielectric layers in the new subregion can be
defined. The “Add Before” and “Add Behind” buttons allow to add a layer at the right or at the left of
the current dielectric layer. The “Delete” button allows to delete the current layer. The “Edit” button
allows to edit the current layer. Editing a subregion generates a subwindow. The “Add Before” and
“Add Behind” buttons in this subwindow allow to add a layer at the right or at the left of the current
dielectric layer. The “Delete” button allows to delete the current layer. The “Edit” button allows to edit
the current layer.
DIELECTRIC LAYERS: The dielectric layers are counted per subregion from right to left. The
rightmost dielectric layer within each subregion is layer 1 of this subregion.
LAYER INTERFACES: The layer interfaces are also counted per subregion from right to left. The
rightmost layer interface within each subregion (the interface between the right shielding layer and layer
1 of this subregion) is layer interface 0 of this subregion. Layer interface l can thus be found at the left
of layer l.
FINITE LAYER STRUCTURE: By default MAGMAS assumes an infinite layer structure. The
finiteness of a layer structure can be inserted by pushing the “Finite” button, after which the “Edit”
button has to be pushed to further characterize the finiteness. This generates a subwindow where you
can push a “Physical Shape” button or a “Method” button. The “Physical Shape” button generates a
subwindow where you can select a rectangular layer structure, a circular layer structure, or you can
invoke the layer structure designer to define the shape of the layer structure yourself. This works in the
same way as the patch and aperture designer (see further). The “Method” button allows to choose the
technique to model the finiteness of the layer structure. The possible techniques are 2D SIE (2D Surface
Integral Equations) and 3D VPO (3D Volume Physical Optics). Do not use the “User Defined” buttons.
This will generate subwindows where it is possible to choose non-standard truncations of the layer
structure (with small vertical walls at the truncation for example) and to describe in detail the technique
chosen. This is intended for expert users.
Graphical part
The layer structure is graphically depicted (side view: yz-cut seen from the negative x-direction) right at
the top. The half spaces are in blue, the other shielding layers are in orange and the dielectric layers are
in gray. The numbering of the shielding layers and dielectric layers is given. The total thickness of the
layer structure excluding the half spaces is given below the figure.
You can check the layer parameters of a certain layer by putting the mouse cursor on this layer and
pushing the left mouse button. Right at the bottom the layer parameters of this layer are then given. The
“Zoom Layer Structure” button there allows to zoom in on the layer structure.
Planar Transmission Line Structures (PTLS)
10
Pushing the button “Transmission Lines”, the main PTLS subwindow is generated. With the “Previous”
and “Next” buttons the current PTLS type is set. With the “Add” button a new PTLS type can be
added. This button generates a PTLS type subwindow for the new PTLS type. With the “Delete” button
the current PTLS type can be deleted. With the “Edit” button the current PTLS type can be edited. This
button generates a PTLS type subwindow for the current PTLS type. The PTLS type subwindow is
subdivided in five parts. At the left the textual parts: at the top the ‘PTLS Type Name’ part, below the
‘Strips’ part and the ‘Slots’ part, and at the bottom the ‘Characteristic Impedance’ part. At the right the
graphical part.
Textual part
In the ‘PTLS Type Name’ part, you can enter a user defined name for the PTLS type.
In the ‘Strips’ part, using the top “Previous” and “Next” buttons you can select the current subregion.
Below this you can see how many strips are already present in the current subregion. Pushing the
bottom “Previous” and “Next” buttons you can select the current strip. With the “Delete” button you
can delete this strip, with the “Edit” button you can edit it. With the “Add” button you can add a new
strip.
In the ‘Slots’ part, using the top “Previous” and “Next” buttons you can select the current shielding
layer. Below this you can see how many slots are already present in the current shielding layer. Pushing
the bottom “Previous” and “Next” buttons you can select the current slot. With the “Delete” button you
can delete this slot, with the “Edit” button you can edit it. With the “Add” button you can add a new
slot.
In the ‘Characteristic Impedance’ part, you can select how the characteristic impedance of the PTLS has
to be calculated. For a PTLS consisting only of strips or slots, this is done automatically.
Adding or editing a strip or slot generates a PTLS component subwindow. In this component
subwindow you can enter or modify the COMPONENT PARAMETERS, the parameters describing the
component in question.
STRIP component parameters:
1)
2)
(layer) interface containing the strip: See section Layer structure.
location of the center: The lateral coordinate of the position of the center of the strip with
respect to the reference axis of the PTLS under consideration.
5)
width of the strip.
7)
number of subdivisions along the width: used in the analysis for the equidistant subsectioning
of the strip along the width.
8)
conductivity.
9)
thickness: At this moment MAGMAS does not take into account this thickness. It always
assumes zero thickness in the analysis.
The modal current combining coefficients are coefficients to be used when a combination of the modes
is to be used.
SLOT component parameters:
1)
location of the center: The lateral coordinate of the position of the center of the slot with
respect to the reference axis of the PTLS under consideration.
2)
width of the slot.
3)
number of subdivisions along the width: used in the analysis for the equidistant subsectioning
of the slot along the width.
The modal voltage combining coefficients are coefficients to be used when a combination of the modes
is to be used.
Element types
With the “Previous” and “Next” buttons the current element type is set. With the “Add normal” button a
new regular element type can be added. This button generates an element type subwindow for the new
regular element type. With the “Add S-port” button a new S-port element type can be added. This
button generates an element type subwindow for the new S-port element type. With the “Delete” button
the current element type can be deleted. With the “Edit” button the current element type can be edited.
This button generates an element type subwindow for the current element type. The regular element
type subwindow is subdivided in four parts. At the left the textual parts: at the top the ‘Element Type
11
Name’ part, below the ‘Components in Subregions’ part, and at the bottom the ‘Components in
Shielding Layers’ part. At the top right the graphical part. At the bottom right the PTLS part. The “3D
view” button below generates a window where the element type can be looked at from an angle to be
inserted by the user. With the mouse buttons, this view can be scaled and rotated in 3D space. This is
very handy to check the proper location of the components inserted.
Textual part
In the ‘Element Type Name’ part, you can enter a user defined name for the element type.
In the ‘Components in Subregions’ part, using the top “Previous” and “Next” buttons you can select the
current subregion. Below this you can see how many patches, walls, and probes are already present in
the current subregion. By pushing one of the component buttons “Patch”, “Wall”, or “Probe” you can
select the component you want to treat. Pushing the bottom “Previous” and “Next” buttons you can
select the current component of the selected component type. With the “Delete” button you can delete
this component, with the “Edit” button you can edit it. With the “Add” button you can add a new
component of the selected component type.
In the ‘Components in Shielding Layers’ part, using the top “Previous” and “Next” buttons you can
select the current shielding layer. Below this you can see how many apertures are already present in the
current shielding layer. Pushing the bottom “Previous” and “Next” buttons you can select the current
aperture. With the “Delete” button you can delete this component, with the “Edit” button you can edit
it. With the “Add” button you can add a new aperture.
In the PTLS part, using the “Previous” and “Next” buttons you can select the current PTLS. Above this
you can see how many PTLS’s are already present. With the “Delete” button you can delete this PTLS,
with the “Edit” button you can edit it. With the “Add” button you can add a new PTLS.
Adding or editing a component generates a component subwindow. In this component subwindow you
can enter or modify the COMPONENT PARAMETERS, the parameters describing the component in
question.
PATCH component parameters
1)
2)
3)
4)
5)
6)
(layer) interface containing the patch: See section Layer structure.
position of the reference point: This position is a relative position with respect to the reference
point of the element type in question.
conductivity.
thickness: At this moment MAGMAS does not take into account the patch thickness. It always
assumes zero thickness in the analysis.
patch shape: Rectangular (i.e. patch = rectangle) or general. Pushing the buttons “Rectangular”
or “General” causes the starting up of the ‘Patch and aperture designer’.
patch type: Active, i.e. the user imposes a known electric current onto the patch, or passive, i.e.
the patch current is generated by incident fields and is calculated during the analysis. Pushing
the button “Active” causes the starting up of the ‘Patch and aperture current designer’.
WALL component parameters
1) left (layer) interface: interface where the cylindrical wall starts.
2) right (layer) interface: interface where the cylindrical wall stops.
3) position of the reference point: This position is a relative position with respect to the reference
point of the element type in question.
4) conductivity.
5) Polyline of the wall: Pushing the button “Draw” causes the starting up of the ‘Polyline designer’.
6) number of subdivisions in the z-direction of the layers: defines the number of segments in the z
direction in the layers containing the wall.
7) number of subdivisions polyline: defines the number of segments of the line segments of the
polyline.
8) “SideView”: pushing this button causes the starting up of the Wall Designer. Using this designer,
segments of the cylindrical wall can be deleted in order to form a wall.
9) wall type: Active, i.e. the user imposes a known electric current onto the wall, or passive, i.e. the
wall current is generated by incident fields and is calculated during the analysis. Pushing the button
“Active” causes the starting up of the ‘Wall current designer’.
12
PROBE component parameters
1)
2)
3)
4)
5)
6)
7)
8)
9)
10)
11)
12)
left and right layer interface of the probe: Within MAGMAS a probe has to begin and end at a
layer interface. The left layer interface is the layer interface at the left of the probe, the right
layer interface is the layer interface at the right of the probe. See section Layer structure.
position of the probe center: This position is a relative position with respect to the reference
point of the element type in question.
radius of the probe
radius of the probe discs: Within MAGMAS a probe always has to be located between two
planar electric conductors (conductive shielding layers, patches, and lines). The probe is
modeled using attachment current modes taking care of the continuous flow of electric current
between the probe cylinder itself and the planar conductors. The part of the attachment modes
on the planar conductors flows on so-called probe discs that are disc spaced parts of the planar
conductors. The larger the radius of these probe discs is, the more stable the calculation will
be. However, it is evident that for physical reasons, the probe discs have to be completely
embedded within the planar conductors. A basic rule to determine a minimum probe disc
radius is: [probe disc radius]x[highest probe mode number + 1]/[length probe] > 1.5 (see also
highest probe mode number).
probe conductivity: This is the conductivity of the probe cylinder.
highest probe mode number solved numerically: Within MAGMAS the distribution of the
electric current on the probe in the longitudinal direction is taken into account by decomposing
this distribution into cosinusoidal modes. The modes with mode number 0 up to the highest
probe mode number are determined rigorously, the modes with mode number above the
highest probe mode number are determined in an approximate way using analytical
expressions. A basic rule to determine a minimum value is: [probe disc radius]x[highest probe
mode number + 1]/[length probe] > 1.5 (see also radius of the probe discs). ATTENTION:
values higher than 0 will result in a much higher probe computation time.
number of subdivisions in the z-direction: Within the modeling of the probe, integrals over the
probe length occur which have to be evaluated numerically. The number of segments used for
this numerical evaluation is inserted here. Values between 50 and 100 are advised.
probe type: Active, i.e. the probe is fed by a coaxial feed, or passive, i.e. the probe is just a
conductor connecting two planar conductors located in two different layer interfaces.
radius of the coaxial aperture: Only in the active case.
characteristic impedance of the coaxial feed: Only in the active case.
position of the coaxial feed: Only in the active case. Left = in the left layer interface of the
probe, right = in the right layer interface of the probe.
highest mode number for probe-feed coupling: Only in the active case. Within MAGMAS the
coupling between probe and coaxial feed is calculated analytically as an infinite series over the
modes of the probe. You can insert here how many of the series terms you want to take into
account. Values between 20 and 100 are advised.
APERTURE component parameters
1)
2)
3)
position of the aperture reference point: This position is a relative position with respect to the
reference point of the element type in question.
aperture shape: Rectangular (i.e. aperture = rectangle) or general. Pushing the buttons
“Rectangular” or “General” causes the starting up of the ‘Patch and aperture designer’.
aperture type: Active, i.e. the user imposes a known magnetic current onto the aperture, or
passive, i.e. the aperture current is generated by incident fields and is calculated during the
analysis. Pushing the button “Active” causes the starting up of the ‘Patch and aperture current
designer’.
PTLS component parameters:
Within MAGMAS A PTLS ALWAYS HAS TO BE LINKED TO ANOTHER PTLS OR HAS TO
BE FED BY A LINE FEED (see section Connection elements)
1)
PTLS type: the PTLS added is of one of the types defined before.
2)
location of the reference point: The coordinates of the starting point of the axis of the PTLS.
The connection with the other PTLS or with the line feed is automatically made at the other
13
3)
4)
5)
side of the PTLS. This position is a relative position with respect to the reference point of the
element type in question.
length of the PTLS: the distance between the starting point of the PTLS and the location where
the link with the other PTLS or the line feed will be made. Since this length is used for two
purposes: a) it defines the part of the PTLS with which full mutual coupling is taken into
account, and b) it is used to derive the characteristics of the PTLS (propagation coefficients
and characteristic impedances), it has to be sufficiently large, i.e. larger than ca. a quarter
wavelength.
number of subdivisions along the length: used in the analysis for the equidistant subsectioning
of the PTLS along the length.
rotation angle: the angle between the x-axis and the direction of the PTLS.
Graphical part
In the graphical part the element type under consideration is depicted: both a side view (yz-cut seen
from the negative x-direction, y and z direction on a different scale) of the layer structure with the
components, including PTLS’s, embedded in it and a front view (xy-cut seen from the positive zdirection, on scale) is given. The middle of the front view is the reference point of the element type.
Colors used:
• patch: copper-orange
• wall: brown
• probe: copper-orange, probe discs: red
• aperture: blue
• strip: brown
• slot: light blue
The patch and aperture designer
The patch and aperture designer allows to design arbitrary patch and aperture shapes.
“Rectangular” button
In the case the rectangular shape is selected, a subwindow is generated where you can enter the size of
the rectangle along the x-axis, the number of subdivisions along the x-axis, the size of the rectangle
along the y-axis, and the number of subdivisions along the y-axis. The number of subdivisions is used in
the subsectioning of the component. A minimum of 20 subdivisions per wavelength is advised. Pushing
the “Draw” button generates the design window. With the “File” menu you can save the patch/aperture
under a user-defined name. INSERTING/CHANGING THE DATA ALWAYS HAS TO BE
FOLLOWED BY A DRAWING ACTION. OTHERWISE THE NEW DATA ARE NOT
ACCEPTED BY MAGMAS.
“General” button
In the case the general shape is selected, a subwindow is generated where you can enter the size of the
design window along the x-axis, the number of subdivisions along the x-axis of this window, the size of
the design window along the y-axis, and the number of subdivisions along the y-axis of this window.
The number of subdivisions is used to make a drawing grid. The number needed strongly depends on
the exact shape of the component you want to draw and which design method you want to use. Pushing
the “Bricks” button invokes the bricks method, pushing the “Outlines” button invokes the outlines
method (see section Design window). A minimum of 20 subdivisions per wavelength is advised.
Pushing the “Draw” button generates the design window. With the “File” menu you can load or save a
patch/aperture with a user-defined name. This option opens the possibility to re-use an already designed
patch/aperture in another planar structure.
Design window
In the design window you can draw a new patch/aperture or modify an existing one. The “Clear” button
can be used to clear the design window from patches/apertures drawn in it.
BRICKS METHOD: Using this method you can build the patch/aperture out of rectangular ‘bricks’. By
clicking the left mouse button the segment where the mouse cursor is located is added to the
patch/aperture. If it has no neighbor, it turns black, which means that it is impossible in the modeling to
take this segment into account. In other words, this means that the segment is not really added to the
14
patch/aperture. If it has at least one neighbor it turns yellow, which means that the segment is really
added. With the right mouse button you can delete bricks. Continuously pushing a mouse button and
sliding over the design window allows to continuously add or delete bricks. WHEN THE BRICKS
ARE ABLE TO FOLLOW THE CIRCUMFERENCE OF THE PATCH/APERTURE
PERFECTLY, THIS DESIGN METHOD IS VERY STABLE. It is possible to start from a
rectangular shape and to modify the shape using the bricks method. The shape type will automatically
be changed into General.
OUTLINE METHOD: Using this method you can design the patch/aperture by drawing an arbitrary
polygon. Clicking the left mouse button defines a point in the design window. The second point defined
is automatically connected to the first point, the third point to the second point, etc., with a red line.
Clicking the middle mouse button connects the point defined last to the first point, in this way closing
the polygon. A connection can only be made and the corresponding point thus defined if it does not
cross an already existing connection. Clicking the right mouse button removes the last connection
defined and, except for the last connection, the point corresponding to it. Once closed the polygon is
automatically meshed in rectangles and triangles and turns yellow. In the “Options” menu you can
choose between two versions: the “Any point” version, i.e. any point in the design window can be
defined, or the “Raster line” version where only points on raster lines can be defined. If you click a
point, the raster point closest to the point clicked will be defined. At any time you can see at the top the
x and y coordinates of the point that would be defined if you clicked at that moment. THE MESHER
AVAILABLE AT THIS MOMENT WITHIN MAGMAS IS NOT FULLY OPTIMIZED. SINCE
THE MESHING IS IMPORTANT IN RELATION TO THE QUALITY OF THE RESULTS, IN
CASE TRIANGLES ARE USED PLEASE BE CAREFUL WITH THE INTERPRETATION OF
THE RESULTS. A MUCH MORE PERMORMANT MESHER WILL BECOME AVAILABLE
IN A FUTURE RELEASE OF MAGMAS.
The patch and aperture current designer
The patch and aperture current designer allows to impose a user-defined electric current on a patch and
a user-defined magnetic current on an aperture. This current is defined as a function over the xy plane
for the x-directed current and a function over the xy plane for the y-directed current. At this moment
these functions can be entered in MATLAB format. For patches, with the “view current” button you can
visualize the current. For apertures, visualization is not supported within this MAGMAS version.
The polyline designer
You can enter the size of the design window along the x-axis, the number of subdivisions along the xaxis of this window, the size of the design window along the y-axis, and the number of subdivisions
along the y-axis of this window. The number of subdivisions is used to make a drawing grid. The
number needed strongly depends on the exact shape of the polyline you want to draw. Pushing the
“Draw” button generates the design window.
Design window
In the design window you can draw a new polyline or modify an existing one. The “Clear” button can
be used to clear the design window from polylines drawn in it.
You can easily design a polyline by using the mouse buttons. Clicking the left mouse button defines a
point in the design window. The second point defined is automatically connected to the first point, the
third point to the second point, etc., with a red line. Clicking the middle mouse button finishes the
polyline design. This is marked by turning the polyline color into brown. CROSSING OF THE
LINES OF THE POLYLINE IS NOT ALLOWED. Clicking the right mouse button removes the last
connection and the point corresponding to it.
In the “Options” menu you can choose between two versions: the “Any point” version, i.e. any point in
the design window can be defined, or the “Raster line” version where only points on raster lines can be
defined. If you click a point, the raster point closest to the point clicked will be defined. At any time you
can see at the top the x and y coordinates of the point that would be defined if you clicked at that
moment.
Overlapping components
Two patches, a strip and a patch, two apertures, or a slot and an aperture may overlap. However, in
these cases, THE TWO SUBMESHES OF THE COMMON PART OF THE TWO
OVERLAPPING COMPONENTS HAVE TO FOLLOW STRICT RULES. Only in this case
15
MAGMAS will perform the analysis. The submesh of the common part of one of the two overlapping
components has to be defined in such a way that each segment of the common part of the other
component consists exactly of a number of segments of the submesh of the first component considered.
This feature can be used to connect components defined by small segments with components defined by
larger segments. The small segments do not have to be used throughout, which would result in a much
higher total number of segments.
Connected components
Patches, strips and patches, apertures, or slots and apertures may touch. Touching is defined here as:
two components touch if parts of the circumferences of the two components coincide. MAGMAS will
consider the touching components as connected (i.e. electric or magnetic currents flow from one
touching component to another). The meshing will be automatically adapted in the analysis engine.
Patches and walls, or strips and walls may touch. Touching is defined here as: an xy directed edge of a
wall in a layer interface is partially located within a patch or strip. There are strict rules in this case for
the segmenting of both the patch/strip and wall. All the edges of the wall segments located in the
patch/strip have to be located completely within segments of the patch/strip. Otherwise the mesher in
the analysis engine will subdivide the wall segments in subsegments, which is not allowed in this
MAGMAS version. Segments on patches/strips may be subsegmented.
Patches and walls, or strips and walls may also cross, which means that an intersecting line exists. The
same rules for the segmenting of both the patch/strip and wall as in the case of touching hold.
Place elements
Within MAGMAS the Element Type part is used to define element types. The real positioning of
elements of the different types in a structure is done in this part.
With the top “Previous” and “Next” buttons you can select the current element type.
“Add Element” button: With this button you can add a single element. A subwindow is generated where
you can insert the element placement type. Fixed means that you really fix the position of the element.
In this case you can insert the coordinates of the reference point and the rotation angle of the element.
Free means that you tell MAGMAS that there is indeed an element to be added, but the exact position
will be defined later in the Connect Elements part.
“Add Array” button: With this button you can add an array of elements. A subwindow is generated
where you can insert the coordinates of the reference point of the first element of the array, the rotation
angle of this first element, the number of elements in the first translation direction, the number of
elements in the second translation direction, the translation vector in the first direction, the translation
vector in the second direction, the rotation angle in the first direction, the rotation angle in the second
direction. A rotation angle defines the progressive rotation for consecutive elements in the direction in
question.
NOTE THAT ELEMENTS OF THE SAME TYPE HAVE TO BE INSERTED
CONSECUTIVELY. It is thus not allowed to insert an element of a different type between two
elements of the same type.
Once all the elements are defined using the “Add Element” and “Add Array” buttons, you can select a
specific element using the current element “Previous” and “Next” buttons and delete this element or
edit the parameters of this element by pushing the “Delete” or “Edit” buttons.
You can specify whether you want to repeat the complete structure you have defined up to now as
element in an INFINITE ARRAY or not. Pushing the button “Single structure” you select the
option of keeping the structure as defined up to now. Pushing the button “Infinite structure” you select
the option to create an infinite array. This button will generate a subwindow where you can enter
whether you want a linear or planar infinite array, the infinite array translation vector(s), the infinite
array rotation angle(s), and the number of rings. The number of rings is a numerical parameter used in
the analysis of the infinite array. It determines how many rings are actually taken into account during
the analysis. Which number to insert is thus strongly depending on the convergence of the infinite array
problem. You can check this by doing a small convergence study, e.g. comparing the results for 10,
100, and 1000 rings. It is possible that you do not observe any convergence due to strong coupling
between the elements. At this moment, no solution for this problem is implemented. A solution will be
available in the next release of MAGMAS.
Connect elements: PTLS
LINKS, PTLS FEEDS
16
WITHIN MAGMAS EACH PTLS OF EACH ELEMENT OF EACH ELEMENT TYPE HAS
TO BE CONNECTED EXACTLY ONCE, I.E. LINKED TO ANOTHER PTLS OR FED BY A
PTLS FEED. In the connect elements part you can make these connections.
With the “Previous” and “Next” buttons you can select the current connection.
“Add” button: With this button you can add a connection. Pushing this button generates a subwindow
where you can insert the connection parameters.
“Delete” button: With this button you can delete the current connection.
“Edit” button: With this button you can edit the current connection. Pushing this button generates a
subwindow where you can modify its connection parameters.
Connection parameters
1. Connection type: Line Link or Line Feed. A LINE LINK means that in the structure two PTLS’s
(defined within two different elements) are linked by a third PTLS. This is only possible if the two
PTLSs of the two elements 1. are of the same type, and 2. are directed towards each other. This is
automatically checked by MAGMAS. You can only insert connections that fulfill these conditions.
Within the analysis it is assumed that the third line only supports the fundamental PTLS modes. No
coupling with this PTLS is taken into account. The two PTLS’s of the two elements connected also
support higher order modes and all coupling with these PTLS’s is taken into account. A LINE
FEED means that the PTLS is assumed to be fed by its fundamental modes incident at its end. In
this case there is no second element and line. These parameters can thus not be inserted in this case.
2. First element of the connection: This is the element containing the first of the connected PTLS’s.
3. First element ‘s line: This is the PTLS of this element connected.
4. Second element of the connection: This is the element containing the second of the connected
PTLS’s. MAGMAS automatically allows only second elements which can really be connected to the
first element. Elements of the placement type free do not have to fulfill the third linking condition.
Here the definition of the link is also the definition of the exact positioning of such an element. After
the linking of such an element it is also really shown in the graphical representation part.
5. Second element ‘s line: This is the PTLS of this element connected. MAGMAS automatically
selects the possible PTLS’s.
6. (global) Length of link: In the case of a line link, this is the length of the global line, i.e. the distance
between the two starting points of the two connected lines. The global line is thus composed out of
three pieces: 1. the first line of the connection (embedded within the first element of the connection),
2. the second line of the connection (embedded within the second element of the connection), and
the line linking the two. As you can see the lengths of the two lines connected have no effect at all
on the global line length. This is directly inserted within MAGMAS. The lengths of the lines
connected only affect the part of the global line with which coupling is taken into account.
7. Position of reference plane: In the case of a line feed, this is the distance between the starting point
of the line and the position of the reference plane on this line.
Graphical representation of the planar structure
In this part you can see a front view (xy-cut seen from the positive z-direction, on scale) of the global
so-called ‘single structure’, even in case you have inserted an ‘infinite structure’ (see section Place
elements). The infinite repeating of the single structure in this case is not shown. The current element
selected in the Place elements part is shown in a red box. Connections are shown as red lines (line links)
or small red rectangles at line ends (line feeds). The current connection selected in the Connect
elements part is marked by showing the two corresponding elements in two white boxes.
4.2.4.c Excitation parameters
Excitations do not have to be known for the calculation of S, Z, or Y parameters, or for the calculation
of far field parameters generated by a single port excited. They have to be known however for the
calculation of the far field parameters of the complete structure as fed in real circumstances. The
excitations within MAGMAS are inserted in several steps.
Choose the button “Excitation Parameters” to enter the corresponding subwindow.
The first step is the definition of the relation between all the feeds present WITHIN THE ELEMENT
TYPES. This is done in the top part of the window. The possible feed types here are: the active patch,
the active wall, the active aperture, and the active probe (the coaxial feed). The physical interpretation
of an excitation is: for an active patch and aperture it is the complex coefficient with which the active
currents defined in these components have to multiplied in order to get the physically present current,
for an active probe it is the complex amplitude of the fundamental mode component of the exciting
17
electric field distribution in the coaxial aperture. With the top “Previous” and “Next” buttons you can
select the current element type. MAGMAS automatically shows the number of ports within this type.
With the bottom “Previous” and “Next” buttons you can select the current port. MAGMAS shows
automatically the nature of the port (active patch, wall, aperture, or probe). With the “Edit” button you
can edit the complex excitation of this port (amplitude and phase). With the “Update Elements” button
you impose the (new) internal relations for this element type to all elements of this type. Once this step
is done the relation between the internal excitations of the elements are fixed.
The second step is the definition of the relation BETWEEN FEED COMBINATIONS OF THE
ELEMENTS. This is done in the second part of the window by defining functions of x and y, both for
amplitude and phase and for each element type. The meaning of an amplitude function A(x,y) and phase
function P(x,y)is that an element located at (x,y) of an element type with internal feed excitation
amplitudes a1, a2, etc., and phases p1, p2, etc., shows global excitation amplitudes for these feeds equal
to A(x,y)*a1, A(x,y)*a2, etc., and global phases equal to P(x,y)+p1, P(x,y)+p2, etc.. In MAGMAS the
amplitudes are expressed in dB and the product in the amplitude case becomes a summation also. With
the “Previous”, “Next” and “Edit” buttons in this part you can insert all necessary functions. With the
“Update Elements” button you impose the (new) functions for this element type to all elements of this
type.
After the previous two steps, a third step is possible. In the third part of the window, you can edit each
individual port of each element separately. You can use this to modify what you have inserted in the
two previous steps. With the top and bottom “Previous” and “Next” buttons you can select the current
element and the current port within this element. With the “Edit” button you can then edit the excitation
amplitude and phase of this port. Remark that the amplitude and phase shown at first are the amplitude
and phase taking into account the excitation laws within the element type in question defined in step one
and the functions defined in step two.
In the fourth part of the window, you can insert the line feed excitations. The physical interpretation of
such an excitation is that it is the complex amplitude of a fundamental PTLS mode incident at the line
feed position. With the top “Previous” and “Next” buttons you can select the current line feed. With the
bottom “Previous” and “Next” buttons you can select the current line feed mode. With the “Edit” button
you can then edit the excitation amplitude and phase of this port.
4.2.4.d General parameters
Choose the button “General Parameters” to enter the corresponding subwindow. Within this window
you can enter the far field parameters: 1. the number of elevation angles for far field evaluation, and 2.
the number of azimuth angles for far field evaluation. The far field is evaluated in a spherical coordinate
system. The elevation angle is also marked ϑ. In the right half space it is the angle between the positive
z-axis and the direction under consideration. In the left half space it is the angle between the negative zaxis and the direction under consideration. The azimuth angle (also marked Φ) is the angle between the
projection of the direction under consideration in the xy-plane and the x-axis.
Example: If you choose for elevation 90 and for azimuth 4, both in the right and the left half space the
far field will be calculated in the half-planes defined by Φ=0, Φ=π/2, Φ=π, and Φ=3π/2, for the angles
ϑ=0°, 1°, 2°, ..., 89°.
The write intermediate results option is only important for MAGMAS designers and not for MAGMAS
users. Pushing “Yes” causes the software to generate 1. additional intermediate results files, and 2.
plotting facilities.
4.2.4.e Numerical parameters
Choose the button “Numerical Parameters” to enter the corresponding subwindow. Within this window
you can enter the numerical parameters. These parameters affect the accuracy of the analysis. In normal
circumstances however, the user is advised not to deviate from the values advised.
1. the number of expansion wave directions: This number sets the number of expansion wave
directions used in the modeling of coupling between elements. An expansion wave is a physical
wave present in the planar structure traveling between the elements. It is evident that for each
element expansion waves in all directions are emitted (outgoing expansion waves), and expansion
waves are coming in from all directions (incoming expansion waves). Setting the number to a
certain value means that 1. the outgoing expansion waves of the element types are calculated
rigorously in a number of directions, in between interpolation is used, and 2. the element types are
solved rigorously for the expansion waves coming in from a number of directions, in between
18
2.
3.
4.
5.
6.
7.
8.
9.
interpolation is used. Setting 0 means that you do not want to take into account coupling between
elements. Setting the advised value 8 means that you specify the directions Φ=0, π/4, π/2, 3π/4, π,
5π/4, 3π/2,. 7π/4, 2π.
the number of points per free space wavelength: This is the number of equidistant spatial points per
free space wavelength at which the Green’s functions are calculated. The advised value is 500.
Threshold for rigorous GF calculation: This parameter determines up to which distance the Green’s
functions are calculated rigorously. Above the threshold the Green’s functions are approximated by
their expansion wave terms, which in fact consists of an asymptotic expansion for large arguments.
The threshold is expressed in free space wavelengths.
the number of points per k0: Some spectral integrals are calculated numerically. This number sets
the number of points used for the numerical evaluation of the integral within an interval of size k0.
The advised value is 30. If the value given is too small the engine automatically will increase it up to
a suitable value.
complex images for inverse Fourier transforms: value zero invokes the slower, but more accurate
integration procedure for the inverse Fourier transform, value 1 invokes the Discrete Complex
Images Method (DCIM), which is much faster, but a bit less stable.
Testing: choice between Galerkin or razor blade type testing. GALERKIN CAN ONLY BE USED
IN CASE NO WALLS ARE PRESENT.
EEF-use: This parameter determines whether the user wants to use subsectional Edge Expansion
Functions: yes type “1”, no type “0”. These expansion functions incorporate the exact
behavior of the currents near the edges and increase the convergence of the analysis in terms of the
number of expansion functions. In this MAGMAS release, the subsectional edge expansion
functions are only effectively used on the rectangular segments of patches and lines. They are not
used on the triangular segments of patches and on apertures and slots.
Reciprocity: this property can be explicitly used or not used in the calculation of the Green’s
functions.
designer parameters: only for experienced users.
4.2.4.f Optimization parameters
Choose the button “Optimisation Parameters” to enter the corresponding subwindow. Within this
window you can enter whether you want to use the optimisation mode or the plot mode and how you
want to use it. Optimisation within MAGMAS is an iterative process that searches for the values of a
number of input variables in order to reach certain values for a number of output variables. The search
is performed in certain intervals for the input variables. The plot mode allows to make plots of output
variables in terms of input variables. In the top part of the subwindow the input variables are defined, in
the bottom part the output variables are defined.
1. the choice of the mode: With the “Next” button you can select either the optimisation mode (opt),
the plot mode (plot), or the regular frequency sweep mode (off).
2. the number of input variables: This number sets the number of input variables. With the “Add” and
“Delete” buttons you can add or delete an input variable.
3. the current input variable’s number: This number sets the rank number of the input variable under
consideration.
4. Pushing the “Layer” button expresses that this input variable is a layer parameter, pushing the
“Component” button expresses that this input variable is a component parameter. With the “Next”
button the layer or component to consider can be selected. The format for the selection of a layer is
SubiLj which indicates layer j in subregion i.
5. the input variable: With the “Next” button the actual input variable can be chosen. The layer
parameters that can be selected are the thickness (Thickness), the real and imaginary part of the
permittivity (Re(Eps) and Im(Eps)), and the real and imaginary part of the permeability (Re(Mu)
and Im(Mu)). The component parameters that can be selected are the X-position, the Y-position,
the Rotation, the X-scale, the Y-scale, and the Scale of a patch or aperture. In the future, more
parameters will be included.
6. the lower boundary and the upper boundary: They define the interval in which is searched or
plotted.
7. the number of points for a plot, only used in the plot mode
8. the number of output variables: This number sets the number of output variables. With the “Add”
and “Delete” buttons you can add or delete an input variable.
19
9.
10.
11.
12.
13.
the current output variable’s number: This number sets the rank number of the output variable
under consideration.
the output variable: the format for the selection of an output variable is Sij, Zij, Yij. S indicates that
an S parameter, Z that a Z parameter, and Y that an Y paramenter is selected. i and j stand for the
row and column number in the S, Z, or Y matrix.
the wanted value: The real (Re) and imaginary (Im) part of the wanted value for the output variable
under consideration have to be inserted here.
the weight factor for the output variable under consideration
the cost for the output variable under consideration: The cost is the criterion used to stop the
optimization iteration.
4.2.5 The calculate menu
Within this version of MAGMAS, before starting a calculation, you always have to save the planar
structure. If you do not save, MAGMAS will analyze the last version saved of the structure. After
pushing the “Calculate” button, you get the calculation window, where you have several buttons to
organize the calculation procedure. Only direct calculation is supported within this MAGMAS release.
This is invoked by pushing the “OK” button.
It is possible to do an analysis by starting the analysis engine by hand, instead of using the user interface
(see section The analysis engine).
4.2.6 The View menu
Under this menu the results of the analyses can be visualized. You can visualize network parameters (N
parameters, S parameters, Z parameters, Y parameters), radiation parameters (far fields of single ports,
far fields of the complete structure), current graphs, and optimization plots. With the “Close All
Graphs” button you can erase all graphs from the screen.
4.2.6.a Network parameters
Choosing the button “N parameters” allows to visualize the “natural” network parameters of the
structure. The natural parameters relate the natural inputs of the ports to the natural outputs of the ports.
In case of a line feed, the natural input and output are the incoming and outgoing fundamental mode on
the corresponding line; in case of a coaxial feed, the natural input and output are the magnetic current
and the magnetic field in the coaxial aperture; in case of an active aperture, the natural input and output
are the magnetic current and the magnetic field in the aperture; in case of an active patch or wall, the
natural input and output are the electric current and the electric field on the patch. Important are the
cases where only line feeds or only coaxial feeds are used. In these cases the natural parameters
correspond to the S parameters (referenced to the characteristic impedances of the ports in question) or
the Y parameters, respectively. Choosing the button “S parameters” allows to visualize the scattering
parameters referenced to 50 Ohm. Choosing the button “Z parameters” allows to visualize the
impedance parameters, choosing the button “Y parameters” allows to visualize the admittance
parameters. All four are treated in the same way. A subwindow is generated where the number and type
of graphs is managed. Using the “Previous” and “Next” buttons you can select the current graph. Using
the “Add” button you can add a graph. This causes the generation of the port selection subwindow.
Using the “Delete” button you can delete the current graph. Using the “Edit” button you can edit the
current graph. This also causes the generation of the port selection subwindow. You can also set the
type of graph: “Real” = show the real part, “Imaginary” = show the imaginary part, “Amplitude” = show
the amplitude, and “Phase” = show the phase. Real and imaginary part are mostly used for Z and Y
parameters, amplitude and phase are mostly used for S parameters. Up to four graphs can be defined.
They are all shown in the same figure.
In the port selection subwindow you select the ports between which you want to show the coupling.
Using the top “Previous” and “Next” buttons you can select the source element or source line feed. In
the case of a source element using the “Previous” and “Next” buttons below you can select the source
port within the source element. Using the “Previous” and “Next” buttons below this you can select the
observation element or observation line feed. In the case of an observation element using the “Previous”
and “Next” buttons at the bottom you can select the observation port within the observation element.
PAY ATTENTION: THE ORDER OF THE ACTIVE PATCH AND APERTURE PORTS
WITHIN AN ELEMENT IS NOT NECESSARILY THE ORDER IN WHICH THESE PORTS
WERE DEFINED. The numbering is done in the following way: the layer interfaces in which the
20
active patches are located are considered from right to left; within a layer interface the order of the
patches is the order in which they were defined.
4.2.6.b Radiation parameters
Choosing the button “Far Fields Single Ports” allows to visualize the far field patterns of the complete
structure with only one port excited, the source port. The other ports are terminated with their
characteristic impedance. A subwindow is generated. Using the top “Previous” and “Next” buttons you
can select the source element or source line feed. In the case of a source element using the “Previous”
and “Next” buttons below you can select the source port within the source element. PAY
ATTENTION: THE ORDER OF THE ACTIVE PATCH, WALL, AND APERTURE PORTS
WITHIN AN ELEMENT IS NOT NECESSARILY THE ORDER IN WHICH THESE PORTS
WERE DEFINED. The numbering is done in the following way: the layer interfaces in which the
active patches are located are considered from right to left; within a layer interface the order of the
patches is the order in which they were defined.
With the “Left” and “Right” buttons you can choose in which half space you want to observe the far
field. With the “Previous” and “Next” buttons below you can insert the far field cut you want to see.
First you select the azimuth angle for the left side of the cut, then the azimuth angle for the right side of
the cut. In the case question marks appear, this means that no far fields were calculated. Finally you
select the frequency at which you want to observe the far field, and the graph type: “Amplitude”,
“Phase”, or “Axial Ratio”.
Choosing the button “Far Fields Structure” allows to visualize the far field patterns of the complete
structure with all ports excited in the way given in the excitation part. A subwindow is generated. With
the “Previous” and “Next” buttons below you can insert the far field cut you want to see. First you
select the azimuth angle for the left side of the cut, then the azimuth angle for the right side of the cut.
The azimuth angle is the φ-angle (spherical coordinates) of the cut. In order to get a traditional pattern
choose the right azimuth angle equal to the left azimuth angle + 180°. The cut starts at the negative zaxis, sweeps over 180° to the positive z-axis and back over 180° to the negative z-axis. In the case
question marks appear, this means that no far fields were calculated. Finally you select the frequency at
which you want to observe the far field, and the graph type: “Amplitude”, “Phase”, “Axial Ratio”, or
“Gain”. For “Amplitude” and “Phase” the result consists of two curves, one for the θ-component and
one for the φ-components.
The radiation efficiency (radiated power divided by input power) of a structure is given as a message at
the end of the calculation for each frequency point at which the far field is determined (see “Message”
section). This efficiency is calculated using only the far field directions in which the far fields were
calculated. This means that in cases where the far field pattern strongly varies in terms of the far field
direction, the efficiency calculated may be completely erroneous.
4.2.6.c Currents
The visualization of currents is not supported within this MAGMAS release.
4.2.6.d Optimization plots
In the plot mode one or more output variables can be shown in terms of a single input variable. You can
also set the type of graph: “Real” = show the real part, “Imaginary” = show the imaginary part,
“Amplitude” = show the amplitude, and “Phase” = show the phase.
4.2.7 The Print menu
Under this menu the graphs of the view menu can be printed to a file or to a printer, the graph data can
be written in a file, and the full S parameter matrix can be written in a file in cityfile format in order to
be able to incorporate the results into ADS. The setting of the default printer is also done under this
menu.
4.2.7.a Printing a graph
Choosing the button “Print a Graph” allows to print a graph to a file or to the printer. A subwindow is
generated. At the top you can select whether to print to a file or to a printer with the “Print to file” and
“Print to printer” buttons. When the print to file option is chosen you get a subwindow where you can
enter the directory where the file has to be put and the name of the file. With the top “Change” button
21
you can still change the file directory and file name, and with the bottom “Change” button you can
change the printer. At the bottom you can enter which graph to print.
4.2.7.b Writing the graph data in a file
Choosing the button “Write Graph Data to File” allows to write the graph data of the last graph shown
on the screen to the file graph.dat in asci format. The first column is the abscis, the second, third, etc.,
are the ordinates.
4.2.7.c Exporting an S matrix to ADS
Choosing the button “Export S matrix to MDS” writes the S matrix of the structure in a file name_mds
where name is the name of the planar structure. This file can be imported into MDS. This means that in
a design MDS can use results generated by MAGMAS. Pay attention to the fact that MDS works with S
parameters referenced to 50 Ohm instead of with S parameters referenced to the characteristic
impedances of the ports in question. This is automatically taken into account by MAGMAS.
4.2.7.d Configuring the default printer
Choosing the button “Configure Printer” you get a subwindow where you can set the default printer.
4.2.8 The Info menu
Choosing this button generates a subwindow where you get information about the MAGMAS software
and its development team.
5.
MAGMAS messages, warnings and errors
MAGMAS has three types of messages to the user: “messages”, “warnings”, and “errors”.
5.1
Messages
The goal of a message is to give normal information to the user about the analysis procedure. After a
message is given, without stopping the analysis engine continues the analysis.
The radiation efficiency (radiated power divided by input power) of a structure is given as a message at
the end of the calculation for each frequency point at which the far field is determined.
5.2
Warnings
The goal of a warning is to give information to the user about:
1. changes the MAGMAS framework has made to the input parameters in order to enhance the
stability of the numerical analysis procedure,
2. the fact that the structure to analyze is such that some stability boundary is being approached.
After a warning is given, without stopping the analysis engine continues the analysis. Warnings are
written in the file WARNINGS, which can be consulted after the analysis.
5.3
Errors
The goal of an error is to give information to the user about the fact that a certain input parameter given
to the MAGMAS framework causes a problem which cannot be solved automatically by the framework;
the parameter, the problem with this parameter, and the measures which can be taken by the user are
described in detail;
After an error is given, the analysis engine stops.
There are two types of errors: errors which can only be solved by recompiling the MAGMAS source
code or memory violation errors, and errors which do not require a recompilation of the MAGMAS
source code or input errors.
5.3.a Memory violation errors
Since the solution of such an error requires a modification of the source code and a recompilation (the
fact that a recompilation is necessary is explicitly mentioned in the error), these errors cannot be solved
by the user. If they occur, this means that the specific MAGMAS version under consideration contains
22
intrinsic memory violations. Normally these errors only occur during installation. If such an error does
occur, please contact the MAGMAS developing team.
5.3.b Input errors
Since the solution of such an error does not require a modification of the source code, it can be solved
by the user. For each such an error, the (straightforward) measure(s) to take are given in detail by the
MAGMAS framework itself. Therefore, they are not listed in this user manual. If such an error is not
absolutely clear to you, please contact the MAGMAS developing team. They will adapt the error
message given in order to clarify things in the next release.
There are two subtypes of input errors: the physical errors and the numerical errors.
Physical error
This type of error occurs when the user has inserted a planar structure which goes beyond the
possibilities of the specific MAGMAS version under consideration. In this case this MAGMAS version
cannot handle the physical structure targeted.
Example:
PHYSICAL ERROR: the number of subregions is too large
MEASURE: decrease this number from ... to maximum ...
The error means that the user has inserted a planar structure with a number of subregions higher than
allowed for this specific MAGMAS version. It is evident that the only thing that can be done is to
diminish the number of subregions.
Numerical error
This type of error occurs when the user wants to analyze a planar structure with a theoretical (extremely
high) accuracy going beyond the possibilities of the specific MAGMAS version under consideration.
The theoretical accuracy is defined as the accuracy that can be reached with the same basic MAGMAS
version but using a computer with infinite memory and infinite speed.
Example:
NUMERICAL ERROR: the number of basis functions on aperture ... of element type ... is too large
MEASURE: decrease this number from ... to maximum ...
The error means that the user has inserted an aperture with a number of basis functions higher than
allowed for this specific MAGMAS version. His goal was probably to get an extremely high accuracy
by using a high-performance meshing. The MAGMAS version installed on the computer used however
prohibits this due to the restrictions on the computer memory. A reduction of the number of segments
on this aperture may solve the problem.
6.
References
[1] The MAGMAS framework: general physical structure
[2] The MAGMAS framework: the modeling procedure