1
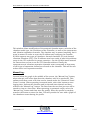
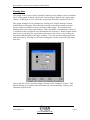
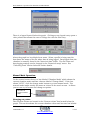
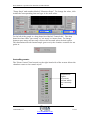
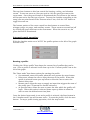
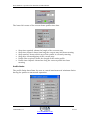
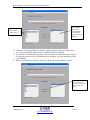
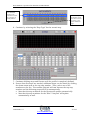
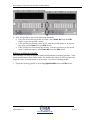
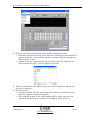
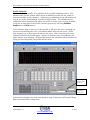
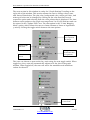
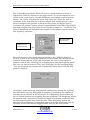
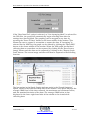
Real Chambers Corporation Test Chambers SCADA Manual REAL CHAMBERS CORPORATION SCADA SOFTWARE USER’S MANUAL FOR SCADA 7.0.4 1 of 45 23001046 Rev. G www.realchambers.com Real Chambers Corporation Test Chambers SCADA Manual Table of Contents Chamber Control ............................................................................................................................................ 3 Selecting a chamber: ........................................................................................................................... 4 Chamber Configuration: ..................................................................................................................... 4 Manual Log: ............................................................................................................................................ 5 Viewing data: .......................................................................................................................................... 6 Manual Mode Operation:.................................................................................................................... 7 Automatic mode operation: ............................................................................................................... 9 Downloading Profiles (from PC to PLC) ..................................................................................................... 12 Uploading Profiles (from PLC to PC) .......................................................................................................... 15 Creating Custom Trend Charts ..................................................................................................................... 18 The Custom Trend Screen ............................................................................................................................ 21 Changing the Trend Chart Background or Grid Color ........................................................... 21 Changing Custom Trend Chart Title ............................................................................................ 22 Changing Custom Trend Chart Scales ........................................................................................ 23 Creating/Editing Profiles .............................................................................................................................. 24 Editing an Existing Profile ............................................................................................................... 28 Profile Validation ..................................................................................................................................... 30 Single Graph Spectrum Analyzer ................................................................................................................. 31 Multi Graph Spectrum Analyzer .................................................................................................................. 37 Collecting Data ............................................................................................................................................. 39 Reviewing Data ............................................................................................................................................ 43 Exporting Data ............................................................................................................................................. 45 2 of 45 23001046 Rev. G www.realchambers.com Real Chambers Corporation Test Chambers SCADA Manual Chamber Control From the System menu, select Chamber Control. Once the chamber control panel opens, ensure that there are no errors listed in the status box, which is pictured below. 3 of 45 23001046 Rev. G www.realchambers.com Real Chambers Corporation Test Chambers SCADA Manual Status box Selecting a chamber: The box titled “Select Chamber” allows you to switch between multiple chambers that are connected to the network. Chamber Configuration: To configure all chambers connected to the network select “Configuration” from the “Edit” menu. A window will appear that shows the current configuration of networked chambers. 4 of 45 23001046 Rev. G www.realchambers.com Real Chambers Corporation Test Chambers SCADA Manual This window allows modification of the assigned chamber name, selection of the chamber model type, the IP address of the controller, as well as the temperature and vibration expansion channels. The chamber may be named anything, but it must be named in order to enter the IP address and configure the chamber. SCADA supports two types of chambers: thermal chambers (TC) and thermal vibration chambers (TVC). The IP address seen here needs to match the address setup in the CTI controller for proper operation. See the SCADA install manual for instructions on how to set the CTI controller address. Finally the temperature and vibration expansion channels must correspond to how many of each type of expansion channels are found on the chamber. This will be zero unless there is an expansion module. Manual Log: Located below the graph in the middle of the screen, the “Manual Log” button, when selected, will collect data from the chamber until it is unselected. This software will then create a file that can be viewed under the “Historical Trend Viewer” section. When operating in manual mode, select this button to start logging data. Perform the vibration and/or thermal tests desired and then unselect the “Manual Log” button. The data from the test that just ran will be stored to view at a later time. When operating in automatic mode, select the “Manual Log” button and then start the profile. When the profile is complete, unselect the button to store the data. This will provide the user with a graph of the chambers events during the profile. 5 of 45 23001046 Rev. G www.realchambers.com Real Chambers Corporation Test Chambers SCADA Manual Viewing data: The graph in the center of the Chamber Control screen shows current chamber data. If the graph is blank, check the “Comm Status” light in the upper right corner. If this light is red, check the connection from the chamber to the PC. The graph settings can be changed by clicking the “Graph settings” button located below the graph. The time span setting controls how many minutes worth of data are shown at any one time (x-axis range). The Update time changes how often the graph updates. Real Chambers recommends a value of 5 seconds to ease computer and communication resources. Both of these fields can be set by clicking the up/down arrow next to the value, or by clicking on the value and manually entering a number. You can set the background color and grid color by clicking on the box showing the current color and selecting a new one. Just to the left of the “Graph settings” button is the “Outputs” button. This button brings up a window that will show the current heating, cooling, and vibration output levels. 6 of 45 23001046 Rev. G www.realchambers.com Real Chambers Corporation Test Chambers SCADA Manual There is a legend located below the graph. Clicking on any legend entry opens a color palette that allows the user to change the color for that entry. Above the graph is a box labeled test name. When a profile is being run this box shows the name of the file where data is being logged. Data logged from the chamber is normally found in the “historical data” folder. The file name and data logging settings can be changed in the “historical setup” menu. See “Collecting Data” section below for further details. Manual Mode Operation: On the control screen there is a box labeled “Chamber Mode” which shows the current chamber mode and has a button labeled “Change Mode”. If the box shows “AUTO”, click the change mode button to go into manual mode. The manual mode works exactly the same as it does on the touch screen. It allows you to turn on/off events and change set points. Click here to switch to manual mode Changing set points: The set point values are located in the “Present values” box located below the graph. This section shows the current chamber values and has one box labeled 7 of 45 23001046 Rev. G www.realchambers.com Real Chambers Corporation Test Chambers SCADA Manual “Temp Setpt” and another labeled “Vibration Setpt”. To change the value, click inside the corresponding box and type in the new value. To the left of the graph is a drop down box labeled “Control the”. The drop down box has either “part temp” or “air temp” to choose from. To change between part temp and air temp click on the box and select desired option. This determines which thermocouple (part or air) the chamber controls the set point to. Controlling events: The “Event Control” box located on the right-hand side of the screen allows the chamber events to be turned on/off. Illuminated lights represent events which are currently on 8 of 45 23001046 Rev. G www.realchambers.com Real Chambers Corporation Test Chambers SCADA Manual The top three buttons in this box control the heating, cooling, and vibration events. To turn an event on, first you need to click the green box next to the event name. Once the green button is illuminated the On/off box at the bottom will become active for that type of event. To start the chamber controlling to the temp/vibe set point found in the “Present values” box, click the “Off” button to toggle the event on. The bottom portion of the event control box has buttons to control fans, nitrogen purge, air purge, and auxiliary events. These events are turned on/off by clicking the green box next to the event name. When the event is on, the green box will be illuminated. Automatic mode operation: With the chamber mode set to “AUTO” the profile options to the left of the graph become active. Running a profile: Clicking the “Select profile” box shows the current list of profiles that can be run. Once a profile is selected it will show up in the “Current profile” box to the left of the graph. The “Start mode” box shows options for starting the profile. On command: starts the profile when the user presses the start button Delay start: allows the user to delay the start of the profile. When this option is selected boxes open up below to allow the user to enter the desired delay time. Remote start: allows the user to supply an input that triggers the start of the profile (see CTI manual for further reference) At specified time: allows the user to enter the time which the profile will begin. When this option is selected boxes open up below to allow the user to enter the desired start time/date. Once the desired start mode is set and a profile is selected, the Start button in the “chamber mode” box will become active. To start the profile, click the start button. To stop a profile during operation, click the stop button. 9 of 45 23001046 Rev. G www.realchambers.com Real Chambers Corporation Test Chambers SCADA Manual The lower left corner of the screen shows profile time data. Step time required: shows the length of the current step Step time elapsed: shows how long the current step has been running Step number: shows which step of the profile is currently running Step skip: allows skipping of the current step Profile time required: shows the length of the entire profile Profile time elapsed: shows how long the current profile has been running Profile limits: The profile limits box allows the user to control maximum and minimum limits during the profile to ensure safe operation. 10 of 45 23001046 Rev. G www.realchambers.com Real Chambers Corporation Test Chambers SCADA Manual Clicking on the numeric value next to each limit allows the user to type in a value for that limit. The dropdown box next to the value determines what the chamber will do if the limit is reached. For all outcomes the alarm horn will sound. Disable Output: this option turns off the event which caused the alarm (example: if air temp hi is set to 100°C and the temperature reaches 101°C, the chamber will turn off the heating event) Do Nothing: the profile continues without interruption Go to 20°C: the chamber controls the temperature to 20°C and stops Shutdown Chamber: the chamber shuts down 11 of 45 23001046 Rev. G www.realchambers.com Real Chambers Corporation Test Chambers SCADA Manual Downloading Profiles (from PC to PLC) The writing utility is used to transfer pre-defined test profiles from the PC to the PLC. These profiles must be saved on the PC in order to download them to the PLC. There must also be an active connection between the PC and the PLC. The following procedure should be used to download profiles from the PC to the PLC: 1. From the System menu, select Write Profiles. 2. Verify there are not any error messages in the “Status” window. 12 of 45 23001046 Rev. G www.realchambers.com Real Chambers Corporation Test Chambers SCADA Manual Check for errors here. 3. The screen will show a list of profile names that are currently saved in the current directory. If the profile name of interest is not shown in the “Profiles Available” window, then it is not saved in the current directory. All profiles that are stored in the current directory on the PC will appear in this window. 4. Identify the profile that is to be downloaded to the PLC. 5. Select the profile by double-clicking on its name. Notice that when the profile is selected (by double-clicking its name), the name will appear in the “Profile Selected” window on the right. 13 of 45 23001046 Rev. G www.realchambers.com Real Chambers Corporation Test Chambers SCADA Manual Any profiles that have been doubleclicked will appear in this window. Double-click the profile name here. 6. Continue selecting profiles by double-clicking names until all profiles that are to be transferred appear in the “Profiles Selected” window. 7. If a profile is accidentally selected, it can be removed from the list by doubleclicking the name in the “Profiles Selected” window, just the opposite of how it was added. 8. When all profiles are selected, click the “Write Selected Profiles” button. Clicking this button will download the profiles in the Profiles Selected box to the PLC. 14 of 45 23001046 Rev. G www.realchambers.com Real Chambers Corporation Test Chambers SCADA Manual 9. Watch the “Status” window for update messages. If there are any errors, they will appear here. The downloading process should not take extremely long periods of time unless many profiles are being downloaded, or the profiles are exceptionally long. Typically, profiles require just a few seconds per profile for downloading. 10. A window will appear notifying the user when the download is complete. 11. If transferring all the profiles in the “Profiles Available” box is desired, click the “Write All Profiles” button and all the profiles will be transferred even the ones not selected. Uploading Profiles (from PLC to PC) The uploading utility can be used to transfer any profiles that are stored in the PLC’s memory to the PC. Once the profiles are on the PC, they can be edited, viewed, backed-up for future use, or downloaded to any other chamber. There must be an active connection between the PC and the PLC. The following procedure should be used to upload profiles from the PLC to the PC: 1. From the System menu, select Read Profiles. 15 of 45 23001046 Rev. G www.realchambers.com Real Chambers Corporation Test Chambers SCADA Manual 2. Verify there are not any error messages in the “Status” window. Check for errors here. 16 of 45 23001046 Rev. G www.realchambers.com Real Chambers Corporation Test Chambers SCADA Manual 3. The screen will show a list of profile names that are currently saved in the PLC memory. If the profile name of interest is not shown in the “Profiles Available” window, then it is not saved in the PLC memory. Profiles currently saved in the PLC memory will appear in this window. 4. Identify the profile that is to be uploaded to the PC. 5. Select the profile by double-clicking on its name. Notice that when the profile is selected (by double-clicking its name), the name will appear in the “Profiles Selected” window on the right. Similar to writing profiles, as the profile name is double-clicked in this window, the name will appear in “Profiles Selected” window on the right. 17 of 45 23001046 Rev. G www.realchambers.com Real Chambers Corporation Test Chambers SCADA Manual 6. Continue selecting profiles by double-clicking names until all profiles that are to be transferred appear in the “Selected Profiles” window. 7. If a profile is accidentally selected, it can be removed from the list by doubleclicking the name in the “Selected Profiles” window. 8. When all profiles are selected, click the “Read Selected Profiles” button. Left-clicking this button will upload any profiles shown in the “Selected Profiles” window from the PLC to the PC. 9. Watch the “Status” window for update messages. If there are any errors, they will appear here. The uploading process should not take extremely long periods of time unless many profiles are being uploaded, or the profiles are exceptionally long. Typically, profiles require just a few seconds per profile for uploading. 10. A window will appear notifying the user when the upload is complete. 11. If transferring all the profiles in the “Profiles Available” box is desired, click the “Read All Profiles” button and all the profiles will be transferred even the ones not selected. Creating Custom Trend Charts Custom trend charts can be created to display the output events of the chamber. The user can select which output events to display by selecting the corresponding tags. This allows the user to only select data that is of particular interest for the test, or to combine various data types (e.g. temperature and vibration) in any arrangement. Use the following procedure to create a custom trend chart: 18 of 45 23001046 Rev. G www.realchambers.com Real Chambers Corporation Test Chambers SCADA Manual 1. Select Custom Trends from the Trends Menu. 2. Select the data to be viewed on the chart by clicking the “Select Tags” button. 19 of 45 23001046 Rev. G www.realchambers.com Real Chambers Corporation Test Chambers SCADA Manual Click to configure the data on the trend chart. Click to select from up to four plots. 3. Select the group to modify the data points on. The custom trend chart can have up to four plots of data defined at any one time. This allows the user to quickly look at one group of data for a particular test, and then switch to a different group of data for another test simply by changing plots. For example, the groups could be configured such that: Plot 1 is temperature data Plot 2 is all vibration data Plot 3 is three temperatures and two vibration levels Plot 4 is three temperatures and three vibration levels 4. Select the data that is to be viewed from the list. Double click the name of the data you want to view in the “Available Tags” window to add that tag to the currently selected plot group. Some of the data available are: AirTemp – The temperature as measured by the thermocouple located in the chamber’s plenum. 20 of 45 23001046 Rev. G www.realchambers.com Real Chambers Corporation Test Chambers SCADA Manual PartTemp – The temperature as measured by the thermocouple located in the chamber’s workspace. TempSetpt – The temperature set point of the chamber. If the chamber does not currently have a temperature set point, it will plot a value of zero. VibrationLevel – The level of Grms measured by the control accelerometer. VibrationSetpt – The vibration set point of the chamber. If the chamber does not currently have a vibration set point, it will plot a value of zero. 5. To remove unwanted tags from a plot group simply double click its name in the plot group window. The Custom Trend Screen The custom trend screen was created to give users the flexibility to look at any collection of data together in groups, regardless of the data type (temperatures, vibration levels, set points, etc.). Once all of the data has been configured (see Creating Custom Trend Charts section for details), the look of the trend chart can be customized as needed. Changing the Trend Chart Background or Grid Color The main background color or grid color of the trend chart can be changed, as well as the tag lines colors. This can be done by the following procedure: 1. Click on the “Graph Settings” button. 21 of 45 23001046 Rev. G www.realchambers.com Real Chambers Corporation Test Chambers SCADA Manual Click to define the chart settings. Digital reading of current values 2. Clicking on the colored square representing the item to be changed will bring up the color selection window. Use any of these spectrums to choose a color To select a color move the cursor over the spectrum and click when the desired color is shown in the lower left corner. A recently used color can also be selected by clicking it from the “History” list of colors. Changing Custom Trend Chart Title The Custom Trend Chart can be further customized to make the data appear just as needed. The title of the chart can be changed by clicking and dragging over the title to highlight it. Once it’s highlighted, a new name can be typed in. 22 of 45 23001046 Rev. G www.realchambers.com Real Chambers Corporation Test Chambers SCADA Manual When the new title is entered, do not hit the enter key! After the new title has been typed in, click somewhere on the chart to leave the field and have the new name take place. The title that was entered will become the new default title automatically. Changing Custom Trend Chart Scales The “Y-axis” scale of the Custom Trend Chart can be changed in two different ways. The first way is to use the auto-scale feature. With auto-scale turned on, the Y-axis will constantly update itself so that it shows all of the data completely. For example, if the temperature suddenly goes up to 100°C, the Yaxis will automatically increase its maximum value to be larger than 100 so the new data can be clearly seen. The auto-scale feature will work in the same way on the minimum value. The auto-scale feature is turned on/off from the graph settings window: Check this box to turn on Y axis autoscaling If the auto-scale feature is not used, the minimum and maximum Y-axis values can be changed by clicking and dragging over the values on the graph to highlight them, then typing in a new value. The X-axis (time) scale can be changed in the graph settings window. This value represents how many minutes will be shown on the full axis. The graph update time is also set in the graph settings window. Real Chambers recommends a value of 5 seconds to ease computer and communication resources. 23 of 45 23001046 Rev. G www.realchambers.com Real Chambers Corporation Test Chambers SCADA Manual Creating/Editing Profiles The PC can be used to create new profiles or edit any existing profiles, much the same way as the touch-screen PLC. For details on the operation of various functions, refer to the manual for the CTI controller. To create a new profile: 1. Select New Profile from the File menu. 2. Start defining the profile by selecting the “Step Type” for the first step. The list of available step types is shown when the down arrow to the right of the box is clicked. Note that when the first step type is defined, the step numbers one through five automatically fill in place. Note that the next undefined step is automatically defined as an “End” step. 24 of 45 23001046 Rev. G www.realchambers.com Real Chambers Corporation Test Chambers SCADA Manual 3. Continue defining all of the parameters across the row for that step. Note that as set points are entered, lines will be drawn on the chart to visually represent the profile as it is created. This can help the user notice obvious data entry errors before running the chamber. Enter all values as needed for the step. 4. Define the state of the Events for that step by clicking the buttons between ON and OFF. Be sure to note the correct step number is being modified. The step numbers that are shown in the top should match those shown in the 25 of 45 23001046 Rev. G www.realchambers.com Real Chambers Corporation Test Chambers SCADA Manual Events section. For example, if step number three is being defined, be sure the Events being defined are also on the row for Event number three. Define the state of Events for the appropriate step number. Care should be taken to ensure the Events are being defined for the correct step number. 5. If the chamber was ordered with the additional discrete output relays, they can be defined for each step. Click the “Slot 5 Outputs” button to access the additional outputs. Click this button to define the additional discrete outputs. 26 of 45 23001046 Rev. G www.realchambers.com Real Chambers Corporation Test Chambers SCADA Manual Define the state of the additional outputs. Pay attention to what step number is being defined! When the outputs are defined, click the “Close” button to return to the profile definition page. 6. Continue by selecting the “Step Type” for the second step. 7. Continue defining steps and Events until the profile is completely defined. 8. If more than five steps are needed, additional steps can be shown by clicking the down-arrow next to the top step number. Then, select one of the numbers on the list. The number selected will now become the top step number and the following steps will fill in automatically. Note that the step numbers for the Events will update automatically. Note that the step numbers for the “Slot 5 Outputs” will update automatically as well. 27 of 45 23001046 Rev. G www.realchambers.com Real Chambers Corporation Test Chambers SCADA Manual 9. Save the profile by one of the following methods: If it’s the first time the profile is saved, select Save As from the File menu to give the profile a name. If the profile has already been saved, and the profile name is to remain the same, select Save from the File menu. If the profile has been saved previously, but this version is to be saved under a different name, select Save As from the File menu. Editing an Existing Profile The software can also be used to make modifications to existing profiles. Once these modifications have been made, the profile can either be saved under the original name, or saved under a new name. To edit an existing profile: 1. Open the existing profile by selecting Open Profile from the File menu. 28 of 45 23001046 Rev. G www.realchambers.com Real Chambers Corporation Test Chambers SCADA Manual 2. Select the profile name from the list by double-clicking the name. Note that only profiles stored in the directory indicated in the window will appear in the list. If the profile is stored in another directory navigate to that directory to open. Profiles that were created on the touch-screen of the CTI, and have not been uploaded to the PC, will not appear in the list. 3. When the profile has been pulled up on the screen, modify any portions of any steps as needed. 4. Save the profile. Saving the profile with the same name will cause the computer to overwrite the original version of the profile. If the original version of the profile should still be saved, give the new version of the profile a new name when saving by using “Save as”. 29 of 45 23001046 Rev. G www.realchambers.com Real Chambers Corporation Test Chambers SCADA Manual Profile Validation While creating the profile, it is possible to do a profile validation check. The software has certain criteria which must be defined in order for the profile to run successfully on the chamber. Performing a validation check will inform the user if any of the fundamental rules have been broken. The software does a validation check automatically when the profile is saved, but it is also possible to do one at any time of the profile creation process by selecting Validate Profile from the File menu. If the software detects an error in the profile, it will give the user a message on the screen describing the error, and inform which step has the error. When this happens, go to that step and correct the error. After correcting the error, validate and save the profile again. If there is another error, the software will again flash a new message. If the profile passes the validation check invoked by trying to save the profile, the profile will be saved. Which step number had the error. Brief description of the error. In the above example, an error was found in step #5 because no Thermal Ramp Rate was entered for a ramp step. 30 of 45 23001046 Rev. G www.realchambers.com Real Chambers Corporation Test Chambers SCADA Manual Single Graph Spectrum Analyzer The “Analyzer” option in the SCADA package offers a single and multi graph analyzer. The “Single Graph” analyzer allows the user to graph the power spectral density (PSD) or the raw vibration data from the chamber and export the data to be imported to a spreadsheet. The PSD is a graph which shows the how the power of a signal is distributed with frequency. The area under the graph is the Grms of the signal. This feature is only available if your chamber is equipped with the compact DAQ expansion module with a minimum of 4 vibration channels. If your chamber is not equipped with this option, the menu feature will be grayed out. The power spectral density of the chamber describes how the power of the vibration signal is distributed with frequency. This spectrum analyzer will display a power spectrum over a given frequency range and will show at which frequencies the power is strong and at which frequencies the power is weak. The user must first select the chamber to be monitored by clicking on the dropdown box in the lower left-hand section of the window. 31 of 45 23001046 Rev. G www.realchambers.com Real Chambers Corporation Test Chambers SCADA Manual Select Chamber Here Graph Settings Button Once the chamber is selected, the settings for the graph must be chosen by clicking on the “Settings” button in the lower left-hand side of the window, displaying the “Graph Settings” window. Under the “Graph Selection” heading, either a PSD plot or Raw Data Plot can be chosen by clicking the toggle switch between the two options. The PSD plot will display a graph of the PSD in either a linear or logarithmic scale. The Raw Data plot will display a graph of the vibration level versus time. If the PSD plot option is chosen, a second toggle switch will appear below with the option of using 32 of 45 23001046 Rev. G www.realchambers.com Real Chambers Corporation Test Chambers SCADA Manual single- or multi-channel averaging. Single-channel averaging allows the user to select one of the channels to be displayed on the graph. Multi-channel averaging allows the user to select up to eight channels (if the chamber is equipped) to be monitored and displayed on the graph. If the Raw Data plot option is chosen, the user can only select one of the channels to be monitored and displayed on the graph. 33 of 45 23001046 Rev. G www.realchambers.com Real Chambers Corporation Test Chambers SCADA Manual The next section in this window is under the “Graph Settings” heading on the right side of the window. This section allows the user to change colors, axes, and Lines of Resolution. The plot color, background color, major grid color, and minor grid color can be changed by clicking on the color box next to each respective option and selecting from the color palette that is displayed. The time between each update on the graph can range from 2 to 21,600 minutes and can be entered in the “Update Time” box. The next option is the “Y-Axis Mapping Mode” option, which allows the user to choose between a linear or logarithmic y-axis by clicking the toggle switch between the two options. Change Colors of Components on Graph Change Update Time Here Change Y-Axis Scale from Linear to Logarithmic Autoscale Y-Axis The user can choose to auto-scale the y-axis using the next toggle switch. When toggled on, the y-axis will automatically adjust to fit the plot in the graph window. When toggled off, the user can select the maximum and minimum values for the axis. Manually Adjust Y-Axis Scale 34 of 45 23001046 Rev. G www.realchambers.com Real Chambers Corporation Test Chambers SCADA Manual The “X-Axis Mapping Mode” allows the user to choose between a linear or logarithmic x-axis by clicking on the toggle switch. The x-axis cannot be autoscaled as the y-axis can be, and the maximum and minimum values must be chosen. The “Lines of Resolution across Full Spectrum” allows the user to essentially select how often the analyzer collects data during the test. Lower lines of resolution will produce a smoother PSD graph, but higher lines of resolution will produce a more accurate representation of the PSD. The SCADA spectrum analyzer will collect data in the frequency range of 1 – 12,500 Hz. The Lines of Resolution will determine the number of data points collected within this frequency spectrum. Manually Adjust Y-Axis Scale Change Lines of Resolution Here The third section in the Graph Settings window is the “PSD Plot Settings” section, located in the lower left-hand side of the window. This section is only available when graphing a PSD plot and allows the user to select how the analyzer collects data, including the averaging mode and the weighting option. The user can choose between “Live” and “Averaging” for the averaging mode. “Live” mode means the analyzer will continuously collect data until the PSD graph is complete. “Averaging” mode means the analyzer will continuously average the collected data with itself until the PSD graph is complete. If averaging, the number of averages can be entered in the box below. The “Weighting” option allows the user to choose between no weighting and time weighting. “No Weighting” means the analyzer will continuously update the graph as new data is collected with no data point weighted more than the next. “Time Weighting” means the analyzer will continuously update the graph as new data is collected, but the first data points collected are weighted more than the last data points. 35 of 45 23001046 Rev. G www.realchambers.com Real Chambers Corporation Test Chambers SCADA Manual If the “Raw Data Plot” option is selected, or “Live Averaging Mode” is selected for the PSD Plot, the graph will automatically begin collecting data after the settings have been applied. The graphing can be stopped at any time by pressing the “Press To Stop” button in the lower middle of the window. This allows the user to capture a screenshot or export the data. If “Averaging” is selected for the PSD Plot, the graph can be started by clicking the “Reset PSD” button in the lower middle of the window. When the PSD graph has finished collecting data a screenshot can be captured by clicking on the “Save Screen Image” button and the data can be exported by clicking on the “Export Graph Data” button. The screen image and data will then be exported to the following location: The last option in the Single Graph Analyzer mode is the “Graph Statistics” option, found in the lower left-hand side of the window. This option displays the average GRMS level of the data collected, the maximum and minimum values, and the standard deviation of the data. The average GRMS value is also displayed in the lower right-hand side of the window to be viewed while collecting data. 36 of 45 23001046 Rev. G www.realchambers.com Real Chambers Corporation Test Chambers SCADA Manual Multi Graph Spectrum Analyzer The “Analyzer” option in the SCADA package offers a single and multi graph analyzer. The “Multi Graph” analyzer allows the user to graph the power spectral density (PSD) or the raw vibration data from the chamber on four different graphs and export the data to a text file that can be imported to a spreadsheet. This data can then be plotted to display a graph of the PSD of the chamber. The use of multiple graphs allows the user to display the PSD and Vibration of the chamber in both linear and logarithmic scales, all in the same window. The axes can also be adjusted to view the PSD or Vibration at different frequency or time intervals. This feature is only available if your chamber is equipped with the compact DAQ expansion module with a minimum of 4 vibration channels. If your chamber is not equipped with this option, the menu feature will be grayed out. The power spectral density of the chamber describes how the power of the vibration signal is distributed with frequency. This spectrum analyzer will display a power spectrum over a given frequency range and will show at which frequencies the power is strong and at which frequencies the power is weak. 37 of 45 23001046 Rev. G www.realchambers.com Real Chambers Corporation Test Chambers SCADA Manual To begin, the user must first select the chamber to be monitored by clicking on the drop-down box in the lower left-hand section of the window. Graph Settings Buttons on each graph Select Chamber Here When the chamber is selected, the settings for each graph must be chosen by clicking on the “Settings” button in the lower left-hand side of each graph window. For an in-depth explanation of the “Graph Settings” window, refer to the Single Graph Spectrum Analyzer section as the settings options will be the same. 38 of 45 23001046 Rev. G www.realchambers.com Real Chambers Corporation Test Chambers SCADA Manual Collecting Data The software can be used to create data files for future examination. These data files will be delimited data files that can be opened in any common spreadsheet application. The following procedure should be used to set up a data file: 1. Select Historical Setup from the Historical Menu. 2. Assign a data file test name by clicking in the box and typing a name. The data file will be saved as a file with a name, which begins with what is typed in this box, and ends with a time/date stamp. 39 of 45 23001046 Rev. G www.realchambers.com Real Chambers Corporation Test Chambers SCADA Manual Enter a text name here. 3. Define the time interval (in seconds) between data samples. Define the logging interval between data samples by either clicking on the scroll arrows, or entering a number in the box. 4. Select the data (“tags”) to be logged for this test by double clicking on the name in the “Select Tags to View” window on the left. When the tag has been selected, its name will appear in the “Selected Tags” window as seen below. 40 of 45 23001046 Rev. G www.realchambers.com Real Chambers Corporation Test Chambers SCADA Manual 5. If a tag is accidentally selected, it can be removed from the list be doubleclicking its name in the “Selected Tags” window. 41 of 45 23001046 Rev. G www.realchambers.com Real Chambers Corporation Test Chambers SCADA Manual 6. Unless this setup is changed, all future tests will log the same data tags at the same rate, with the same text name for a file name. The data files will be distinguishable by the time/date stamp in the file name. 7. The data files will be stored in the “C:\REAL_Chambers\data” directory on the hard drive. 42 of 45 23001046 Rev. G www.realchambers.com Real Chambers Corporation Test Chambers SCADA Manual Reviewing Data Data already stored in the database can be reviewed or exported at any time through the historical data viewer. 1. Select “Historical Trend Viewer” from the historical menu. 2. A window containing a list of all the data files will open. From this window select the set of data you wish to view. 43 of 45 23001046 Rev. G www.realchambers.com Real Chambers Corporation Test Chambers SCADA Manual 3. A window will open that shows a graph of the saved data. 44 of 45 23001046 Rev. G www.realchambers.com Real Chambers Corporation Test Chambers SCADA Manual Exporting Data The historical trend viewer allows you to export the graph data to the Clipboard or Excel. Another option available is to export a simplified graph image of the data. To access these options, right-click anywhere on the graph and navigate to the “Export” item on the pop-up menu. 45 of 45 23001046 Rev. G www.realchambers.com