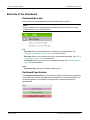
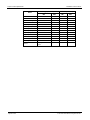
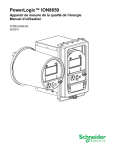
1
PowerLogic™ ION EEM™ 4.0 R2
Enterprise energy management software
User Guide
7EN02-0316-01
09/2012
Contents
Safety information
7
Chapter 1: Dashboard Module
9
Dashboard interface
Elements of the Dashboard
Creating a new dashboard page
Editing existing pages
Deleting pages
Gaining access to dashboard items
Chapter 2: Trend Analysis Module
10
11
14
16
16
16
17
Trend analysis page interface
Menu Bar
Chart Area
Axis Options Panel
Chart Options Panel
Roll-up order of operations
Data Group Panel
Add or Remove Data Filters
Filter Trend Analyses data by time
New trend analysis creation overview
Open an existing trend analysis
Manage trend analyses
Select/update trend analysis data
Tracking saved trends usage and deletion
Set a Fixed Time Range for charts
Export trend analysis to report
Printing a trend analysis
Trend analysis expressions
Chapter 3: PQ Analysis Module
18
19
19
20
22
23
23
27
27
28
29
30
31
32
33
34
36
37
41
PQ Analysis Page Interface
Menu bar
Event Selector Area
Event Summary Area
Chart Control area
PQ Analysis icon summary
Create a new PQ Analysis
Open an Existing PQ Analysis
Manage PQ Analyses
Classify PQ Analyses
Share PQ Analyses
Filter PQ Analyses by Time Dimension
Add or Remove Filters
View Details of PQ Analyses
View waveforms of PQ analyses
42
42
43
44
45
46
47
48
49
49
50
51
53
53
54
© 2012 Schneider Electric. All rights reserved.
Page 3 of 150
ION EEM 4.0 R2 User Guide
Waveform Viewer
Waveform Viewer window
Waveform Explorer area
Waveform Viewer area
List Mode
Details Mode
Open multiple Waveform Viewers
Waveform viewer icon summary
Printing your PQ Analysis Reports
Power Quality Event Types
Chapter 4: Billing Module
55
55
56
57
57
58
59
59
59
59
61
Billing Page Interface
Bill Filtering Control
Bill Selection Display
Bill Administration Menu
Bill Details Display
Viewing a summary report
Creating a new bill
Comparing two bills
Chapter 5: Reporting Module
62
62
63
63
66
68
69
70
71
Reporting Module Interface
Elements of the Reporting Page interface
Typical workflow
Uploading a report or a report pack
Generating and viewing a report
Reports and Parameters
Saving the Report
Exporting the Report
Managing, Sharing, and Subscribing to the Report
Chapter 6: Modeling Module
72
72
74
75
76
76
77
77
77
81
Model creation in ION EEM
What is a model in ION EEM?
How are models created in ION EEM?
What are the models used for?
Modeling workflow diagram
Before you begin
Determine the behavior to model
Decide on a historical reference period
Confirm the data are accurate
Other things to be aware of
Model Creation
Creating a new model
Model statistics
Improving the model
Sub-Models
Excluding Data Points
Page 4 of 150
83
83
83
83
84
85
85
85
85
86
87
87
90
92
92
93
© 2012 Schneider Electric. All rights reserved.
ION EEM 4.0 R2 User Guide
Creating a multivariable model
Targeting
What is a target?
Creating a target
Chapter 7: Administration
95
96
96
100
103
Administration Page overview
System
My Settings
Accounts
Users
Groups
Manage Dashboards
Permissions
Source Management
Status
UI Behavior
Custom Time Range
Modules
Cost Allocation
External content
Power Quality
Reporting
Trend Analysis
Waveforms
WebReach
Tools
Administration Tool
Manual Data Entry
Manual Data Entry Permissions
Index
104
106
106
107
107
109
110
111
115
117
118
119
125
125
130
132
133
135
137
138
140
140
141
146
147
© 2012 Schneider Electric. All rights reserved.
Page 5 of 150
ION EEM 4.0 R2 User Guide
Page 6 of 150
© 2012 Schneider Electric. All rights reserved.
Safety information
Important information
Read these instructions carefully and look at the equipment to become familiar
with the device before trying to install, operate, service or maintain it. The
following special messages may appear throughout this bulletin or on the
equipment to warn of potential hazards or to call attention to information that
clarifies or simplifies a procedure.
The addition of either symbol to a "Danger" or "Warning" safety
label indicates that an electrical hazard exists which will result in
personal injury if the instructions are not followed.
This is the safety alert symbol. It is used to alert you to potential
personal injury hazards. Obey all safety messages that follow this
symbol to avoid possible injury or death.
DANGER
DANGER indicates an imminently hazardous situation which, if not avoided, will result
in death or serious injury.
WARNING
WARNING indicates a potentially hazardous situation which, if not avoided, can result
in death or serious injury.
CAUTION
CAUTION indicates a potentially hazardous situation which, if not avoided, can result
in minor or moderate injury.
NOTICE
NOTICE is used to address practices not related to physical injury. The safety alert
symbol shall not be used with this signal word.
Please note
Electrical equipment should be installed, operated, serviced and maintained only by
qualified personnel. No responsibility is assumed by Schneider Electric for any
consequences arising out of the use of this material.
A qualified person is one who has skills and knowledge related to the construction,
installation, and operation of electrical equipment and has received safety training to
recognize and avoid the hazards involved.
© 2012 Schneider Electric. All rights reserved.
Page 7 of 150
Chapter 1: Dashboard Module
ION EEM 4.0 R2 User Guide
Chapter 1: Dashboard Module
This section discusses the dashboard interface and its elements, as well as procedures for
building and customizing your dashboard pages.
In this section:
Dashboard interface
10
Elements of the Dashboard
11
Creating a new dashboard page
14
Editing existing pages
16
Deleting pages
16
Gaining access to dashboard items
16
Note
You must have access to at least one trend analysis, PQ analysis, or external web link
before you can set up a dashboard item.
Related topics:
• "New trend analysis creation overview " on page 28
• "Create a new PQ Analysis" on page 47
• "Weblinks and files" on page 130
Page 9 of 150
© 2012 Schneider Electric. All rights reserved.
ION EEM 4.0 R2 User Guide
Chapter 1: Dashboard Module
Dashboard interface
The Dashboard Interface allows you to customize the presentation of information to suit your
needs. Different users can have very different dashboards, depending on the information
each user requires.
Note
Minimum screen resolution is 1024 x 768.
There are three main elements of the dashboard interface:
• Dashboard Page Selector
• Dashboard Menu Control
• Dashboard Display Area
A
Dashboard Page Selector
B
Dashboard Menu Control
C
Dashboard Display Area
The Dashboard Page Selector on the left side of the page can be collapsed to allow more
area to view dashboard pages. Click the
symbol located to the right of the Pages heading
to collapse the Page Selector. To expand the Page selector, click the
symbol. When the
Page Selector Menu is collapsed or expanded, the dashboard items will resize to the new
view.
© 2012 Schneider Electric. All rights reserved.
Page 10 of 150
Chapter 1: Dashboard Module
ION EEM 4.0 R2 User Guide
Elements of the Dashboard
Dashboard Menu Bar
Below is the list of commands available from the Dashboard page menu bar.
Note
Some commands may be disabled (grayed out) depending on your selection, the current
available options, or your user permissions.
File
• New Page: Takes you through the process of adding a new dashboard page. See
"Creating a new dashboard page" on page 14 for more information.
• Edit Page: Allows you to customize the currently displayed dashboard page. See "Editing
existing pages" on page 16 for more information.
• Delete Page: Allows you to remove the current dashboard page. See "Deleting pages" on
page 16 for more information.
Help
• Dashboard Help: Displays the Dashboard Help contents.
Dashboard Page Selector
In the Dashboard Page Selector, the currently selected page is indicated by the page button
with a dark border, while the other page buttons are grayed out. To select another page, click
the desired page button. Hovering the mouse pointer over a page button displays the
dashboard title.
Page 11 of 150
© 2012 Schneider Electric. All rights reserved.
ION EEM 4.0 R2 User Guide
Chapter 1: Dashboard Module
Dashboard Display Area
The Dashboard Display Area is where the items you have chosen, such as Trends,
Reports or PQ analyses, are shown. The configuration of the Dashboard is based on the
dashboard layout selection. The example below shows two reports side by side in the display
area.
Additional Dashboard controls
In the title bar of each dashboard item are control buttons that provide additional functionality
related to how the content of the dashboard item is displayed.
© 2012 Schneider Electric. All rights reserved.
Page 12 of 150
Chapter 1: Dashboard Module
ION EEM 4.0 R2 User Guide
•
Chart/Table drop-down list: Switches the view type of a Trend or PQ Analysis
between a chart or table of values.The drop-down list does not appear if a Report or
Weblink is displayed in the dashboard.
•
Edit Current Analysis: Switches to the applicable EEM module and opens the
analysis or report. Here, you can edit the dashboard item.
Note
Editing an analysis in this manner results in a global change to the analysis which can
affect all users. Confirm you are authorized to modify the analysis before proceeding.
Page 13 of 150
•
Enlarge Current Analysis: Displays an enlarged analysis in a new window. The
chart displayed in the new window allows you to zoom in on specific areas. Drag the
mouse pointer over the portion of the analysis you want to zoom in on, and the analysis will
redraw, displaying the highlighted portion of the analysis. The zoom function only applies
to Trend and PQ Analyses. You cannot use the zoom function with a Report or Weblink.
•
Refresh Contents: Clicking the Refresh icon after resizing the browser window
redraws the item displayed in the dashboard container.
•
Download Analysis as CSV file: Allows you to save the item as a Comma
Separated Value (CSV) file. To save as a CSV file, click the Download icon, Click Save
from the File Download dialog, enter a name file in the Save As dialog, and click Save.
© 2012 Schneider Electric. All rights reserved.
ION EEM 4.0 R2 User Guide
Chapter 1: Dashboard Module
Creating a new dashboard page
You can create a new page and customize its content to be relevant to different roles in your
organization.
Note
You must have access to at least one item, such as an analysis or external web link, before
you can set up dashboard items. For more information about creating a trend analysis, see
"New trend analysis creation overview " on page 28. To learn how to administer the
available Weblinks and Files, see "Weblinks and files" on page 130
To create a new page:
1. Select File > New Page from the Menu Bar. A new dashboard page appears.
A
Dashboard Page Selector
B
Page Editor
C
Page Preview
2. Enter the item label in the Menu Item Label field. This is the label that appears on the
Dashboard Page Selector button. The item label can be up to 100 characters.
3. Enter the Dashboard Title in the space provided. This is the name that is displayed in the
dashboard, just under the item title bar. The title can be up to 150 characters. This title is
also displayed when the mouse pointer hovers over the corresponding Dashboard Page
Selector button.
© 2012 Schneider Electric. All rights reserved.
Page 14 of 150
Chapter 1: Dashboard Module
ION EEM 4.0 R2 User Guide
4. Select the color of the page menu entry from the Menu Item Color drop-down list. This
can assist in organizing the Dashboard Page Selector buttons by using colors to group
dashboard pages based on a common trait, such as similar content or user type.
5. Select the partition configuration from the Dashboard Layout drop-down list. This list
allows you to choose how many partitions the dashboard page has, and how they are
arranged. A dashboard can have up to four partitions, and can be arranged left and right or
top and bottom.
6. Click Click to add an item in the Page Preview window to add content to your
dashboard page.
Determine the type of item you want to add to the dashboard page and select it from the
Select the Item type: drop-down and select the specific item from the resulting list that
appears.
7. Click the arrow buttons
beside each button in the Dashboard Page Selector to
move it up and down in the list. The up/down arrows beside each menu item allow you to
customize the order in which the dashboard pages are presented.
Page 15 of 150
© 2012 Schneider Electric. All rights reserved.
ION EEM 4.0 R2 User Guide
Chapter 1: Dashboard Module
8. Click Save to save the new page to your dashboard.
You can also click Cancel to return to the main dashboard view. All changes to the
dashboard are discarded.
Editing existing pages
After a page has been created, it can be edited at a later time by clicking Edit Current Page
from the Menu Bar. From the Edit Page window, you can change items in the page such as
the menu order, the page title and menu item label, the menu item color, dashboard layout,
and the dashboard items.
Editing an existing page is similar to the page creation process.
To edit an existing dashboard page:
1. Click the entry in the Page menu that you want to edit.
2. Select File > Edit Current Page from the Menu Bar. The Edit Page window appears.
3. Edit the various parts of the page as necessary. Review "Creating a new dashboard page"
on page 14 to assist you in modifying the different parts of the page.
4. Click Save when finished to save the edited page, or click Cancel to discard any changes
and return to the original dashboard page.
Deleting pages
1. Click File > Delete Page to delete your current dashboard page.
Note
Only the page is deleted, not the underlying item.
2. Click OK in the dialog box to confirm deleting the current dashboard page.
Gaining access to dashboard items
Gaining access to items you can add to your dashboard is an administrative function based
on user permissions. Contact your EEM Administrator for access to new dashboard items.
© 2012 Schneider Electric. All rights reserved.
Page 16 of 150
ION EEM 4.0 R2 User Guide
Chapter 2: Trend Analysis Module
Chapter 2: Trend Analysis Module
This section discusses the Trend Analysis interface, the types of available Trend Analysis
expressions and associated syntax. It also covers procedures for creating and managing
your Trend Analyses.
In this section:
Trend analysis page interface
18
Menu Bar
19
Chart Area
19
Axis Options Panel
20
Chart Options Panel
22
Roll-up order of operations
23
Data Group Panel
23
Add or Remove Data Filters
27
Filter Trend Analyses data by time
27
New trend analysis creation overview
28
Open an existing trend analysis
29
Manage trend analyses
30
Select/update trend analysis data
31
Tracking saved trends usage and deletion
32
Set a Fixed Time Range for charts
33
Export trend analysis to report
34
Printing a trend analysis
36
Trend analysis expressions
37
Note
Data displayed in this module does not reflect real time status information collected by your
devices.
Do not use Trend Analysis reports for billing, sub-billing, or cost allocation purposes.
© 2012 Schneider Electric. All rights reserved.
Page 17 of 150
Chapter 2: Trend Analysis Module
ION EEM 4.0 R2 User Guide
Trend analysis page interface
The Trend Analysis feature of ION EEM allows you to take collected data and create an
analysis of changes in that data over time. The trend analysis module does not modify the
data collected, but provides a visualization of the data that allows you to analyze, spot trends
and anomalies, and track and measure performance against historical baselines or targets.
To begin using the Trend Analysis module, click the Trend Analysis tab.
The Trend Analysis Interface has five main areas:
• Menu Bar
• Chart Area
• Axis Options Panel
• Chart Options Panel
• Data Group Panel
A Menu Bar B Axis Option Menu
Page 18 of 150
C Chart Area
D Chart Options Panel E Data Group Panel
© 2012 Schneider Electric. All rights reserved.
ION EEM 4.0 R2 User Guide
Chapter 2: Trend Analysis Module
Menu Bar
Below is the list of commands available from the Trend Analysis page menu bar.
Note
Some commands may be disabled (grayed out), depending on your selection, the current
available options, or your user permissions.
File
• New: Creates a new trend analysis. See "New trend analysis creation overview " on page
28 for more details.
• Open: Opens an existing analysis.
• Manage: Moves, renames, deletes or copies your existing analyses.
• Save: Saves the currently viewed trend analysis.
• Save As: Allows you to name and choose the saved location of your reports or trend
analyses.
Options
• Show Advanced Options: Reveals advanced chart formatting options in the Chart
Options and Data Group areas.
Help
• Displays the Trend Analysis Help content in a separate window.
Chart Area
The Chart Area displays the results of a trend analysis. You can configure this area using
options available in the Chart Options, Axis Options and Data Group areas.
© 2012 Schneider Electric. All rights reserved.
Page 19 of 150
Chapter 2: Trend Analysis Module
ION EEM 4.0 R2 User Guide
In the title bar of the Chart Area are control buttons that provide additional functionality to how
the charts are displayed.
•
•
Chart/Table drop-down list: Switches the view type of the analyis between a
chart or table of values. If the container displays a Weblink, the drop-down list does not
appear.
Enlarge Current Analysis: Displays an enlarged analysis in a new window.
Enlarged Trend Analysis charts support zooming and scrolling. To zoom in, click and drag
around an area of a chart. The view changes to show only the selected area. Horizontal
and vertical scroll bars provide the ability to view areas of the chart that are outside of the
zoom area. To zoom out to the original view of the chart, click the (
corners of the chart.
) icons in the
•
Refresh Contents: Clicking the Refresh icon after resizing the browser window
redraws the item displayed in the analysis container.
•
Download Analysis as CSV file: Allows you to save the item as a Comma
Separated Value (CSV) file. To save as a CSV file, click the Download icon, Click Save
from the File Download dialog box, enter a name file in the Save As dialog box, and click
Save.
Axis Options Panel
Use the Axis Options area to apply titles to your X-Axis and your primary and secondary YAxes. Use the Auto Scale the Axis check box to scale the primary Y-Axis or the secondary
Y-Axis.
You can also select the Axis Type for your X-Axis from the Axis Type dropdown list. The
available options are:
• Time Ordered (default setting): This option plots all data along a common time ordered
axis.
• Time Grouping: This option assembles data based on the selected time groupings and
uses the grouping method property to display the data in a common time dimension.
Page 20 of 150
© 2012 Schneider Electric. All rights reserved.
ION EEM 4.0 R2 User Guide
Chapter 2: Trend Analysis Module
Dropdown list settings include: None, Day of Week, Day of Month, Day of Year, Hour
of Day, Week of Year, Month, Year, Minute, Calendar Quarter and Work Week. Any
user created time ranges also appear in this list.
Note
You must select at least one time group for the Time Grouping axis type.
• Series Grouping: This option creates one group for each series of aggregates. By
selecting the Show Series Parent Grouping option, all series that are Logged Data type
have their parent source added as a grouping to the chart. There is also the optional
property to perform time grouping as well as the other grouping options.
Dropdown list settings include: None, Day of Week, Day of Month, Day of Year, Hour
of Day, Week of Year, Month, Year, Minute, Calendar Quarter and Work Week. Any
user created time ranges also appear in this list.
• Histogram: This option displays a count of samples that fall into different ranges of a
measured quantity. It plots with height proportional to the frequencies.
Options from the drop-down list include Normal bins, Normal bins & Cumulative line
and Cumulative Bins.
Click Show count as percentage or Display Unit information and choose either the
Auto Bins or Manual Bins button. In Auto Bins, the User determines the number of bins
(10 is the default number of bins). In Manual Bins, the user selects a name and range for
each bin in the appropriate fields.
When Show Advanced Options is selected from the Options dropdown in the Menu bar,
additional features become available:
• Force Display of Entire Range: When this option is selected, the rendered chart forces
the X-Axis date range to cover the entire range of the input series, even if there is no data
for the entire range. With this option off, the chart cuts away the date range that has data
for the edges (start and end times) displayed on the chart.
Note
The Force Display of Entire Range option is only available when a Time Ordered XAxis type is selected.
• Auto Scale the Axis: If this option is selected, when a chart is generated, the upper and
lower limits of the Axis are calculated automatically.
Note
The Axis range can also be set manually. This is can be used as an alternate method of
zooming the chart in and out by changing the Axis range.
• Display Unit Information: If this option is selected, any Logged Data, Cost Data, or
Simulated Data series has its units applied to the appropriate Y-Axis title.
© 2012 Schneider Electric. All rights reserved.
Page 21 of 150
Chapter 2: Trend Analysis Module
ION EEM 4.0 R2 User Guide
Chart Options Panel
Use the Chart Options area to choose your default chart type and give the chart a description.
See the table below for a description of the options available in the Chart Options area.
Menu Item Options
Description
Available Selections
• Line
• Bar
• Bubble
• Column
• Scatter Plot
Basic View
Default Chart Type
Default chart display type. All series use
this property for their display type. Each • Range
data group may override this property • Range Column
to create mixed type charts.
• Spline
• Step Line
• Stacked Area
• Stacked Bar
• Stacked Column
Show Gridlines
Applies a grid to the chart.
Cleared by default.
• None
• Day of Week
• Day of Month
Roll-up Interval
Advanced
View
Reduces the chart’s data resolution.
Enabling this option causes all series
data to aggregate (using the data
group property roll-up method) to the
resolution selected in the drop down
list. See "Roll-up interval example" on
page 23 for more details.
• Day of Year
• Hour of Day
• Week of Year
• Month
• Year
• Minute
(click Options
> Show
Advanced
Options for
this additional
view)
Display Last
Timestamp
• Calendar Quarter
• Work Week
Based on the roll-up interval, checking
this option modifies the timestamp
displayed for the rolled up data. Can
allow a chart to begin at the top of the
roll-up interval, rather than at a
timestamp inside the roll-up interval.
This can make data easier to read.
Cleared by default.
• None
Timestamp Interval
The timestamp interval forces an entry
timestamp at the defined interval. Can • 5 minutes
be used in conjunction with the "Missing • 10 minutes
Value Fill" series option.
• 15 minutes
Page 22 of 150
© 2012 Schneider Electric. All rights reserved.
ION EEM 4.0 R2 User Guide
Chapter 2: Trend Analysis Module
• 30 minutes
• 1 hour
• 1 day
• None
• Day of Week
• Day of Month
• Day of Year
Global Data Filters
Multiple Global Data filters can be
applied to the chart and affect all data
groups. These filters override any local
filters, and apply to all of the data in the
chart. Global filters function by first
selecting the appropriate Time
Dimension from the dropdown list.
Once the Time Dimension is selected,
click the Funnel icon (
) and select
the values to include in the resulting
data.
• Hour of Day
• Week of Year
• Month
• Year
• Minute
• Calendar
• Quarter, Work Week.1
Add additional filters by
clicking the Plus icon (
),
and remove unwanted ones
by clicking the Minus icon (
) beside the filter
1 Any custom time dimensions configured for the system also appear in the list of available Global Data Filters.
Roll-up order of operations
All calculated series data expressions are evaluated after any roll-up, aggregation or filtering
is applied to the dataset. In other words, when using the Calculated Data option from the
Data Type dropdown menu and creating an expression, any roll-up that is applied to the
series data is performed before the calculation.
Roll-up interval example
Suppose that you had energy consumption data in a sample series spaced at 15 minute
intervals, and you want to create a chart that displays the data series as a single value per
day. To do this, set the Roll-up interval found in the chart options area to Day of Week.
This enables the Roll Up Method drop-down list located in the Data Group area. Select
Summation from the list. By setting the Roll Up Method to Summation, the chart
displays the data series for the time range as a summation of all the data for that particular
day.
Data Group Panel
A data group is a collection of series that share common properties; each data group always
contains at least one series. In the Data Group area you can define the data group(s) for your
analysis. This area of the analysis interface contains one data group by default. Click Add
Data Group to add more data groups to your analysis. See "Select/update trend analysis
data" on page 31 for more information.
© 2012 Schneider Electric. All rights reserved.
Page 23 of 150
Chapter 2: Trend Analysis Module
ION EEM 4.0 R2 User Guide
A Data Group contains the series that appears in the chart. Each series is represented by a
single row at the top of the Data Group. Each series that is defined adds a series to the
resulting chart.
The table below displays the options available in the Data Group area.
Data Group View
Options
Description
Available Selections
Creates a copy of that
particular data series within
the Data Group
Series Name
Enter the display name of the
series as you want it to
appear in the chart legend
Type your series name in this field.
Color
Choose a color to represent
this particular data group in
your chart
Select color to represent a particular
data group.
• Logged Data: allows you to select a
source and measurement for the data
group
• Cost Data: allows you to select a bill
and an appropriate charge line item.
• Simulated Data: allows you to
choose from simulated models that
have been configured on your EEM
system. See "Modeling Module" on
page 81 for information on model
creation.
Basic View
Data Type
Defines the type of data that
this series represent
• Calculated Data: allows you to
create a generic computation based on
other series in the Analysis. See
"Trend analysis expressions" on page
37 for more detailed information
thresholds. The Constant Interval
value drop-down list can be set to 5
minute, 10 minute, 15 minute, 30
minute, 1 hour or 1 day intervals.
• Cumulative Summation: creates a
CUSUM chart based on a reference
series. Displays a running total of the
differences from a target value. Useful
for showing when an event occured in
a series.
Time Range
See "Set a Fixed Time Range for
Adjust the time/date range for
charts" on page 33 if you require
the analysis
custom range settings.
Timezone
Adjust the time zone used for
the analysis
Display Axis
Display the Data Group series • Primary Y-Axis
on the Primary (left) or
• Secondary Y-Axis.
• Source Local Time
• UTC (Coordinated Univeral Time)
• various timezones
Page 24 of 150
© 2012 Schneider Electric. All rights reserved.
ION EEM 4.0 R2 User Guide
Chapter 2: Trend Analysis Module
Data Group View
Options
Description
Available Selections
Secondary (right) Y-Axis on
the resulting chart
• Default Chart Type
• Line
• Bar
• Bubble
• Column
Series Type
Defaults to Chart but allows
you to configure the series in • Scatter Plot
• Range
the Data Group to be
displayed as a different series • Range Column
type
• Spline
• Step-Line
• Stacked Area
• Stacked Bar
• Stacked Column
Data Group View
Options
Description
This property is enabled
when the X-Axis is configured
to either Time Grouping or
Series Grouping. The
selected method defines
Grouping Method which aggregation method is
performed when organizing
the data. (Note this property
can be used in conjunction
with setting up a Roll-up
interval).
Roll-up Method
Advanced View
This property is enabled
when the Roll-up Interval is
enabled. The selected
method defines which
aggregation method is
performed when grouping
the data into the appropriate
roll-up interval. (Note this
property can be used in
conjunction with using a
Grouping method).
Available Selections
• Average
• Minimum
• Maximum
• Summation
• Average
• Minimum
• Maximum
• Summation
When data is retrieved and
there is missing data (either
from a filter or a gap in the
source data) this method
applies a replacement value.
By default, no replacement is • None
Missing Value Fill selected.
• Zero-fill
Method
The Last Known Value option
• Last Known Value
replaces missing data with the
last value that was reported
before the gap. This also
applies to a gap occurring at
the start of the date range.
© 2012 Schneider Electric. All rights reserved.
Page 25 of 150
Chapter 2: Trend Analysis Module
ION EEM 4.0 R2 User Guide
The analysis looks at the last
value before the specified
date range and replaces
missing data with this value.
• Solid
Line Style
This property only affects
series that are of a Line type
(Line or Spline)
• Dashed
• Dotted
• Dash-Dot
• Dash-Dot-Dot
• Very Thin
Line Width
This property only affects
series that are of a Line type
(Line or Spline)
• Thin
• Medium
• Thick
• Very Thick
• None
• Day of Week
• Day of Month
Filters
Functionality is similar to
Global Filters, except the filter
is only applied to the series
within the Data Group. There
can be up to three filters per
data group.
• Day of Year
• Hour of Day
• Week of Year
• Month
• Year
• Minute
• Calendar Quarter
• Work Week
The table below displays the Data Group icons and their function.
Creates a copy of this particular data series (within the data group).
Deletes this particular series (within the data group).
Moves this data group down in the display order list. Note that if data from
multiple series overlap, the series in the lowest data group will be seen.
Moves this data group up in the display order list. Note that if data from
multiple series overlap, the series in the lowest data group will be seen.
Creates a copy of the data group. See the section “"Select/update trend
analysis data" on page 31 for information on how to update your copy of a
data group with different source/measurement combinations.
Minimizes/maximizes the data group.
Deletes the data group from your analysis.
Indicates the type of filter applied to your data group.
Note
Any changes made are not permanent until you save the analysis.
Page 26 of 150
© 2012 Schneider Electric. All rights reserved.
ION EEM 4.0 R2 User Guide
Chapter 2: Trend Analysis Module
Add or Remove Data Filters
In the Chart Options area or the Data Group area you have the option of applying multiple
data filters.
To add a data filter, click the Add icon (
).
To remove a data filter, click the Remove icon (
) beside the filter you want to delete. The
data filter is removed.
Filter Trend Analyses data by time
To filter your data results by time:
1. Navigate to the Trend Analysis tab and click Options > Show Advanced Options.
2. Go to the Filters area in the Data Group area.
3. Select the desired time filter from the available drop-down list.
Time Filter
Available Selections
None (default)
No filter applied.
Day of Week
Sunday through Saturday
Day of Month
01st to 31st
Day of Year
001 to 366
Hour of Day
00 to 23
Week of Year
01 to 53
Month
January through December
Year
1980 to 2050
Minute
00 to 59
Calendar Quarter
1st to 4th quarter
Work Week
Weekday, Weekend
4. When you have selected your filter, click the Filter icon (
). A new window appears.
5. Select the values to include in the time filter configuration.
6. Click OK to close the window and to save the changes. The parameters beside the Data
Group Filter update to reflect your configuration.
7. Click Update Chart to view the new configuration.
8. Click Save to save your updated trend analysis.
© 2012 Schneider Electric. All rights reserved.
Page 27 of 150
Chapter 2: Trend Analysis Module
ION EEM 4.0 R2 User Guide
New trend analysis creation overview
This section leads you through the process of creating a new trend analysis report, beginning
with a blank trend analysis.
To create a new trend analysis:
1. Click the Trend Analysis tab.
2. Click File > New to create a new analysis report.
A new trend analysis page with an empty chart area appears. The chart area remains blank
until you add your data sources to your analysis.
3. Choose your Default Chart Type in the fields available in the chart options area.
4. Give your new trend analysis a name in the Description field, and include any relevant
information or annotations you want to store with the new analysis.
Note
Click Options > Show Advanced Option for additional configuration choices in the Chart
Options area. See "Chart Options Panel" on page 22for more details.
5. Type a name for your data group series in the available text field and choose the type of
data you desire from the dropdown list.
In the Data Group area of the page, the new trend analysis contains one data group. A
data group is a collection of series that share common properties. Each data group always
contains at least one series.
In this example we choose Logged Data. This option allows you to plot metering device
data, weather data or relative pricing data.
6. Click Select a Source.
A new window appears containing the various sources configured within your system.
7. Select the applicable source and click OK.
Note
You may not have permissions to access all displayed sources. These sources appear
grayed out and are not selectable.
8. Click Select a Measurement. A new window appears containing the various
measurements configured within your system. Select the applicable measurement and
click OK.
Note
Only measurements that have imported data for the selected source appear in the new
window.
9. Choose the Default Chart Type, Series Color, Time Range and Y-Axis as necessary.
Page 28 of 150
© 2012 Schneider Electric. All rights reserved.
ION EEM 4.0 R2 User Guide
Chapter 2: Trend Analysis Module
Note
While data may exist for the sources that you have selected, the data may not be available
for the time range specific to the analysis. This can result in a blank trend.
10.Click the Update Chart button. The new chart appears.
11.In the Axis Options pane, fill in the available text fields, naming your X-Axis, Primary YAxis and Secondary Y-Axis as required.
12.To add more data to your trend analysis, either:
• Click the Add Data Group button (below the chart area).
A new Data Group appears on your Trend Analysis page. Repeat steps 4 through 7 to
configure this data group. - or • Click the Plus (
) icon beside the series name.
A copy of the original series is created. All of the data group properties are applied to the
new series as well. The new chart can now be customized.
Note
Click Options > Show Advanced Options for additional chart and data group
configuration options. See "Data Group Panel" on page 23 for a list of all available options.
13.Click the Update Chart button after adding the new data.
14.Click File > Save As to save the report once you are satisfied with the analysis.
A new window appears. Depending on your User Permissions, you can choose the name
and share level of your new trend analysis.
15.Click OK to close the window.
Tip
Your chart is displayed in Chart mode by default. This mode’s rendering performance is
proportional to the number of data points in the analysis. For example, 8 months worth of
15-minute interval data contains many thousands of points. Creating a chart with that many
points can significantly affect on-screen performance. Try rolling up to a daily or hourly rate.
There are many less points to render on the chart, which improves performance.
Open an existing trend analysis
To open an existing trend analysis:
1. Click File > Open in the upper left corner of the page. A new window opens containing a
list of the analyses that exist within your system.
Note
If you do not have permission to access the sources used by a trend analysis, you will not
be able to open the trend analysis, even those that are displayed as available. These
permissions are enabled by an Administrator. See "User Permissions" on page 112 for
more information.
2. Select the appropriate report and click OK.
© 2012 Schneider Electric. All rights reserved.
Page 29 of 150
Chapter 2: Trend Analysis Module
ION EEM 4.0 R2 User Guide
3. Click Save to save your changes. See "Select/update trend analysis data" on page 31 for
more information.
Note
Modifying reports requires the appropriate user permissions assigned by your ION EEM
Administrator.
Manage trend analyses
To manage the analyses available in your system:
1. Click File > Manage in the upper left corner to open the Manage Trend Analyses
window.
The trend analyses that appear in the Manage Trend Analyses window are the ones that
your user account has permission to display. If you require a trend analysis that is not in
the list, an ION EEM Administrator must first set up permissions. See "Permissions" on
page 111 for additional information.
2. Select the Manage option, and then choose from one of the available options:
• New Folder Creates a new folder for analysis management.
• Delete: Deletes the analysis from your system.
• Rename: Renames the analysis. Enter a new analysis name and click Update to
change.
• Copy: Copies the selected analysis. Choose the new folder or root location for the
analysis and click Update.
• Move: Moves the analysis to a new location. Choose the new folder or root location for
the analysis and click Update.
• Close: Closes the window.
Note
The Delete, Rename, Copy, and Move options are only available to the Trend Analysis
owner, or an Administrator. For all other users, these buttons are grayed out.
To share the trend analyses available in your system:
1. Click File > Manage. The Manage Analyses window appears.
2. Select the Share option.
3. Select the trend analysis to share from the list in the left-hand pane of the window.
4. Use the left/right arrow buttons to share (or unshare) your analyses with others.
5. Click Apply to save the new sharing configurations for the analysis.
Note
Sharing trend analyses with other users and groups is a security specific function. You may
not have the appropriate permissions to share analyses in this manner. As a result, some
buttons may be disabled. Contact your ION EEM Administrator for more information.
Page 30 of 150
© 2012 Schneider Electric. All rights reserved.
ION EEM 4.0 R2 User Guide
Chapter 2: Trend Analysis Module
Select/update trend analysis data
1. Click the Trend Analysis tab.
2. Click File > Open in the top left corner to view the trend analyses available in your
system.
3. Select the trend analysis to update from the report window.
4. Update the analysis by adding a data group, copying a data series, renaming an axis, or
changing the source and measurement of a particular data group.
5. Click Select a Source to change the source of a data group.
A new window appears containing the various sources configured within your system. The
available hierarchies depend upon your system configuration.
6. Select the desired source and click OK.
7. Click Select a Measurement to select a new measurement for the data group.
A new window appears containing the various measurements configured within your
system. The measurements available in your system are logically grouped by type.
8. Select the desired measurement and click OK.
© 2012 Schneider Electric. All rights reserved.
Page 31 of 150
Chapter 2: Trend Analysis Module
ION EEM 4.0 R2 User Guide
9. Choose your chart type, series color, time range and Y-Axis as necessary.
Note
Click Options > Show Advanced Options for additional chart and data group
configuration options. See "Data Group Panel" on page 23 for a list of all available options.
10.Click Update Chart to incorporate your changes into the trend analysis you are editing.
Tracking saved trends usage and deletion
Some ION EEM installations have a large number of saved trends, which can have an impact
on the loading time of certain pages. Administrators need to know which trends are actively
used and which can be safely deleted.
ION EEM Administrators can track trend usage through a message in the System Log.
Additionally, Administrators can also track trends that have been deleted .
These log messages are given a prefix in their description called Trend Tracking, allowing for
the messages to be filtered from the other messages in the System Log. The trend tracking
functionality can be turned on or off using the TrackSavedTrendsUsage, and the
TrackSavedTrendsDeletion configuration properties. Contact your ION EEM
Representative for more information.
Page 32 of 150
© 2012 Schneider Electric. All rights reserved.
ION EEM 4.0 R2 User Guide
Chapter 2: Trend Analysis Module
Set a Fixed Time Range for charts
1. Click the Trend Analysis tab.
2. Select Fixed Time from the Time Range drop-down list in the Data Group area.
3. Enter the date range information in either a mm/dd/yyyy format, or click the calendar icon
to select the start and end dates. Time can be entered as a standard twelve hour clock
value, or use the up/down arrows beside the time field to set the time values.
When analyzing sources of data from different time zones, you may find it easier to view the
data in UTC in order to see the data in a consistent time reference. Select (UTC)
Coordinated Universal Time from the time zone dropdown menu next to the date and time
fields.
Note
Data can be retrieved in any time zone configured within your system. Time zones are
configurable in the ION EEM system. Once a time zone has been configured, it becomes a
selection in the time zone dropdown menu. The default option returns all data in the
source’s local time. Contact your ION EEM Administrator for more information.
© 2012 Schneider Electric. All rights reserved.
Page 33 of 150
Chapter 2: Trend Analysis Module
ION EEM 4.0 R2 User Guide
Export trend analysis to report
You can save the Trend Analysis as a report. This allows the analysis to be viewed in the
Reporting module and exported as a PDF, Excel or XML file, shared with other users, or
delivered as a subscription.
To create a Trend Report:
1. Click the Trend Analysis tab.
2. Click File > New to create a new analysis or click File > Open and select a previously
saved analysis from the dialog box. The analysis is displayed.
3. Click File > Save As.
4. Enter the name of the report in the Name field. The report will use this name as a label in
the Reports list, and as the file name the report is saved under.
5. Select Report from the Save as: dropdown menu. The Report Title and Description
fields appear.
6. Enter the title of the report in the Report Title field. You also have the option of entering a
description of the report in the Description field.
7. Click the Show Data Table checkbox to include a data table as part of the report.
Page 34 of 150
© 2012 Schneider Electric. All rights reserved.
ION EEM 4.0 R2 User Guide
Chapter 2: Trend Analysis Module
Note
The data table option should only be used for smaller trends. Large trends can have very
large data tables associated with them, resulting in a report that could be many pages long.
8. Click OK to save the analysis as a report. A message appears under the chart area
explaining that the trend has been saved as a report.
ION EEM creates a new report that, when rendered in the Reports tab, contains the chart
from the Trend Analysis currently open in the Trend Analysis tab, the title provided when
the report was saved, and the description provided at the time the report was saved.
Once created, the report has no connection to the original trend analysis. The analysis can be
deleted or modified without affecting the report.
The report has no input parameters that are configurable from the Report Module. The title,
description, and chart options are only configurable in the Trend Analysis module by
recreating a report of the same name.
Note
Even if the trend analysis was in table form, the report will always show a chart. The trend
report will not show tables, except as a supplement to a chart when the Show Data Table
checkbox has been selected.
To open a trend analysis in Reports:
1. Click the Reporting tab.
The trend analysis that was saved as a report now appears in the Reports list on the left.
It can be treated the same way as any other report in the list.
2. Click on the title of the report. The report of your trend analysis appears.
From here, you can select to save the report as a PDF file, as a Microsoft Excel
document, or as an XML document from the Select a format dropdown list. See
"Generating and viewing a report" on page 76 for information on exporting, sharing, and
subscribing to the analysis report.
© 2012 Schneider Electric. All rights reserved.
Page 35 of 150
Chapter 2: Trend Analysis Module
ION EEM 4.0 R2 User Guide
Printing a trend analysis
Printing a trend requires you to save the trend as a report, export the report as a PDF, and
finally view and print the report using your PDF software. As a PDF, the trend can easily be
shared, and does not require access to ION EEM to view or print.
To print a trend analysis:
1. Export the trend analysis to report as described in the section "Export trend analysis to
report" on page 34.
2. Navigate to the Reports tab.
3. Click on the name of the report from the list on the left hand side. The report will take a
moment to generate.
4. Select PDF file from the Select a format dropdown menu above the chart area.
5. Click Download.
6. Click Save in the File Download dialog box and create a name for the PDF file.
7. Click Save.
8. Click Open from the Download complete dialog box.
9. From the PDF file, click File > Print or the Print icon (
Page 36 of 150
) to print the file.
© 2012 Schneider Electric. All rights reserved.
ION EEM 4.0 R2 User Guide
Chapter 2: Trend Analysis Module
Trend analysis expressions
From the data group's Data Type dropdown list, the Calculated Data series type is used to
evaluate generic computations that are based on other series data included in the chart.
There are two fundamental function types to be aware of when working with the calculated
data series types:
Aggregate functions:
An aggregate function performs an operation on the entire result data set and returns a single
value that applies to all rows for the calculation (e.g. getting the average of the entire result
set).
Row-based calculated values:
Row-based calculated values calculate a unique value on a row-by-row basis (e.g.
multiplying a result row by 2).
Note
All calculated series data expressions are evaluated after any roll-up, aggregation or filtering
is applied to the dataset.
Any series that has been defined in any of the chart’s data groups can be used as input to the
calculated data series. The proper syntax to reference another series is to wrap its full series
name in square brackets "[ ]". See "Expression syntax" on page 38 for more details.
Tip
A method to reduce the chance of entering an incorrect name is to copy the series name
from the data group to be used in the expression and paste it between a set of square
brackets [ ] in the expressions field of the calculated series data group.
Calculated Data Example
Here is an example that consists of two series. The first series returns energy consumption
data for a month (logged data series), and the second series is a calculated data series that
calculates the cost of energy (assuming the cost of energy is a known fixed value of $0.15 /
kWh):
Logged Data series name = kWh Energy
Calculated Data Series expression = [kWh Energy] *0 .15
The resulting data in the Calculated Data series is evaluated on a row-by-row basis to 0.15
multiplied by the energy value.
Sample results:
Timestamp
kWh Energy Value
Calculation Expression
Resulting Value
1/1/2010
1000
1000 * 0.15
2500
© 2012 Schneider Electric. All rights reserved.
Page 37 of 150
Chapter 2: Trend Analysis Module
ION EEM 4.0 R2 User Guide
1/2/2010
800
800 * 0.15
2000
1/3/2010
950
950 * 0.15
2375
…
…
…
…
The next example uses an aggregate function in the expression. Using the same two series
as above, if we change the expression for Calculated Data series to include an aggregate
function we can calculate the average kWh Energy value:
Calculated Data Series expression = AVG ([kWh Energy])
The result set is shown below:
Timestamp
kWh Energy Value
Calculation Expression
Resulting Value
1/1/2010
1000
AVG (All Energy Values)
916.67
1/2/2010
800
AVG (All Energy Values)
916.67
1/3/2010
950
AVG (All Energy Values)
916.67
…
…
…
…
The final example shows how calculated values can be used in conjunction with aggregate
functions. The deviation from the average energy value can be calculated for each row in the
resulting energy data with the following expression:
Calculated Data series expression = [kWh Energy] - AVG ([kWh Energy])
The result set is shown below:
Timestamp
kWh Energy Value
Calculation Expression
Resulting Value
1/1/2010
1000
1000 - AVG (All Values)
83.33
1/2/2010
800
800 - AVG (All Values)
-116.67
1/3/2010
950
950 - AVG (All Values)
33.33
…
…
…
…
Expression syntax
When creating an expression, use the full series name property wrapped in square brackets "
[ ]" to refer to the data. For example, if there is one series with the name Unit Price, and
another Quantity, the expression would be:
[Unit Price] * [Quantity]
Constant values are supported and can be typed directly into the expression:
[Unit Price] * 100
Page 38 of 150
© 2012 Schneider Electric. All rights reserved.
ION EEM 4.0 R2 User Guide
Chapter 2: Trend Analysis Module
Operators
The following arithmetic operators are supported in expressions:
+
Addition
-
Subtraction
*
Multiplication
/
Division
%
Modulus
Aggregates
Aggregate functions will evaluate and be replaced by their result. Aggregate functions can
take in a single series reference, or an expression that will be evaluated prior to performing
the aggregation.
The following aggregate types are supported:
Sum
Calculate the sum of the result set
Avg
Calculate the average of the result set
Min
Find the minimum in the result set
Max
Find the maximum in the result set
StDev
Calculate the statistical standard deviation
Var
Calculate the statistical variance
The syntax is:
Function(expression)
Expression
The expression property can be a single reference series, or a calculation based
on multiple series. Aggregate expressions may not contain other aggregates in
the expression.
ISNULL function
Checks the value of an expression on a row-by-row basis and either returns the checked
expression or a replacement value.
The syntax is:
ISNULL(Series name, replacementvalue)
Series name
The series to check.
Replacementvalue
If the series referenced has a null value (on a row-by-row
basis), the replacementvalue is used instead of the Null value.
Null values may be present due to gaps in the source data,
filtering or time alignment.
Example: This will replace null values with the value 0.
IsNull([kWh Energy], 0)
IIF (If and only If function)
Gets one of two values depending on the result of a logical expression.
© 2012 Schneider Electric. All rights reserved.
Page 39 of 150
Chapter 2: Trend Analysis Module
ION EEM 4.0 R2 User Guide
The syntax is:
IIF(expr, truepart, falsepart)
Expression
A logical condition to evaluate using reference series. The logical
operators allowed are:
<
Less than
<=
Less than or equal
>
Greater than
>=
Greater than or equal
=
Equal
<>
Not equal
Truepart
The value to return if the expression is true.
Falsepart
The value to return if the expression is false.
Example: This will check to see if an energy value is less than a constant. If it is, it replaces
it; if not, it returns the original value.
IIF([kWh Energy] < 1000, 1000, [kWh Energy])
Page 40 of 150
© 2012 Schneider Electric. All rights reserved.
ION EEM 4.0 R2 User Guide
Chapter 3: PQ Analysis Module
Chapter 3: PQ Analysis Module
This section discusses the PQ Analysis interface, PQ Event Classifications and the PQ
Waveform Viewer. It also covers procedures for creating, classifying and managing your PQ
Analyses.
In this section:
PQ Analysis Page Interface
42
Menu bar
42
Event Selector Area
43
Event Summary Area
44
Chart Control area
45
PQ Analysis icon summary
46
Create a new PQ Analysis
47
Open an Existing PQ Analysis
48
Manage PQ Analyses
49
Classify PQ Analyses
49
Share PQ Analyses
50
Filter PQ Analyses by Time Dimension
51
Add or Remove Filters
53
View Details of PQ Analyses
53
View waveforms of PQ analyses
54
Waveform Viewer
55
Waveform Viewer window
55
Waveform Explorer area
56
Waveform Viewer area
57
List Mode
57
Details Mode
58
Open multiple Waveform Viewers
59
Waveform viewer icon summary
59
Printing your PQ Analysis Reports
59
Power Quality Event Types
59
Related topics:
• "Printing your PQ Analysis Reports" on page 59
© 2012 Schneider Electric. All rights reserved.
Page 41 of 150
Chapter 3: PQ Analysis Module
ION EEM 4.0 R2 User Guide
PQ Analysis Page Interface
Use the PQ Analysis as a tool to create customized views of your PQ event data. After you
create the views, you can add them to your Dashboard Interface. See "Creating a new
dashboard page" on page 14 for more details.
Zooming and Scrolling
All charts support zooming and scrolling. To zoom in, click and drag around an area of a chart.
The view changes to show only the selected area. Horizontal and vertical scroll bars provide
the ability to view areas of the chart that are outside of the zoom area. To zoom out to the
original view of the chart, click the (
) icon at the corner of the chart.
The PQ Analysis Interface has five main areas:
• Menu Bar
• Event Selector Area
• Event Summary Area (Chart area)
• Chart Control Area
• Details Area
A Menu Bar B Event Selector Area
C Event Summary Area
D Chart Control E Details Area
Menu bar
Below is the list of commands available from the PQ Analysis page menu bar.
Some commands may be disabled (grayed out), depending on your selection, the current
available options, or your user permissions.
Page 42 of 150
© 2012 Schneider Electric. All rights reserved.
ION EEM 4.0 R2 User Guide
Chapter 3: PQ Analysis Module
File
• New: Creates a new PQ analysis. See the "Create a new PQ Analysis" on page 47
section for more details.
• Open: Opens an existing PQ analysis.
• Manage: Moves, renames, deletes or copies your existing PQ analyses. See the "Manage
PQ Analyses" on page 49 section for details.
• Save: Saves the currently viewed analysis. When a PQ Analysis is saved, your current
view (chart or table) is also saved. Your saved view is used to display the item when it is
first loaded on the Dashboard page.
PQ Analysis items contain a full summary of the input query parameters.
• Save As: Allows you to name and choose the saved location of your PQ analysis.
Note
Any changes made to your PQ Analysis are not permanent until you save the analysis.
Options
• Show Advanced Options: reveals additional filters for use in your event queries.
Help
• Displays the PQ Analysis Help contents.
Event Selector Area
The Filter area displays the filters that are available for your PQ analysis. By default the PQ
Analysis page displays in Normal mode with Select Sources and Select Event Type filter
buttons.
To view all available filter buttons, select Options > Show Advanced Option from the
menu bar. The filter area updates with all filters displayed:
• Select Sources: Select the source to by used in the analysis.
• Select Phase: Select from Phase 1 through Phase 5.
• Select Classification: Classifications are configured at the administrator level. See
"Classify PQ Analyses" on page 49 for details.
• Select Event Type: allows you to filter your results by standard event types, SARFI or
custom parameters. See "Power Quality Event Types" on page 59 section for details.
© 2012 Schneider Electric. All rights reserved.
Page 43 of 150
Chapter 3: PQ Analysis Module
ION EEM 4.0 R2 User Guide
• Select Time Filter: allows you to filter your results by time dimension. See "Filter PQ
Analyses by Time Dimension" on page 51 for details.
• Search by Comment: allows you to filter events by comment. Comments are added
when events are classified. See "Classify PQ Analyses" on page 49 for details.
Click Query to run the PQ Analysis based on your filter selections. The results display in the
Event Summary Area.
Event Summary Area
Power Quality events usually occur in quick succession. ION EEM will group together events
by time and display a single representative point for each group in the event summary area.
Below the summary area, the details area shows all of the individual events that were
grouped together in the summary area. See "Chart Control area" on page 45 for more
information.
Use the Event Summary area to view the PQ Events you selected in the Event Selector
Area. By default, your event summary displays in Chart mode.
• Chart: allows you to interact with the chart by zooming in or selecting items within the
chart to view their details or their waveforms. Customize this view in the Chart Control
area. Once you have selected the desired events with your cursor, click the Waveform or
View Details buttons to view.
To zoom out of your chart, click on the Chart Title (not the container title) and the chart will
zoom out to its original size.
• Table: allows you to view the PQ Analysis in table format. Sort the table by its column
headings: Source, Start, Phase, Nominal, Magnitude, Duration, Detail Events, Type,
Classification or Comment.
Page 44 of 150
© 2012 Schneider Electric. All rights reserved.
ION EEM 4.0 R2 User Guide
Chapter 3: PQ Analysis Module
• Summary Table: allows you to view the PQ Analysis in an Event Summary table format.
Enlarge or download (in .csv format) the event summary by clicking the icons in the upperright corner of the pane. The Event Summary table is not sortable in this view.
• Cumulative Summary: allows you to view the PQ Analysis in Event Cumulative table
format. Enlarge or download (in .csv format) the event summary by clicking the icons in
the upper-right corner of the pane. The Event Summary table is not sortable in this view.
Enlarge PQ Analysis view
All chart views allow you to enlarge your analysis on its own standalone page:
1. Click the enlarge icon (
)to view your analysis on its own page.
2. Click the Return to previous view text in the bottom right corner of the window to return
to your PQ Analysis page.
Download PQ Analysis data
All chart views allow you to download data in .csv format.
1. Click the download icon (
) to download the analysis in .csv format.
Chart Control area
The Chart Control area allows you to control the appearance and functionality of your chart
views. Some of the available settings depend upon your current page view.
Determines the cursor
behavior when interacting
with your chart.
Selected Events
(default), Zoom/Scroll
Groups events by symbol.
Each symbol will represent
one value of the selected
option.
None (default),
Source, Phase,
Classification, Age,
Event Type, Day of
Week, Month,
Calendar Quarter,
Work Week
Color Group
Groups events by color.
Each color will represent one
value of the option selected.
None (default),
Source, Phase,
Classification, Age,
Event Type, Day of
Week, Month,
Calendar Quarter,
Work Week
Chart Overlay
Changes the X and Y
resolution of your charts
according to the option
selected.
No Overlay, ITI
(CBEMA - default),
SEMI F47
Cursor Mode*
Symbol Group
* Available in Chart and Table views only.
© 2012 Schneider Electric. All rights reserved.
Page 45 of 150
Chapter 3: PQ Analysis Module
ION EEM 4.0 R2 User Guide
After you have finished configuring your control settings, click Update to view your analysis
using your changes.
PQ Analysis icon summary
The PQ Analysis icons function as follows:
Opens the PQ Analysis in its own web page.
Downloads data in.csv format to a user-determined location.
Creates a copy of the time dimension filter group.
Deletes the data group from your time dimension filter.
Opens the type of filter applied to your data group.
Page 46 of 150
© 2012 Schneider Electric. All rights reserved.
ION EEM 4.0 R2 User Guide
Chapter 3: PQ Analysis Module
Create a new PQ Analysis
This section leads you through the process of creating a new PQ analysis report. In this
example we will begin with a blank PQ analysis. Before you begin, ensure you are viewing
the PQ Analysis page.
To create a new PQ Analysis:
1. Click File > New to create a new analysis report.
A new PQ analysis page with an empty chart area appears. The chart area will remain
blank until you add your data sources to your analysis.
2. In the Events selection area, choose between the most recent events or select a time
range for your events.
3. If desired, choose a source local time from the supplied drop down list.
4. Click Select Sources.
A new window that contains the various sources configured within your system appears.
You can also choose to select by attribute. Select the desired source or attribute and click
OK.
Note
Sources are configured at the Administrator level. Contact your ION EEM Administrator for
more information on the sources available to you.
© 2012 Schneider Electric. All rights reserved.
Page 47 of 150
Chapter 3: PQ Analysis Module
ION EEM 4.0 R2 User Guide
5. Click the Select Event Type button. A new window appears that allows you to select from
Standard, SARFI or Custom event types (duration and magnitude). Select your event
types as required, and click OK.
Click Cancel to return to the original screen with no event types selected.
Note
By default, all standard event types are selected.
6. Click Query to find the events that match your selected criteria.
Note
You may also click Options > Show Advanced Options for more data filtering choices in
the Power Quality Analysis area, including Filter PQ Analyses by Time Dimension. See
"Event Selector Area" on page 43 for more details.
7. Once you are satisfied with your PQ analysis, click Save As to save the report.
A new window appears. Depending on your User Permissions, you can choose the name
and share level of your new report.
8. Click OK to close the window.
Open an Existing PQ Analysis
To open existing PQ analysis reports:
1. click File > Open in the upper left corner.
2. A new window opens containing a list of the PQ analyses that exist within your ION EEM
system. Select the appropriate analysis and click OK.
3. Make necessary changes and click Save.
Page 48 of 150
© 2012 Schneider Electric. All rights reserved.
ION EEM 4.0 R2 User Guide
Chapter 3: PQ Analysis Module
Note
Modifying a PQ Analysis requires the appropriate user permissions assigned by your ION
EEM Administrator.
Manage PQ Analyses
Note
Managing PQ Analyses is a security specific function. You may not have the appropriate
permissions to manage analyses.
To manage the PQ analyses available in your system:
1. Click File > Manage. The Manage Analyses window appears. Ensure the Manage option
button is selected.
2. Manage your analyses as desired. The available options are:
• New Folder: Creates a new folder for analysis management.
• Delete: deletes the analysis from your system.
• Rename: renames the analysis. Enter a new report name and click Update to change.
• Copy: copies the selected analysis. Choose the new folder or root location for the
analysis and click Update.
• Move: moves the analysis to a new location. Choose the new folder or root location for
the analysis and click Update.
• Close: closes the window.
Note
The Delete, Rename, Copy, and Move options are only available to the PQ Analysis
owner, or an Administrator. For all other users, these buttons will be grayed out.
Classify PQ Analyses
Classifying a PQ Analysis is a permission-specific activity. Those with permission to
classify events are Power users and Administrators. Regular users and User Administrators
can view an analysis but cannot classify the event. See "Users" on page 107 for more
information.
To classify an event:
1. In your PQ Analysis, select at least one event (in chart mode or table mode - see "Event
Summary Area" on page 44 for details) to classify.
2. Click the Classify button.
© 2012 Schneider Electric. All rights reserved.
Page 49 of 150
Chapter 3: PQ Analysis Module
ION EEM 4.0 R2 User Guide
3. From the dropdown list, select the desired classification for your event(s).
4. Add a descriptive comment to the text field beneath your classification list (optional).
Note
If you classify this event with a classification that you have filtered out in your Query (see
"Classify PQ Analyses" on page 49 for details), your selected event will disappear when
you close the window.
5. Click OK.
6. In the PQ Analysis page, your analysis updates using the new classification filter.
7. Click File > Save to save your analysis.
Note
You can create a new classification by going to Administration and selecting
Configuration from the Power Quality section. See "Configuration" on page 132 for
additional information.
Share PQ Analyses
To share the PQ analyses available in your system:
1. Click File > Manage. The Manage Analyses window appears. Ensure the Share button is
selected.
2. Select the PQ Analysis you wish to share by selecting from the list in the left-hand pane of
the window.
3. From the Available Users and Groups list, use the left/right arrow buttons to share or clear
your analyses.
4. Click Apply to apply your new sharing configurations to your analysis.
Note
Sharing PQ Analyses with other users and groups is a security-specific function. You may
not have the appropriate permissions to share analyses in this manner. See "Users" on
page 107 for details.
Page 50 of 150
© 2012 Schneider Electric. All rights reserved.
ION EEM 4.0 R2 User Guide
Chapter 3: PQ Analysis Module
Filter PQ Analyses by Time Dimension
You can also filter your data results by Time Dimension in the PQ Analysis page.
To filter your data results by time dimension:
1. Click Options > Show Advanced Options.
Additional options are now available in the PQ Analysis Event selection area. You can now
select from the following filters:
• Source
• Phase
• Classification
• Event Type
• Time Filter
• Comment
2. Click the Select Time Filter button. A new Time Dimension filter appears.
3. From the available drop down list, select the desired time filter.
Time Filter
Available Selections
None (default)
No filter applied.
Day of Week
Sunday through Saturday
Day of Month
01st to 31st
Day of Year
001 to 366
Hour of Day
00 to 23
Week of Year
01 to 53
Month
January through December
Year
1980 to 2050
Minute
00 to 59
Calendar Quarter
1st to 4th quarter
Work Week
Weekday, Weekend
4. When you have selected your filter, click the Filter icon ( ). A new window appears. In
the example below, the user selected the Day of Week filter.
© 2012 Schneider Electric. All rights reserved.
Page 51 of 150
Chapter 3: PQ Analysis Module
ION EEM 4.0 R2 User Guide
5. Select the values you wish to include in your time filter configuration. Click OK to submit
your changes to the database.
If you wish to return to the Time Dimension interface, close the window. No changes are
submitted to the database.
6. If required, you can add more Time Dimension copies to the filter by clicking the Add icon
(
).
For best results when working with more than one Time Dimension Filter, work in time
increments from largest to smallest. For example, in the graphic below the filters work
from Calendar Quarter > Work Week > Day of the Week.
Page 52 of 150
© 2012 Schneider Electric. All rights reserved.
ION EEM 4.0 R2 User Guide
Chapter 3: PQ Analysis Module
7. As you customize each filter, the parameters beside each filter update to reflect your
configurations.
8. Click OK to save your Time Dimension filters.
9. Save your updated PQ Analysis.
To remove a Time Dimension filter:
1. Click the Remove icon (
filter is removed.
) beside the Time Dimension filter you wish to delete. The data
2. Click OK.
3. Save your updated PQ Analysis.
Add or Remove Filters
You can choose to use multiple filters for your Power Quality Analysis.
To add a filter:
1. If you have not already done so, click Options > Show Advanced Options from the
menu bar. The filter area of your PQ Analysis page will update with new filter selection
buttons, including Source, Phase, Classification, Time, Event Type and Comment.
2. Choose from the available filter options and configure your PQ Analysis as desired.
3. Click Query to run your analysis.
4. Click Save.
To remove a filter:
1. Beside each data filter is a text description of the filter’s parameter set. Click the filter you
wish to delete items from.
2. The filter’s window appears. Deselect the desired items and click OK. The filter item is
removed.
3. Click Query to run the analysis with your updated configurations.
4. Click Save.
View Details of PQ Analyses
In order to view specific details of a PQ Analysis, you must first select at least one event. To
do this:
1. From your PQ Analysis page, ensure you are viewing your analysis in either chart mode or
table mode.
2. Select one or more events in the chart (or table).
Tip
To zoom out of your chart, click on the Chart Title (not the container title) and the chart will
zoom out to its original size.
© 2012 Schneider Electric. All rights reserved.
Page 53 of 150
Chapter 3: PQ Analysis Module
ION EEM 4.0 R2 User Guide
3. Click the View Details button. The event(s) details display below the Event Summary
area.
View waveforms of PQ analyses
In order to view waveforms, you must first select at least one event. To do this:
1. From your PQ Analysis page, ensure you are viewing your analysis in either chart mode or
table mode. See "Event Summary Area" on page 44 for details.
2. Select one or more events in the chart (or table).
3. Click View Waveforms. The event(s) details display below the Event Summary area.
Page 54 of 150
© 2012 Schneider Electric. All rights reserved.
ION EEM 4.0 R2 User Guide
Chapter 3: PQ Analysis Module
Waveform Viewer
The Waveform Viewer allows you to examine waveforms from PQ Events. You can display
these waveforms from either the Event Summary Area or the Details area of the PQ Analysis
page.
Note
The waveform viewer browser window does not display navigation buttons or the browser
address bar. This window is designed to be positioned in view while also viewing PQ
Analysis page.
Waveform Viewer window
From the Waveform Viewer window, you can:
Plot the raw waveform, the RMS waveform, and the phasors for any selected waveform.
Attribute-related display options allow you to group waveforms by various properties such
as timestamp and source, phase type, quantity (i.e.. voltage/current).
Time-related display options allow you to view waveforms in a connected view in which
the X-axis is absolute time, or an Aligned view in which the X-axis is relative time and
waveforms are aligned by trigger time.
The Waveform Viewer has two main areas:
Waveform Explorer area
Waveform Viewer area
© 2012 Schneider Electric. All rights reserved.
Page 55 of 150
Chapter 3: PQ Analysis Module
ION EEM 4.0 R2 User Guide
Waveform Explorer area
The Waveform Explorer presents a tree view that allows you to select the particular
waveforms you want to display. The hierarchy of this tree view is as follows: Summary
Event > PQ Event > Waveform Group (with unique timestamp within the PQ Event) >
Waveform (e.g. V1).
Both the top level element (Summary Event) and the third level element (unique timestamp
within PQ Event) may not appear in every case. This depends on:
The type of events selected in the PQ Analysis page at the time the View Waveforms
button was clicked
The time stamps of the waveforms within each PQ Event.
If you selected only PQ Events (and no Summary Events) before clicking View Waveforms,
the top level element of the tree would be a PQ Event, and not a Summary Event.
If all waveforms associated with a PQ Event have a common timestamp, then the third-level
element will not appear.
Group by Source
You can also select waveforms by source. Click the Group By Source checkbox to include
the source level of the tree. Select and Deselect Waveforms
1. To select all events, click the Select All link at the top of the Waveform Explorer.
2. To clear all events, click the Select None link. Navigate through the tree view to select the
desired waveform.
By default, selecting a Summary Event or Event has the effect of selecting all associated
waveforms. The tree view autochecks the child nodes.
3. Click Load Waveforms to view your waveform(s) in the Waveform Viewer area.
Page 56 of 150
© 2012 Schneider Electric. All rights reserved.
ION EEM 4.0 R2 User Guide
Chapter 3: PQ Analysis Module
Waveform Viewer area
Use the Waveform Viewer to display the events or waveforms you selected for viewing in the
Waveform Explorer area.
The Waveform Viewer operates in two modes:
List Mode
Details Mode
List Mode
By default, all waveforms render in List mode. Configure the various grouping options in order
to display the selected waveforms as desired.
List mode features
The following features are available in Waveform List mode:
Modify your waveform selection by using the Waveform Explorer and selecting or
deselecting the individual waveforms, events and summary events.
Combine waveforms either by aligning them in time or by joining them end-to-end.
Waveforms can be viewed as single charts or as multiple charts that break out each
waveform component. See "Open multiple Waveform Viewers" on page 59 for details.
Waveform components (such as voltages and current plots) can be broken out (stacked).
RMS plots for all waveform components are available.
© 2012 Schneider Electric. All rights reserved.
Page 57 of 150
Chapter 3: PQ Analysis Module
ION EEM 4.0 R2 User Guide
For detailed examination of a waveform, switch to Waveform Details Mode by clicking on
the magnifying glass (zoom icon) next to a waveform.
Zooming, panning
The number of charts displayed in this mode depends on the particular waveforms you
selected and the grouping options being used. Each waveform chart contains waveforms
with common grouping properties. For example, if the user chooses to group waveforms by
quantity (voltage/current), then each chart would contain waveforms with a unique quantity.
You can also open multiple waveform viewers. See "Open multiple Waveform Viewers" on
page 59 for details.
Details Mode
To use Details mode for detailed waveform analysis:
1. In the Waveform Viewer, click the Zoom icon (
).
The Waveform Viewer: The Detail Mode window appears.
The description of the chart includes the related event summary information, including
timestamp and event type.
2. Select or clear the available boxes to include or exclude raw values, RMS and min/max
values of your waveform details.
Note
If you cannot see these selections, click the maximize icon (
formatting options.
3. If desired, click the Download icon (
(for example, any-name.xls).
) to reveal the details
) to save the data to your computer as an Excel file
4. To return to the previous page (List mode), click the Return icon (
).
Note
Chart appearance in this mode depends on the waveform(s) you were viewing in List mode.
Details mode features
The following features are available in Details mode:
Zooming, panning
Per-component control of Min., Max., RMS plotting
Information about user-selected points along a waveform
Click a point on the chart to display a new label with the value of the point. A detailed tool
tip also appears.
Note
If no voltage or current components are selected when entering Details mode, those
sections render on screen as collapsed.
Page 58 of 150
© 2012 Schneider Electric. All rights reserved.
ION EEM 4.0 R2 User Guide
Chapter 3: PQ Analysis Module
Open multiple Waveform Viewers
To open multiple waveform viewers:
1. Select the desired event(s) in the PQ Analysis Interface.
2. Click View Waveforms more than once (i.e. twice to open two waveform viewers, three
times to open three, etc.)
Waveform viewer icon summary
The PQ Analysis icons function as follows:
Opens Waveform Details mode.
Downloads data in .xls format to a user-determined location.
Reveals formatting options while in Details mode.
Hides formatting options while in Details mode.
In Details mode, returns you to your previous Waveform Viewer screen
(which displays in List mode).
Printing your PQ Analysis Reports
If you wish to print a fixed width table or a PQ Analysis Chart that does not wrap to the next
line (to fit itself to the width of your printed page), there are a few steps that may help.
To change the printed page orientation to landscape (wide):
1. Click File > Page Setup.
2. In the Page Setup window that appears, click the Landscape orientation button.
You may also configure your headers, footers and margins within the Page Setup Window.
3. Make your desired printing configurations. Click OK.
Your PQ Analysis charts or tables should now fit within your printed page.
Power Quality Event Types
SARFI
SARFI is an acronym for System Average RMS Variation Frequency Index. It is a power
quality index that provides a count or rate of voltage sags, swells, and/or interruptions for a
system. The size of the system is scalable: it can be defined as a single monitoring location,
a single customer service, a feeder, a substation, groups of substations, or an entire power
delivery system.
IEEE 1159
Power Quality events in ION EEM are classified according to the IEEE 1159 (the standard for
monitoring electrical power quality):
© 2012 Schneider Electric. All rights reserved.
Page 59 of 150
Chapter 3: PQ Analysis Module
ION EEM 4.0 R2 User Guide
Voltage (% nominal)
Name
Page 60 of 150
Min
Duration (seconds)
Max
Min
Max
Microsecond Transient
0
unlimited
0
0.001
Millisecond Transient
0
unlimited
>0.001
0.008333
Instantaneous Sag
10
90
>0.008333
0.5
Instantaneous Swell
110
unlimited
>0.008333
0.5
Momentary Interruption
0
< 10
>0.008333
3
Momentary Sag
10
90
> 0.5
3
Momentary Swell
114
unlimited
> 0.5
3
Temporary Interruption
0
< 10
>3
60
Temporary Sag
10
90
>3
60
Temporary Swell
110
Unlimited
>3
60
Sustained Interruption
0
< 10
> 60
unlimited
Undervoltages
10
90
> 60
unlimited
Overvoltages
110
unlimited
> 60
unlimited
Nominal
Anything not covered
above
© 2012 Schneider Electric. All rights reserved.
ION EEM 4.0 R2 User Guide
Chapter 4: Billing Module
Chapter 4: Billing Module
The Billing Module lets you create, view and compare billing information from various sources
in the system. This section discusses the Billing module interface, and covers procedures for
creating new bills, comparing two bills and obtaining detailed billing information.
In this section:
Billing Page Interface
62
Bill Filtering Control
62
Bill Selection Display
63
Bill Administration Menu
63
Bill Details Display
66
Viewing a summary report
68
Creating a new bill
69
Comparing two bills
70
Note
The information created by this module is intended for comparison or cost estimation
purposes.
Also note that low quality data (data that has gaps, spikes or other issues) can negatively
affect your bills.
© 2012 Schneider Electric. All rights reserved.
Page 61 of 150
Chapter 4: Billing Module
ION EEM 4.0 R2 User Guide
Billing Page Interface
The Bill Page Interface consists of the following:
• Bill Filtering Control
• Bill Selection Display
• Bill Administration Menu
• Bill Details Display
Bill Filtering Control
Use this feature to filter your bills based on user-available rate schedules or time ranges.
Filter displayed bills based on rate schedule
This drop-down list contains all the rate schedules available to you.
1. Select the desired rate schedule in the Rate Schedule drop-down list.
2. Click Show Bills. The Bill Selection Display below will now update with the bills for that
rate schedule.
Filter displayed bills based on time range
This control allows filtering of bills based on various time options.
1. Select the desired option in the Range dropdown list.
• If you want to customize a fixed time range, select Fixed Date then click the Start and
End calendars to specify the desired dates.
2. Click Show Bills.
Page 62 of 150
© 2012 Schneider Electric. All rights reserved.
ION EEM 4.0 R2 User Guide
Chapter 4: Billing Module
3. The Bill Selection Display will update with the bills that apply to that time range.
Bill Selection Display
There are seven columns used in the Bill Selection Display that communicate the bill status
and information. The display can be sorted on five of these columns:
• Cost Center: The source of billing data in the system.
• Rate Schedule:This specifies the rate schedule on which the bill calculation is based.
• Title: This is a configurable name for the bill.
• Date/Time Range: the time range over which the bill is calculated.
• Total: the total of all the various charges that are specified by the rate schedule.
Click a column header to sort the information accordingly. The remaining two columns
provide visual representation of the bill state.
• Bill Type Icon: This is a visual indication of where the cost data was generated. The table
below lists the bill type icons and their meanings.
Indicates that the bill cost data was calculated by the ION Rate Engine.
Indicates that the bill cost data was manually entered by a user.
Status Icon: This is a visual indication of the status of the bill. The bill status is displayed
using the following icons:
Bill calculation was successful.
Bill calculation was performed, but some conditions were not satisfied.
Bill calculation could not be performed due to discrepancies in the condition.
Further details on the source of the discrepancies can be obtained from the Bill Details pane
by clicking on the applicable bill in the Selection Display.
Bill Administration Menu
You can manage your bills from the Bill Administration menu. To use these options, click on
the desired operation:
© 2012 Schneider Electric. All rights reserved.
Page 63 of 150
Chapter 4: Billing Module
ION EEM 4.0 R2 User Guide
View Report: Opens the selected report in the Report Viewer. See "Viewing a summary
report" on page 68 for details.
New: Creates a new bill. Click this option to display the following fields:
The following diagram shows all the fields in the new/edit bill control:
Title:
A descriptive name for the bill.
Description:
A detailed description of the bill.
Cost Center:
The source from which the bill is calculated. First select the appropriate
hierarchy, then select the desired source from the treeview control.
Rate schedule:
A drop down list of available rate schedules to apply.
Period:
The start and end date/time for the bill calculation.
Type:
Rate Engine or Manual Entry. If this bill is going to be calculated by the
ION Rate Engine, select Rate Engine Bill. If this bill is going to represent
a manually entered bill (e.g. Copied from an actual paper bill), then select
Manual Entry Bill.
Manual Bill Entry
If you select Manual Entry Bill, a second control appears. From here you can manually enter
charges, as seen on the actual bill you receive. Using the ION Rate Engine you can compare
your paper bill and your shadow bill.
Page 64 of 150
© 2012 Schneider Electric. All rights reserved.
ION EEM 4.0 R2 User Guide
Chapter 4: Billing Module
Upon editing a Manual Entry Bill, the following display appears in the lower panel:
The charge tree on the right hand side allows the various charge values to added, edited or
cleared. There are four options available to you for the various charges:
For a charge that does not currently have a value, clicking Add allows
one to be entered as shown:
Add
Once a value has been entered, click either Set or Cancel to
accept/reject the value.
Edit:
Clear:
Clear Children:
© 2012 Schneider Electric. All rights reserved.
For a charge that already has an existing value, the Edit option allows the
value to be modified. The workflow is identical to 'Add' above.
To clear or reset an existing charge, click Clear.
For a parent charge, the Clear Children options allow you to quickly
clear all child charges.
Page 65 of 150
Chapter 4: Billing Module
ION EEM 4.0 R2 User Guide
When these fields have been entered or edited, the Save and Cancel buttons at the bottom of
the screen allow you to save or reject the changes.
Clone: Creates a new bill using the currently selected bill as a template.
Edit: Allows you to edit the parameters of the currently selected bill.
Run: Runs the ION Rate Engine for the given bill and updates the calculations.
Compare: Compares the various charges of two bills. This feature works in cases where
two bills use the same rate schedule and/or share a common charge hierarchy. For
example, the user may want to compare a manually entered paper bill against one
generated by the Rate Engine. See"Comparing two bills" on page 70 for more information.
Clear: Clears any detailed charges out of the selected bill.
Delete: Deletes the selected bill.
Bill Details Display
Obtaining detailed bill information
1. Select the bill from the Bill Selection Display. The following information appears in the
Details Display:
The summary information for the selected bill displays on the left-hand pane of the bill
details. Other details in addition to the summary information include:
Status: contains status messages generated by the ION Rate Engine when the bill cost
data was calculated.
Owner: indicates the user that created and owns the selected bill.
Type: Indicates whether the bill is calculated by the ION Rate Engine, or alternatively is
manually entered data.
Note
Your Bill Charge hierarchy displays on the right hand pane of the bill details. This hierarchy
is defined by the rate schedule definition. Depending on the rate schedule, some charges
may be rolled up in a "tree view" fashion. This lets you drill-down to the desired level of
Page 66 of 150
© 2012 Schneider Electric. All rights reserved.
ION EEM 4.0 R2 User Guide
Chapter 4: Billing Module
details on a given charge.
2. Choose Expand All or Collapse All (in the upper right-hand corner of the Bill Details
display) to globally expand or collapse the charge hierarchy.
There are three columns in the charge hierarchy:
Charge: This is a description of the charge. These should match the descriptions
presented on the paper version of the bill.
Cost: The associated cost with a particular charge. Some drill-down is possible here
depending on the rate schedule being employed.
Based On: Some charges may be based on peak/total values in the system, and hence
these values are presented here as an additional reference.
© 2012 Schneider Electric. All rights reserved.
Page 67 of 150
Chapter 4: Billing Module
ION EEM 4.0 R2 User Guide
Viewing a summary report
1. Select the applicable bill from the Bill Selection Display and click View Report. The
Report Viewer appears and displays the selected report.
Note
Clicking View Report opens the selected bill’s summary in the Reports page.
2. From the Select a Format dropdown list, choose the appropriate export format and click
the Export link.
3. You can select another available report in the tree menu of the Report Explorer (the lefthand pane). The report is displayed in the Report Viewer.
For information about report export formats, see "Exporting the Report" on page 77 for
details.
4. Click the Bills tab to return to the Billing page.
Page 68 of 150
© 2012 Schneider Electric. All rights reserved.
ION EEM 4.0 R2 User Guide
Chapter 4: Billing Module
Creating a new bill
1. Click the New button. The following fields are displayed:
2. Fill in the following fields with the appropriate information.
Title:
A descriptive name for the bill.
Description:
A detailed description of the bill.
Cost Center:
The source from which the bill is calculated. First select the appropriate
hierarchy, then select the desired source from the treeview control.
Rate Schedule:
A drop down list of available rate schedules to apply.
Period:
The start and end date/time for the bill calculation.
Type:
Rate Engine or Manual Entry. If this bill is going to be calculated by the
ION Rate Engine, select Rate Engine Bill. If this bill is going to represent
a manually entered bill (e.g., Copied from an actual paper bill), then select
Manual Entry Bill.
3. Click Save to save your bill.
© 2012 Schneider Electric. All rights reserved.
Page 69 of 150
Chapter 4: Billing Module
ION EEM 4.0 R2 User Guide
Comparing two bills
1. Click on the first bill to be used in the comparison from the Selection Display.
2. Click Compare.
3. Observe that the first selected bill has been tagged with a 1.
4. In the Selection Display, click on a second bill for comparison to the first bill.
5. Observe that the second bill has been tagged with a 2.
The lower pane now contains the detailed bill comparison
6. Click Cancel when finished with the comparison.
Clear: Clears the cost data calculations of the presently selected Bill Administration
Delete: Deletes the currently selected bill.
Note
ION EEM has the ability to perform ratchet charge calculations on your billing data. The
ratchet calculation setup is done in the Rate Wizard utility. At this time, the second ratchet
option is not supported in ION EEM. Additionally, the function was not designed to handle
DST (Daylight Saving Time).
Setting up ratcheting is an expert function that should only be performed by qualified
personnel. Contact Customer Support for more information about this function.
Page 70 of 150
© 2012 Schneider Electric. All rights reserved.
ION EEM 4.0 R2 User Guide
Chapter 5: Reporting Module
Chapter 5: Reporting Module
This section discusses the elements of the Reporting module interface and the available
export formats for your reports. It also covers procedures for viewing and creating reports,
and for creating report subscriptions.
In this section:
Reporting Module Interface
Elements of the Reporting Page interface
72
72
Typical workflow
74
Uploading a report or a report pack
75
Generating and viewing a report
76
Reports and Parameters
76
Saving the Report
77
Exporting the Report
77
Managing, Sharing, and Subscribing to the Report
77
© 2012 Schneider Electric. All rights reserved.
Page 71 of 150
Chapter 5: Reporting Module
ION EEM 4.0 R2 User Guide
Reporting Module Interface
The Reporting module interface provides the means to configure historical reports for the
presentation of information. You can generate additional reports by modifying and saving an
existing report. Administrators can also upload new report templates to ION EEM. See
"Uploading a report or a report pack" on page 75 for details.
See "Generating and viewing a report" on page 76 for details on generating and viewing
reports.
Note
Report permissions are specific to each user and are assigned by the ION EEM
Administrator or report owner.
Elements of the Reporting Page interface
There are three main elements of the Reports page interface: the Report Menu Bar, the
Report Selector, and the Report Display.
Report Menu Bar
The report menu bar contains the following sub-menus to help you set up and edit your
reports:
File: There are two options available under the File heading:
• Manage opens the Manage Reports window. Select from the following radio button
options:
• Manage move, delete, rename or copy the report.
• Share make the report available to individual users and groups.
• Subscribe schedule the report to be sent to an email address or written to a fileshare.
• Save: save the selected report.
You can also create a different report by renaming the report, creating a new folder and
moving the saved report into it. See "Saving the Report" on page 77 for more information.
Help: displays the Reporting Module help contents.
Report Selector
This pane allows you to select a report. The selector control typically contains a folder
structure. Click the + and - beside each folder to expand or collapse the folder views.
The Report Selector pane can be collapsed to allow more area for viewing reports. Click the
button located to the right of the Reports heading to collapse the page. To expand the
pane, click the
Page 72 of 150
button.
© 2012 Schneider Electric. All rights reserved.
ION EEM 4.0 R2 User Guide
Chapter 5: Reporting Module
Report Display
This area contains the report that is selected in the Report Selector control pane. Use the
toolbar at the top of the pane to subscribe to a report, to move through the pages of multiplepage reports, and to export the report information to an Excel document or a PDF file. See
"Generating and viewing a report" on page 76 for additional information.
© 2012 Schneider Electric. All rights reserved.
Page 73 of 150
Chapter 5: Reporting Module
ION EEM 4.0 R2 User Guide
Typical workflow
After a report template or report pack (.rdl extension) is created and uploaded by the ION
EEM Administrator, there are typical tasks to be completed to be able to use reports. Click
any of the following links to learn about these tasks:
• To generate and view up-to-date report information, see "Generating and viewing a report"
on page 76.
• To save a report and some or all of its parameters, see "Saving the Report" on page 77.
• To make a report available to other users or groups, see "Managing, Sharing, and
Subscribing to the Report" on page 77.
• To schedule output of a report, see "Managing, Sharing, and Subscribing to the Report" on
page 77.
• To add a report to an individual dashboard, see "Creating a new dashboard page" on page
14.
• To export a Trend Analysis as a report, see "Export trend analysis to report" on page 34.
• To print a Trend Analysis as a report, see "Printing a trend analysis" on page 36.
Page 74 of 150
© 2012 Schneider Electric. All rights reserved.
ION EEM 4.0 R2 User Guide
Chapter 5: Reporting Module
Uploading a report or a report pack
This section is for Administrators only.
Report templates can be developed by Schneider Electric Services or any other organization
skilled at developing content for Microsoft Reporting Services. Report packs can only be
developed by Schneider Electric Services. To create report templates, report developers use
Microsoft Business Intelligence Development Studio (which is free with a SQL Server
license).
After report templates are developed, you can easily upload them through the Administration
module. See "Upload report templates and report packs" on page 134 for details about
uploading reports and report packs.
After a report template is uploaded and viewing permission granted, users can immediately
begin creating and saving their own reports.
© 2012 Schneider Electric. All rights reserved.
Page 75 of 150
Chapter 5: Reporting Module
ION EEM 4.0 R2 User Guide
Generating and viewing a report
Once a report has been created, the information it contains can be made available in several
different ways. The report can be shared with other ION EEM users, as a subscription that
can be emailed out at regular intervals or by exporting the report into a format that is
accessible outside the ION EEM environment.
To generate and view a report:
1. Expand the folder view(s) in the Reporting Selector Control pane and locate the desired
report.
The reports that appear in the Reporting Selector Control pane are the reports that your
user account has permission to display. If you require a report that is not in your reports
list, an ION EEM Administrator must first set up permissions. See "Permissions" on page
111 for additional information.
Tip
Hovering over the report title with the mouse pointer displays the name of the report owner.
2. Click on the report title.
If the report was created without editable parameters, the report generates. If the report
was set up with parameters that require user input, a parameters page displays in the
Report Viewer pane. See the "Reports and Parameters" on page 76 section below for
additional information.
3. Enter the required parameter information.
4. Click Generate Report. The report displays in the Report Viewer pane.
With the report displayed, you can do the following:
• Click the subscribe icon ( ) to create a subscription to the report. See"Create Report
Subscriptions" on page 78 for details.
• Click the forward and backward arrows to page through the report, if there are multiple
pages.
• Refresh the view or print the report. The first time you print a report, you may be prompted
to install an ActiveX control. Click Install to accept this control.
• Export the report as a PDF or Excel file. See "Exporting the Report" on page 77 for details.
• Hide or show the report parameters.
Reports and Parameters
Some reports require user input parameters, such as the time range, to be included in the
report. When this is the case, enter the appropriate data for the parameters before generating
the report.
Page 76 of 150
© 2012 Schneider Electric. All rights reserved.
ION EEM 4.0 R2 User Guide
Chapter 5: Reporting Module
After displaying a report, you can save a version of the report with some or all of these
parameters included (see "Saving the Report" on page 77). For example, you may wish to
always view a demand trend for a certain number of devices for the previous month. When
you save the report, you can include the parameters for the devices and time period.
When you display a report that includes parameters, you can display or hide the parameters.
To do this, click the show inputs/hide inputs link in the upper right corner of the report.
Saving the Report
To save a report and its parameters:
1. Select a report that requires user input.
2. Click File > Save to display the Save Report screen.
3. Type a new name to save it as a new report, or accept the current report name to overwrite
the existing report.
4. Select the folder location for this report; or click New Folder to create a new folder for it.
ION EEM supports only one level of folders; you cannot nest the folder in another one.
5. Select the parameter(s) that you want to save from the Inputs to Save box. If the report
does not have parameters, you can ignore this box.
You can save a report with only some of the parameters selected.
6. Click OK. The report is saved to the specified location.
Note
You must save the report before you can create a subscription (a delivery schedule) for it.
Exporting the Report
From the Report Viewer pane, you can select a different format in which to view your report.
When you choose another format, a second browser window or tab opens to display the
report, using a viewer associated with the export format you selected.
The following export formats are included in a default report server installation.
Acrobat (PDF) file
View a report using a client-side PDF viewer. You must
have Adobe Acrobat Reader to use this format.
Excel
View the report in Microsoft Excel.
Managing, Sharing, and Subscribing to the Report
This feature includes three options: managing, sharing, and subscribing to the report.
© 2012 Schneider Electric. All rights reserved.
Page 77 of 150
Chapter 5: Reporting Module
ION EEM 4.0 R2 User Guide
Manage the report:
Choose this option by selecting the Manage option button in the Manage dialog box. This
allows you to create a new folder, delete or rename a folder, or move or copy a report from one
folder to another.
1. From the list in the left-hand box, select the report that you want to manage.
New Folder: When the Create New Folder screen displays, type the name of the new
folder and click OK. The report is moved to the new folder.
Delete: At the prompt that displays, click OK to delete this report. If there are any
subscriptions for this report, a message appears telling you that they will also be deleted.
Click OK.
Rename: Type the new name in the field (folders and/or reports) at the bottom of the
screen. Click Update to save the change.
Copy: Choose the location for the copy of the report, and click Update. A copy of the
report is written to that location. The report is named Copy of X, where X is the old report
name.
Move: Choose a new location and click Update. The report is moved to the new folder.
Share the report:
Select the Share radio button option to make a report available to a user or group:
1. Select the report to share from the list in the left-hand box.
2. From the Available Users & Groups box, highlight the desired user(s), then click the add
arrow to move the users into the Share list.
3. Click Apply.
The report is now available to the users in the Share list.
Create Report Subscriptions
What is a subscription?
A subscription is a report which is available to a user at a defined interval, and delivered in a
predefined manner. For example, a subscription might be configured such that a report is
executed monthly and sent via email. Another subscription might be configured for daily
execution and written to a file share.
Anyone who has access to a report can manage subscriptions (add, modify, or delete). The
following rules apply:
• Administrators can manage all subscriptions associated with all reports.
• Report owners can manage all subscriptions associated with their reports.
• Subscription owners can manage subscriptions that they create.
Page 78 of 150
© 2012 Schneider Electric. All rights reserved.
ION EEM 4.0 R2 User Guide
Chapter 5: Reporting Module
Adding a subscription
Before you can add a subscription, you must define all of the report parameters (if any are
required) and save the report. See "Generating and viewing a report" on page 76.
Add subscriptions on the Add New Subscription screen. Access this screen in one of three
ways:
• Click the subscribe icon (
) in the upper left-hand corner of the Report Viewer pane when
viewing a report.
• Click File > Manage. Select a report, then click the Subscriptions option button. When
the Manage Item screen is displayed, click Add.
• From the Administration tab, navigate to Reporting > Manage > Subscriptions. When
the Manage Item screen displays, click Add.
When the Add New Subscription screen displays, follow these steps:
1. Enter a name for the subscription. This is the subscription name that displays in the list of
subscriptions.
2. Click PDF or Excel to choose the format for the file.
3. In the Delivery Mode section, choose an option:
• Email: Click Distribution List. When the email dialog box appears, enter the email
address(es), clicking Add after each address. Click OK when the list is complete.
• Subject: Enter the information that is to go in the Subject line of the email.
• File share: Type the location of the computer at which the report is to be saved. You must
type the absolute path name to the server folder. If you are writing to a network share, ION
EEM must be configured with valid credentials to access that share. See your system
administrator for assistance.
4. In the Subscription Schedule section, choose whether to generate and deliver this report
daily, weekly, or monthly. For each option choose the delivery time.
5. Before you save the subscription, click Test Now to verify that the report is being
delivered correctly. It is strongly recommended that you test each subscription to ensure
that the email was received or the file share was written.
6. Click Save when the subscription is correctly entered.
Subscription Messages and Solutions
You may see one of several messages when you try to add subscriptions. Depending on the
situation, you may not be able to add the subscription, or you may add it, but the output to
email or file share may not succeed.
Note
Subscription delivery can be interrupted by issues outside the functionality of ION EEM.
Therefore, subscription delivery cannot be guaranteed.
The following is a list of messages, their causes and solutions:
© 2012 Schneider Electric. All rights reserved.
Page 79 of 150
Chapter 5: Reporting Module
ION EEM 4.0 R2 User Guide
Messasges
SQL Agent Service not
started
ION EEM Subscription
Monitor service not
started
From email address
incorrectly configured.
SMTP server not
configured
Page 80 of 150
Cause
The SQL Server Agent
service is not running. No
subscriptions can be
delivered.
The Subscription Monitor
service is not running. No
subscriptions can be
delivered.
The email From address
on the Configuration
screen is either not set or
has the wrong
configuration.
The Email SMTP Server
on the Configuration
screen is not specified.
Solution
Click Start > Programs > Startup > Service Manager.
From the Services pull-down box, select SQL Server
Agent. Click Start/Continue.
Click Start > Settings > Control Panel. Double-click
Administrative Tools, then double-click Services.
Right-click the ION EEM Subscription Monitor
service; click Start.
Access the Configuration screen (Administration tab >
Reporting > Configuration). Enter a valid email
address. Example: [email protected]
Access the Configuration screen. Type the network server
name for the server that sends the emails.
© 2012 Schneider Electric. All rights reserved.
ION EEM 4.0 R2 User Guide
Chapter 6: Modeling Module
Chapter 6: Modeling Module
Modeling is a powerful ION EEM feature that can help determine if a relationship exists
between two or more measured quantities. If a relationship does exist, ION EEM can develop
a formula to estimate one measurement from one or more others.
To demonstrate this feature, this section describes how to create a model that shows the
relationship between a building's energy consumption and the outside temperature. Once the
model is created, this section discusses ways to improve the model, and how to use the
model to create a target.
Note
This module uses industry accepted statistical techniques to quantify a relationship in the
data, but only a qualified expert can decide if the model can be applied or accepted as a
reflection of real world behavior of a system. Schneider Electric can provide this service.
In this section:
Model creation in ION EEM
83
What is a model in ION EEM?
83
How are models created in ION EEM?
83
What are the models used for?
83
Modeling workflow diagram
84
Before you begin
85
Determine the behavior to model
85
Decide on a historical reference period
85
Confirm the data are accurate
85
Other things to be aware of
86
Model Creation
87
Creating a new model
87
Model statistics
90
Improving the model
92
Sub-Models
92
Excluding Data Points
93
Creating a multivariable model
95
Targeting
What is a target?
Creating a target
© 2012 Schneider Electric. All rights reserved.
96
96
100
Page 81 of 150
Chapter 6: Modeling Module
ION EEM 4.0 R2 User Guide
Note
The example model has been created using kWh Delivered data and daily average
temperature information. To create an energy consumption model similar to the one
described in this section, access to similar data is required.
Page 82 of 150
© 2012 Schneider Electric. All rights reserved.
ION EEM 4.0 R2 User Guide
Chapter 6: Modeling Module
Model creation in ION EEM
What is a model in ION EEM?
A model in ION EEM is a mathematical formula that represents a statistical relationship
between one or more related driver variables. To create the model, ION EEM analyzes the
driver variables over a given time range and creates a formula that best describes the
modeled variable. ION EEM can then display this data in the form of a scatter plot.
How are models created in ION EEM?
The modeling power of ION EEM lies in its ability to determine if a statistical relationship
exists between two or more measured quantities in historical data. If a relationship exists,
ION EEM can build a mathematical formula that represents one measurement based on one
or more other measurements.
Model creation in ION EEM is based on linear regression, specifically multi-segment
regression. This is a form of regression analysis in which the variable data is broken up into
smaller pieces and a line segment is fit to each piece. This creates a series of line segments
which best describes the modeled variable.
What are the models used for?
Models in ION EEM can be created for a variety of different purposes, but the most common
usage is to characterize the energy consumption in a building over a set period of time. When
changes are made to the building to increase efficiency, a model can be used to show how
much energy the building could have used without the improvements, based on past
performance.
Modeling can also be an effective tool for monitoring unexpected changes in a building's
energy consumption. When measured energy consumption values are compared to an
energy consumption model for the same time period, you can use the model to look for
deviations and identify potential problems. As part of an energy management strategy, ION
EEM could assist in identifying potential cost saving measures.
While the example used in this section demonstrates how to model the energy consumption
of a building, it is not the only behavior the modeling tool can describe. The modeling function
can be applied to a piece of equipment, or to an industrial process. As with the building energy
consumption example, appropriate data for each application must be available to create a
valid model.
© 2012 Schneider Electric. All rights reserved.
Page 83 of 150
Chapter 6: Modeling Module
ION EEM 4.0 R2 User Guide
Modeling workflow diagram
The process of creating a model in ION EEM can be divided into different stages. The
workflow diagram below depicts the basic steps to follow when creating a model.
Page 84 of 150
© 2012 Schneider Electric. All rights reserved.
ION EEM 4.0 R2 User Guide
Chapter 6: Modeling Module
Before you begin
When using ION EEM to create a model, follow these steps and make sure all the required
information is available before creating a model.
• Minimum screen resolution for the Modeling module is 1280x800.
• Microsoft Silverlight must be installed on the client machine in order to use the Modeling
tool's functionality. See PowerLogic ION EEM Server and Client Preparation Guide for
additional information regarding client system requirements.
Determine the behavior to model
This is an important first step in creating a model. What is the behavior you want to model?
Based on that behavior, do you have the necessary data to create a model? The data for all
drivers and the modeled variable must already exist in ION EEM. For the example in this
chapter, energy is modeled as a function of temperature for a building. The energy
consumption data is captured from the building's power meters, and the temperature data is
taken from readings recorded from a nearby airport.
Decide on a historical reference period
In order to create a model, you first have to provide a time range over which the relationship
between the modeled variable and the driver variable can be identified. You want to ensure
that the time range selected portrays the conditions that you are trying to identify. You want a
long enough period to capture the full range of values of the inputs. The example model
requires weather information. For weather data, a year is preferable, although six months can
be used if it includes a summer and a winter in the range.
The reference period should not include a time range where a significant change to the
system has occurred. For example, if the HVAC system in a building was upgraded or
replaced during the reference period, that time range would not accurately describe the
regular workings of the building because a significant change was made to the system. Try to
select a time range where there were no major changes to the building that affect energy
consumption.
Confirm the data are accurate
Make sure that the data you are using is free of inaccuracies by inspecting the data in Trend
Analysis, running a VEE (Validation Estimation and Editing) which is a data quality test, or by
examining the data in the modeling interface and confirming its accuracy.
Note
VEE is an ION EEM administration function. Contact your ION EEM Administrator for
additional information.
© 2012 Schneider Electric. All rights reserved.
Page 85 of 150
Chapter 6: Modeling Module
ION EEM 4.0 R2 User Guide
Other things to be aware of
• You cannot create a model of something if you don't have any measured data.
• You cannot model variables that are not actually related. Even if you have measured data,
if there is no relationship between the variables, they cannot be modeled. For example,
even if you knew the number of cups of coffee consumed in North America last year, it
probably has very little relation to how much energy your building consumed during that
year (except of course for the very small amount of energy that was required to brew the
percentage of coffee consumed in your building).
• You cannot model a variable against time. EEM's modeling module looks for statistical
relationships between measured variables, not patterns in time. The system can take time
periods into account during the analysis, however it must still use measured data for both
driver and modeled variables. See "Sub-Models" on page 92 for more information on
utilitizing time dimensions in modeling.
When using a model created in ION EEM 3.95
When opening a model originally created in ION EEM 3.95 or ION EEM 3.95 SP1, you may
encounter a slight discrepancy in the model's detail values and parameters when opened in
later versions of ION EEM. This is due to a modification in how ION EEM handles gaps in
data. Now, when ION EEM encounters a gap, it fills that gap with the last known value.
The method ION EEM now uses when encountering a gap should produce a model that more
closely resembles the modeled variable.
Page 86 of 150
© 2012 Schneider Electric. All rights reserved.
ION EEM 4.0 R2 User Guide
Chapter 6: Modeling Module
Model Creation
Once you have gone through the steps outlined in "Before you begin" on page 85, you are
ready to begin creating a new model.
Note
To access the Modeling module, your User Level must be Power Users or higher. Contact
your ION EEM Administrator for more information.
Click the Modeling tab.
This brings up the modeling window. This screen is used to display the models that exist in
the system (This list is empty if no models have been created). The models displayed on this
screen can be sorted by clicking on a column header, or filtered by clicking on the filter icon (
) beside each heading. Clicking on an existing model highlights the entry, and information
about the model is displayed in the Selected Model Details box. From this screen, select
from the following buttons:
Create New Calculated Model
Create New Manual Model
View/Edit Model
Edit Simulation
Clone Model
Delete Model
Creates a new model.
Enter a new model using coefficients from another
system.
Allows you to modify an existing model.
Opens the simulator editor for the selected model.
Create an identical copy of an existing model.
Removes model from ION EEM.
Creating a new model
1. Click Create New Calculated Model. The model creation screen appears.
© 2012 Schneider Electric. All rights reserved.
Page 87 of 150
Chapter 6: Modeling Module
ION EEM 4.0 R2 User Guide
2. Enter a title for your model in the Name field of the Model Information box. This name is
used to identify the model in the list on the Manage Models page. The example title is
Building Energy Consumption July 2008 - July 2009.
3. Select a roll-up interval from the dropdown list. The example model uses Daily as its rollup interval.
The Roll-up interval defines how to aggregate the data when creating and evaluating the
model. If the deviation of a behavior or process is very responsive, choose a short range,
such as Hourly. If the modeled behavior has a longer response time, such as outside
temperature affecting the heating of a building, it is recommended that you set the roll-up
timescale to a longer interval, such as Daily, which absorbs some of the noise in the data
produced by a lag in the data relationship response time.
Note
Source and measurement names in the example model will be different from source and
measurement names in your system. Confirm that you have access to sources similar to
those depicted here before proceeding.
4. Click the
button to select a source for the modeled variable. From the dropdown
Source Hierarchy List, double-click the source type, the location, and finally the source
itself.
Page 88 of 150
© 2012 Schneider Electric. All rights reserved.
ION EEM 4.0 R2 User Guide
Chapter 6: Modeling Module
In this example, we selected as a source one of the main meters in the Victoria building.
This meter records the amount of energy being delivered to the building. Once the source
is selected, the scatter plot at the top has the source name as a Y axis label.
5. Click the
button to select the measurement for the modeled variable.
Since we are looking for the amount of energy the building is consuming, we have selected
the amount of energy delivered to the building in kWhs. The scatter plot Y axis label has
changed to include the measurement information.
6. Select Sum from the Roll-up list to provide the daily total of kWh delivered.
Sources such as meters take readings at set intervals over the course of a day. The roll-up
list provides different ways of processing that data. The Sum roll-up adds up all the values
captured throughout the day, while a roll-up like Min provides the lowest value taken
throughout the day.
7. Click the
button under the driver variable heading to select the source of the data.
In this section we also provide the source and measurement for the driver, in this case the
outside temperature. For the example ION EEM system, we select the Weather Location
source from the list, and as a measurement, select the closest temperature data. For a
temperature driver, select Average as a roll-up. This provides the daily average
temperature to be used in the model. Later, when you are improving the accuracy of a
model, you can try correlating with Max or Min temperatures to see if you get different
results.
The driver variable source information now appears as the label for the scatter plot's X
axis.
8. Click the
button under the driver variable heading to select the measurement used for
that source.
The measurement for the weather source is temperature in degrees Celsius. The
measurement information has now been added to the X-axis label.
9. Select the reference period for the model. Enter the date range information in either a
mm/dd/yyyy format or click the calendar icon to choose the start and end dates. Time can
be entered as a standard twelve hour clock value or by clicking on the clock icon ( ) and
selecting a time from the dropdown menu.
10.Click Update Display.
The scatter plot is populated with points that represent the values over the designated time
range. The Time Series graph shows a graph of the formula ION EEM has created to
define the relationship between the modeled variable and the driver variable.
The scatter graph now has a series of points, each corresponding to a date and energy value.
They form a band, sloping up the graph and leveling out over time. Select the Best fit line
checkbox. The best fit line is a straight line or set of connected line segments through a data
set that best describes the relationship between the modeled variable and the currently
displayed driver.
© 2012 Schneider Electric. All rights reserved.
Page 89 of 150
Chapter 6: Modeling Module
ION EEM 4.0 R2 User Guide
The Time Series graph depicts the modeled variable as the default graph. Selecting the
prediction checkbox displays the formula created by the modeling module. Having the
modeled variable and the prediction displayed on the same graph gives a graphic
representation of how accurate the model is.
Model statistics
There is also model information displayed in the Model Details section.
The Model Details section lists the model coefficients and statistics about the model quality.
It describes the Target type, number of points and four result values.
Value
Page 90 of 150
Statistic
Definition
N
Number of points
This is the number of input observations (where
each unique timestamp is considered a unique
observation) that were used to create the model.
This number reflects the count of data points after
aggregation has been done, so if you roll up a
year’s worth of data to daily, you have 365 points.
R²
Coefficient of
determination
This is the overall rating of a model. This value is
equal to 1-( SS err / SS tot ), where SS err is the
© 2012 Schneider Electric. All rights reserved.
ION EEM 4.0 R2 User Guide
Chapter 6: Modeling Module
Value
Statistic
Definition
residual sum of squares and SS tot is the total sum
of squares. The R² value ranges between zero and
one. The closer the value of R² is to one, the more
accurately the model reflects the observed
relationships. It is recommended that you achieve
an R² of at least 0.75 or higher.
Adjusted
R²
Adjusted coefficient of
determination
Multiple coefficient of determination. The R² is
modified to account for the number of variables and
sample size.
RMSE
Residual Mean Square
Error
This quantity is the equal to the Residual Sum of
Squares / Degrees of Freedom Error (equal to the
number of observations minus the number of
model parameters).
CVRMSE
Coefficient of Variance of
Residual Mean Squared
Error
This quantity is the standardized error of residuals.
For most models, it is the R² value that users look at to determine a valid model.
The other values are normally used for statistical validation purposes.
Under Model Parameters, each coefficient has a value, an error, and a T-Statistic (T-Stat).
Of these, the T-Statistic is the most important value for the model parameters because it
indicates which drivers (when there is more than one) are making a real contribution to the
model. If the T-Statistic is small (between -5 and 5), that driver should probably be discarded.
The other tabs in the model statistics area, Scatter Plot and Time Series Plot, display the
numeric values for the points shown on the scatter plot and time series graphs. Selecting the
checkbox beside each value is one method to exlude a point on the graphs. See the section
"Excluding Data Points" on page 93 for additional information.
The example model's R² value is about 0.62. Although the R² value demonstrates there is a
relationship between energy consumed and outside temperature, the model is not a very good
one. The next section discusses different ways to improve the model.
© 2012 Schneider Electric. All rights reserved.
Page 91 of 150
Chapter 6: Modeling Module
ION EEM 4.0 R2 User Guide
Improving the model
The R² value for the example model is 0.62. As explained earlier, an R² value of at least 0.75
is recommended. Taking a closer look at the scatter plot could provide a clue as to how to
improve the model.
Looking closely at the scatter plot of the model, the data points appear to form two distinct
bands: a dense band of points on the top and a less populated band of points underneath. One
common cause of banding in building energy consumption data is the effect of occupancy on
building energy use. For a given temperature, unoccupied buildings should use less energy.
One way to deal with that in regression modeling is with time based sub-models. Before
making the sub-models, save the model and create a clone of the model to work on.
To create a clone of a model:
1. Click Save.
2. Click the Modeling tab.
3. Click on the name of the existing model. The model name is highlighted.
4. Click the Clone model button. This creates a duplicate of the example model, which is
used for the duration of this section.
5. Select the cloned model from the list and click View/Edit Model.
By creating clones of the example model, we are free to experiment with different methods of
improving the model without distorting the original.
Sub-Models
For a driver like occupancy that is strongly correlated to predictable time periods, ION EEM
can partition the reference data by time period and make a separate model for each. In the
case of occupancy, that would be one model for weekdays and one for weekends. If the
driver in the example model is correlated to time periods, the R² value should be higher for
each of the weekday and weekend models.
To create sub-models:
1. Select the Create Unique Sub-Models for Specific Time Periods checkbox. Selecting
this box enables the Create sub-model for each dropdown menu.
Page 92 of 150
© 2012 Schneider Electric. All rights reserved.
ION EEM 4.0 R2 User Guide
Chapter 6: Modeling Module
2. Select the Work week option from the dropdown menu.
3. Click Update Display.
You now see a sub-model selector in the title bar of the scatter plot.
The lower band of data points has moved to the weekend scatter plot and the best fit line has
moved. Click over to the weekend scatter plot, and you see a completely new graph that has
the datapoints that were originally part of the lower band of the first model.
By separating the model into work week and weekends, we find that the R² value goes up to
0.83 for the weekend sub-model and to 0.76 for the work week. Why the increase? It appears
that when the building is occupied, the amount of energy consumption goes up, and when the
building is empty, such as on a weekend, the energy consumed goes down. There appears to
be a relationship between building occupancy and energy consumption, but that variability
was not captured in a driver variable. When there is variability not explained by a driver, the
R² value goes down. By partitioning the data by work week, the variability from occupancy is
removed, so the R² value goes up.
These are significant improvements, but the work week R² value is lower than that for the
weekend. For an answer to why the weekend R² value is higher, we examine the scatter plot.
Excluding Data Points
There are several points in the scatter plot that are a significant distance away from the Best
Fit line. Moving the cursor over these points provides the date and value. In the lower half of
the graph there are two points side by side. By hovering over these points, we see the date for
these points are December 25 and 26, 2008. By hovering over more of these outlying points
© 2012 Schneider Electric. All rights reserved.
Page 93 of 150
Chapter 6: Modeling Module
ION EEM 4.0 R2 User Guide
and checking the dates, we find that many of them correspond to a statutory holiday. We can
surmise that, since these are holidays, the building is empty and not consuming as much
electricity as a normal work day.
Since these data points do not accurately portray typical work week values, we can remove
these data points from our graph and determine if the example model's R² value goes up.
To remove these points:
1. Move the mouse cursor up to the scatter plot graph.
2. Left click and draw a circle around the points to be removed. The points disappear from the
graph once they have been circled.
You can also exclude points by clicking in the time series graph and dragging the pointer
across the time period you want to exclude. As you drag the cursor over a time period in
the graph, that area turns red. This a quick method for removing a large number of values
at once. This a useful method of data exclusion if data was not received over the course of
several weeks and you want to remove that time range from the graph.
Note
Points excluded by either means are always reflected on both graphs. As you remove plots
from the scatter, you will see the equivalent excluded data in the time series and vice versa.
Finally, you can also exclude data points by selecting the scatter plot or time series tabs
and clicking the checkboxes by each value.
3. Click Update Display when finished. The R² value for our example work week graph is
now 0.82.
To see the excluded points, select the Show excluded checkbox. The excluded points
appear in light gray.
Note
Excluding valid data points can result in an inaccurate model. Make sure there is an
explanation for any excluded points before they are removed.
Page 94 of 150
© 2012 Schneider Electric. All rights reserved.
ION EEM 4.0 R2 User Guide
Chapter 6: Modeling Module
Creating a multivariable model
Another way to improve a model is by creating a multivariable model. It is possible to add
influence to the model from other driver variables.
To demonstrate a multivariable model, go back to the original model and create another clone.
Instead of creating sub-models to describe when the buildiing is occupied, we have
occupancy data available that we can introduce as second driver variable.
If occupancy data are available directly, then schedule issues with holidays in time based
sub-models can be avoided.
To create a multivariable model:
1. Click the add variable icon (
) under the Driver Variable heading, . A second driver
variable appears.
2. Click the source (
) button under the second Driver Variable heading. Select the source
you want to use as an input driver. In the example model, this is occupancy data. For a rollup interval, we selected Average, but since there is only one occupancy value per day, it
does not really matter.
3. Click the
button under the second driver variable heading, and select the measurement.
In the example model, this is Person Work Day.
4. Click Update Display.
By adding the occupancy data as a second driver variable, the model's R² value has gone up
to 0.76. This shows that the building occupancy level does relate to the amount of energy the
building uses.
5. Click Save to save the model.
© 2012 Schneider Electric. All rights reserved.
Page 95 of 150
Chapter 6: Modeling Module
ION EEM 4.0 R2 User Guide
Targeting
What is a target?
Creating a target in ION EEM can be defined as presenting a model that only indicates those
periods of time that represent optimal conditions. In the case of our example, a target can be
created to show where the actual energy consumption of the building is less than the
predicted value for the same time range. The target could then be used as a starting point to
investigate possible energy saving solutions.
For an explanation of what a target is, refer to the model we just created.
In our original building energy consumption model, the time graph of the measured energy
consumption values looked like this:
This is the modeled variable information, showing what the actual energy consumption was
on any given date between July 2008 and July 2009.
Here is a time graph that shows the predicted energy consumption values. The model follows
the actual energy consumption quite well, although there are some differences.
Page 96 of 150
© 2012 Schneider Electric. All rights reserved.
ION EEM 4.0 R2 User Guide
Chapter 6: Modeling Module
By overlaying the predicted values over the modeled variable, we can see that actual energy
consumption was lower than the predicted energy consumption, and could represent a period
of above average performance.
By selecting the Residual checkbox, the graphs shows the difference between the actual
energy consumption and the predicted energy consumption.
© 2012 Schneider Electric. All rights reserved.
Page 97 of 150
Chapter 6: Modeling Module
ION EEM 4.0 R2 User Guide
This graph is based on the equation, e = y − y ′ , where e is the residual, y is the actual or
observed value, and y' is the predicted value. When the actual energy consumption value and
the predicted energy consumption value are identical, the graph depicts a zero difference.
The larger the difference between the two values, the larger the deviation from zero. If the
actual energy consumption value is larger than the predicted, that value appears as a positive
deviation. If the actual value is smaller than the predicted, it appears as a negative deviation.
When we analyze the residual graph, we see that, although most of the deviations are minor,
there are several peaks. Is it possible to use the information in this graph to identify sustained
periods of time where the system may have achieved lower-than-predicted energy
consumption?
Page 98 of 150
© 2012 Schneider Electric. All rights reserved.
ION EEM 4.0 R2 User Guide
Chapter 6: Modeling Module
The CUSUM graph can be useful in determining how well the model is representing actual
values over a certain time range. When the CUSUM line is horizontal, the predicted value is
operating near the modeled variable. An upward slope shows higher usage relative to the
predicted value, while a downward slope shows lower usage relative to the predicted value.
These periods that may describe using less energy than expected are the periods of optimal
performance that are used to create the target.
Using this information, the targeting feature in ION EEM allows us to isolate those time
periods that show lower than expected energy usage.
© 2012 Schneider Electric. All rights reserved.
Page 99 of 150
Chapter 6: Modeling Module
ION EEM 4.0 R2 User Guide
Creating a target
Begin by creating a clone of the energy consumption model:
1. Click the Modeling tab.
2. Select the example model from the previous section.
3. Click Clone Model.
4. Click on the cloned model from the grid to highlight it.
5. Click Rename Model.
6. Create a new name for the model. The example model is called Energy Consumption
Target Example.
7. Click View/Edit Model.
There is now a duplicate of the original model to create a target from.
At its heart, the targeting feature in ION EEM is another method of excluding data points. In
the example model, we excluded data points because they did not portray accurate values. In
targeting, we are excluding those data points that do not represent optimal output.
To create a target:
1. Select the Target option button.
This switches the workflow from model creation to target creation.
2. Select the CUSUM checkbox under the Time graph.
The slope of the line indicates the relative savings versus expected. Steeply sloping lines
are periods of high savings, shallow sloping lines are periods of moderate savings.
3. Click on the time graph at the first point the chart begins to slope downwards. Drag the
cursor across the graph up to the point when the downward slope levels off or turns
upward.
4. Move the cursor to the next downward trend and repeat step 3.
As you drag the cursor across portions of the CUSUM graph, you are instructing ION EEM
to keep the data points in the area you have highlighted, and exclude the rest. By doing
this, you are preserving the data points that represent the optimal energy consumption
points of the model and discarding the rest.
Page 100 of 150
© 2012 Schneider Electric. All rights reserved.
ION EEM 4.0 R2 User Guide
Chapter 6: Modeling Module
5. Click Update Model when you have finished highlighting the downward slopes in the
graph.
The scatter plot now depicts the points highlighted in the time graph, and excludes all other
points from the original scatter plot. This plot now represents a model of the energy
consumption of the building if all the days that displayed higher energy usage were
removed.
Now that the target shows how much energy the building could be using if it was running at
optimal performance, you can compare actual energy consumption against optimal energy
consumption and begin investigating the cause of the differences. You could begin by
generating the target output in trend analysis, or as a report, and comparing it against the
modeled variable graph.
In the case of the example target, a possible first step is to look at the target and try to find
a pattern. In this case, there appears to be a pattern to the time periods where the building
may have experienced lower energy consumption. These periods of potential lower energy
consumption appear to correspond to the spring and autumn. It is possible that during this
time, the HVAC system does not have to use as much energy. In the winter, the system is
producing heat, while in the summer, the air conditioning is working to maintain a cooler,
comfortable temperature. In the Spring and Autumn, the HVAC might not working as hard
to maintain a constant temperature. This could be a good starting point for a building
manager's investigation of the building's energy usage.
You can use the target as part of an investigation to identify influences to the building's
energy consumption may were not captured in the model creation process. You can also
narrow down your search by creating energy consumption models and targets for different
parts of your building or to a specific piece of equipment.
© 2012 Schneider Electric. All rights reserved.
Page 101 of 150
Chapter 6: Modeling Module
Page 102 of 150
ION EEM 4.0 R2 User Guide
© 2012 Schneider Electric. All rights reserved.
ION EEM 4.0 R2 User Guide
Chapter 7: Administration
Chapter 7: Administration
This chapter discusses the features available in the Administration module. It outlines the
Administration module’s interface and menus, as well as security policies and external
weblinks.
Access to the different features in this module is dependent on your user level. You may not
be able to view all the features discussed in this section.
In this chapter:
Administration Page overview
104
System
106
My Settings
106
Accounts
107
Users
107
Groups
109
Manage Dashboards
110
Permissions
111
Source Management
115
Status
117
UI Behavior
118
Custom Time Range
119
Modules
125
Cost Allocation
125
External content
130
Power Quality
132
Reporting
133
Trend Analysis
135
Waveforms
137
WebReach
138
Tools
140
Administration Tool
140
Manual Data Entry
141
Manual Data Entry Permissions
146
Note
Because of the possibility of hardware or communication issues, the data log may have
gaps or unresolved issues that could lead to inaccurate results.
• Only use data created or collected in the cost allocation section for estimation or
comparison purposes.
© 2012 Schneider Electric. All rights reserved.
Page 103 of 150
Chapter 7: Administration
ION EEM 4.0 R2 User Guide
Administration Page overview
The Administration Page is divided into three sections: System, Modules and Tools. Each of
these sections is comprised of menus, with each of these divided into sub-menus. The table
below provides an overview of the Administration Page.
Section
Menu Item
Submenu
Description
My Settings
My Account
Configure account information (e.g., first name, last name).
Users
Create, modify, and clone user accounts.
Groups
Set up user groups, determine permissions.
Manage
Dashboards
Copy individual dashboards to specific users or groups, delete
individual dashboards, and update dashboard item permissions
for destination users or groups.
Activity
Monitor status and communication frequency of sources.
Accounts
System
Notification
Source
Management
Assign Weather
Sources
Select users who will receive notification of inactive sources.
Status
Login Activity
View the system login activity.
System Info
Provides details of the ION EEM system (e.g., build number).
Analysis
Determine the basic conventions the ION EEM interface will
use.
UI Behavior
Custom Time
Definitions
Range
Associate weather sources with other nodes and sources.
Create new custom time ranges and access additional
information.
Manage
Allocations
Enter the SMTP server that delivers report subscriptions via
email. Specify the email address and display name for
responsible party.
Manage
Measurements
Manage individual report features (location, name, etc.). Share
reports with users/groups and add/modify/delete subscriptions.
External
Content
Weblinks and files
Add, preview, save Weblinks for use on Dashboard page.
Manage
Determine which users/groups can use Weblinks.
Power
Quality
Configurations
Configure general settings of your PQ analyses or classify your
PQ events.
Manage
Manage and share your PQ Analyses.
Configuration
Enter the SMTP server that delivers report subscriptions via
email. Specify the sender's display name and email address.
Manage Report
Manage individual report features (location,name, etc), share
reports with users/groups and add/modify/delete subscriptions.
Upload Report
Template
Upload report template into ION EEM.
Upload Report
Pack
Upload report pack into ION EEM.
Configuration
Determine the number of rows your data tables render and the
number of decimal places to display in the data table.
Manage
Manage and share Trend Analyses.
Configuration
Configure general appearance settings of PQ waveforms,
Cost
Allocation
Modules
Reporting
Trend
Analysis
Waveforms
Page 104 of 150
© 2012 Schneider Electric. All rights reserved.
ION EEM 4.0 R2 User Guide
Chapter 7: Administration
Section
Menu Item
Submenu
Description
including color, phase labels and phasor alignment.
WebReach
Permissions
AdminRun Installer
istration Tool
Tools
Manual Data
Entry
Manual Data Entry
Add new diagrams and choose which users and groups can
access them.
Launch Administration Tool installer.
Allows users to enter, edit, modify, or delete data associated
with a node.
Manual Data Entry Select the users that should have access to the Manual Data
Page Permissions Entry Page
Each submenu contains links to other pages where you can perform administration tasks.
© 2012 Schneider Electric. All rights reserved.
Page 105 of 150
Chapter 7: Administration
ION EEM 4.0 R2 User Guide
System
The Administration menus contain the System and Module sections. The System menu
options allow you to create and manage user accounts, monitor system status and behavior,
and manage sources.
My Settings
My Account
In the My Account section you can configure account information, such as first and last
name, organization, email addresses and password.
To configure your account:
1. Click the Administration tab, and navigate to System > My Settings > My Account.
2. Enter your first and last name.
3. Enter an organization, business and mobile email addresses (optional).
4. Click Save.
5. Click Change Password to change the current password,. Enter your current password,
then enter your new password in the New Password field. Confirm the new password by
entering it again in the Confirm field.
6. Click Save.
Page 106 of 150
© 2012 Schneider Electric. All rights reserved.
ION EEM 4.0 R2 User Guide
Chapter 7: Administration
Accounts
Users
Use this submenu to manage ION EEM user accounts, provide unique system access
(permissions) to each user and assign user accounts to user groups.
To add a new ION EEM user account:
1. Click the Administration tab, and navigate to System > Accounts > Users.
2. Click New. The Add New User window appears.
3. Enter a user name and password.
Note
Users must change the password the first time that they access ION EEM.
4. Enter the user’s first and last name.
5. Enter organization, business and mobile email addresses (optional).
6. Select the user group from the dropdown list. (applicable if the user belongs to a user
group) .
7. Choose a user level:
Administrators: Highest access level. Administrators have access to all functions in the
Administration tab. User can create new accounts of any user level.
Power Users: Access to Administration tab is restricted to My Settings, Status, Cost
Allocation and External Content.
User Administrators: Creates new accounts with User Administrator access or lower.
The user can access External Content and has permission to manage Trend Analysis and
Reporting modules.
Users: Lowest access level. User can only access their own account information and
External Content modules.
Note
Once an account has had its user level promoted to Administrator, that user level cannot be
demoted.
8. Click Save. This adds the Permissions box to the screen. See "Permissions" on page
111 for instructions on how to set up permissions.
Click Update to save the changes and return to the Configure User page.
9. Click Save.
© 2012 Schneider Electric. All rights reserved.
Page 107 of 150
Chapter 7: Administration
ION EEM 4.0 R2 User Guide
Note
If you add options at a later date, such as additional reports, you will also need to return to
the add permissions box and add the new options to each user who must have access to
them.
To modify an ION EEM user account:
1. Click the Administration tab and navigate to System > Accounts > Users.
2. Select a user from the User Name column. From the Configure User window you can
modify any of the user information, such as the user name, first and last name,
organization or email addresses.
3. Click Save when finished.
To change user password:
1. Click Change Password.
2. Enter password in New Password field.
3. Repeat new password in Confirm field
4. Click Update.
To unlock a locked account:
1. Click the Administration tab and navigate to System > Accounts > Users.
EEM displays the message that the user's account is currently locked.
2. Change the user's account password.
3. Inform user of the password change.
To clone a user account
The Clone option allows you to copy all information from one user account to create another
account with identical settings. This allows you to quickly set up new users without
recreating permissions and dashboard configurations for each individual. Cloning copies the
organization, user group and user access level, and permissions. The new user has read
access to the same submenus as the original user for Trend Analysis, PQ Analysis, Reports,
Nodes, Weblinks and Files, and WebReach. If you have created a dashboard view, the
dashboard is also copied from the original and assigned to the new user.
Note
You must be logged in as an administrator to perform this task.
1. Click the Administration tab and navigate to System > Accounts > Users.
2. Select the user that you want to copy from the User Name column.
3. Select Clone.
4. Enter the new user name and password. The user must change the password the first time
that they access ION EEM.
5. Enter the user’s first and last names.
6. Enter the email addresses (optional).
Page 108 of 150
© 2012 Schneider Electric. All rights reserved.
ION EEM 4.0 R2 User Guide
Chapter 7: Administration
7. Change the user group and user access level.
8. Click Save.
To verify that the new user was added, click the Administration tab and navigate to System
> Accounts > Users. The new users names are listed on the Manage User screen.
Groups
Use this submenu to manage ION EEM user groups, and provide unique system access
(permissions) to each user.
To Add a User Group and Set Permissions:
1. Click the Administration tab and navigate to System > Accounts > Groups.
2. select New from the Manage User Groups page.
3. Enter a group name and (optional) description.
4. Click Save. The Permissions box appears.
5. Select the ION EEM functions that the group can access.
6. Select a source from the source hierarchy list.
7. Check all items that this group can access at the Configure Source Permissions
screen. Click Select All to give permissions to everything on the page. Click Select None
to deselect all permissions. You can also click a folder to give permission to everything
within that folder.
8. Click Update to save your changes you have made and return to the Configure User
Group page.
9. Click Save.
Note
Use the Accounts > Users submenu to add users to this group.
To modify a user group:
1. Click the Administration tab and navigate to System > Accounts > Groups.
2. From the Manage User Groups page, select the group you want to modify.
3. Modify the user name, description, or permissions as needed.
4. Click Save.
To add users to a group:
1. Click the Administration tab and navigate to System > Accounts > Users.
2. Select the User you want to add to a group.
3. Select the desired group from the User Group dropdown menu.
4. Click Save.
© 2012 Schneider Electric. All rights reserved.
Page 109 of 150
Chapter 7: Administration
ION EEM 4.0 R2 User Guide
Note
When a user account is assigned to a group, the user inherits the group’s permissions in
addition to their individual permissions.
To clone a user group:
The Clone a user group option allows you to copy all information from one user group to
create another group with identical settings. This allows you to quickly set up new groups
without recreating permissions for each. Cloning copies the permissions settings and
assigned tabs from the cloned group to the new group.
Note
You must be logged in as an administrator to perform this task.
1. Click the Administration tab and navigate to System > Accounts > Groups.
2. Select the user group you want to copy from the Group Name column. The Manage User
Groups screen appears.
3. Click Clone.
4. Enter the group's name.
5. Enter a description of the cloned group (optional).
6. Click Save.
To verify that the new user group was added, click the Administration tab and navigate to
System > Accounts > Groups. The new user group’s name is listed on the Manage User
Groups screen.
Manage Dashboards
The Manage Dashboards feature allows you to copy dashboards from one user to another
user or group, and delete the dashboard for any user. Once a dashboard has been copied to a
user, the Manage Dashboard feature can also grant the permissions necessary for the user to
view the copied dashboards.
To open the Manage Dashboards feature:
1. Click the Administration tab and navigate to System > Accounts > Manage
Dashboards. to open the Manage Dashboards page.
2. Select the source user(s) from the Load Dashboard for user(s) box by selecting the
checkbox for each user. Click Load Dashboard List when finished. The Dashboard
page(s) to Manage and Copy Options boxes appear.
To delete a dashboard page:
1. Select the checkbox beside each dashboard displayed in the Dashboard page(s) to
Manage box.
2. Click Delete Dashboards. A dialog box appears. Click OK to confirm your selection, or
click Cancel to discard the selection and return to the Manage Dashboards page.
Page 110 of 150
© 2012 Schneider Electric. All rights reserved.
ION EEM 4.0 R2 User Guide
Chapter 7: Administration
To copy a dashboard page to a user:
1. Select the checkbox beside each dashboard displayed in the Dashboard page(s) to
Manage box.
2. Select the Copy to User(s) option. The User(s) to receive copied Dashboards box
appears.
3. Select the Grant permissions... checkbox to provide permissions for all report items
contained in the copied dashboards.
4. Leave the Overwrite all existing dashboards... checkbox unchecked to add the copied
dashboards to the end of the existing dashboard list. Select the checkbox to replace the
user's existing dashboards with the copied dashboards.
5. Select the checkbox beside the users to receive the copied dashboard.
6. Click Copy Dashboard(s).
7. Click OK in the dialog box to confirm the selection, or click Cancel to discard the selection
and return to the Manage Dashboards page.
To copy a dashboard page to a group:
1. Select the checkbox beside each dashboard displayed in the Dashboard page(s) to
Manage box.
2. Select the Copy to Group(s) option. The Group(s) to receive copied Dashboards box
appears.
3. Select the Grant permissions... checkbox to provide permissions for all report items
contained in the copied dashboards.
4. Leave the Overwrite all existing dashboards... checkbox unchecked to add the copied
dashboards to the end of the existing dashboard list. Select the checkbox to replace the
group's existing dashboards with the copied dashboards.
5. Select the checkbox beside the groups to receive the copied dashboard.
6. Click Copy Dashboard(s).
7. Click OK in the dialog box to confirm the selection, or click Cancel to discard the selection
and return to the Manage Dashboards page.
Permissions
Permissions allow an administrator to set up the folders and items each user or group is
allowed to access while in the ION EEM environment. Without the proper permissions set up,
you cannot view, modify, or in some cases create items in several of the ION EEM modules.
Note
When an account has its user role promoted to Administrator, it cannot be demoted.
© 2012 Schneider Electric. All rights reserved.
Page 111 of 150
Chapter 7: Administration
ION EEM 4.0 R2 User Guide
User Permissions
Permissions define what sources, reports, or analyses a user is allowed to access.
Permissions can be divided into two main groups: item permissions and folder permissions.
Item permissions extend to items such as reports, trend analyses, PQ analyses, or weblinks.
Use item permissions to select the items that the user is allowed to access.
Folders are used to group like items together. When an Administrator extends permission to a
folder, the user will be allowed access to all items that reside in that folder.
Note
Any permissions assigned in previous versions of ION EEM will not be affected by the
installation of later versions of ION EEM.
To add user permissions:
1. Navigate to the Administration tab and click Users. The Manage Users screen appears.
2. Select a user from the list. The Configure User screen appears. You have access to the
Permissions box on the right.
3. Click on one of the selections (Sources, Reports, Trend Analysis, PQ Analysis, or
Weblinks and Files).
Note
Since the Administrator role requires permissions to all sources, folders, and items, the
permissions for a user in an Administrator role cannot be changed. Subsequently, the
Permissions box does not appear in an Administrator's User screen.
Page 112 of 150
© 2012 Schneider Electric. All rights reserved.
ION EEM 4.0 R2 User Guide
Chapter 7: Administration
For a user to create, view, or manage an item such as a report or trend analysis, they must
have source permissions set up to allow access to the sources referenced by that item. If a
user has been given access to a folder or item, but has not been given permission to the
applicable sources, the folder or item appears in the module's list of items, but cannot be
accessed. A message appears informing the user that they do not have permission to access
the sources referenced by that item.
To configure source Permissions:
1. Click Sources from the Permissions box.
2. Select a category from the Source Hierarchy list dropdown menu.
3. Select the source to add to the permissions. Click Select All to select all sources from the
list or click Select None to clear all permissions.
4. To add sources from another category, select another category from the Source
Hierarchy dropdown menu.
5. Click Update to update the source permission selections or click Cancel to return to the
Configure User screen without updating.
Even with source permissions in place, the user does not have access to any items or
folders. In the reports tab, for example, the reports list does not have any reports available for
view. To view items, folder and item permissions must also be set up.
Note
New folders can be created and items moved in the Reporting, Trend Analysis, and PQ
Analysis modules.
To configure folder and item Permissions:
1. Click Reports from the Permissions box. The Configure Report Permissions screen
appears.
The reports are organized into a list of items and folders. Each folder has the number of
items selected as part of its title.
2. Click the Expand icon (
) beside the folder name to open the folder and display the
items inside.
© 2012 Schneider Electric. All rights reserved.
Page 113 of 150
Chapter 7: Administration
ION EEM 4.0 R2 User Guide
Items that still require source permissions have those permissions noted as part of their
title. Hover the cursor above the report title to display the report owner and the source
permissions required. All source permissions that are used by an item must be granted
before that item can be viewed.
3. Select the items in each folder to add that item to permissions, or select the folder to grant
permission to all items that reside inside that folder.
You can also provide folder level permission and item level permission at the same time.
Select an item, and then select the folder it resides in. The item title displays in bold text.
Now, if you were to remove permission for the folder, the items that were selected
individually would still be available to the user.
4. Click Select All to select all folders from the list or click Select None to clear all
permissions.
After permission has been given to a folder, any item dropped into the folder is available to
any user with permissions to that folder. In addition, a user that has permission to an item
retains that permission, even if the item is moved to a folder that the user does not yet
have permission to access. This is a modification to the permissions workflow used in
previous versions of ION EEM.
Note
Only item owners and administrators are permitted to modify, move, and delete items.
5. Click Update to update the item or folder permission selections or click Cancel to return to
the Configure User screen without updating.
When the user goes to the applicable module, the list of available items displays all folders
with permission, as well as any folders that contain at least one item with permission.
Page 114 of 150
© 2012 Schneider Electric. All rights reserved.
ION EEM 4.0 R2 User Guide
Chapter 7: Administration
Note
The steps involved in setting up item and folder permissions is the same for Reports, Trend
Analysis, PQ Analysis, and Weblinks and Files.
Group Permissions
In addition to creating permissions for individual users, you can also create permissions for a
group. All users that are part of the group inherit the permissions set up for the group. A user
can have group permissions, as well as individual user permissions.
To add group permissions:
1. Navigate to the Administration tab, and click Groups. The Manage User Group screen
appears.
2. Select a group from the list. The Configure Group screen appears. You have access to
the Permissions box on the right.
3. Click on one of the selections (Sources, Reports, Trend Analysis, PQ Analysis, or
Weblinks and Files).
4. Follow the same directions as shown in "User Permissions" on page 112.
5. Click Update to update the item or folder permission selections or click Cancel to return to
the Configure Group screen without updating.
Source Management
Source Activity Monitor
ION EEM captures information about the last time data was received and displays that
information in a list.
A source can be online, offline, suspect or disabled. If a source has not communicated within
its specified communication period, it is considered suspect. If it has not communicated
within twice its specified communication period, it is considered offline.
Note
The default communication period specified for a source is 1440 minutes (24 hours). This
value can be changed in the Source Editor in Administration Tools. See PowerLogic ION
EEM 4.0 Administration Tool User Guide for more information.
In the top left corner is a dropdown list called Status. This allows you to filter the source
activity list based on the status of the source. Select from all, offline, suspect, online or
disabled.
The number of activities listed per page is controlled from the Pagesize dropdown list in the
top right corner. The value can be changed from 5 sources per page up to 100 sources per
page. Moving between pages is controlled by the Next, Previous, First and Last buttons.
© 2012 Schneider Electric. All rights reserved.
Page 115 of 150
Chapter 7: Administration
ION EEM 4.0 R2 User Guide
Configure Source Activity Notification
The notification window allows you to select the users that will receive notification of inactive
sources.
Note
The configure source activity notification function requires some manual installation.
Contact your Schneider Electric representative for additional information.
To select the users that will receive notifications:
1. Click the Administration tab and navigate to System > Source Management>
Notification.
2. Select all users that are to receive source activity notification from the Configure Source
Activity Notification screen by clicking the checkbox next to the user's name.
3. Click Select All Users to set up source activity notification for all users, or click Clear
User Selection to clear all users.
4. Click Update when finished.
Note
Delivery of the source activity notification can be affected by issues outside of ION EEM,
such as loss of network connectivity. Because of this, delivery of the notification is not
guaranteed.
Assign Weather Sources
Use this page to associate weather sources with other sources in the system.
The Assign Weather Sources feature of ION EEM allows you to associate weather data with
other sources in the system. Once a weather source is associated with another source, the
data for weather measurements will appear as though it were an available measurement for
the associated source.
Page 116 of 150
© 2012 Schneider Electric. All rights reserved.
ION EEM 4.0 R2 User Guide
Chapter 7: Administration
To assign the weather sources:
1. Click the Administration tab and navigate to System > Source Management > Assign
Weather Sources.
2. Select a source hierarchy from the dropdown menu.
3. Select a source from the list.
4. Select a weather source from the Weather Locations window.
5. Click Add(Single) to assign the weather source to the previously selected source
hierarchy. The weather source now appears at the end of the source hierarchy name. Click
Add(Group) to assign all weather sources in a group.
6. Repeat for each source that requires a weather location.
7. Remove a weather source from a source hierarchy by highlighting the source hierarchy
with an assigned weather source and click Clear(Single). To remove all weather sources
in a group, click Clear(Group).
Note
To assign a weather source and still maintain the association between a source and any
existing weather sources, select the Preserve children that already have associated
weather sources assigned checkbox.
Status
User Login Activity
This feature allows you to monitor the login activity of the different users in your ION EEM
system.
© 2012 Schneider Electric. All rights reserved.
Page 117 of 150
Chapter 7: Administration
ION EEM 4.0 R2 User Guide
When opened, the User Login Activity windows displays information about the user,
organization, and the login date and time. Click View Successful Logins to display a list of
valid user logins or click View Failed Logins to show a list of unsuccessful logins.
System Information
The System Information window provides details of the ION EEM system.
The top left corner provides information concerning ION EEM's use of global weather data
and the agreement with CustomWeather, the ION EEM version number, copyright
information, and some of the patent numbers that cover your ION EEM system. In the top
right corner, you will find information covering the customer name, company name, and
project number. Click Show Component Versions to display the different components that
make up your ION EEM system and their respective versions.
UI Behavior
Analysis
Use the Analysis window to determine the basic conventions your EEM interface uses. For
example, on the Dashboard page, you can choose to keep certain icons visible or hidden.
You can also enlarge an analysis in a new window or use the current window, and compress
data for download.
To use the Analysis window:
1. Click the Administration tab and navigate to Modules > UI Behavior > Analysis.
2. Select from the different options in each of the following dropdown lists:
When an analysis is enlarged, enlarge it in a new window. (Yes/No)
Is the icon to enlarge the desktop visible? (Visible/Hidden)
Page 118 of 150
© 2012 Schneider Electric. All rights reserved.
ION EEM 4.0 R2 User Guide
Chapter 7: Administration
Is the icon to download the desktop data visible? (Visible/Hidden)
Is the icon for web content visible? (Visible/Hidden)
Is the icon for editing the desktop data visible? (Visible/Hidden)
Is the icon for changing the desktop view visible? (Visible/Hidden)
Compress the data for download? (Yes/No)
3. Click Apply to save the changes.
4. Click OK to return to the Administration tab.
Custom Time Range
The Custom Time Range feature allows you to define new relative time ranges and manage
the entries that appear in the list of time ranges for Trend Analysis, Billing, and Power Quality
modules.
In the Data Group Area of the Trend Analysis and Power Quality Modules, the Time Range
dropdown list allows you to select from a group of defined time ranges to include in each
series. Most of these time ranges are relative to the current date (Today, Last 7 Days, etc).
Use the Custom Time Range feature to manage the entries that appear in the list of time
ranges, and to define new entries.
© 2012 Schneider Electric. All rights reserved.
Page 119 of 150
Chapter 7: Administration
ION EEM 4.0 R2 User Guide
To create a new time range:
1. Click the Administration tab and navigate to System > Custom Time Range >
Definitions.
2. Click Create New Time Range.
3. Create a title that briefly defines the custom time range expression.
If the time range requires any additional information, enter that in the Comments field.
4. Create the time range expression in the Formula field. See "Time Range expression
syntax" on page 122 for instructions on creating Time Range expressions.
5. Click Test to verify the validity of the time range formula.
The start and finish dates and times are displayed to the left of the test button. Confirm
that these time and dates match the time range you wanted to create. If the formula is not
valid, make the necessary changes and click Test. The time range cannot be saved until
the formula has been validated.
6. Click Save Changes after the formula has been validated.
To save the time range entry, it must have a title that does not conflict with any existing
time range title and have a valid formula that has been tested.
If you do not test a time range expression, the date range expression is still verified when you
click Save Changes. If the expression is invalid, ION EEM displays a message stating that
the expression is not valid, and the date range is not saved.
To edit an existing time range:
1. Select the entry you want to edit from the Custom Time Range window.
The time range name, comments, and formula for the highlighted entry appears in the
Selected Time Range Details area at the bottom of the screen.
2. Make the changes to the entry, keeping in mind that a change to the formula must be
validated by ION EEM before the time range can be saved.
To clone an existing time range:
1. Click on the entry you want to edit from the Define Custom Time Ranges window.
2. Click Clone Time Range. A new entry appears in the list. The new entry has the original
entry's title with a _(1) added.
3. Make any necessary changes to the title, comments or formula.
4. Click Test to validate your entry, or click Save.
If you do not test a time range expression, the date range expression is still verified when
you click Save. If the expression is invalid, the date range is not saved.
Page 120 of 150
© 2012 Schneider Electric. All rights reserved.
ION EEM 4.0 R2 User Guide
Chapter 7: Administration
Tip
The Clone Time Range option is a good way to create a new expression that has a similar
formula to an existing time range, rather than creating one from scratch. Clone the time
range, and then edit the clone with the new expression information.
To delete an existing time range:
1. Click on the entry you want to delete from the Custom Time Range window.
2. Click Delete Time Range.
3. Click OK in the dialog box to confirm your selection, or click Cancel to return the Define
Custome Time Ranges window.
List Management
The List Management window allows you to select a custom time range and add it to the list
in the Trend Analysis, Billing and PQ Analysis modules.
To add a custom time range to a Time Range list:
1. Click the Administration tab and navigate to System > Custom Time Range >
Manage Time Ranges.
2. Select Trend Analysis, Billing, or PQ Analysis from the Time Ranges dropdown list.
3. Select a time range entry from the Available Time Ranges list.
4. Click the >> button to add a time range to the Time Range List.
5. To remove a time range from a Time Range list, select the entry from the list in the right
pane and use the << button to remove it from the right-hand pane.
© 2012 Schneider Electric. All rights reserved.
Page 121 of 150
Chapter 7: Administration
ION EEM 4.0 R2 User Guide
To help organize the time ranges into logical groups, each item can be preceded with a
separator line. Select the Precede with separator checkbox to enable this function. A
separator line appears above the time range row to indicate where the separator line
appears in the the time range list.
6. Move the time ranges row up or down the list as required by clicking the up/down arrows
in the Move column.
7. Click Save when finished, or Cancel to discard your changes.
Note
The Fixed date range item is not editable and is always visible.
Restoring expressions
When a trend or power quality analysis is saved, the complete time range definition is saved
as well. This includes the time range title and formula. If an analysis that had previously been
removed is later restored, the time range expression it uses will be returned to the definitions
list.
Time Range expression syntax
To create a custom time range, an expression syntax is used in the Definitions section. The
expression syntax described below is implemented by indexing the different time dimensions
within and around each other.
Time Range Expressions:
There are several predefined single word ranges that can appear in other expressions:
Time dimension name
Count
minute[s] | hour[s] | day[s] | week[s] | month[s] | year[s] |
day of month
any numeric value written as digits, (e.g., 0,1, 123,-17)
or any written out English word for the numbers 1
through 12 (one, two,…)
Example
three hours (<Count> <Time dimension name>)
4 days (<Count> <Time dimension name>)
42 weeks (<Count> <Time dimension name>)
Times relative to now:
Predefined intervals
Current period
Stretch including now
Offset from now
today, tomorrow, yesterday
last, this, next
<Current period> <count> <Time dimension name>
ago, from now
Examples
today (Predefined interval)
next week (<Current period> <Time dimension name>)
Page 122 of 150
© 2012 Schneider Electric. All rights reserved.
ION EEM 4.0 R2 User Guide
Chapter 7: Administration
last three days (<Current period> <Count> <Time dimension name>)
Relative offsets within intervals:
There are expressions which find the index of one time within another and then use that offset
to move around in a different but related period (last year). Create these offsets by putting two
of the first four kinds of expressions listed above under Times relative to now beside each
other:
Example
this week last year (<time relative to now> <time relative to now>)
two weeks ago last year (<time relative to now> <time relative to now>)
Note
If an expression would lead to a day that does not exist (e.g., Feb 30, April 31) then the last
day of that month would be displayed. This day last month on March 31st would display as
February 28th.
Indexing and filtering one time relative to another
timePoint
dateRange
value
nth
any expression that evaluates to a single point in time
any other date range expression
name of a day of week, or month, or the number for a minute or hour for filtering
number followed by st, rd, or th (e.g., 1st, 22nd, or an English number word first, fourth, etc.)
Examples
1st day=sunday of this year (first sunday of this year)
3rd day=Wednesday in 4th month of last year (the date of the third Wednesday in April, last
year)
Note
It is very typical to forget to mention the day= part of a filter, because you would normally
say 'first Tuesday in May of this year' but here you have to specify '1st day = Tuesday in
5th month of this year'
Explicit time ranges
If none of the above combinations creates the time range you want, you can combine them by
explicitly naming the start and end of the period that you want separately.
from <timePoint> to <timePoint>
from <timeInterval > to <timeInterval>
The second form creates an interval that runs from the start of the first named interval to the
end of the second, so it's a shorthand for "from Startof(<timeInterval>) to Endof
(<timeInterval>).
© 2012 Schneider Electric. All rights reserved.
Page 123 of 150
Chapter 7: Administration
ION EEM 4.0 R2 User Guide
Examples
from startof(1st day=sunday of this year) to startof(3rd day=Wednesday in 4th month of this
year)
from startof(next hour) to endof(4 hours from now)
To view data from a particular date onward, you can have a predefined date range in the list.
The Timepoint makedate() creates a single time point that can be part of an expression.
Timepoint
startof(<any date range expression>)
endof(<any date range expression>)
makedate(yy, mm, dd, [hh, mm, ss])
now
eternity
Page 124 of 150
Picks the start time of the specified date range
Picks the end time of the specified date range
Creates an explicit date
The current time, to the second
Maximum possible date
© 2012 Schneider Electric. All rights reserved.
ION EEM 4.0 R2 User Guide
Chapter 7: Administration
Modules
The Administration menus contain System and Module sections. Each System menu and
submenu contain links to other pages where you can manage your ION EEM's module
administration tasks.
Cost Allocation
This section provides instructions on how to associate billing points with their respective
commodities and ensure that each department or cost center is allocated their appropriate
portion of the energy bill.
Note
Bills generated by this module should be checked for accuracy and compared to a utility bill.
This module was not designed to be used for sub-billing. Also note that low quality data (data
that has gaps, spikes or other issues) can affect the accuracy of your bills.
Terms and definitions
This table shows some of the terms and definitions that are important to understanding the
Cost Allocation section. Even if some of these terms are familiar to you, they may have a
slightly different meaning when used in reference to ION EEM. Familiarize yourself with
these terms and definitions before continuing.
Terms
Definition
Allocation
The distribution of an energy bill between various departments or cost centers
that contribute to that bill.
Billing Point
A meter that contributes billing data to an energy bill. This is usually the main
meter, but it is possible to use a sub-meter as a billing point.
Commodity
The utility type, such as electricity or gas. You can choose to have multiple
commodities for a utility type. For example, you may be billed by different
vendors for the delivery and consumption of gas. One commodity could be
called Gas Delivery and another Gas Consumption. The default commodity is
Electricity.
Blended Rate
A single energy rate that captures all energy charges, demand charges, fees
and taxes associated with a utility bill. It is usually calculated by dividing the total
utility cost by the total energy usage.
Input Measurement
In the Cost Allocation module, Input Measurements are needed to allocate
data for the billing points, and are divided into three parts:
-Total Consumption: total consumption for the billing point(s) used by a
commodity.
-Total Cost: total bill for the billing point(s) used by a commodity. Typically, this
is the total cost indicated on the utility or vendor billing statement.
-Metered Consumption: measurements used to record the actual
consumption measurement.
Output Measurement
In the Cost Allocation module, Output Measurements are written into when
the billing point is allocated. Output Measurements are divided into two parts:
-Cost per Unit: measurement used to record the final cost per unit
-Adjustment Factor: the ratio between the Total Consumption and the Total
Consumption of the meter’s constituents. This can be used to distribute line
loss across sub-meters, or to cover meter discrepancies.
© 2012 Schneider Electric. All rights reserved.
Page 125 of 150
Chapter 7: Administration
ION EEM 4.0 R2 User Guide
Cost Allocation overview
The following is an overview of the Cost Allocation process:
Create Commodity: Create a commodity by typing a commodity name, determining the
commodity billing points, and selecting the measurements that are to be associated with the
commodity.
Add/Edit Allocation: Add or edit an allocation for the billed entities by selecting a
commodity and a billing point from the Manage Cost Allocation window.
Enter Bill Entry Details: Use this section to enter billing information provided by the utility
company. This information can then be used to calculate Cost per Unit.
Create Custom Reports: When the billing entries have been entered, allocations can be
viewed using the Cost Allocation Reports.
Before you begin
Before you begin using the Cost Allocation module, confirm that the following tasks have
been completed:
Set up Cost Allocation Hierarchies
Cost Allocation hierarchies allow you to create logical groupings for the different billing points
in your system. Creating these hierarchies is done in the Source Node Hierarchies plug-in of
the Administration Tool. See the “Source Node Hierarchies Plug-In” section of the
Administration Tool User Guide for instructions on setting up a Source Node Hierarchy.
Upload Cost Allocation Report Pack
The Cost Allocations module uses a report pack for creating different reports based on the
entered allocation data. In order to use these reports, the Cost Allocation Report Pack must
be installed. See "Uploading a report or a report pack" on page 75 for instructions on
Page 126 of 150
© 2012 Schneider Electric. All rights reserved.
ION EEM 4.0 R2 User Guide
Chapter 7: Administration
uploading reports and report packs. When uploaded, the report templates are available in the
Reporting tab.
Note
Contact your ION EEM administrator to confirm these tasks have been completed before
you proceed.
Manage Cost Measurements
Use this window to associate billing points (such as meters) with commodities (electricity,
gas, water, etc.). You must also specify measurements to track the input and output of the
commodity. Before you can establish cost allocations, a commodity and its measurements
must be added.
Note
Measurements should be created for each Commodity. If two Commodities shared a
measurement, one Commodity could overwrite the values of the other.
A. Commodity: Electricity is the default commodity.
B. Assigned Billing Points: These points correspond with the meters (sources) that are selected for cost
allocation for this commodity.
C. Assigned Commodity Measurements: These are the measurements associated with the selected
commodity.
To create or edit an allocation:
1. Click Administration > Cost Allocation > Manage Measurements to display the
Manage Commodity Measurements window.
2. click New to add a commodity. Type the name in the commodity field.
To edit a commodity, select the commodity from the dropdown Commodity list. Click Edit.
3. Click Select Billing Points to display all of the potential billing points in your system for
this commodity. Typically, there is one billing point per commodity, but this varies by
system.
If you want to include additional billing points, repeat step 2 for each point.
4. Expand the tree, then select the source(s). These are the billing point(s).
© 2012 Schneider Electric. All rights reserved.
Page 127 of 150
Chapter 7: Administration
ION EEM 4.0 R2 User Guide
5. Select the measurements associated with the commodity. Under the Input heading, select
measurements for the following information coming in from the utility bill:
Total Consumption: Select the measurement to be used to record the total consumption
for the billing point(s) used by this commodity. Typically, this is the total consumption
indicated on the utility or vendor billing statement.
Total Cost: Select the measurement to be used to record the total bill for the billing point
(s) used by this commodity. Typically, this is the total cost indicated on the utility or vendor
billing statement.
Metered Consumption: Select the metered measurement that is used to record the
actual consumption in your system. For example, electricity consumption is often metered
as actual energy or kWh delivered.
6. Select measurements from under the Output Measurements heading to record the
following input from the cost allocation option:
Adjustment Factor: Select the measurement used to record the adjustment factor. The
adjustment factor can be calculated on the Manage Cost Allocations window.
Cost per Unit: Select the measurement to be used to record the final cost per unit on the
Manage Cost Allocations window.
7. Click Save.
Manage Cost Allocations
Use this window to add or edit a cost allocation for all of the billed entities below a single
billing point (meter). Before adding an allocation, you must create and configure its
corresponding commodity on the Manage Measurements page.
A. Commodity: The utility type. The default commodity is Electricity.
B. Billing point: A source that contributes billing data to the energy bill.
Page 128 of 150
© 2012 Schneider Electric. All rights reserved.
ION EEM 4.0 R2 User Guide
Chapter 7: Administration
C. Bill entry: This is the section where you enter the billing information from the utility company. The billing
period, cost and consumption values are entered here.
D. Adjustment factor: All energy systems (electricity, gas, water, etc.) will sustain natural losses during
transmission of the commodity (such as heat loss from a heating system). Thus, readings from meters that are
one or two steps removed from the incoming power (first-level and second-level sub-meters) will be slightly lower
than one might expect. Although these losses are minimal, you may want to track them for reporting purposes. To
allocate costs equally between the various meters, you can calculate an adjustment factor. This factor does not
adjust the actual readings of any of the meters. Instead, it is simply used in reports to cause the sum total of all submeters to equal 100% of the total bill.
To add or edit an allocation for a single billing point:
1. Click Administration > Cost Allocation > Manage Allocations to display the Manage
Cost Allocations window.
2. Select a commodity and a single billing point from the dropdown lists.
If you have already performed cost allocation(s) for this commodity/billing point, a table
containing a row for each allocation is displayed under the Commodity field.
3. Click New to add an allocation.
To edit an allocation, highlight the allocation you want to change and click Edit.
4. Enter the time period that the bill covers in the Period field.
5. Enter the total cost for the billing point during the billing period. Use the currency that was
reported on the bill (dollars, euros, pounds, etc.). Do not enter the symbol for the currency.
6. Enter the Consumption of this commodity for the specified billing period. For example, if
the total bill is for 2,000.50 KWh, type 2000.50. Alternatively, you can select Use Metered
Values to read the consumption values from the metered data stored in the system.
7. Click Calculate to display the Cost per unit (the cost of each unit of the commodity; for
example, the cost per KWh).
When the Adjustment Factor box is checked, the consumption for each meter in the bill is
adjusted so that the totals from all of the sub-meters equal the utility bill or the metered
data from the billing point. This adjustment is equally divided among all meters that are
included underneath the main billing point for this commodity.
Note
If the Use Adjustment Factor box and the Use Metered Values box are both selected,
there must be metered data for the adjustment factor to be correctly applied.
8. Click Save.
If you are calculating the adjustment factor for many meters, it can take a few minutes for
the system to calculate and display the adjustment factor. The table at the top of screen
displays the new or edited allocation.
Configuring Exceptions
Use Configure Exceptions in the Manage Commodity Measurements window to associate
one or more of a commodity’s billing points with a different consumption measurement.
© 2012 Schneider Electric. All rights reserved.
Page 129 of 150
Chapter 7: Administration
ION EEM 4.0 R2 User Guide
To use the Configure Exception feature:
Click Administration > Cost Allocation > Manage Allocations to display the Manage
Cost Allocations window.
1. From the Manage Commodity Measurements window, select a commodity from the
dropdown list.
2. Click Edit.
3. Click Configure Exceptions. The Measurement Exceptions window appears.
4. Select the billing point from the dropdown menu. To the right of the dropdown menu, there
is a button that is displaying the current consumption measurement. Click the button to
change this measurement. The Source/Measurement window appears.
5. Select the group from the dropdown menu, expand the tree, choose the new
measurement, and click OK.
6. Click Save.
Note
When complete, clicking Configure Exceptions again will bring up the Measurement
Exceptions window, which displays all the billing points that have a measurement
exception.
Cost Allocation reports
When the bill entries have been entered in the Manage Cost Allocations page, allocations can
be viewed using the Cost Allocation Reports. These reports are divided into three types:
Cost Allocation Detail: Sorts Nodes by name but doesn’t separate them.
Cost Allocation Summary: Organizes Node by commodity.
Cost Allocation Summary by Node: Organizes Nodes by node name.
External content
Weblinks and files
The Weblinks and files feature of ION EEM allows you to create links to external information
that you want to view on your Dashboard. Weblinks can be any URL on the Internet that can
be viewed in Internet Explorer. You can also create links to files and folders that are stored on
your corporate network.
Note
Some companies do not allow you to display their website within a subframe of Internet
Explorer. Your browser may navigate you out of the ION EEM web interface and onto the
company's web site when you click the Preview button. If this occurs, you may not be able
to create a weblink to this site in ION EEM.
Page 130 of 150
© 2012 Schneider Electric. All rights reserved.
ION EEM 4.0 R2 User Guide
Chapter 7: Administration
To create external web links:
1. Click the Administration tab and navigate to Modules > External Content > Weblinks
and Files.
2. Type the URL of the weblink you want to view. Use the correct protocol prefix (http://,
https://) for your weblink.
3. Click Preview to test your weblink.
4. Click File > Save As when the weblink is set up correctly.
5. Enter a descriptive name for your weblink.
6. Click OK.
To create file and folder links:
1. Click the Administration tab and navigate to Modules > External Content > Weblinks
and Files.
2. Type the location of the file or folder that you want to view. Use the correct protocol prefix
(file://) for your Weblink.
3. Click Preview to test your weblink.
4. Click File > Save As when you are satisfied with the weblink.
5. Enter a descriptive name for your weblink.
Examples of file and folder links
file://MyNetworkLocation/ProjectDirectory/ProjectOverview.ppt
\\MyNetworkLocation\ProjectDirectory
Manage
Use the Manage section of the Weblinks and Files window to manage or share your web links
and file information.
To manage the web and file links available in your system:
1. From the Administration tab, click Modules > External Content > Manage. The
Manage Weblinks window appears. Select the Manage button.
2. Use the buttons along the right side of the Manage window. Available options are:
New Folder: creates a new folder for weblink management.
Delete: deletes the weblink from your system.
Rename: renames the weblink. Enter a new report name and click Update to change.
Copy: copies the selected weblink. Choose the new folder or root location for the weblink
and click Update.
Move: moves the weblink to a new location. Choose the new folder or root location for the
weblink and click Update.
3. Click the Close button to close the Manage window.
© 2012 Schneider Electric. All rights reserved.
Page 131 of 150
Chapter 7: Administration
ION EEM 4.0 R2 User Guide
Power Quality
Configuration
Configure the general settings of your PQ Analyses, such as default views, icon visibility and
PQ details.
To configure the settings of your PQ Analysis:
1. click the Administration tab and navigate to Modules > Power Quality >
Configuration.
2. Select from the different options in each of the following dropdown menu located in the PQ
Analysis screen:
• Is the icon to enlarge the analysis visible? (Visible/Hidden)
• Is the icon to download the analysis data visible? (Visible/Hidden)
• Show the page in advanced mode by default? (Yes/No)
• Show voltage percent values in the PQ details table that are nominal (i.e., 100%).
(Yes/No)
• What should the default view be for summary events? (Default is Chart)
• What should the default view be for detail events? (Default is Chart)
The Classification box in the Configuration page displays a list of all selectable
classifications available for PQ analyses. You can use these classifications as filters for
your PQ Analysis.
Page 132 of 150
© 2012 Schneider Electric. All rights reserved.
ION EEM 4.0 R2 User Guide
Chapter 7: Administration
You can also use the Classification section to create new classifications. In the field that
has the grayed out Add icon ( ) beside it, enter the name of the classification. When a
name is entered into that field, the Add icon becomes enabled. Click the Add icon to add
the new classification name to the list. Click the Remove icon ( ) to remove the
classification. See "PQ Analysis Module" on page 41 for more information.
3. Click Apply to apply the changes.
4. Click OK to return to the Administration page.
Manage
Use the Manage section of the Administration tab to manage or share your PQ Analyses.
To manage the PQ analysis available in your system:
1. From the Administration tab, click Modules > Power Quality > Manage. The Manage
Analyses window opens. Select the Manage button.
2. Use the buttons along the right side of the Manage window. Available options are:
New Folder: creates a new folder for analysis management.
Delete: deletes the analysis from your system.
Rename: renames the analysis. Enter a new report name and click Update to change.
Copy: copies the selected analysis. Choose the new folder or root location for the analysis
and click Update.
Move: moves the analysis to a new location. Choose the new folder or root location for the
analysis and click Update.
3. Click the Close button to close the Manage window.
To share the PQ analyses available in your system:
1. From the Administration tab, click Modules > Power Quality > Manage. The Manage
Analyses window opens. Select the Share button.
2. Select the PQ Analysis you want to share by selecting from the list in the left hand pane of
the window.
3. From the Available Users and Groups list, use the left/right arrow buttons to share or
unshare your analyses with others.
4. Click Apply to apply your new sharing configurations to your analysis.
5. Click the Close button to close the Manage window.
Reporting
Configuration
Use this section to establish how the report data is emailed to recipients or written to fileshare
(determined when adding a subscription for the report). In this section, you also determine
how duplicate files are handled when reports are written to a fileshare.
To configure how report data is handled, follow these steps:
1. Click the Administration tab and navigate to Modules > Reporting > Configuration.
© 2012 Schneider Electric. All rights reserved.
Page 133 of 150
Chapter 7: Administration
ION EEM 4.0 R2 User Guide
2. At the Reporting screen, fill out the following fields:
Email SMTP Server: Type the network server name from which the reports are to be
emailed.
Email “From” display name: Type the sender's name
Email “From” address: Type the sender email address.
Overwrite duplicate files...?: When report data is written to a fileshare, choose whether
to overwrite any existing report data or to create a new unique filename for the report.
3. Click OK to save.
Manage report
Use this section to manage report locations, share reports with users and groups, and create
report subscriptions (report execution schedules). For detailed instructions, see "Manage the
report:" on page 78.
Upload report templates and report packs
Uploading a new report template
Use this feature to upload report templates. See "Uploading a report or a report pack" on page
75 for details about creating and uploading reports. Report Templates are named with an .rdl
extension.
NOTICE
LOSS OF DATA
Do not upload report templates or report packs without thorough knowledge of
ION EEM Reporting, or assistance from qualified Schneider Electric personnel.
Failure to follow these instructions can result in corrupted or lost reports.
Note
Uploading report templates and report packs is an advanced feature that can overwrite
existing reporting functions, and should not be done by personnel without a thorough
knowledge of ION EEM Reporting. Improper uploading can result in corrupted or lost
reports.
Do not upload report templates or report packs without assistance from qualified Schneider
Electric personnel.
To upload a new report template:
1. Click the Administration tab and navigate to Modules > Reporting > Upload Report
Template.
2. On the Upload Report Template page, browse to the location of the .rdl file. Select the
report and click Upload.
Page 134 of 150
© 2012 Schneider Electric. All rights reserved.
ION EEM 4.0 R2 User Guide
Chapter 7: Administration
A new report is automatically created. It displays in the Reports Selector control of the
Reporting tab. It will have the same name as the .rdl file on which it is based.
Updating a report template
Use this feature to update an existing report template (one that has reports associated with it)
by following the same steps used for uploading a template. This will not create a new report,
but will update the original one(s). A confirmation message displays, asking you if you want
update all associated reports for this template. Click OK to continue.
Uploading a report pack
Report packs contain all of the files and logic necessary to generate a series of report
templates. Use this feature to upload report packs, making them available on the Reporting
tab. Note that the billing reports installed by the billing report pack are available via the Billing
tab.
To make a report pack available for upload:
1. Copy the report into the Report Pack directory (ION EEM root folder > ReportPacks).
2. Navigate to Administration > Modules > Reporting > Upload Report Pack.
3. At the Report Pack Upload screen, click the report pack that you want to upload. If a report
pack status is Uploaded, you can upload it again (updating the layout, if it has been
changed). Click Upload.
The new report pack displays in the Reports Selector control of the Reporting tab.
Updating a report pack
To update an existing report pack:
1. Follow the same steps as with Uploading a report pack. This will not create any new
reports, but will update the original ones. A confirmation message displays, telling you that
there are changed report templates within the report pack, and asking if you want to update
all of the associated reports for this report pack.
2. Click OK.
Trend Analysis
Configuration
Use the Configuration window to determine the number of rows your data tables render
(unless the data table is being viewed in Enlarged mode) and the number of decimal places to
display in the data table.
© 2012 Schneider Electric. All rights reserved.
Page 135 of 150
Chapter 7: Administration
ION EEM 4.0 R2 User Guide
To configure your Trend Analysis general settings:
1. Click the Administration tab and navigate to Modules > Trend Analysis >
Configuration.
2. At the Trend Analysis screen, select from the available options for the following
dropdown menus:
• Data tables will only render this number of rows. This value determines the number of
rows rendered for each data table.
• Is the icon to enlarge the analysis visible? (Visible/hidden)
• Is the icon to download the analysis data visible? (Visible/hidden)
• Show the page in advanced mode by default? (Yes/No)
• The number of decimal places to display in the data table
3. Click Apply to apply your changes to the Trend Analysis module.
4. Click OK to save your entries.
Manage
Use the Manage section of the Trend Analysis window to manage or share your Trend
Analyses.
To manage the Trend Analyses available in your system:
1. From the Administration tab, click Modules > Trend Analysis > Manage. The Manage
Analyses window opens. Select the Manage button.
2. Use the buttons along the right side of the Manage window. Available options are:
New Folder: creates a new folder for analysis management.
Delete: deletes the analysis from your system.
Page 136 of 150
© 2012 Schneider Electric. All rights reserved.
ION EEM 4.0 R2 User Guide
Chapter 7: Administration
Rename: renames the analysis. Enter a new report name and click Update to change.
Copy: copies the selected analysis. Choose the new folder or root location for the analysis
and click Update.
Move: moves the analysis to a new location. Choose the new folder or root location for the
analysis and click Update.
3. Click the Close button to close the Manage window.
To share the Trend Analyses available in your system:
1. From the Administration tab, click Modules > Trend Analysis > Manage. The Manage
Analyses window opens. Select the Share button.
2. Select the Trend Analysis you want to share by selecting from the list in the left hand pane
of the window.
3. From the Available Users and Groups list, use the left/right arrow buttons to share or clear
your analyses with others.
4. Click Apply to apply your new sharing configurations to your analysis.
5. Click the Close button to close the Manage Analyses window.
Waveforms
Configuration
© 2012 Schneider Electric. All rights reserved.
Page 137 of 150
Chapter 7: Administration
ION EEM 4.0 R2 User Guide
Use the Configuration window to customize the general appearance settings of your
waveforms in the waveform viewer window. From the dropdown menus in this window you
can change the color, phase labels and phasor alignment. When you have finished, click
Apply to apply your changes and click OK to save changes and close the window.
WebReach
Permissions
Use the Configure WebReach Diagram Permissions window to add new diagrams and select
which users and groups can access your WebReach diagrams.
To add a new diagram:
1. Click the Administration tab and navigate to Modules > WebReach > Permissions.
2. Click Add New Diagram.
3. Type diagram name in the appropriate field and click Add New Diagram. Click Cancel to
return to the previous window.
Note
Diagrams can be added in a hierarchal structure (e.g., Diagram/Test/New).
The new diagram now appears in the diagram list.
To rename a diagram:
1. Select the diagram from the list and click Rename.
2. In the New diagram name field, type the new name and click Rename Diagram or click
Cancel to return to the previous window.
Page 138 of 150
© 2012 Schneider Electric. All rights reserved.
ION EEM 4.0 R2 User Guide
Chapter 7: Administration
To delete a diagram:
1. Select the diagram you want to delete from the list and click Delete.
2. Click OK in the dialog box to confirm your selection. The diagram is removed from the list.
To configure WebReach diagram permissions:
1. Click the Administration tab and navigate to Modules > WebReach > Permissions.
2. Select users from user list or click Select all users to give permission to all users in list.
Click Update to save permissions. To clear user list, click Clear user selection.
3. To select users that are part of a group, select the user group from the list or click Select
all groups to give permission to all user groups. Click Update to save permissions. To
clear the user group list, click Clear group selection.
© 2012 Schneider Electric. All rights reserved.
Page 139 of 150
Chapter 7: Administration
ION EEM 4.0 R2 User Guide
Tools
ION EEM contains several applications that assist in configuring various modules. These
applications should only be used by qualified personnel.
NOTICE
LOSS OF DATA
Do not use the applications located in the ...\IONEEM\bin\ folder unless you have
advanced knowledge of their operation.
Failure to follow these instructions can result in permanent loss of data.
Administration Tool
Note
You must login to your ION EEM system with administrator permissions to be able to
launch the administration tool. The tool queries the ION EEM server to verify your login
credentials.
To install the Client Administration Tool:
1. Click the Administration tab and navigate to Tools > Administration Tool > Run
Installer.
2. Click Install to download the Administration Tool zip file.
3. Unzip the contents of the install.zip file to a new folder.
4. Navigate to the folder that contains the unzipped files.
5. Double-click setup.exe to install the Administration Tool.
Once installation is complete, you will have a new program called ION EEM Administration
Tool. To access the tool, navigate to the folder that contains the Administration Tool files.
The default location is Start > Program Files > Schneider Electric > ION EEM
Administration Tool.
You must provide additional login credentials and a remote server address (if you are
connecting remotely) when you open the Administration Tool.
Note
When you log in remotely, you may see a Source/Measurement Count message. This
message displays if there are more than 1000 source/measurement pairs in the system.
You can continue with login but, because of the large amount of data in the system, the
server may time out. To avoid this situation, you should log in locally to the server. The
option to log in locally or remotely is on the login screen.
To uninstall the ION EEM Client Administration Tool:
1. Click Start > Settings > Control Panel and open the Add/Remove Programs application.
Page 140 of 150
© 2012 Schneider Electric. All rights reserved.
ION EEM 4.0 R2 User Guide
Chapter 7: Administration
2. Navigate to ION EEM Administration Client from the list of currently installed programs.
3. Select the ION EEM Administration Client, and click Change/Remove.
4. Select Remove and click Next from the InstallShield Wizard window.
The InstallShield Wizard removes the ION EEM Administration Client.
Manual Data Entry
Note
Improper use of this feature can result in inaccurate data. Verify the accuracy of all values
before proceeding.
This feature should only be used by qualified personnel.
The Manual Data Entry control allows you to manage raw source measurement pair data
directly from ION EEM. You can add, edit, or delete data for source/measurement pairs,
provided the following conditions are met:
• You have permission to manage source/measurement pairs.
• The ImportEnable flag is set to true.
• The ManualEdit data provider type is enabled for access. This is enabled by default.
• When adding a new series, the ReadingInterval setting is required to be set to a valid
value.
Note
The source/measurement pair flags and settings are configured through the ION EEM
Administration Tool in the Data Import Plugin. Only an Administrator can access and
configure source/measurement pairs.
Accessing the Manual Data Entry Page
To access this tool, the Administrator must allow access to other users. This is
accomplished in the Manual Data Entry Permissions Page.
The table below describes the default permissions for User Logins that have the following
User Levels:
User Level
Administrator
User Administrator
Power User
User
Permission Page Access
Always
Never
Never
Never
Manual Data Entry Page Access
Always
Yes/No (Default: No)
Yes/No (Default: No)
Yes/No (Default: No)
Note
Access to the Manual Data Entry page will be granted on a user login basis, and not a user
group basis. This means that users that belong to the same User Group and have the same
User Level may not all have access to this tool.
© 2012 Schneider Electric. All rights reserved.
Page 141 of 150
Chapter 7: Administration
ION EEM 4.0 R2 User Guide
Using the Manual Data Entry Page
From the Administration tab, click Tools > Manual Data Entry > Manual Data Entry. The
Manual Data Entry window opens.
Note
Before using the manual data entry functionality of ION EEM, make sure the
source/measurement pair data is accurate.
To view data:
1. Click the Select a Source... button and select a source from the dialog box.
2. Click the Select a Measurement... button and select a measurement from the dialog box.
3. Click the View Data button. The logged data is displayed in descending chronological
order. Use the << 1st Page, < Prev, Next >, and Last Page >> buttons to navigate
through the data.
You can change the number of entries listed per page by choosing a value from the New
Page Size dropdown list and clicking Change.
To add a single data point:
1. Click the Select a Source... button and select a source from the dialog box.
2. Click the Select a Measurement... button and select a measurement from the dialog box.
3. Click the View Data button. Any available data appears in the grid.
4. Click the New button.
Page 142 of 150
© 2012 Schneider Electric. All rights reserved.
ION EEM 4.0 R2 User Guide
Chapter 7: Administration
5. In the date/time fields, enter the date and time of the entry.
Date: The date is entered in M/D/Y format. You can also click on the calendar icon ( )
and select the date from the calendar, or click in the date field and use one of the shortcuts
shown below.
Shortcut
Definition
T
[UP]
[DOWN]
[PAGEUP]
[PAGEDOWN
Today
Next Day
Previous Day
Next Month
Previous Month
Time: If the selected source has no set Reading Interval, such as a monthly reading, the
time can be entered in an h:mm:ss AM or h:mm:ss PM format, or click in the time use one
of the shortcuts shown below.
Shortcut
Definition
CTRL+N
[UP]
[DOWN]
[PAGEUP]
[PAGEDOWN
Now
Next Minute
Previous Minute
Next Hour
Previous Hour
If the selected source has a set Reading Interval, the time can be selected from the values
available in the dropdown.
6. in the Value field, enter the value of the manual entry.
7. Click Save. One single entry will be saved for the source/measurement pair with the day,
time, and value that was entered.
© 2012 Schneider Electric. All rights reserved.
Page 143 of 150
Chapter 7: Administration
ION EEM 4.0 R2 User Guide
To add a data series:
1. Click the Select a Source... button and select a source from the dialog box.
2. Click the Select a Measurement... button and select a measurement from the dialog box.
3. Click the View Data button. Any available data appears in the grid.
4. Click the New Series button.
5. Select Fixed Date… or a predefined time range option from the Time Range dropdown
list.
6. Enter a numeric value in the Value field.
7. Set the Distribute value over series check box.
Leaving this option unchecked saves the entered value across all data intervals in that
time range. Checking the option means that the value you’ve entered will be interpolated
by dividing it over the number of intervals in the time range specified, and this value will be
saved across all data intervals in that time range.
8. Set the Save values interval beginning check box.
Leaving this field unchecked means that values will be saved on the ending interval. This
is the default EEM behavior.
9. Click Save.
To edit a single point:
1. Click the Select a Source... button and select a source from the dialog box.
2. Click the Select a Measurement... button and select a measurement from the dialog box.
3. Click on the data row to be edited to select.
4. Click Edit.
5. Edit the numeric value for this data point.
Page 144 of 150
© 2012 Schneider Electric. All rights reserved.
ION EEM 4.0 R2 User Guide
Chapter 7: Administration
Note
The data point timestamp cannot be edited. The only way to make a change to the
timestamp is to delete the data point and enter the data again with a desired timestamp.
6. Click Save.
To delete a single point:
1. Click the Select a Source... button and select a source from the dialog box.
2. Click the Select a Measurement... button and select a measurement from the dialog box.
3. Click Delete.
4. Click OK in the dialog box to confirm.
© 2012 Schneider Electric. All rights reserved.
Page 145 of 150
Chapter 7: Administration
ION EEM 4.0 R2 User Guide
Manual Data Entry Permissions
Use this window to provide user access to the Manual Data Entry Page. By default, User,
Power User, and User Administrator user levels do not have access to the Manual Data
Entry page. This access must be provided by an Administrator.
From the Administration tab, click Tools > Manual Data Entry > Manual Data Entry
Permissions. The Configure Manual Data Entry Permissions window opens.
To give users access to the Manual Data Entry page:
1. Select the checkbox by each user name who should have access to the Manual Data
Entry page. Click Select all users to select every name in the user list, or click Clear
user selection to remove the option from each user name with a check beside their name.
2. Click Update to save the permission changes. A message appears stating that
permissions have been updated.
Note
Access to the Manual Data Entry page is granted on a user login basis, not a user group
basis. This means that users that belong to the same User Group and have the same User
Level may not all have access to this tool.
Page 146 of 150
© 2012 Schneider Electric. All rights reserved.
ION EEM 4.0 R2 User Guide
Index
A
E
accounts
cloning 108
login activity 117
Administration 103
Export trend analysis to report 34
B
Group Permissions 115
bill filtering
based on date range 62
based on tariff 62
bill selection display 63
Billing page
interface 62
bills
administration menu 63
cloning 66
comparing 66, 70
manual entry 64
C
charts
zooming and scrolling 42
G
I
Interface
billing 62
desktop pages 10
M
Modeling 81
Before you begin 85
Creating a target 100
Model Creation 87
Model Creation in ION EEM 83
Modeling Workflow 84
Targeting 96
What is a target 96
cloning
user accounts 108
user groups 110
Copy Dashboards 110
cost allocation 125
managing allocations 128
managing measurements 127
Cost allocation overview 126
creating a new page 14
Custom Time Range 119
Time Range expression 122
D
Dashboard module 9
customizing pages 16
deleting pages 16
elements of the dashboard 11
default reports 76
deleting pages 16
desktop page
deleting pages 16
display area 12
editing or customizing 16
maximizing pages 10
selector control 11
© 2012 Schneider Electric. All rights reserved.
P
PQ Analysis Module 41, 54
chart control area 45
classify PQ analyses 49
create new PQ anallysis 47
event selector area 43
event summary area 44
filter PQ analyses by time dimension 49
interface 42
open existing PQ analysis 48
open multiple waveform viewers 59
power quality event types 59
printing PQ analysis reports 59
view details 53
Printing a Trend Analysis 36
procedures
comparing two bills 70
creating a new page 14
customizing pages 16
deleting pages 16
modifying permissions 107
obtaining detailed bill information 66
Page 147 of 150
ION EEM 4.0 R2 User Guide
R
report pack
updating 135
uploading 135
report template
updating 135
uploading 134
reporting
exporting to PDF or Excel file 77
saving a report 77
subscriptions 78
templates and parameters 76
typical workflow 74
waveforms of PQ analyses
viewing 54
weblinks and files 130
Z
zooming and scrolling
charts 42
S
saving a report 77
scrolling
charts 42
subscriptions
adding 79
T
Trend Analysis module 17
add or remove data filters 27
create new trend analysis 28
interface 18
open existing trend analysis 29
select/update trend analysis data 31
set custom date range 33
trend analysis expressions 37
typical workflow
reporting 74
U
updating report templates 135
user account
cloning 108
user groups
adding and setting permissions 109
cloning 110
User Permissions 112
V
view waveforms 54
W
waveform viewers
open multiple 59
Page 148 of 150
© 2012 Schneider Electric. All rights reserved.
PowerLogic™ ION EEM™ 4.0 R2
User Manual
Schneider Electric
ION, ION EEM, ION Enterprise, PowerLogic, and Schneider Electric are either trademarks or
2195 Keating Cross Road
registered trademarks of Schneider Electric in France, the USA and other countries. Other
Saanichton, BC V8M 2A5 Canada
trademarks used are the property of their respective owners.
Electrical equipment should be installed, operated, serviced and maintained only by qualified
personnel. No responsibility is assumed by Schneider Electric for any consequences arising out of
the use of this material.
7EN02-0316-01 09/2012
Contact your local Schneider Electric sales representative for
Replaces 7EN02-0316-00 03/2012
assistance or go to www.schneider-electric.com
© 2012 Schneider Electric. All Rights Reserved.