1
CRANFIELD UNIVERSITY
JIANING GUO
FEATURE BASED COST AND CARBON EMISSION MODELLING
FOR WIRE AND ARC ADDITIVE MANUFACTURING
SCHOOL OF APPLIED SCIENCES
MSc by Research Thesis
Academic Year: 2011 - 2012
Supervisors: Dr. Jörn Mehnen and Dr. Yuchun Xu
December 2012
CRANFIELD UNIVERSITY
SCHOOL OF APPLIED SCIENCES
MSc by Research Thesis
Academic Year 2011 - 2012
JIANING GUO
Feature Based Cost and Carbon Emission Modelling for Wire and
Arc Additive Manufacturing
Supervisors: Dr. Jörn Mehnen and Dr. Yuchun Xu
December 2012
This thesis is submitted in partial fulfilment of the requirements for
the degree of Master of Science
© Cranfield University 2012. All rights reserved. No part of this
publication may be reproduced without the written permission of the
copyright owner
ABSTRACT
The wire and arc additive manufacturing (WAAM) is a CNC and welding
deposition based additive manufacturing method. This novel manufacturing
technique has potential cost and environment advantage and was developed as
an ideal alternative for industrial sustainable development.
The aim of this project is to develop a cost and carbon emission model primarily
for the WAAM manufacturing cost (£) calculation and secondly for the WAAM
carbon emission (KgCO2e) estimation, which can be used by the decision
makers and design engineers in product design stage without detailed process
information.
Literature review and an industry survey were carried out first to capture the
overview of this research context and the essential data for cost modelling.
Then the cost breakdown structure (CBS) and cost drivers were determined.
Thereafter, a feature based cost model and detailed cost equations were
developed. A specific Greenhouse Gases (GHG) emission model was also
established which follows the specification of existing carbon footprint
measurement standards.
As part of this project, an integrated software tool was developed by using MS
Visual Basic language. The proposed cost and GHG emission model were
implemented in this software. With the ability of directly capture geometry data
from CAD files and fully automatic calculation, the software tool is efficient and
convenient.
Three case studies were conducted to demonstrate the proposed cost model
and software tool. The comparative cost analyses with other conventional
manufacturing methods were also discussed in these case studies. Finally, the
capacity and reliability of the cost software were validated by experts from
industry and academia. The implementation of the research outcomes of this
project can achieve accurate early cost estimation for WAAM conveniently.
Moreover, it can clarify the cost and environment advantage of WAAM and
assist to identify the most suitable situation for adopting WAAM from a cost and
sustainable point of view.
iii
Keywords: WAAM, cold metal transfer, cost estimation, GHG emission, CATIA
automation.
iv
ACKNOWLEDGEMENTS
I appreciate my supervisors Dr. Jörn Mehnen and Dr. Yuchun Xu greatly for
their supervision and support throughout the period of this project. Without their
suggestions and encouragements, this work would not have been completed.
I also want to register my profound gratitude to many people who gave me
advice and information during my study. They are Dr. Paul Baguley, Dr. Ian
Holman, Dr. Fude Wang, Prof. Stewart Williams, Dr. Helen Lockett, Dr. Jialuo
Ding, Yinka Adebayo, Pedro Almeida.
I would also like to express my gratitude to my colleagues and friends Yun Zhai,
Qingling Liu, Jian Chen, and Yafang Yang for their selfless help and valuable
support.
Special thanks should go to my sponsor COMAC and China Scholarship
Council who made it possible for me to study abroad in England and sponsor
me for my study and living.
My thanks also must extend to my family, parents and wife, for all their love and
consistent understanding during this year.
Thank you all.
Guo Jianing
v
vi
TABLE OF CONTENTS
ABSTRACT .............................................................................................................................................III
ACKNOWLEDGEMENTS ......................................................................................................................... V
TABLE OF CONTENTS ........................................................................................................................... VII
LIST OF FIGURES ....................................................................................................................................XI
LIST OF TABLES .................................................................................................................................. XIII
LIST OF ABBREVIATIONS ..................................................................................................................... XV
1 INTRODUCTION ................................................................................................................................... 1
1.1 BACKGROUND ........................................................................................................................................ 1
1.2 RESEARCH MOTIVATION........................................................................................................................... 3
1.3 PROBLEM STATEMENT ............................................................................................................................. 3
1.4 SCOPE DEFINITION................................................................................................................................... 4
1.5 RESEARCH AIM ....................................................................................................................................... 4
1.6 THESIS STRUCTURE.................................................................................................................................. 5
2 LITERATURE REVIEW ........................................................................................................................... 7
2.1 INTRODUCTION....................................................................................................................................... 7
2.2 WIRE AND ARC ADDITIVE MANUFACTURING ................................................................................................ 8
2.2.1 WAAM process ........................................................................................................................... 8
2.2.2 Materials and features ............................................................................................................. 10
2.3 PRODUCT COST ENGINEERING ................................................................................................................. 13
2.3.1 Cost Engineering ...................................................................................................................... 13
2.3.2 Cost estimating techniques ...................................................................................................... 15
2.3.3 Cost estimating process ........................................................................................................... 17
2.4 ENVIRONMENTAL IMPACT ....................................................................................................................... 19
2.4.1 Global warming........................................................................................................................ 19
2.4.2 Measurement for GHG emission .............................................................................................. 20
2.5 EXISTING RESEARCH ............................................................................................................................... 22
2.6 RESEARCH GAP ANALYSIS ........................................................................................................................ 24
2.7 SUMMARY ........................................................................................................................................... 24
3 RESEARCH AIM, OBJECTIVES AND METHODOLOGY ........................................................................... 26
3.1 INTRODUCTION..................................................................................................................................... 26
3.2 RESEARCH AIM AND OBJECTIVES .............................................................................................................. 26
vii
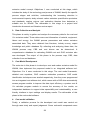
3.3 RESEARCH METHODOLOGY ..................................................................................................................... 27
4 COST MODEL DEVELOPMENT ............................................................................................................ 30
4.1 INTRODUCTION..................................................................................................................................... 30
4.2 THE WAAM PROCESS MAP .................................................................................................................... 30
4.3 COST BREAKDOWN STRUCTURE DEVELOPMENT AND COST DRIVERS IDENTIFICATION ............................................ 31
4.3.1 Cost breakdown structure (CBS) development......................................................................... 31
4.3.2 Cost drivers identification ........................................................................................................ 32
4.4 FEATURE BASED COST MODEL FRAMEWORK ................................................................................................ 32
4.4.1 Feature based cost model concept........................................................................................... 32
4.4.2 Feature based cost assessment process................................................................................... 33
4.5 IDENTIFY THE WAAM FEATURES ............................................................................................................. 35
4.6 COST MODEL EQUATIONS DEVELOPMENT ................................................................................................... 39
4.6.1 Build rate .................................................................................................................................. 39
4.6.2 Buy-to-Fly ratio ........................................................................................................................ 40
4.6.3 Welding Deposition cost rate ................................................................................................... 42
4.6.4 Substrate cost .......................................................................................................................... 45
4.6.5 Setup cost ................................................................................................................................. 46
4.6.6 Integrated machining cost ....................................................................................................... 47
5 CARBON EMISSION MODEL DEVELOPMENT ...................................................................................... 48
5.1 INTRODUCTION..................................................................................................................................... 48
5.2 THE WAAM CARBON EMISSION ASSESSMENT ............................................................................................ 48
5.2.1 Scoping ..................................................................................................................................... 48
5.2.2 Data collection ......................................................................................................................... 52
5.2.3 GHG Footprint calculation........................................................................................................ 53
6 INTEGRATED COST AND CARBON EMISSION SOFTWARE TOOL ......................................................... 54
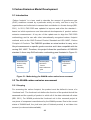
6.1 INTRODUCTION..................................................................................................................................... 54
6.2 SOFTWARE STRUCTURE AND FLOW CHART .................................................................................................. 54
6.3 SOFTWARE DEVELOPMENT ..................................................................................................................... 56
6.3.1 Automatically identify CAD models .......................................................................................... 56
6.3.2 Data base design ...................................................................................................................... 59
6.3.3 Graphic user interface .............................................................................................................. 60
7 CASE STUDY AND MODEL VALIDATION ............................................................................................. 63
7.1 CASE STUDY TO DEMONSTRATE THE APPLICATION OF THE INTEGRATED COST SOFTWARE TOOL .............................. 63
7.2 CASE STUDY OF REAL-WORLD COMPONENTS ............................................................................................... 67
viii
7.2.1 Real-world Case 1, an aluminium part from automotive industry ........................................... 67
7.2.2 Real-world Case 2, a titanium part from aerospace industry .................................................. 73
7.3 INTERACTIVE SESSION AND EXPERTS JUDGEMENTS........................................................................................ 77
8 DISCUSSION AND CONCLUSIONS....................................................................................................... 80
8.1 DISCUSSION OF RESEARCH FINDINGS ......................................................................................................... 80
8.1.1 Literature review ...................................................................................................................... 80
8.1.2 Industry survey ......................................................................................................................... 80
8.1.3 Model development ................................................................................................................. 81
8.1.4 Software tool design ................................................................................................................ 81
8.1.5 Case study and validation ........................................................................................................ 82
8.2 RESEARCH CONTRIBUTIONS ..................................................................................................................... 83
8.3 RESEARCH LIMITATIONS.......................................................................................................................... 83
8.4 FUTURE WORK...................................................................................................................................... 84
8.5 CONCLUSIONS ...................................................................................................................................... 85
REFERENCES ......................................................................................................................................... 87
APPENDICES......................................................................................................................................... 92
APPENDIX A INDUSTRY SURVEY QUESTIONNAIRE .............................................................................................. 92
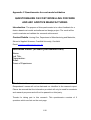
APPENDIX B SOFTWARE USER MANUAL ........................................................................................................ 100
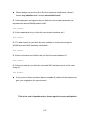
APPENDIX C QUESTIONNAIRE FOR COST MODEL VALIDATION ............................................................................. 106
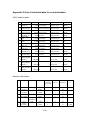
APPENDIX D LIST OF COLLECTED DATA FOR COST ESTIMATION ............................................................................ 108
ix
x
LIST OF FIGURES
Figure 1.1: Several different AM techniques (Levy, 2003) .................................. 1
Figure 1.2: Basic WAAM process structure ........................................................ 3
Figure 2.1: Literature review structure ................................................................ 7
Figure 2.2: The basic principles of WAAM (Deherka, 2010) ............................... 8
Figure 2.3: Layer deposition process of WAAM (Mehnen et al., 2010) .............. 8
Figure 2.4: Products manufactured by WAAM ................................................... 9
Figure 2.5: The WAAM design-manufacturing process (Mehnen et al., 2010) ... 9
Figure 2.6: Process behaviour during a CMT weld cycle (Deherka, 2010)....... 11
Figure 2.7: Different features deposited by WAAM .......................................... 12
Figure 2.8: Cost Commitment Curve (Roy, 2003) ............................................ 14
Figure 2.9: The Freiman curve (Asiedu, 1998) ................................................. 15
Figure 2.10: Classification of the PCE techniques (Niazi et al., 2006).............. 16
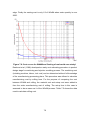
Figure 2.11: Cost estimation process (2008 NASA Cost Estimating Handbook)
.................................................................................................................. 18
Figure 2.12: Global GHG emission by sector (Khangura, 2010) ...................... 19
Figure 2.13: Five steps to calculating the carbon footprint (Guide to PAS 2050,
2008) ......................................................................................................... 21
Figure 3.1: Research methodology .................................................................. 29
Figure 4.1: The WAAM process map for cost modelling .................................. 31
Figure 4.2: The WAAM cost breakdown structure ............................................ 31
Figure 4.3: The WAAM cost drivers .................................................................. 32
Figure 4.4: The WAAM feature taxonomy (Kazanas, 2011) ............................. 36
Figure 4.5: Definition of wall deposition angle θ ............................................... 37
Figure 4.6: Various kinds of vertical walls ........................................................ 37
Figure 4.7: Inclined wall and horizontal wall ..................................................... 38
Figure 4.8 Factors influencing the buy-to-fly ratio............................................. 40
Figure 5.1: Methodology for WAAM carbon emission assessment .................. 48
Figure 5.2: Process map stages for business-to-business goods (PAS2050) .. 49
Figure 5.3: The WAAM process map for GHG assessment ............................. 49
Figure 5.4: Different types of carbon emission assessment (PAS2050)........... 50
xi
Figure 5.5: List of all included activities and processes for GHG emission
assessment (system boundary) ................................................................ 51
Figure 6.1: The structure of cost software ........................................................ 54
Figure 6.2: Software flow chart ......................................................................... 55
Figure 6.3: The Infrastructure of CATIA Part Document Automation Objects
(CATIA V5 automation) ............................................................................. 57
Figure 6.4: Sketch-based features in CATIA .................................................... 58
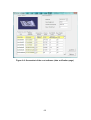
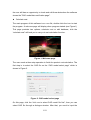
Figure 6.5: Graphic user interface windows of the cost software ..................... 60
Figure 6.6: Screenshot of the cost software (data verification page) ................ 62
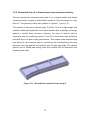
Figure 7.1: 3D CAD model of the first case study part ..................................... 63
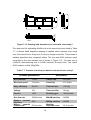
Figure 7.2: 2D drawing with measurements ..................................................... 63
Figure 7.3: Part setting for first case study ....................................................... 64
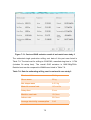
Figure 7.4: Features and geometry data for first case study ............................ 65
Figure 7.5: Cost and GHG emission result of the first case study .................... 66
Figure 7.6: 3D model for real-world case study 1 ............................................. 67
Figure 7.7: 2D drawing with dimensions of real-world case study 1 ................. 67
Figure 7.8: Cost curves for WAAM and Casting of real-world case study 1 ..... 70
Figure 7.9: Comparative manufacturing time between WAAM and Milling in realworld case study 1 .................................................................................... 72
Figure 7.10: Cost by WAAM and by Milling of real-world case study 1 ............ 72
Figure 7.11: 3D model for real-world case study 2 ........................................... 73
Figure 7.12: Drawing with dimensions of real-world case study 2 .................... 74
Figure 7.13: Cost and GHG emission result of real-world case study 2 ........... 75
Figure 7.14: Cost by WAAM and by Milling of real-world case study 2 ............ 76
Figure 7.15: GHG comparison between WAAM and Milling ............................. 77
Figure 7.16: The background of the validation session attendees.................... 78
Figure 7.17: Cost model validation result ......................................................... 78
xii
LIST OF TABLES
Table 2.1: WAAM materials and features ......................................................... 13
Table 2.2: The PCE techniques_ advantages and limitations (Niazi et al., 2006)
.................................................................................................................. 17
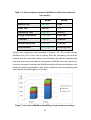
Table 2.3: Greenhouse gas conversion rates (IPCC, 2001) ............................. 20
Table 4.1: The WAAM features in this cost model............................................ 36
Table 4.2: Manufacturing Parameters Encapsulated in Features ..................... 38
Table 4.3: The shielding gas requirements for different materials .................... 45
Table 5.1: Data collection plan for the WAAM GHG emission assessment: ..... 52
Table 5.2: Carbon emission factors of WAAM .................................................. 53
Table 6.1: The name and contents of database table ...................................... 59
Table 7.1: Process and unit price data for first case study part ........................ 64
Table 7.2: Process and unit price data for real-world case study1 .................. 68
Table 7.3: Cost and GHG emission result of real-world case study 1 .............. 68
Table 7.4: Casting cost detail of real-world case study 1 ................................. 69
Table 7.5: Data for estimating milling cost in real-world case study 1 .............. 71
Table 7.6: Cost comparison between WAAM and milling for real-world case
study 1....................................................................................................... 71
Table 7.7: Process and unit price data for real-world case study2 ................... 74
Table 7.8: Data for estimating milling cost in real-world case study 2 .............. 75
Table 7.9: Cost comparison between WAAM and milling for real-world case
study 2....................................................................................................... 76
xiii
xiv
LIST OF ABBREVIATIONS
AM
Additive Manufacturing
ALM
Additive Layer Manufacturing
API
Application Programming Interface
ADO
ActiveX Data Objects
B2B
Business to Business
CAD
Computer-aided design
CBR
Case-based Reasoning
CFP
Carbon Footprint
CMT
Cold Metal Transfer
CNC
Computer Numerical Control
DIS
Draft International Standard
DAO
Data Access Objects
FBC
Feature Based Costing
FEM
Finite Element Method
GHG
Greenhouse Gases
GTAW
Gas Tungsten Arc Welding
GMAW
Gas Metal Arc Welding
GWP
Global Warming Potential
ICE
Inventory of Carbon & Energy
IPCC
Intergovernmental Panel on Climate Change
PAS
Publically Available specification
PCE
Product Cost Engineering
PE
Parametric Estimating
RUAM
Ready to Use Additive Manufacturing
SLS
Selective Laser Sintering
SQL
Structures Query Language
UNFCCC
United Nations Framework Convention on Climate Change
VB
Visual Basic
WAAM
Wire and Arc Additive Manufacturing
xv
xvi
1 Introduction
1.1 Background
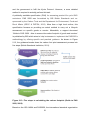
Additive manufacturing (AM), also called additive layer manufacturing (ALM),
can be defined as the process of joining materials to make products from CAD
model data, usually layer upon layer, which is opposed to subtractive
manufacturing methodologies, such as conventional machining. This technique
started in the late 80's with Stereo lithography. Since then, many new methods
have been invented and commercialised (Levy et al., 2003).
Figure 1.1: Several different AM techniques (Levy, 2003)
Due to the fierce competition in the changing markets today, ‘Time to market’
becomes a key point of success for companies and this is the original driving
force behind the progress of additive manufacturing technique. From Wohlers
(2010), the AM techniques have experienced more than two decades of
research and development, now additive manufacturing progresses have had a
significant impact on design and manufacturing. In the future, most of the
manufacturing companies would produce half of their products by this process.
The aerospace industry is a vital sector embracing additive manufacturing, as
this process can realise massive savings of expensive material, give design
1
freedom and manufacture more complex components easily. According to
Wilson (2010), the ALM technique can save $300 billion for the aircraft
manufacturing industries alone. Other savings includes avoiding large amounts
of investments that have to be made in conventional manufacturing for making
aluminium or titanium billet, heat-treating, rolling, reheating, cutting up, etc.
Nowadays, some important applications of ALM in the aerospace industry
include ducts to cool down the wings of A380, thin walled structures in turbine
blades, etc. (Nathan and Excell, 2010).
In the early stage of ALM progress, limited to the material (usually plastic) that is
being used, the parts generated by ALM are usually not strong enough to be
directly used as a final product. Therefore, ALM is also referred to as rapid
prototyping technologies. However, between the scientific push and industrial
pull, a project named: “Ready to Use Additive Manufacturing” (RUAM) was
developed and takes the ALM technology one step further. RUAM is the name of
an IMRC/EPSRC research project at Cranfield (finished December 2010) which
implemented a novel ALM approach which combined welding deposition and
conventional machining process together. It can fabricate metallic parts with
precise net shape quality that can be used directly for the entire product life cycle.
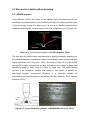
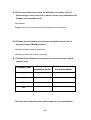
After several years of development, now this new ALM technique was named as
Wire and Arc Additive Manufacturing (WAAM) which is currently attracting
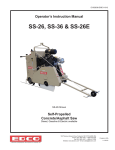
widespread attention from industry (Figure 1.2). From Mehnen et al., (2010),
WAAM is a new, sustainable, cost and time efficient manufacturing process
which makes use of well established and advanced cutting-edge technology.
Parts are deposited layer by layer by means of metal wire welding process. The
welding torch is guided by a 6 axis Robot, making the manufacturing process
effective and flexible. These wire and arc welding based technologies provide a
new approach to fabricate ready-to-use large (up to several metres) metal parts.
By using new welding technologies such as cold metal transfer (CMT) or Inter
pulse welding it is possible to obtain more than 10 times faster deposition rate
than selective laser sintering (SLS) technologies. WAAM is also dedicated to
integrating additive layer manufacturing and traditional machining into one single
machine to provide accurate net shape with high produce efficiency. This
technology shows a wide application prospect, especially in aerospace and
automotive industry.
2
Design CAD model
and slice it into
layers
Deposition by
robot controlled
welding equipment
Final metal
products
Figure 1.2: Basic WAAM process structure
1.2 Research Motivation
In the increasingly competitive global market, the cost, quality and novelty of
products plays a critical role for a manufacturing company’s success. Customers
always require higher quality with an ever-decreasing cost (Roy, 2003).
Therefore, cost estimation and reduction are paramount for any manufacturing
activity as it directly influences the strategic “go” or “no go” decisions made by a
company (Shettigar, 2010). Meanwhile, with the improvement of public
environmental awareness, the environmental impact of manufacturing process is
becoming increasingly concerned. In Europe, some mechanisms such as carbon
emission trading are also established by governments to control the climate
change. The environmental impact now is becoming an important criterion for
new manufacturing techniques. However, as a developing cutting edge
manufacturing technology, it is noteworthy that little research has been done on
WAAM cost and carbon emission assessment.
1.3 Problem Statement
Although theoretically the WAAM technique offers many benefits such as saving
material, reducing fabrication time, etc. A reliable cost model is still demanded to
quantitatively
verify
these
advantages.
However,
due
to
the
unique
manufacturing process it involves, the existing cost model cannot be directly
used for WAAM. The shortage of accurate product cost data leads to the
customers do not confident enough to take WAAM as their alternatives, so the
large scale application of WAAM is still limited. Meanwhile, the development of
3
WAAM technique itself also needs product cost data as a reference to identify its
improvement direction. Although some researches about cost of WAAM were
carried out in recent years, the requirement of WAAM cost modelling is still not
be satisfied. Hence, developing an integrated cost model for WAAM which can
be used to assess both manufacturing cost and environmental impact is
necessary and valuable for the further development and application of WAAM.
1.4 Scope definition
The scope definition aims to define aspects of the project which may have been
ambiguous, and to ensure delivering a quality solution in line with the original
research requirement. The scope consideration is based on the time, resources
and knowledge available for this project.
In Scope
This research project will focus in the following areas:
product manufacturing cost of the WAAM components
cradle-to-gate GHG emissions during WAAM process
Integrated cost software tool development
Case study
Out of Scope
These following points are not included in this research project:
Indirect cost of WAAM components (e.g. administration cost, factory
facilities cost, taxes, premium etc.)
Quality inspection cost
Full life cycle cost of the WAAM components
Other pollutants to environment except GHG
1.5 Research Aim
The aim of this project is to develop a cost and carbon emission model primarily
for the WAAM manufacturing cost (£) calculation and secondly for the WAAM
carbon emission (KgCO2e) estimation, which can be used by the decision
makers and design engineers in product design stage without detailed process
information.
4
1.6 Thesis Structure
This thesis consists of eight chapters, the order and contents are explained as
follows:
Chapter 1- Introduction: the context of this research was presented in this
chapter. The aim of this research was determined through the problem
statement. The overall structure of this thesis was also introduced at the end of
this chapter.
Chapter 2- Literature Review: A critical literature review which covers the major
areas of WAAM, cost and environmental impact was carried out by the author to
assist in obtaining the fundamental knowledge related to the research subject.
The research gaps was also discussed and identified after the literature review.
Chapter 3- Research Aim, Objectives and Methodology: The objectives for
satisfying the overall research aim were determined and presented. A detailed
illustration of the adopted research methodology was also included in this
chapter.
Chapter 4- Cost Model Development: The author first identified the WAAM
process map and the cost breakdown structure, and then determined the
manufacturing features and the cost model framework. Finally detailed cost
equations were developed and presented in this chapter.
Chapter 5- Carbon Emission Model Development: This chapter presented the
adopted methodology, mapped out the carbon emission associated activities,
identified system boundary, determined the data source and developed a
specific GHG estimation procedure for WAAM.
Chapter 6- Integrated cost Software tool Development: The author explained
the structure and function of the software. The key technologies for developing
this integrated cost software tool were also presented in this chapter.
Chapter 7- Case Study and Cost Model Validation: This chapter presented
how the integrated cost software works by apply it on three case studies. The
cost comparison with other manufacturing methods was also discussed in these
case studies. Then the applicability and accuracy of the integrated software tool
was validated by expert judgements.
5
Chapter 8- Discussion and conclusions: The findings, contributions,
limitations of this research project were discussed first, and then the overall
conclusions of the research were made in this chapter.
6
2 Literature Review
2.1 Introduction
In order to gain the fundamental knowledge related to the research subject, and
help to conduct this project successfully, a literature review which covers the
major topics and areas of WAAM, cost and environmental impact was carried out
in this chapter.
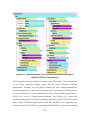
The literature review presented in this chapter was divided into several sections
(Figure 2.1). The contexts of WAAM, cost engineering and environmental impact
were studied respectively from section 2 to 4. Section5 discussed some existing
research in this area. Moreover, the research gaps were analyzed and presented
in the last section.
Figure 2.1: Literature review structure
7
2.2 Wire and Arc Additive Manufacturing
2.2.1 WAAM process
From Deherka (2010), the ready to use additive layer manufacturing can be
classified into powder based or wire based on the way of feeding materials. Both
of the processes consist of a heat source, a source for feeding material and a
substrate which may be used as a part of the final component or not (Figure 2.2).
Figure 2.2: The basic principles of WAAM (Deherka, 2010)
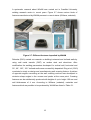
The wire and arc additive layer manufacturing is gaining increasing popularity as
the process allows to manufacture larger custom-made metal components with
higher deposition rate ( Ding, et al., 2011). As shown in Figure 2.3, in the WAAM
process 3D metallic components are built by feeding wire metallic material and
depositing beads of weld metal in a layer by layer way. The entire WAAM
process is an innovative concept that opens a vast space of options for
fabricating complex components efficiently. It is especially suitable for
manufacturing or repairing parts in aerospace industry. (Mehnen, Ding, Lockett,
Kazanas, 2010).
Figure 2.3: Layer deposition process of WAAM (Mehnen et al., 2010)
8
According to Mehnen (2008), compare to conventional metal rapid prototyping
methods like laser powder welding the WAAM process can yield solid products
with cast like features and obtain over 10 times faster deposition rate than SLS.
Mehnen et al. (2010) also point out that by integrating welding deposition
process with grinding process in one machine and using of new welding
technologies such as CMT (Cold Metal Transfer) or Inter pulse Welding, the
WAAM technique can be used to manufacturing high quality components with
precisely defined surface geometries as well.
Figure 2.4: Products manufactured by WAAM
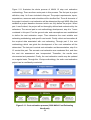
As a cutting-edge manufacturing technique, the WAAM provides a new,
sustainable, cost and time efficient manufacturing process which utilizes full
power of additive layer manufacture technique combined with the designoptimize and conventional machining process together. Each phase of the
overall process can be linked optimally in order to achieve the best effect. The
general structure of the overall WAAM design-manufacturing process is shown in
Figure 2.5 (Mehnen, Ding, Lockett, Kazanas, 2010).
Figure 2.5: The WAAM design-manufacturing process (Mehnen et al., 2010)
9
In the design for WAAM phase, component is designed by CAD software, and
then the temperature and stress properties during welding deposition will be
analyzed by finite element method (FEM), the most appropriate welding tool
paths will be identified and this helps to minimizing distortions of the WAAM
products (Mehnen, Ding, Lockett, Kazanas, 2010).
A robot path generation program RUAMROB© was developed for the WAAM
project. This soft ware tool consists of two main modules: a slicing module and a
robot program generation module. From Ding et al., (2010), “By executing these
two modules automatically, the program can slice the designed ALM parts and
generate the ready-to-use path code for a Fanuc robot in one go. A user-friendly
interface for RUAMROB© has also been developed to simplify the setting of
parameters”.
In the actual deposition Process, the welding tracks are executed by a robotic
system. A robot arm guides the welding torch along the optimized tool path. The
specific welding techniques for depositing may vary depending on material and
features of components (Williams, undated).
The integrated process aims to combine ALM and traditional machining such as
grinding, milling and rolling into one machine to form continuous process. This
integrated process helps to obtain final precise net shape with low cost and high
efficiency (Mehnen et al., 2010) (Kashoob, 2011).
2.2.2 Materials and features
After more than ten years development, the WAAM technique has made a
significant progress (Williams, undated). Modern welding and automation
technologies provide opportunities that were not available in the past. Now
WAAM can be used to deposit a variety of materials and features of real world
workpieces that can be welded, such as steel, Ni alloys, and even highly reactive
metallic e.g. Ti alloys in an out-of-chamber environment (Ding, et al., 2011).
The welding technique adopted by WAAM depends on the specific material and
geometry feature to be manufactured. Standard wire based welding processes
such as Gas Metal Arc Welding (GMAW) and Gas Tungsten Arc Welding
(GTAW) are widely adopted as heat sources due to their low cost, high
deposition rate and widespread Suitability for various kinds of metals as well
10
(Ding, et al., 2011). Other welding strategies adopted by WAAM include plasma
and laser welding techniques (Williams, undated).
Martina (2010) adopted plasma wire deposition with WAAM to manufacture Ti6Al-4V structures – a kind of advanced material widely used in aerospace
industry. Furthermore, Leinonen (2011), using Cu97Si3 wire deposited on steel
by CMT welding, this verified that mixed material component also can be well
formed by WAAM.
Among all the welding techniques, the GMAW process has been successfully
used with a variety of materials in WAAM such as titanium, stainless steel, and
aluminium (Leinonen, 2011). Especially the CMT (a variant of GMAW) based
WAAM process is believed to have most of the advantages such as wide range
of thickness, uniform bead profile, low heat input, higher deposition rate with
medium distortion and ease in integrating with a robotic system. Therefore, it is
also very attractive for the aerospace industry applications (Deherka, 2010)
(Singh, 2010).
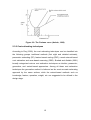
Figure 2.6: Process behaviour during a CMT weld cycle (Deherka, 2010)
In the cold metal transfer process, the motion of the wire is incorporated into the
process control. The wire will be retracted when a short circuit is detected to aid
droplet detachment, the power supply will be paused as well. Figure 2.6
illustrates the CMT process during a welding cycle (Leinonen, 2011). The feedretract frequency is up to 70 times per second. The CMT process comes with a
more stable arc than general GMAW methods, as the arc length can be
mechanically adjusted by wire feeding system; and significantly less heat supply
to the metals when weld bead is deposited. This helps to result in spatter free,
energy saving and also less distortion for workpieces (Shettigar, 2010).
11
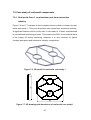
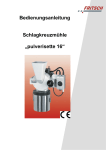
A systematic research about WAAM was carried out in Cranfield University
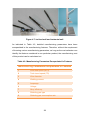
welding research centre in recent years. Figure 2.7 shows various kinds of
features manufactured by WAAM process in current status (Williams, undated).
Figure 2.7: Different features deposited by WAAM
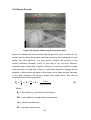
Deherka (2010) carried out research on building horizontal and inclined walls by
using cold metal transfer (CMT) on carbon steel and aluminium. After
modification the welding parameters developed for vertical wall, horizontal and
30°, 60°, 120°, 150 °inclined walls were successfully deposited. Ding et al. (2010)
conducted a study on design and manufacturing wall crossing feature. A pattern
of opposite angles connecting at the wall crossing vertices was developed to
minimize sharp angles in the corners and peaks at the cross point. Crossing
features can be satisfactorily produced with heights of up to height 100 mm and
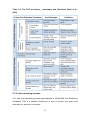
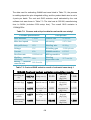
wall thicknesses of 4 mm. According to Williams (undated), materials and
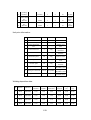
features which are possible to be produced by WAAM are listed in Table 2.1.
12
Table 2.1: WAAM materials and features
Materials
Titanium Alloys
Aluminum
alloys
Steel alloys
Copper Alloys
-----
Features
Ti6Al4V
Al/Si
Al/Cu
Al/Cu/Zn
Low strength
Cu/Si
-----
Walls
Intersections
Enclosure
Vertical
Inclined
Horizontal
Curved
Linear
Curved
Linear
Curved
2.3 Product Cost Engineering
2.3.1 Cost Engineering
According to Humphreys (2005), cost is regarding the amount of money
expended or liability incurred with delivery of products and/or services. And from
the perspective of total cost management, it should cover any expenditure of
time, human, and physical resources.
From Asiedu (1998), the cost, quality and novelty of products can significantly
influence the success of a company on the increasingly competitive global
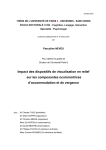
market. Furthermore, Roy (2003) pointed out that within today’s highly
competitive market place, customers require higher quality with an everdecreasing cost. Therefore, cost reduction initiatives are essential for every
company to survive and compete successfully. Cost estimation is perhaps the
paramount factor in the outcome of a product or service for today’s industries.
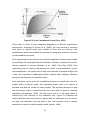
As shown in Figure 2.8, it is believed that over 70 percent of the total cost would
be fixed in the conceptual design stage; although in that stage itself the incurred
cost may have attributes less than 10 percent of the total cost (Roy, 2003).
Hence, it is obvious that the concept to carry out precise cost analysis at a very
early stage is important for the deduction of overall product cost.
13
Figure 2.8: Cost Commitment Curve (Roy, 2003)
There exist a variety of cost categories depending on different classification
perspectives. According to Curran, et al. (2004), the non-recurring or recurring
cost, direct or indirect costs, and variable or fixed cost are common cost
classifications which can facilitate the process of arranging a product’s costs into
a cost breakdown structure.
Cost engineering can be defined as a scientific application which mainly studies
the principles and techniques that are utilized to estimate or analyse the cost for
delivery products or services (Stewart, et al., 1995). From Roy (2003), Cost
engineering aims to identify and process the issues in cost estimation, control
and management. It is mainly used to help cost estimator to analyse budget, and
it also very important in supporting decision makers make strategic decisions
during the development of a specific project.
Cost estimation can be seen as a predicting process to quantify the cost of a
subject within a defined scope. Any estimated project cost is an opinion of
probable cost and will not be an exact number. The accuracy depends on how
well the project scope is defined and the time and effort is spend in estimate
preparation (Humphreys, 2005). The final exact cost to a very large extent is
influenced by the accuracy of the estimated cost, Figure 2.9 indicates the
relation between the actual cost of a project and the estimated cost, too low or
too high cost estimation will both lead to final cost increase. Only a realistic
estimate can results in satisfied project costs (Asiedu, 1998).
14
Figure 2.9: The Freiman curve (Asiedu, 1998)
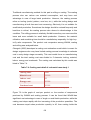
2.3.2 Cost estimating techniques
According to Roy (2003), the cost estimating techniques can be classified into
the following groups: traditional methods (first sight and detailed estimate),
parametric estimating (PE), feature based costing (FBC), neural network based
cost estimation and case-based reasoning (CBR). Shehab and Abdalla (2001)
broadly categorized various cost estimation techniques as intuitive, parametric,
generative, and variant-based approaches. Among all these cost estimation
techniques the generative method is believed as the most accurate estimating
approach by the same authors, while the variant-based methods such as
knowledge, feature, operation, weight, etc. are suggested to be utilized in the
design stage.
15
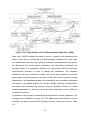
Figure 2.10: Classification of the PCE techniques (Niazi et al., 2006)
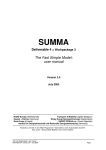
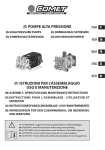
Niazi et al., (2006) reviewed the state of the art in product cost estimation area
which covers various techniques and methodologies developed over the years
and divided them into two major groups: qualitative and quantitative techniques.
As defined by the same author, qualitative cost estimation techniques are
primarily based on a comparison analysis of a new product with the previously
manufactured products in order to identify the similarities. The identified
similarities will help to estimate reliable cost for the new product by using the
past design and manufacturing cost data. On the other hand, instead of simply
depending on the experimental data, the quantitative cost estimation techniques
are based on a detailed analysis of a product design, features, and fabrication
processes, then calculate the cost by using an analytical function of certain
product parameters or summing up the product elementary units of different
consumed resources.
Furthermore, each group is hierarchically subdivided into various categories. The
categories are illustrated in Figure 2.10. The advantages and limitations of each
technique are also summarized by the same authors, which are shown in Table
2.2.
16
Table 2.2: The PCE techniques_ advantages and limitations (Niazi et al.,
2006)
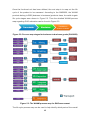
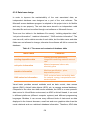
2.3.3 Cost estimating process
A 12 step cost estimating process was proposed in 2008 NASA Cost Estimating
Handbook. This is a detailed introduction of how to conduct the entire cost
estimation for products or services.
17
Figure 2.11 illustrates the whole process of NASA 12 step cost estimation
methodology. There are three main parts in this process. The first part is project
definition, step 1 to 3 were included in this part. The project requirements, inputs,
expectations, resources and schedules will be clarified first. Then all elements of
the project involved in cost estimation will be determined through WBS. After that,
establish a project baseline document which can fully define the project. When
part 1 was finished, the project will be thoroughly defined and understood by the
estimators. The second part is cost methodology development, step 4 to 7 were
contained in this part. First the ground rules and assumptions were established
to define the cost estimation scope. Then determine the most suitable cost
estimating methodology and specific cost model. Finally collect and normalize all
the required data associated with cost estimating. Through part 2, the cost
methodology which can guide the development of the cost estimation will be
determined. The last part is actual cost estimation and documentation, step 8 to
12 consist this part. The accurate cost estimation was conducted first, and then
the cost risk assessment was incorporated. Thereafter, the results were
documented and presented. Finally, the cost estimation results may be updated
on a regular basis. Through this 12 step methodology, the entire cost estimation
project can be confidently conducted.
Figure 2.11: Cost estimation process (2008 NASA Cost Estimating
Handbook)
18
2.4 Environmental impact
2.4.1 Global warming
Over the 20th century, the global average temperature has increased by
approximately 0.6 °C, this phenomenon of climate change is well known as
“global warming”. A common view is that the current global warming rate will
continue or even accelerate (Root, 2003).
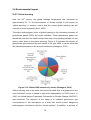
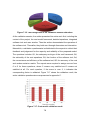
The major anthropogenic factor of global warming is the increasing emission of
greenhouse gases (GHG) by human activities. These greenhouse gases can
absorb the heat from the earth’s surface and stop it from passing straight out into
space, which leads to the planet warming. Figure 2.12 indicates the amount of
greenhouse gas emissions by each sector in the year 2000, it can be seen that
the industrial processes is the second contribution (Khangura, 2010).
Figure 2.12: Global GHG emission by sector (Khangura, 2010)
Global warming now is an issue that should be dealt with at a global level and
each individual country is asked to take their responsibility for GHG control. In
1992, the United Nations Framework Convention on Climate Change (UNFCCC)
was produced. The objective of the treaty is to “stabilise greenhouse gas
concentrations in the atmosphere at a level that would prevent dangerous
anthropogenic interference with the climate system”. In addition, a protocol of
19
UNFCCC named Kyoto Protocol is signed in 1997 and officially enforced in 2005.
In this protocol, 37 industrialised countries commit to reduce their greenhouse
gas emissions by 5.2% on average for the period 2008-2012, relative to the base
year 1990. Some mechanisms such as carbon emission trading was also
established which aim to assist countries to achieve the targets set by the
agreement.
2.4.2 Measurement for GHG emission
The unit used to measure GHG emission is tons of carbon dioxide, Other GHGs
are converted to this measurement according to their global warming potential
(GWP). From the intergovernmental panel on climate change assessment report
(IPCC, 2001), the conversion rate of each GHG into CO2 unit is shown in Table
2.3. Meanwhile, a term ‘carbon footprint’ is used to describe the amount of GHG
emissions caused by a particular activity or entity.
Table 2.3: Greenhouse gas conversion rates (IPCC, 2001)
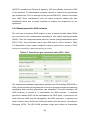
The international standard organization published an ISO standard ISO14064 in
2006, which provides an integrated set of tools for programs aimed at measuring,
quantifying and reducing greenhouse gas emissions. From this standard, the
GHG inventory is formed of 3 components: the GHG sources - a physical
process to release GHG into the atmosphere; the GHG sinks - a process or unit
which removes GHG from the atmosphere; the GHG reservoirs - a physical unit
which is able to store GHG from GHG sinks and/or from the source. According to
Khangura (2010), The ISO 14064 provides a high level outline for businesses
20
and the government to fulfil the Kyoto Protocol. However, a more detailed
method is required to actually perform this task.
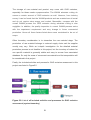
A publically available specification (PAS) for assessing product life cycle GHG
emissions: PAS 2050 was formulated by BSI British Standards and cosponsored by the Carbon Trust and the Department for Environment, Food and
Rural Affairs (DECC & DEFRA, 2012). More than a high level outline, this
specification focuses on providing an actual method to carry out a lifecycle
assessment on specific goods or service. Meanwhile, a support document
‘Guide to PAS: 2050 - How to assess the carbon footprint of goods and services’
is published by BSI which aims to help businesses to implement the PAS2050’s
methodology by offering specific and practical guidance. As shown in Figure
2.13, the guidance breaks down the carbon foot print assessment process into
five steps (British Standards Institution, 2011).
Figure 2.13: Five steps to calculating the carbon footprint (Guide to PAS
2050, 2008)
Based on the ISO 14064 and PAS2050, the international standard organization
21
also intends to publish a more specific standard – ISO14067. This new
International Standard will detail the principles, requirements and guidelines for
the quantification and communication of the carbon footprint of goods and
services (CFPs). In this standard the GHG emissions and removals of a product
are based on a life-cycle assessment, meanwhile, requirements and guidelines
for the quantification and communication of a partial carbon footprint of products
(partial CFP) are also provided. The DIS (draft international standard) version
was published on 6th January 2012. However, the final version is still not
available.
2.5 Existing research
A number of journals and articles regarding feature based cost estimating can be
found while literature which focused on cost estimation of ALM techniques is
limited in number. Some of them are listed and reviewed below.
Ou-Yang and Lin (1997) proposed a feature based model to estimate the
manufacturing cost of the machining products. The geometrical shape and
product precision are specified for its features. This feature based model tool
aims to provide designers who are not familiar with various manufacturing
process as an initial estimate of the manufacturing costs associated with their
design during the design stage. The limitation of this model is that it is designed
only for traditional manufacturing techniques.
Jung (2002) developed a feature based cost estimation model for various
machining processes. By classifying various machining activities into 4 basic
categories, this model is able to accurately and rapidly handle cost estimate for
infinite shapes combined with these features. In this model, machining features
are classified into turning, face milling, end milling, drilling/reaming operations,
and then further subdivided into a number of activities. Each specific activity’s
operation time can be calculated then summed up to estimate the total cost.
Tipaji, et al. (2008) developed a cost estimation model which is based on the
weld features of MIG welded joints. The model can estimate the cost of forty two
different joints. The calculated results by this cost model had been compared
with an expert welder’s quotation and got validated. The MIG welding technique
is also presently used by WAAM technology.
22
Chayouki, et al. (2009) designed a software tool “COSTWELD” by using Visual
Basic. This is a feature based cost estimation tool for weld assemblies. Two
concepts of features: preparation feature and welding feature are presented in
this model. By editing the independent feature and cost database, the cost
model
is flexible enough to incorporate new process and adjust the equations
for different application.
Karunakaran, et al. (2010) presented a hybrid layered manufacturing process
named ArcHLM, which is a new type of ALM technology developed by IIT
Bombay. A manufacturing time and cost case study was carried out as well, from
this study, it is believed that the ArcHLM technology is both time efficient and
cheaper than conventional CNC machining.
Allen (2006) published a report which compared the costs of AM and machining
in aerospace industry. The Buy-to-Fly ratio (compare the size of the original billet
to that of the finished part) is used as a key factor to compare the economy of
both techniques. The develop trend of AM technology is also predicted in this
report. As a conclusion, the author believes that AM technique is commercially
viable for components with a buy-to-fly ratio of about 12:1. In the future, with the
increasing deposition rate, the specific cost of AM will drop and a buy-to-fly ratio
of about 3 is economical enough to be manufactured by AM.
Khangura (2010) studied the cost and environmental aspects of RUAM. An
integrated process in assessing the carbon footprint and cost for RUAM is
developed by this author. After carrying out a case study, the author believes
RUAM has the potential to provide a huge cost saving with minimum wastage
and carbon emission as well. The shortcoming of this model is it inclined to be
more high level and not precise enough.
Shettigar (2010) developed a feature based cost model for RUAM. According to
this author, it is the first time to adopt feature based method on WAAM cost
estimation. Meanwhile, A Visual Basic Software programme called RUAM Cost
Weld has been coded by the same author. A detailed case study including a
benchmark simple structure and a complex large real-world structure was carried
out to validate the software. The economy of WAAM was also discussed by
comparing it with traditional manufacturing techniques. Although it is a significant
progress on WAAM cost estimate, but there are still some limitations. Firstly, this
23
model can only handle a few features and materials; secondly, the data input
and sum of the results are time consuming, especially when analysing complex
components; finally, the accuracy could be further improved by considering more
process details.
2.6 Research gap analysis
It can be seen from the literature review that the cost estimation methodologies
are well developed and now widely used for various product cost analysis. Many
of them can be applied at early design phase. However, cost model for additive
manufacturing process is limited in number. A few existing cost models are
limited by applicability, efficiency and accuracy. Until now, little research effort
has been done in WAAM cost modelling area which aims to develop an accurate
systematic cost estimation procedure supported by mathematic equations and
then utilize it to carry out WAAM cost assessment. Such a dedicated cost and
carbon emission model for WAAM is still not available.
To the best knowledge of the author, a comprehensive cost and carbon emission
assessment tool for WAAM process which concentrates on providing accurate
and efficient cost estimation in product design stage is not available. Hence it is
essential to overcome this knowledge gap by developing a dedicated WAAM
cost and carbon emission model and then implementing it in a practical software
tool.
2.7 Summary
A detailed literature review which covers the major topics and areas of WAAM,
cost and environmental impact was presented in this chapter. The manufacturing
process of WAAM, the categories of material and features can be manufactured
by WAAM were explored first, then the cost engineering concepts, various cost
estimating techniques, the global warming context, and existing GHG emission
quantification standards were reviewed.
In this chapter, the author also discussed the existing research regarding this
topic. It was identified that the cost modelling research for additive manufacturing
is limited in number. Little research has been done on the WAAM cost and
carbon emission assessment. There is no integrated cost software tool that
24
could be utilised to assess every type of WAAM products accurately and
conveniently.
25
3 Research Aim, Objectives and Methodology
3.1 Introduction
It is vital to adopt an appropriate research methodology for a specific research.
In this chapter, the research aim and objectives were determined based on the
identified research gap first. Then the author gave a detailed introduction on the
adopted research methodology, including the stage division and the output of
each stage.
3.2 Research Aim and Objectives
The aim of this project is to develop a cost and carbon emission model primarily
for the WAAM manufacturing cost (£) calculation and secondly for the WAAM
carbon emission (KgCO2e) estimation, which can be used by the decision
makers and design engineers in product design stage without detailed process
information.
The research objectives are listed as follows:
1. Create the overview of WAAM, environmental impact and cost
estimation theories.
Study the technology of WAAM, recognise the specific process and activities of
WAAM; identify various cost estimation theories; explore relevant provisions and
standards for environmental impact; investigate existing research on WAAM cost
estimation. Find out the research gap and form the initial cost model concept.
2. Determine the process map, CBS and cost driver, develop the WAAM
cost framework and detailed cost equations.
Investigate the WAAM manufacturing process. Establish the cost breakdown
structure and identify the cost drivers. Define the manufacturing feature for
WAAM. Construct a feature based cost model framework. Develop detailed cost
equations according to the proposed cost framework.
3. Develop GHG emission model for WAAM
26
Investigate the existing GHG emission estimation standards, identify the GHG
emission associated activities of WAAM, and develop specific WAAM carbon
emission procedure.
4. Develop an integrated software tool to implement the proposed cost
and GHG emission model
Study Visual Basic programming language and MS Access database techniques.
Explore the techniques for automatically capture geometry, weight and material
data from CAD files. Determine the structure and data flow of the software.
Develop the cooperative database for process parameters and unit prices
regarding WAAM. Design the graphic user interface. Implement the proposed
cost and GHG emission model in this software tool.
5. Apply this integrated software tool on cost estimation and comparative
cost analysis.
Using the proposed cost software tool to carry out actual cost and GHG emission
estimation, and compare the cost of other alternative manufacturing techniques
such as casting and milling.
6. Validate this integrated cost model through case study and expert
judgement.
After the actual application in case studies, discuss the accuracy and
applicability of the proposed model and software tool, validate them by expert
judgements.
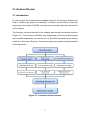
3.3 Research Methodology
The different steps to go through to achieve the research aim are presented in
Figure 3.1. The structure of research methodology of this project consists of four
major phases. They are literature review, data collection and analysis, cost
model development, cost model validation. The actions and outputs of each
phase are also presented in this section.
1. Literature review
This stage aims to obtain a fundamental understanding of this subject and its
related fields, discuss the knowledge gap, and form an original Cost & CO2
27
emission model concept. Objectives 1 was conducted at this stage, which
includes the study of the technology and process of WAAM, identify the specific
process stages and activities; understanding the increasing attention in
environmental impacts, study relevant carbon emission quantification provisions
and standards; explore various cost estimation theories then determine a
suitable one for WAAM. The deliverable in this stage is a project brief
introduction document and literature review report.
2. Data Collection and Analysis
This phase is mainly to gather and analyse the necessary data for the cost and
CO2 emission model. These data covers cost information of material, equipment,
labour and energy, the WAAM process parameters and carbon emission
associated data. They were obtained from literature, industry survey, expert
knowledge and public database. By collecting and analysing these data, the
WAAM process map, CBS and cost drivers can be determined. A
comprehensive database for estimating WAAM cost and GHG emission also
was developed. The output of this phase is the process map, CBS, data
collection from and database.
3. Cost Model Development
The main aim in this phase is to develop a cost and carbon emission model for
WAAM, then implement the proposed model in an integrated software tool.
Objectives 2 to 4 were conducted in this stage. The cost model framework,
detailed cost equations, GHG emission estimation procedure, CAD model
identification techniques were studied respectively, then they were programmed
into an integrated cost software tool, which comes with a CAD data automatically
access program module to improve the data input efficiency; a precise cost &
CO2 calculate program module to ensure the accuracy of the results; an
independent database to support data expansibility and maintainability; a user
friendly interface to input settings and display results. The deliverable of this
phase is the cost model software.
4. Cost model validation
Finally, a validation process for the developed cost model was carried out
through case study and expert judgement. Some real-world components were
28
used for the cost model validation. The defect identified through case studies,
the suggestions and recommendations from experts were used to refine the
proposed model. Conclusion and recommendation of this subject was made in
this stage. The deliverable of this stage is the thesis and validated cost software
tool.
Figure 3.1: Research methodology
29
4 Cost Model Development
4.1 Introduction
The importance of developing a reliable cost model during early design stage is
widely recognized. This project tends to adopt quantitative cost estimation
techniques e.g. some type of analytical methods for WAAM cost modelling.
Considering the actual state of the art of WAAM, a tool path based or feature
based cost model is possible choice.
A robot path generation program named RUAMROB has been developed at
Cranfield University (Ding, et al., 2010). With this software, the accurate total
working time can be obtained, which is essential for cost calculation. However,
due to the immaturity of RUAMROB, many shortcomings can be found such as
cannot process tool path for complex components, the welding parameters are
not included, etc. Therefore, it is reasonable to develop a tool path based cost
calculate software in the condition that tool path software is robust enough. Even
we can integrate them together at that time. However, at present other approach
should be considered for developing the cost model.
A fabrication of geometrical features by WAAM research project is ongoing in
Cranfield University. The process parameters were investigated through large
amount of experiments, then the parameters for manufacturing each geometrical
feature were analysed and optimised (Panagiotis, 2012). Hence it provides a
feasible way to approach cost for WAAM by using a feature based model. The
total manufacturing cost can be calculated by determining the costs of each
feature first and then sum up all these features’ cost together. This is an
accurate and reliable method. Moreover, compared with tool path based
approach the feature-based cost estimation methodology is more suitable to be
used in product design stage and identify cost consuming features easily.
4.2 The WAAM process map
As previously presented in chapter 1, this project concentrates on the
manufacturing cost of WAAM products. The cost of design, optimization and
quality inspection were considered out of scope. Moreover, the indirect cost such
30
as administration cost and factory plant cost were excluded as well. The WAAM
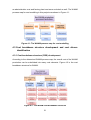
process map for cost modelling in this project was shown in Figure 4.1.
Figure 4.1: The WAAM process map for cost modelling
4.3 Cost breakdown structure development and cost drivers
identification
4.3.1 Cost breakdown structure (CBS) development
According to the determined WAAM process map, the overall cost of the WAAM
production can be subdivided into many cost elements. Figure 4.2 is the cost
breakdown structure for WAAM.
Figure 4.2: The WAAM cost breakdown structure
31
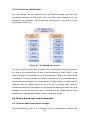
4.3.2 Cost drivers identification
The cost drivers can be identified from the WAAM process map and cost
breakdown structure. In this project, the cost drives were classified into two
categories: the geometric cost drivers and non-geometric cost drivers, which
were listed in Figure 4.3.
Figure 4.3: The WAAM cost drivers
The term “buy-to-fly ratio” here is usually used in aerospace industry to compare
the size of the original billet to that of the finished part (Allen, 2006). It will
determine how much material you need to purchase in order to manufacture the
final product. One point should be clarified is that the buy-to-fly ratio depends on
the manufacturing method. For machining due to large amount of material will be
removed from the original billet the buy-to-fly ratio is usually high, while for
WAAM the material of final product is converted from welding wire with very high
efficiency, hence the buy-to-fly ratio of WAAM can be treated as the ratio
between the initial deposited weight and the net shape weight.
4.4 Feature based cost model framework
4.4.1 Feature based cost model concept
The manufacturing cost of a component can be estimated by utilizing the
32
production process and the process parameters it required. But usually it is hard
to obtain detailed process data during design stage. To overcome this issue, a
factor that can be identified by the cost estimator in the product design stage and
will influence the final production cost is required (Ou-Yang et al., 1997). From
the fabrication of geometrical features by WAAM research project which is
ongoing in Cranfield University, it can be found that the process parameters vary
with the manufactured features, and for a certain feature, the process
parameters are similar. That means the manufacturing cost of a specific WAAM
component can be calculated by utilizing the features it contains. This is the
initial concept for WAAM cost modelling in this project.
In this feature based cost model, various WAAM products were treated as a
combination of different basic features, the total production cost consists of cost
for manufacture each feature, material cost, set up cost, substrate cost and
integrated machining cost.
In which the integrated machining cost was
considered as an optional cost depends on the surface finish requirement; the
substrate preparation cost includes two alternative process cost: substrate
cutting or recycling cost; the set up cost will be uniformly distributed to the
amount of products in case of batch production. Meanwhile, a factor “complex
index” was adopted to describe the complexity of the WAAM product, which
primarily affects the setup time.
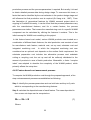
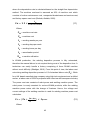
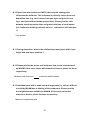
4.4.2 Feature based cost assessment process
To compute the WAAM production cost through the proposed approach, a fivestep cost assessment process was established as following:
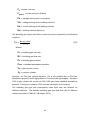
Step 1: identify the process parameters such as build rate and buy-to-fly ratio
which is corresponding to the manufacturing features.
Step 2: calculate the deposited mass of each feature. The mass deposited to
form a near net shape can be computed as:
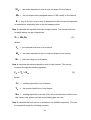
𝐌𝐝 = 𝐌𝐧 × 𝐁
(1)
Where:
33
𝐌𝐝
𝐌𝐧
𝐁
=
the mass deposited to form a near net shape for one feature
=
the net shape mass (designed mass in CAD model) of one feature
= buy-to-fly ratio, a term used to describe the ratio of material deposited
to material that eventually goes to the net shape product.
Step 3: calculate the required build time of each feature. The overall build time
for each feature can be computed as:
𝐓𝐛 = 𝐌𝐝 /𝐑 𝐛
(2)
Where:
𝐓𝐛
𝐌𝐝
𝐑𝐛
= the required build time of one feature
= the mass deposited to form a near net shape of one feature
= build rate (Kg/h) of one feature
Step 4: calculate the welding deposition cost of each feature. This can be
compute through the following equation:
𝐂𝐟𝐢 = 𝐓𝐛 × 𝐑 𝐦
(3)
Where:
𝐂𝐟𝐢
𝐓𝐛
𝐑𝐦
= welding deposition cost of feature i
= the required build time of one feature
= welding deposition cost rate (£/h), which includes the machine cost
rate, labour rate, power cost rate and shielding gas cost rate
Step 5: calculate the total cost for manufacture one WAAM component. This can
be compute through the following equation:
34
𝐓𝐂 = ∑𝐢 𝐂𝐟𝐢 + 𝐂𝐬 + 𝐂𝐛 + 𝐂𝐦𝐚𝐜𝐡𝐢𝐧𝐢𝐧𝐠 + 𝐂𝐌𝐚𝐭𝐞𝐫𝐢𝐚𝐥
(4)
Where:
𝐓𝐂
𝐂𝐟𝐢
𝐂𝐬
𝐂𝐛
= the total cost for manufacture one WAAM component
= welding deposition cost of feature i (see eq. 3)
= set up cost
= substrate cost
𝐂𝐦𝐚𝐜𝐡𝐢𝐧𝐢𝐧𝐠
𝐂𝐌𝐚𝐭𝐞𝐫𝐢𝐚𝐥
= integrated machining cost
=
material cost
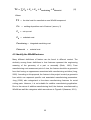
4.5 Identify the WAAM features
Many different definitions of feature can be found in different context. The
similarity among these definitions is that features represent the engineering
meaning of the geometry of a part or assembly (Shah, 1991). From
manufacturing cost assessment point of view, the feature should be a geometric
form that having an appearance associated with manufacturing activities (Jung,
2002). According to this proposal, the feature in this project is mainly a geometric
from which can represent specific cost associated manufacturing parameters.
Jung (2002) also categorised a four-class manufacturing features for metal
cutting parts. However, it is not suitable for additive manufacturing application.
Due to the nature of additive manufacturing itself, the features manufactured by
WAAM are wall-like categories which were shown in Figure4.4 (Kazanas, 2011).
35
Figure 4.4: The WAAM feature taxonomy (Kazanas, 2011)
Considering the state of the art of WAAM, currently not all these features listed
above have been fully studied. In order to find out which feature should be
included in this project and their relationship and priority in affecting WAAM cost
(main feature and sub feature, etc.), a questionnaire was designed to capture
relevant knowledge from the Cranfield university welding research centre.
Table 4.1: The WAAM features in this cost model
The WAAM features in this cost model
Main-features
Sub-features
material
Wall thickness
Vertical wall
With intersections
Aluminium
thickness≤8mm
No intersection
Titanium
Thickness>8mm
---
Steel
---
---
---
---
---
---
---
30°-90°Inclined
wall
0°-30°Inclined
wall
curved Inclined
wall
Horizontal wall
36
From the interview and questionnaire with WAAM staff and experts, the features
included in this project were determined and listed in Table 4.1, where a specific
WAAM feature = main feature + sub feature + material + wall thickness. As
shown in Figure 4.5, the main feature depends on the angle θof wall deposition
direction to horizontal plane. The sub feature here is the connection form
between features which could influence the buy-to-fly ratio. The wall thickness
can affects the alloy efficiency and build rate. Therefore these aspects were
considered in the manufacturing feature definition. The different type of material
was taken into account as well.
Figure 4.5: Definition of wall deposition angle θ
Figure 4.6 shows various kinds of vertical walls, the pattern of horizontal section
may vary, as long as the deposition direction (see from vertical section) is
vertical to the horizontal plane, it should be treated as vertical wall. Figure 4.7
indicates the aspects of real horizontal and inclined walls, please note due to the
substrate is not always horizontal, so the angle between substrate and wall
deposition direction is not always as same as deposition angle. Therefore the
deposition angle should always be used as the only principle to judge the
category of main feature.
Figure 4.6: Various kinds of vertical walls
37
Figure 4.7: Inclined wall and horizontal wall
As indicated in Table 4.2, detailed manufacturing parameters have been
encapsulated in the manufacturing features. Therefore, without the requirement
of knowing various manufacturing parameters, as long as the cost estimator can
identify the features contained in one particular product, the manufacturing cost
of this product can be calculated out.
Table 4.2: Manufacturing Parameters Encapsulated in Features
Manufacturing Parameters Encapsulated in Features
1
Wire feed speed (WFS)
2
Torch travel speed (TS)
3
Wire diameter
4
Welding process
5
Amperage
6
Voltage
7
Alloy efficiency
8
Shielding gas type
9
Shielding gas consumption rate
38
4.6 Cost model equations development
4.6.1 Build rate
The overall build rate is affected by the welding deposition rate and nondeposition time (e.g. torch travel from one end point to next start point, part
rotate time in case of double side deposition, extra cooling down time for special
parts, etc.). However, the industry survey indicated that compare with the
deposition speed (typically 3mm/s), the torch travel speed without welding
(typically 200mm/s) and the part rotate speed (typically 300degree/s) are so fast
and can be ignored, while the extra cooling down time for special parts is out of
scope in this research. Hence the build rate can be treated as same as the
deposition rate.
𝐑𝐛 =
𝛑×𝐃𝟐𝐰 ×𝐯𝐅 ×𝛒
Where:
𝐑𝐛
= build rate of one feature
𝐃𝐰
𝐯𝐅
𝛒
(5)
𝟒
= welding wire diameter of one feature
= wire feeding speed of one feature (WFS)
= welding wire density
39
4.6.2 Buy-to-Fly ratio
Figure 4.8 Factors influencing the buy-to-fly ratio
Figure 4.8 indicates the factors influencing the buy-to-fly ratio. In which (a) is a
vertical section shows the surface waviness caused by the overlapping of weld
beads. The “alloy efficiency” is a term used to measure the influence of the
surface waviness (Shettigar, 2010). In the case of (a), the alloy efficiency
=effective area/ overall area. However, picture (a) is only the condition of single
track per layer, for thick wall (>8mm), a multi-track deposition strategy will be
adopted. In this condition all tracks in the middle do not affect the wall waviness
so the alloy efficiency will become higher than single track. This can be
computed by the following equation:
𝐒𝐞
𝐄𝐚 =
𝐒𝐭
Where:
𝐄𝐚
𝐒𝐰
𝐒𝐰
𝐒𝐭
=𝟏−
𝟏−𝐄𝐚𝟏
𝟏+(𝟏−𝐱)(𝐧−𝟏)
= alloy efficiency (any tracks) of one feature
𝐄𝐚𝟏
𝐒𝐞
=𝟏−
= alloy efficiency (single track) of one feature
= effective section area
= waviness section area
40
(6)
𝐒𝐭
= total section area
𝐱 = overlap rate (between tracks)
𝐧 = total number of tracks per layer
Picture (b) in figure 4.8 indicates the top layer fillet effect caused by the surface
tension of the weld beads. This top layer fillet need to be trimmed off by finish
machining, therefore the additional fillet volume need to be deposited first. After
an interview with the WAAM expert, the fillet is proposed to have a semicircle
section, where the diameter equals to the track width (or wall width for single
track). Then the fillet volume can be calculated by the following formula:
𝟏
𝐖
𝐕𝐟𝟏 = × 𝛑 × ( 𝐭)𝟐 ×
𝟐
Where:
𝐕𝐟𝟏
𝐖𝐭
𝐕𝐧
𝐇𝐧
𝐖𝐧
𝟐
𝐕𝐧
(7)
𝐇𝐧 ×𝐖𝐧
= single track top layer fillet volume
= track width
= feature net shape volume
= feature net shape height (or equivalent height for non-vertical wall)
= feature net shape wall width
𝐕𝐟 = 𝐕𝐟𝟏 × [𝟏 + (𝟏 − 𝐱)(𝐧 − 𝟏)]
(8)
Where:
𝐕𝐟
= top layer fillet volume for any tracks
𝐕𝐟𝟏
= single track top layer fillet volume (see eq. 7)
𝐱 = overlap rate (between tracks)
𝐧 = total number of tracks per layer
Another influence factor is the intersection among features which is shown in
picture (c) of figure 4.8. At the intersected points when welding deposition the
41
deposited shape tends to form stress raising sharp corners and overlap peaks,
to overcome this issue several different deposition strategies such as use a
pattern of opposite angles connecting at their vertices were investigated
(Mehnen, et al., 2010). These build strategies also lead to additional material
deposited at the intersection point. From the questionnaire information, the
additional volume at intersection can be computed from the following equation:
𝐕𝐢 = 𝐖𝐧𝟐 × 𝐇𝐧 × 𝐍
(9)
Where:
𝐕𝐢
= additional volume at intersection of one feature
𝐖𝐧
𝐇𝐧
= feature net shape wall width
= feature net shape height (or equivalent height for non-vertical wall)
𝐍 = the number of “equivalent intersection” of one feature
There are two kinds of intersections: the cross intersection and the “T” shape
intersection. From the industry survey, the additional volume of cross
intersections is approximately double of that of “T” shape intersections. In this
research project, a term “equivalent intersection” is used to convert these two
types of intersections. One “T” shape intersection equals to one equivalent
intersection, and one cross intersection equals to two equivalent intersections.
For instance, if two vertical walls form one cross intersection, then each vertical
wall will be treated as to have two equivalent intersections.
Finally, the deposited mass can be calculated by using equation (1), (6), (7), (8),
(9) together.
𝐌𝐝 = 𝐌𝐧 × 𝐁 = 𝛒 ×
𝐕𝐧 +𝐕𝐟 +𝐕𝐢
𝐄𝐚
(10)
4.6.3 Welding Deposition cost rate
The welding deposition cost rate includes machine cost rate, labour rate, power
cost rate and shielding gas cost rate.
The machine cost includes machine depreciation and machine overhead cost,
42
where the depreciation rate is calculated based on the straight line depreciation
method. The machine overhead is assumed as 30% of machine cost which
consists of routine maintenance cost, unexpected breakdowns and services cost,
and factory space used cost (Shehab, Abdalla, 2002).
𝐂𝐌 = 𝟏. 𝟑 ×
Where:
𝐂𝐌
𝐂𝐦
𝐭𝟏
𝐭𝟐
𝐭𝟑
𝐭𝟒
𝐂𝐦
(11)
𝐭 𝟏 ×𝐭 𝟐 ×𝐭 𝟑 ×𝐭 𝟒 ×𝐄𝐦
= machine cost rate
= machine cost
= working weeks per year
= working days per week
= working hours per day
= amortisation period
𝐄𝐦
= machine utilization
In WAAM production, the welding deposition process is fully automated,
therefore the manual labour is not required during most of the deposition time. A
technician can easily handle a factory comprising of three RUAM machine
without much difficulty (Shettigar, 2010). From this point of view, the labour cost
rate during welding deposition process is 1/3 of standard labour rate (𝐂𝐋 ). While
for a UK based manufacturing company using high tech equipment and a skilled
worker, a labour rate of £55/h is proposed after interview with aerospace industry.
The power cost rate consists of robot power and welding machine power. The
robot power is nearly constant for various WAAM products, while the welding
machine power varies with the change of features. Hence, the voltage and
current settings of the welding machine is used for welding machine power cost
calculation.
𝐂𝐏 = ( 𝐏𝐑 +
Where:
𝐕𝐖 × 𝐀𝐖
𝐄𝐖 ×𝟏𝟎𝟎𝟎
) × 𝐂𝐩𝐨𝐰𝐞𝐫
43
(12)
𝐂𝐏
= power cost rate
𝐂𝐩𝐨𝐰𝐞𝐫
𝐏𝐑
𝐕𝐖
𝐀𝐖
𝐄𝐖
= power unit price (£/Kwh)
= average robot power consumption
= voltage settings of the welding machine
= current settings of the welding machine
= welding machine efficiency
The shielding gas (argon and helium) cost rate can be computed by the following
equation:
𝐂𝐆 =
𝐑 𝐆 ×𝐂𝐠 ×𝐏𝐚𝐭𝐦
Where:
𝐂𝐆
𝐑𝐆
𝐏𝐆
= shielding gas cost rate
= shielding gas flow rate
= shielding gas pressure
𝐏𝐚𝐭𝐦
𝐕𝐆
𝐂𝐠
(13)
𝐕𝐆 ×𝐏𝐆
= standard atmosphere pressure
= gas cylinder volume
= cost per cylinder
However, for CO2 gas cylinder equation (13) is not suitable due to CO2 has
liquefaction property under high pressure. From the weld gas supplier, 1kg liquid
CO2 in gas cylinder will convert to 509L CO2 gas under standard atmosphere
pressure. This figure is used for CO2 cost rate calculation in this project.
The shielding gas type and consumption rates (flow rate) are different for
different materials. The detailed shielding gas type and flow rate for different
material are listed in Table 4.3 (Shettigar, 2010).
44
Table 4.3: The shielding gas requirements for different materials
Finally, the manufacturing cost rate can be calculated by the following equation:
𝐑 𝐦 = 𝐂𝐌 +
𝐂𝐋
𝟑
+ 𝐂𝐏 + 𝐂𝐆
(14)
4.6.4 Substrate cost
There are two types of substrates, for common WAAM products the substrate
can be recycled after deposition, while for some hybrid WAAM products the
substrate are non-recyclable and will become a part of the final product.
According to the industry survey, the substrate cutting and recycling process are
highly automated and very effective. Hence the primary substrate cost is the cost
of material. Therefore, only the material cost of substrate was considered in this
cost model. For substrate-recycled WAAM products, the substrate cost is zero.
While for the hybrid WAAM products, sometimes not all the material will finally
goes to the product. For instance, the substrate may thicker than it in the final
product to prevent thermo distortion, or the substrate area may larger to provide
extra room for fixture. A term “substrate efficiency” in this cost model is used to
correct the substrate mass.
𝐂𝐛 =
𝐌𝐛
𝐄𝐬
Where:
𝐂𝐛
(15)
= substrate cost (only for non-recyclable substrate)
𝐌𝐛
𝐄𝐬
× 𝐂𝐦𝐚𝐭𝐞𝐫𝐢𝐚𝐥
= substrate mass in the final product
= substrate efficiency (<1)
𝐂𝐦𝐚𝐭𝐞𝐫𝐢𝐚𝐥
= material cost rate
45
4.6.5 Setup cost
From interview with WAAM experts, the setup for WAAM consists of the
following works: program the WAAM machine, load material and adjust the
fixtures. However, the overall setup time depends on the complexity of the
product.
After discussed with WAAM expert, the “complex index” is used to describe the
geometrical complexity of a product. From simple to complex, the WAAM
products are divided into four complexity levels: low (complex index = 0.5),
medium (complex index = 1), high (complex index = 2), very high (complex index
= 4). Each complex level has a specific setup time correction factor which is
used to correct the setup time. The average setup time of medium-complex
WAAM product is 1 hour, and this will be used as a benchmark, the setup time of
other complex level can be calculated by using the benchmark multiply the
correction factor.
The definition of complex level is:
Low: only one independent feature.*
Medium: several independent features, no intersections. *
High: several features with intersections between each other.*
Very high: products need to be deposited on both side of the substrate (a
turntable is required to fix the substrate).
* If the product has a large size (>1.5 meter long), the complex index will
increase to next higher level.
In the setup phase, the welding machine does not actually welding, the motion
system also in static status. This means the power consumption is negligible
during setup. The following equation is used to calculate the setup cost:
𝐂𝐬 = (𝐂𝐌 + 𝐂𝐋 ) × 𝐓𝐬 × 𝐂𝐬𝐟
(16)
Where:
𝐂𝐬
= setup cost
𝐂𝐌
𝐂𝐋
= machine cost rate
= labour rate
46
𝐓𝐬
= setup time for medium complex WAAM parts
𝐂𝐬𝐟
= setup time correction factor depends on complex index
4.6.6 Integrated machining cost
The aim of integrated machining is to remove the surface roughness to obtain
precise net shape. Due to the machining process is integrated into the WAAM
system it does not need a separate setup process, and no additional material
cost occur as well. So in this condition, the machine cost, tool replacement cost,
labour cost and energy cost were considered to composing the total integrated
machining cost. In which the tool replacement cost can be represented as
machine cost rate multiply a factor (Dewhurst, et al., 1988). Finally, the following
equation is used to calculate the integrated machining cost:
𝐂𝐦𝐚𝐜𝐡𝐢𝐧𝐢𝐧𝐠 = (
Where:
𝐂𝐦𝐚𝐜𝐡𝐢𝐧𝐢𝐧𝐠
𝐂𝐌
𝟏−𝐧
+
𝐂𝐋
𝟑
+ 𝐏𝐦 × 𝐂𝐩𝐨𝐰𝐞𝐫 ) ×
𝐌𝐆 −𝐌𝐍
𝐑 𝐦𝐚𝐭𝐞𝐫𝐢𝐚𝐥 ×𝛒
(17)
= integrated machining cost
n = Taylor tool life index (depends on tool material)
𝐂𝐌
𝐂𝐋
= machine cost rate
= labour rate
𝐏𝐦
= average machining power consumption
𝐂𝐩𝐨𝐰𝐞𝐫
𝐌𝐆
𝐌𝐍
𝛒
= power unit price (£/Kwh)
= product gross mass
= product net mass
= density of the material
𝐑 𝐦𝐚𝐭𝐞𝐫𝐢𝐚𝐥
3
= material removal rate for medium complex WAAM parts (m �h)
47
5 Carbon Emission Model Development
5.1 Introduction
‘Carbon footprint’ is a term used to describe the amount of greenhouse gas
(GHG) emissions caused by a particular activity or entity, and thus a way for
organisations and individuals to assess their contribution to climate change (BSI,
2011). In 2011, PAS 2050 was updated to improve and refine the standard –
based on initial experiences and international developments of product carbon
emission measurement. A key aim of the update was to align the PAS 2050
methodology and its use with other internationally recognized carbon footprint
methods such as the GHG Protocol Product Standard and ISO 14067, Carbon
Footprint of Products. The PAS2050 provides an actual method to carry out a
lifecycle assessment on specific goods or service and it also compatible with the
coming ISO 14067. Therefore, this project follows the specification of PAS2050
standard. A three step GHG estimation methodology was illustrated in Figure 5.1.
Scoping
•functional unit
•Process map
•System
boundary
Data collection
•Activity data
•Emission
factors
•Data collection
plan
GHG emission
calculation
•Equations
•calculation
table
Figure 5.1: Methodology for WAAM carbon emission assessment
5.2 The WAAM carbon emission assessment
5.2.1 Scoping
For accessing the carbon footprint, the product must be defined in terms of a
‘functional unit’. The functional unit defines the function of the product that will be
assessed and the quantity of product to which all of the data collected will relate
(BSI, 2011). For WAAM products the functional unit in this research project is
one piece of component manufactured by the WAAM process. Due to the current
status of WAAM itself, the yield rate (rate of finished product) is not taken into
account (no relevant data available).
48
Once the functional unit has been defined, the next step is to map out the life
cycle of the product to be assessed. According to the BAS2050, the WAAM
products belong to B2B (business to business) products class; its cradle-to-gate
life cycle stages were shown in Figure 5.2. Then the detailed WAAM process
map regarding GHG estimation can be found in Figure 5.3.
Figure 5.2: Process map stages for business-to-business goods (PAS2050)
Figure 5.3: The WAAM process map for GHG assessment
The life cycle process map can be used to help identify which parts of the overall
49
system will, and will not, be included in the assessment. According to PAS 2050,
a carbon footprint must include all emissions of the 63 GHGs listed in the
specification. Meanwhile, it is vital that at least 95 percent of the total mass and
at least 95 percent of the total anticipated impact of the final product is being
assessed.
The PAS 2050 allows for two standard types of assessment (Figure 5.4):
1. Cradle to gate – which takes into account all life cycle stages from raw
material extraction up to the point at which it leaves the organization undertaking
the assessment.
2. Cradle to grave – which takes into account all life cycle stages from raw
material extraction right up to disposal at end of life.
Figure 5.4: Different types of carbon emission assessment (PAS2050)
The WAAM process is developed to manufacture industrial components which
can be classified to B2B product, so the “cradle-to-gate” assessment is
reasonable, thus the use and the end of life stages can be excluded. Moreover,
the WAAM process is a developing novel technique, and not yet is widely used
in industry, so there is no proper GHG emission data associated with
“distribution and retail” activity. The WAAM process also could play as an
intermediate stage of overall production process in practical applications. So the
distribution and retail stage was determined to be excluded in this project as well.
Besides raw material, energy and shielding gas, The WAAM process needs
coolant for milling and grinding, as well as some other ingredients such as
lubricant and cleaning agent. The coolant is recycled, other ingredients’
consumption are anticipated to be immaterial for the total carbon footprint (less
than 1 percent). So in this project, these factors were considered to be excluded.
50
The storage of raw material and product may come with GHG emission,
especially for those needs cryopreservation. The WAAM substrate cutting do
causes a certain amount of GHG emission as well. However, from industry
survey it can be found that the WAAM products and raw material are all metal
and do not require extra energy and coolant. Meanwhile, compare with the
overall WAAM process the GHG emission during substrate cutting is also
negligible. In addition, the quality inspection in current WAAM process varies
with the experiment requirement and may change in future commercial
production. Hence all these factors listed above were considered to be out of
scope.
Other boundary consideration is to streamline the raw material stage. The
production of raw material belongs to external supply chain and the supplier
usually may vary. While an in-depth investigation for the detailed material
production process is not feasible in this project, but the inventory of carbon for
one specific material is generally stable and easy to access from associated
database. So only the mass of consumed raw material and its transportation will
be considered in this project.
Finally, the included activities and process for GHG emission assessment in this
project was listed in Figure5.5.
Figure 5.5: List of all included activities and processes for GHG emission
assessment (system boundary)
51
5.2.2 Data collection
From the PAS 2050, two categories of data need to be collected for carrying out
GHG emission assessment. They are:
Activity data: referring to quantities of inputs and outputs for a process, typically
described for a unit of production for a specified year of production
Emission factors: values that convert activity data quantities into GHG
emissions, usually expressed in units of ‘kg CO2e’.
For these two categories of data, there are two types of data sources:
Primary sources – first-hand information, specific to the activity in question.
Collected internally or from the supply chain
Secondary sources – average, or typical, information about a general activity
concentration from a published study or other source.
In accordance with the principles of ‘relevance’ and ‘accuracy’, primary data are
generally preferred. In addition, at least 10 per cent of the total cradle-to-gate
emissions must have been calculated from primary data.
A data collection plan is essential in this stage. It should cover all of the data
which are required for the carbon footprint assessment in this project. Meanwhile,
the data collection plan should outline top targets for primary data collection, and
highlight areas where secondary data will be sought instead when the primary
data collection may not be feasible (PAS2050, 2011). Table 5.1 is the GHG
emission data collection plan in this project.
Table 5.1: Data collection plan for the WAAM GHG emission assessment:
Data required
Anticipated source
Mass of the product
Primary data
Buy-to-fly ratio
Primary data
Build rate
Primary data
machine power
Primary data
Primary
data
secondary data
Primary
data
secondary data
Primary data
Material removal rate during machining
Gas cylinder volume / weight
Shielding gas flow rate
52
/
/
Material transportation distance & method
Waste
(metal
chips)
distance & method
All emission factors
transportation
Primary
data
secondary data
Primary
data
secondary data
Secondary data
/
/
5.2.3 GHG Footprint calculation
From PAS2050, a general formula for GHG emission calculation is Carbon
footprint = activity data (kg/litres/kWh/tkm, etc.) × emission factor (kg CO2e per
kg/litre/kWh/tkm, etc.). According to the defined scope in chapter 5.2.1, the GHG
emission of WAAM consists of four sectors: raw material, electricity,
transportation and waste disposal. The GHG emission of each sector can be
calculated out through the above equation, and then the overall carbon footprint
of WAAM products can be computed by sum each sector up.
The emission factor of raw material, purchased electricity, freight transportation
and waste disposal can be obtained from two data sources. One is the Inventory
of Carbon & Energy (ICE) database (Hammond et al., 2008), which is a project
carried out by the University of Bath and gives details about the carbon
emissions for various building materials. The other is Greenhouse gas
conversion factors for company reporting 2012 guidelines (DECC and DEFRA,
2012), which is a public available guideline from the Department of Energy and
Climate Change (DECC) and the Department for Environment, Food and Rural
Affairs (DEFRA). Table 5.2 indicates the emission factor for various activity data
of WAAM.
Table 5.2: Carbon emission factors of WAAM
item
Emission factors
Data source
Aluminium wire
11.2 (KgCO2e/Kg)
ICE
Aluminium plate
11.5 (KgCO2e/Kg)
ICE
Steel wire
2.83 (KgCO2e/Kg)
ICE
Steel plate
3.19 (KgCO2e/Kg)
ICE
Titanium
1.07 (KgCO2e/£)
DEFRA
Shielding gas
1.06 (KgCO2e/£)
DEFRA
Electricity
0.4939 (KgCO2e/kWh)
DEFRA
Freight transportation
0.641 (KgCO2/TonneKm)
DEFRA
Waste disposal
21 (KgCO2e/Tonne)
DEFRA
53
6 Integrated Cost and Carbon Emission Software Tool
6.1 Introduction
The proposed cost and carbon emission model were built by using Visual Basic
6.0 with Microsoft Access database support. This cost and carbon emission
software tool is user friendly and easy to operate. Due to the design of an
independent backend database, it can incorporate furthermore data easily; all
the data such as process parameters and material unit price can be
conveniently edited or added in the future. In order to minimise the operation
time, this software comes with a CAD data automatically access program
module which can improve the parameter input efficiency significantly. Hence
the user does not have to manually input all the geometry data of the part to be
estimated, only by simply clicking several button, the cost and carbon emission
results will be calculated out in seconds. This is a significant aspect of this
software tool which can eliminate time consuming manual labour and obtain a
very quick and precise cost result.
6.2 Software structure and flow chart
Cost & carbon emission software structure
In order to make the cost software more efficiently and user friendly, four
modules are designed for this program. The relationship among these modules
and the overall structure of the software are indicated in Figure 6.1.
Figure 6.1: The structure of cost software
54
Cost & carbon emission software flow chart
The software has a welcome page on which the user can select either edit
database or calculate cost. When “edit database” function is selected, a data
form page with four tabs will appear on where the database can be edited,
added or deleted. “Calculate cost” function will take the user to a CAD model
select page first, then the software will open selected CAD file by using CATIA
and capture relevant data, all these data will be listed on a data confirmation
page where they will get verified. After this, the final cost and carbon emission
result will be calculated out and listed on the result report page. The software
also provides a function to save the result as an independent Microsoft Excel
file. Figure 6.2 shows the software flow chart.
Figure 6.2: Software flow chart
55
6.3 Software Development
6.3.1 Automatically identify CAD models
The CAD techniques were initially carried out in 1960s, after years of
development now it can cover the range from 2D vector-based drafting to 3D
solid and surface modelling. A huge number of commercial CAD software are
available to meet the requirement in different companies, such as AUTO CAD,
UG, CATIA, PRO-E, Solid Works, etc. Among which CATIA is a multi-platform
CAD/CAM/CAE software suite developed by the French company Dassault
Systemes. Due to the robust functions it provides, at present CATIA has
become the dominated CAD software in aerospace and automotive industries.
Hence in this project, the cost software is designed to be compatible with CAD
models generated by CATIA.
Most CATIA part CAD model is a native format “.CATpart” which is associated
with CATIA only. Therefore it is hard to open this formatted file directly by other
software. However, by means of CATIA automation technique, this task can be
achieved. The automation technology is built on top of the Microsoft COM
(Component Object Model), which is essentially a technology to enables
software communicates with each other.
As illustrated in Figure 6.3, in the automated application of CATIA, all the data
are encapsulated into objects and organised in a parent-child hierarchical
structure. Meanwhile, CATIA V5 provides a series of application programming
interfaces (API) which are source code-based specification intended to be used
as an interface by software components to communicate with each other. The
properties and contents of the encapsulated objects can be accessed by
external programs via API. For instance, In Visual BASIC development
environment, the codes listed below can be used to open a CATIA application.
Dim CATIA As Object
Set CATIA = GetObject(, "CATIA.Application")
Set CATIA = CreateObject("CATIA.Application")
CATIA.Visible = True
Dim oPartdocument As PartDocument
Set oPartdocument = CATIA.Documents.Open(strFilepath)
56
Figure 6.3: The Infrastructure of CATIA Part Document Automation
Objects (CATIA V5 automation)
CATIA provides various methods to create solid CAD models. This means even
for the same geometry shape, there are still many different modelling
approaches. Therefore it is very hard to identify the CAD model regardless its
modelling approach. In this project considering the geometry of WAAM product
are most wall-like, the most feasible and convenient modelling approach in
CATIA is to use the “Sketch-based features” tool (Figure 6.4). Hence the
program is designed to identify and capture data from CATIA CAD parts which
was consists of sketch-based features: Pad, Rib and Shaft. The integrated cost
software utilises CATIA API to open selected WAAM CAD model and exchange
57
data. The geometry properties such as volume, thickness and equivalent height
of each feature of the selected WAAM CAD model will be obtained
automatically, the material property such as material name and density can be
directly captured as well. For each “sketch-based feature”, the user do not need
to name it in advance, the software will only capture and list them with their
original name, then the user need to manually identify and assign a proper
WAAM manufacturing feature to it The software will also take a thumbnail of the
CAD model to help the user confirming the correctness of the WAAM part to be
calculated.
Figure 6.4: Sketch-based features in CATIA
During the CAD model identification process, the user only need to select the
CAD model file at the beginning and assign proper WAAM manufacturing
feature to each section after the CAD model was automatically captured. This
cost software is compatible with CATIA V5 R18 or higher version, the measure
unit of CATIA software should be set to metric. Other criteria for the CAD model
to fulfil were it must be a .CATPart file, only one “part body” is permitted in one
file, each WAAM feature should be drawn respectively by using the CATIA
"sketch-based features" tool, only "pad" "rib" "shaft" will be processed by this
program, the CAD model may contains "dress-up features" such as chamfer
and fillet but it will be ignored, the wall thickness and height must be marked out
in the sketch of each feature by using the "length constraint" tool, material
property should be added in the CATIA CAD model in advance as well.
Otherwise the software may capture wrong data from the CAD model. However,
the user still has an opportunity to check and edit these data when they were
shown on the "data verification page" later.
58
6.3.2 Data base design
In order to improve the maintainability of the cost associated data, an
independent database was designed as a part of the cost software. The
Microsoft access database program is adopted in this project due to its flexible
and easy to use property. The cost data were stored in an independent .mdb
formatted file and can be edited through cost software or Microsoft Access.
There are four tables in the database file namely: “welding deposition data”,
“unit price information”, “machine information”, “GHG emission information”. The
user can edit, add or delete records of each table, but the table name and data
fields were not allowed to change, otherwise the software will fail to connect the
database.
Table 6.1: The name and contents of database table
Table name
Contents
welding deposition data
Welding process parameters,
integrated machining material removal
rate
unit price information
Material expenses, labour rate,
electricity price
machine information
Machine specification , price,
depreciation period
GHG emission information
GHG emission factor and activity data
for material, energy, transportation and
waste disposal
Visual basic provides several methods such as data control, data access
objects (DAO), ActiveX data objects (ADO), etc. to manage external database.
Compared to the other two data access methods, the ADO is a more powerful
data control in Visual Basic environment, as ADO is ActiveX-based, it can work
in different platforms (different computer systems) and different programming
languages. Besides, it can access many different kinds of data such as data
displayed in the Internet browsers, email text and even graphics other than the
usual relational and non relational database information. Therefore, ADO data
59
access method was adopted in this cost program. The VB codes below were
used to connect external MS database:
Dim Conn as ADODB.Connection
Dim Rs as ADODB.Recordset
Dim ConnStr as string
ConnStr = "Provider=Microsoft.Jet.OLEDB.4.0;Data Source=" & MDBfilePath & ";Persist
Security Info=True;Jet OLEDB:Database Password=" & strPassword
Conn.Open ConnStr
Conn.CursorLocation = adUseClient
Rs.Open “……”
After connected to the external database, several ADO Recordset will be
created and then by using the SQL (Structures Query Language) query
keywords such as “SELECT * FROM TableName WHERE FieldName = X…”,
the specific information in certain tables of the database can be accessed or
edited by the cost software.
6.3.3 Graphic user interface
In order to make the cost software more effective and convenient to use, a user
friendly graphic interface was developed. This user interface consists of several
graphic windows. Figure 6.5 shows the function of these windows and their
relationship. With help of this clear and easy-to-use user interface, the cost and
GHG emission estimation procedure can be conducted conveniently.
Figure 6.5: Graphic user interface windows of the cost software
60
When the cost software startup, a welcome page will appear, the user can
select edit databse or caculate cost. When edit database was selected, the user
will be lead to a database edit page. To protect the data security, the data table
will not be displayed unless a validated password was inputted. There were
four tabs on the database edit page, each tab dedicates to display one data
form. The user can edit, add or delete data record by click corresponding
command buttons on each tab conveniently.
The cost software use a step-by-step guide interface to execute cost and
carbon emission assessment. When the user selected “calculate cost” function
on the welcome page, the CAD model select page will appear where the user
can not only select CAD model through a common dialog window, but also can
input the batch size, complexity and integrated machining method of a product.
Meanwhile, the user can set new database name and password for the cost
software if they were changed. Then, the software will capture CAD model data
through CATIA automatically, a progress bar is designed to show the realtime
progress during accessing. After this, all captured data will be displayed on the
data verification page. There were two functions on this page, firstly the user
can check any automatically captured data, if necessary they can manually trim
it; secondly the user need to determine main feature and sub feature for each
item on this page as well. When this step was finished, the cost software will
start to calculate cost and carbon emissions. There is another progress bar to
display the calculation progress as well. Finally, the result display page will
appear to show the results. The results consists of 3 sectors: material
consumption, cost detail, GHG emission. If necessary, all these results can be
saved into a Microsoft Excel formatted file.
61
Figure 6.6: Screenshot of the cost software (data verification page)
62
7 Case Study and Model Validation
7.1 Case study to demonstrate the application of the integrated
cost software tool
A simple geometry part is chosen for demonstrating the use and functions of the
cost software tool. The material of this part is mild carbon steel. Traditional
manufacturing method for this part is CNC milling, the buy-to-fly ratio of milling
is 4. While for the WAAM process, this part has a hybrid structure which
consists of two crossed vertical wall and a rectangle substrate, it can be formed
by depositing the “+” shape on a rectangle plate directly. The 3D CAD model
and 2D drawing of this part are shown in Figure 7.1 and Figure 7.2 respectively.
Figure 7.1: 3D CAD model of the first case study part
Figure 7.2: 2D drawing with measurements
63
To estimate the product cost, a precondition is to ensure all the required data
were stored in the database correctly. On the welcome page of the cost
software, the “edit database” option can be used to verify this. The data used for
this case study were listed in Table 7.1.
Table 7.1: Process and unit price data for first case study part
Process parameters
Unit prices
Wire diameter
1.2mm
Labour rate
55 £/hour
Wire feed speed
6.13m/min
electricity
0.07 £/kwh
Alloy efficiency
86.49%
Welding wire
5 £/kg
Voltage
11.86V
Metal plate
4.5 £/kg
Current
92.61A
Shielding gas
18.78 £/cylinder
Gas flow rate
15000ml/min
WAAM machine
£47000
Milling machine
£65000
Welding machine
90%
efficiency
Milling
material
164.48mm3/s
removal rate
---
On the software welcome page, once the user selected the “calculate cost”
function, the software will show a step-by-step guide to execute the cost
estimation. Firstly, the CAD model select page will display, the software will
automatically capture the geometrical data and material property of the part
after its CAD model is chosen. Meanwhile, there is a “part setting” option, the
product batch size, part complex index and integrated machining method can
be inputted here. Figure 7.3 shows the settings in this case study (single
production with integrated CNC milling).
Figure 7.3: Part setting for first case study
64
Secondly, the cost software will show data verification page after capturing data
from CAD model. The user have to manually select feature type and sub feature
(intesections) number for each section of the part. Besides this, most data
have been automatically captured and no manual input is required, while all the
items listed in this page also can be trimed by the user if desired. The verified
data in this case study was shown in Figure 7.4.
Figure 7.4: Features and geometry data for first case study
Finally, after the part features and geometry data were confirmed, by press the
“confirm” button, the software will calculate out the cost and GHG emission
results in seconds, and then display them on the result display page, where the
result consists of 3 parts: material consumption, cost detail and GHG emission.
Meanwhile,the result disply page has a “save” option to save all these results as
an independent Microsoft Excel formatted report. The result of this case study
can be found in Figure 7.5.
65
Figure 7.5: Cost and GHG emission result of the first case study
Through this case study, the simplicity and the ease of use of this software was
indicated. Only by a three-step-option with little manual labour, the cost and
GHG emission can be estimated conveniently.
The result calculated by this cost software was validated with the WAAM
experts. It was proved to be matching with the empirical material consumption
and cost results. This validates the accuracy and reliability of this software tool.
It also can be found from the result that the buy-to-fly ratio of this part under
WAAM process is only 1.14, compared with 4 by milling, more than 60% raw
material can be saved. And from the environmental influence point of view,
since 85% GHG emission of this part comes from raw material consumption,
therefore a massive reduction of GHG emission can be obtained by using
WAAM. This indicates the potential advantage of the WAAM process: low
consumption, low cost, high efficiency and more sustainable. Further case study
in these aspects will be carried out later through two real-world components.
66
7.2 Case study of real-world components
7.2.1 Real-world Case 1, an aluminium part from automotive
industry
Figure 7.6 and 7.7 indicates a more complex structure which is chosen for realworld case study 1. This is an aluminium part comes from automotive industry.
A significant feature is its buy-to-fly ratio. It can reach to 12 when manufactured
by conventional machining process. This means over 90% of raw material have
to be cutting off during machining. However, it is very common for typical
complex aerospace and automotive industry components.
Figure 7.6: 3D model for real-world case study 1
Figure 7.7: 2D drawing with dimensions of real-world case study 1
67
The data used for estimating WAAM cost were listed in Table 7.2, the process
is welding deposition plus integrated milling, and the product batch size is set to
4 parts per batch. The cost and GHG emission result estimated by the cost
software tool was shown in Table 7.3. The total cost is £32.992, manufacturing
time is 0.469h (includes 0.25h setup time). The overall GHG emission is
1.399KgCO2e.
Table 7.2: Process and unit price data for real-world case study1
Process parameters
Unit prices
Wire diameter
1.2mm
Labour rate
55 £/hour
Wire feed speed
2m/min
electricity
0.07 £/kwh
Alloy efficiency
65%
Welding wire
80 £/kg
Voltage
13V
Shielding gas
13.2£/cylinder
Current
43A
WAAM machine
£47000
Gas flow rate
16000ml/min
Milling machine
£65000
Welding
deposition rate
37.7 mm3/s
Welding machine
90%
efficiency
Milling
material
262.5mm3/s
removal rate
---
Table 7.3: Cost and GHG emission result of real-world case study 1
WAAM Cost and carbon emission calculation results
GHG from
material
195.701 Setup cost (£) 20.25
(KgCO2e)
GHG from
Net mass (kg)
Material
cost
(£)
electricity
0.041
5.998
(KgCO2e)
Welding
GHG from
Gross mass (kg) 0.075
deposition cost
transportation
6.22
(£)
(KgCO2e)
Electricity
Integrated
GHG from waste
consumption
machining
cost
disposal
0.377
0.524
(kWh)
(£)
(KgCO2e)
Total GHG
Manufacturing
Total cost (£) 32.992
emission
0.469
time (hour)
(KgCO2e)
Shielding gas
(L)
68
1.089
0.186
0.123
0.001
1.399
Traditional manufacturing method for this part is milling or casting. The casting
process also can reduce raw material consumption, and may have cost
advantage in case of large batch production. However, the casting process
relies on tooling (mould, pattern, core box, etc.), while the tooling design and
manufacturing is both time and cost consuming. Obviously it is not suitable for
small batch production. Sometimes the design should be revised frequently and
lead-time is critical, the casting process also shows its disadvantage in this
condition. The milling process is relatively flexible hence they can overcome this
issue and more suitable for small batch production. However, the material
utilization and machining time should be unsatisfactory especially for high buyto-fly ratio components. The product cost comparison among WAAM, casting
and milling was analysed below.
Chougule (2006) developed a casting cost estimation model which is meant for
design engineers who may have limited casting process knowledge to estimate
cost in early design stage accurately. This cost model focus on manufacturing
cost and the total casting cost was divided to 5 elements: tooling, material,
labour, energy and overheads. The casting cost calculated by this model was
listed in Table 7.4.
Table 7.4: Casting cost detail of real-world case study 1
Tooling cost*
£840
Material cost
£3.518
Labour cost
£5
Energy cost
£0.006
Overhead cost
£0.005
* should be amortized over the number of castings produced.
Figure 7.8 is the graph of cost per product vs. the number of components
produced by WAAM and casting process. It can be found that WAAM has
significant cost advantage in case of single or small batch production, while the
casting cost drops rapidly with the increasing of the production quantities. The
cost becomes equal when production quantity is 40, then casting holds the
69
edge. Finally the casting cost is only 1/3 of WAAM when order quantity is over
2000.
Figure 7.8: Cost curves for WAAM and Casting of real-world case study 1
Dewhurst et al. (1988) developed an early cost estimating procedure in product
design stage for machining and injection moulding process. The machining cost
(including machine, labour, tool cost) can be determined without full knowledge
of the manufacturing processing plans. This procedure was utilized to calculate
manufacturing cost by milling here. For the purpose of comparing the cost
between WAAM and milling, the material cost and setup cost were added to
form the entire manufacturing cost of milling. The setup time in this case is
assumed to be as same as it of the WAAM process. Table 7.5 shows the data
used to calculate milling cost.
70
Table 7.5: Data for estimating milling cost in real-world case study 1
Aluminium billet
50 £/kg
Gross mass
0.474 kg
Net shape mass
0.041 kg
Material removal rate
640 mm3/s
Setup time
0.25 hour
Machine cost rate
15 £/hour
Labour rate
55 £/hour
Average electricity consumption
3 kW
The cost for manufacturing this part by milling is £44.29; the overall
manufacturing time is 0.319hour (includes 0.25h setup time). Other cost details
were listed in Table 7.6. The manufacturing time by milling is lower than WAAM
(0.469h) as illustrated in Figure 7.9. This is due to aluminium can reach a high
cutting speed when milling, its material removal rate in this case is 640 mm3 ⁄s.
While limited by the 2mm thin wall thickness when WAAM, the welding
deposition rate is only 37.7mm3 ⁄s in this case. So even though the mass of
removed material in milling is much more than the deposited mass in WAAM
(0.451Kg to 0.075Kg), the overall manufacturing time by milling is still shorter
than WAAM. Hence, it can be found that to reach higher welding deposition rate
is vital for the improvement of WAAM efficiency.
Table 7.6: Cost comparison between WAAM and milling for real-world
case study 1
WAAM
Milling
Material cost
£ 5.998
£ 23.7
Setup cost
£ 20.25
£ 17.5
processing cost
£ 6.744
£ 3.09
Energy consumption
0.377 kWh
0.208 kWh
Total cost
£ 32.992
£ 44.29
manufacturing time
0.469 hour
0.319 hour
71
Figure 7.9: Comparative manufacturing time between WAAM and Milling in
real-world case study 1
Figure 7.10 compares the product cost between WAAM and milling. The overall
cost by WAAM is 74.5% of the cost by milling. While the processing cost and
setup cost of WAAM are higher than milling due to its longer manufacturing time
(WAAM in this case has very low welding deposition rate) and higher machine
depreciation (robot guided CMT welding plus integrated CNC milling). However,
the material cost had a massive reduction by WAAM than by milling, only 1/4
raw material is required by WAAM. Generally speaking, by adopting the WAAM
technology, the product cost can drop down significantly, and large amount of
raw material will be saved which is good for the sustainable development.
Figure 7.10: Cost by WAAM and by Milling of real-world case study 1
72
7.2.2 Real-world Case 2, a titanium part from aerospace industry
The part selected for real-world case study 2 is a complex double side hollow
component which is typical in aircraft frame products. The machining buy –to-fly
ratio is 5. The geometry of this part is shown in Figures 7.11 and 7.12.
The material of this part is titanium alloy Ti-6Al-4V. Due to its light weight and
excellent mechanical properties, this kind of titanium alloy is getting increasingly
applied in aircraft frame structure. However, the price of titanium alloy is
expensive, and the machining rate for Ti-6Al-4V is much lower than aluminium
and steel due to its poor cutting performance. This means when manufacturing
high buy-to-fly ratio titanium parts by machining, the manufacturing time may
becomes very long and the raw material cost can also gets huge. The specific
product cost of WAAM and milling under this condition will be analysed in the
following case study.
Figure 7.11: 3D model for real-world case study 2
73
A
A
A-A
Figure 7.12: Drawing with dimensions of real-world case study 2
The data used for estimating WAAM cost in this case study were listed in Table
7.7. A double sided deposition strategy is applied which requires more setup
time, the setup time for this part is 3 hours for single production. The process is
welding deposition plus integrated milling. The cost and GHG emission result
computed by the cost software tool is shown in Figure 7.13. The total cost is
£1244.69, manufacturing time is 9.569h (includes 3h setup time). The overall
GHG emission is 849.18KgCO2e.
Table 7.7: Process and unit price data for real-world case study2
Process parameters
Unit prices
Wire diameter
1.2mm
Labour rate
55 £/hour
Wire feed speed
1.6m/min
electricity
0.07 £/kwh
Alloy efficiency
89.36%
Titanium wire
170 £/kg
Voltage
10V
Titanium billet
70 £/kg
Current
100A
Shielding gas
154£/cylinder
Gas flow rate
30000ml/min
WAAM machine
£42000
Milling machine
£65000
Welding
deposition rate
30.16 mm3/s
Welding machine
80%
efficiency
Milling
material
55.14mm3/s
removal rate
74
Figure 7.13: Cost and GHG emission result of real-world case study 2
The estimated single production milling cost data of this part were listed in
Table 7.8. The total cost for milling is £2180.083, manufacturing time is 11.76h
(includes 3h setup time). The overall GHG emission is 1669.33KgCO2e.
Detailed cost results compared to WAAM were listed in Table 7.9.
Table 7.8: Data for estimating milling cost in real-world case study 2
Titanium billet
70 £/kg
Gross mass
22 kg
Net shape mass
4.421 kg
Material removal rate
110 mm3/s
Setup time
3 hour
Machine cost rate
15 £/hour
Labour rate
55 £/hour
Average electricity consumption
3 kW
75
Table 7.9: Cost comparison between WAAM and milling for real-world
case study 2
WAAM
Milling
Material cost
£ 641.189
£ 1540
Setup cost
£ 239.518
£ 210
processing cost
£ 363.978
£ 430.083
Energy consumption
15.533 kWh
26.287 kWh
Total cost
£ 1244.69
£ 2180.083
manufacturing time
9.569 hour
11.76 hour
GHG emission
849.177 kgCO2e
1669.33 kgCO2e
Further cost comparison was illustrated in Figure 7.14. The overall cost by
WAAM is only 57% of the cost by milling. Both the processing cost and the
material cost are lower than milling, this is because the shorter manufacturing
time and much lower raw material consumption of WAAM. From the case study,
it can be obviously found that the WAAM technique will become attractive over
traditional machining methods in case of the component has low machining rate,
high material price and high buy-to-fly ratio.
Figure 7.14: Cost by WAAM and by Milling of real-world case study 2
76
Figure 7.15: GHG comparison between WAAM and Milling
The GHG emission was compared in Figure 7.15, it can be seen that the
primary GHG emission comes from raw material. The other factors are relatively
negligible. As the WAAM technique can significantly reduce raw material
consumption, so the amount of GHG emission also can be significantly reduced
by WAAM. In this case study, the GHG emission amount by WAAM is 55.7% of
it by milling. Therefore, the WAAM technique is more environmental friendly and
can well meet the requirement of industrial sustainable development.
7.3 Interactive session and experts judgements
The initial capacity and reliability of this integrated cost software tool were
demonstrated through case study 1 and validated with WAAM experts. Then
after two real-world components case study, further validation exercises were
conducted through an interactive session. The attendees of the interactive
session including welding and machining experts involved in the ongoing
WAAM research project, college experts works in cost and manufacturing areas,
postgraduate researchers from manufacturing and decision engineering
department, other industry expert, etc. Figure 7.16 indicates the background of
the validation session attendees.
77
Figure 7.16: The background of the validation session attendees
At the validation session, the author presented his entire work first, including the
context of the project, the cost model framework, detailed equations, integrated
software tool and case studies. Then the author demonstrated the operation of
the software tool. Thereafter, they both went through discussion and interaction.
Meanwhile, a validation questionnaire is distributed to the experts to collect their
feedback and judgement for the capacity and reliability of the proposed model.
The questions includes: Q1, the adequacy and rigor of the cost framework; Q2,
the rationality of the cost equations; Q3, the function of the software tool; Q4,
the convenience and efficiency of the software tool; Q5, the accuracy of the cost
and carbon emission results. The experts were required to assign a score from
0 to 5 for these questions, where 5 means very satisfied and 0 means not
satisfied at all. For each question, if the score is over 3, it indicates the
corresponding factor is validated. Figure 7.17 shows the validation result, the
entire validation questionnaire was presented in appendix C.
Figure 7.17: Cost model validation result
78
Through case studies and expert judgement, the validation of this project was
successfully conducted. The validation result indicated the capacity and
reliability of the integrated cost software tool. It is applicable for the estimation of
WAAM cost and GHG emission and the results match the experimental data.
Several suggestions and recommendations were also given by the experts,
such as revise the comparison with other alternative manufacturing methods,
the cost details need to be clarified, further fill the database with process
parameters for more features, etc.. Finally, most of them have been
implemented by the author.
79
8 Discussion and Conclusions
8.1 Discussion of research findings
The main research findings from literature review, industry survey, model
development, software design and case study will be discussed in this section.
8.1.1 Literature review
The state of the art of The WAAM technique and its key features were studied.
The WAAM is a CNC and welding deposition based additive manufacturing
technique. It has potential cost and environment advantage as an ideal
alternative for industrial sustainable development. The specific welding
technique and process parameters vary with the manufactured features.
Various product cost estimation theories were analysed, the value of carrying
out precise cost estimation during product design stage was recognised. The
variant-based methods which belong to analytical cost estimation techniques
are suitable for early cost estimation purpose. The anthropogenic global
warming is a serious impact to environmental, while the industrial processes are
one of the major contributions. Therefore, it is essential to implements GHG
emission assessment for specific manufacturing process. Existing GHG
emission measurement methodologies proposed in PAS2050 can be applied for
WAAM. Literatures regarding cost estimating for conventional manufacturing
techniques can be easily found while little researcher focused on cost
estimation for WAAM techniques.
The literature review assisted the author to obtain the essential knowledge
related to the research subject. The research gap and initial WAAM cost
modelling approach were also identified from the literature review.
8.1.2 Industry survey
In order to obtain information of the WAAM process and collect feedback on the
initial feature based cost model framework, an industry survey was carried out
through questionnaire and expert interview. The WAAM process map, cost
80
breakdown structure and cost drivers were established according to literature
and then verified by the WAAM experts. A five-step cost model framework was
also developed based on the CBS and cost drivers. It was used to guide the
development of the detailed cost equations latter. The WAAM process detail
and parameters, equipments, consumptions were explored and recorded for the
database development.
Meanwhile, the geometrical features that can be
manufactured by WAAM were identified. A setup time estimation approach was
also developed with the WAAM expert and therefore solved the issue of
determining the setup time in the product design stage.
8.1.3 Model development
A systematic definition for the WAAM manufacturing features was determined;
the WAAM manufacturing features were defined as a combination of main
feature (geometrical feature), sub-feature (intersections among main features),
wall thickness and material. The process parameters encapsulated in
manufacturing features were also determined for the development of cost
database. Then a set of detailed cost equations were developed to bridge the
user available data and the cost framework. The methodology for GHG
emission assessment was selected from relevant standard. According to the
proposed GHG estimation approach, the cradle-to-gate process map of WAAM
products was identified. Then the activities included in the GHG estimation
system were filtered and streamlined according to the system boundary
definition guideline of the standard. The final WAAM GHG estimation boundary
includes GHG from material and energy consumption, transportation, waste
disposal. All the required activity data and GHG emission factor data were
collected for the actual calculation as well.
8.1.4 Software tool design
The proposed WAAM cost and GHG emission model were implemented in an
integrated software tool. It was built by using Visual Basic 6.0 with Microsoft
Access database support. The design of an independent backend database
makes all the data such as process parameters and material unit prices can be
81
conveniently edited or added. In order to minimise the operation time, this
software comes with a CAD data automatically access program module which
can improve the parameter input efficiency significantly. Moreover, this software
tool has multifunction such as edit backend database and save result as
independent spreadsheet for the user’s convenience. A significant aspect of
this software tool is that it can eliminate time consuming manual labour and
obtain a very quick and precise cost result.
8.1.5 Case study and validation
The integrated cost software tool was applied in the case study to calculate cost
and GHG emission for 3 different WAAM components. The first case is a
sample WAAM structure which is chosen for demonstrating the use and
functions of the cost software tool. The result indicated the simplicity and the
ease of use of this software. The cost and GHG emission can be estimated in
minutes with little manual labour. The result was also proved by the WAAM
experts to be matching with the empirical material consumption and cost results.
Furthermore, two real-world components from automotive and aerospace
industry were used in the following two case studies.
The accuracy and
applicability for the cost estimation of real-world WAAM products were further
validated through an interactive validating section. The cost and GHG emission
results of WAAM were compared with other manufacturing methods as well.
The comparison revealed that WAAM has significant cost advantage to casting
in case of single or small batch production, while casting still holds the edge in
large batch production. WAAM should become attractive over milling in case of
the component has low machining rate, high material price and high buy-to-fly
ratio. Moreover, the WAAM technique can significantly reduce raw material
consumption and the GHG emission amount. Therefore, WAAM is more
environmental friendly and can well meet the requirement of industrial
sustainable development.
82
8.2 Research contributions
Based on the findings discussed in chapter 8.1, the research contributions of
this project were summarized as follows:
The proposed feature based cost model framework is a novel approach for the
WAAM cost assessment. It provides a feasible way for the design engineers
and decision makers to assess the manufacturing cost in product design stage
without demand of detailed process data. A series of WAAM cost equations
were developed which considered more process details than former ones, so
more accurate cost estimation can be achieved.
The study of WAAM GHG estimating system boundary clarified the GHG
emission related activities of WAAM. A specific GHG quantification procedure
for WAAM which is accordance with the guideline of PAS 2050 was established.
Detailed WAAM GHG emission data can be calculated out through this
procedure.
The proposed cost and carbon emission model were implemented in an
integrated software tool. The geometry data of the WAAM parts is automatically
captured from CAD model. The backend database can be easily updated to
make the software handling more features in future. Due to its high efficiency
and easy operation, only by a three-step-option with little manual labour, the
cost and GHG emission can be estimated conveniently.
The cost and GHG emission results were compared with other competitive
manufacturing methods. The most suitable situation for adopting WAAM was
indicated.
8.3 Research limitations
This research project also has several limitations. They are discussed in the
following paragraphs.
The WAAM technique is not yet widely applied in practice. The quality
inspection procedure for WAAM products is not standardised. Therefore, no
quality inspection cost was considered in this cost model.
83
To obtain the precise net shape, most WAAM products need finish machining
process. However, limited by the research time, the major effort was used on
welding deposition cost equation development. A simplified cost approach was
chosen for integrated machining, the cost result may deviates from the actual
value in some extreme conditions.
The cost of substrate in this project only takes material cost into account.
Although this is approved by WAAM experts the actual substrate cost do
contain energy, labour and machine cost. Therefore, the substrate cost
calculation method in this project is not accurate enough.
The cost model and software tool were designed to handle all the features
defined in section 4.5. But only the data of process parameters for vertical wall
with different material and wall thickness were sufficient in the database. More
data for other geometry features are required for the database.
In order to reduce manual input, the cost software was designed with the ability
of capturing CAD model data automatically. However, there are several
limitations in this aspect. For instance, the CAD model must fulfil certain criteria
first, and the feature identification for the CAD subcomponents had to be
conducted manually.
8.4 Future work
According to the research limitations and the expected development of WAAM
technique, the future work could be performed on the following aspects:
Update the process parameters for more features and materials. Add machine
deprecation, unit price data for different region and companies.
Revise the integrated machining cost calculation method. Take the influence of
the part’s size and geometry complexity to the material removal rate into
account.
Investigate the quality inspection activities of WAAM. Develop a cost estimating
method for WAAM quality inspection process.
84
Add a function of cost comparison between different WAAM features or
manufacturing strategy to further assist the design engineer optimising product
design from cost reduction point of view.
Integrate the cost estimation software tool to a comprehensive designmanufacturing software system. Where the product design, process planning,
tool path programming and cost estimation can be carried out cooperatively.
8.5 Conclusions
In this project, a feature based cost estimation model and specific GHG
emission model were developed for the wire and arc additive manufacturing
process. The overview of the research context, CBS, cost drivers and the
essential data for cost modelling were obtained from Literature review and
industry survey. The proposed cost and GHG model were implemented in an
integrated software tool. With the ability to directly capture geometry data from
CAD file, the cost software is efficient and convenient. Three case studies were
carried out in this research project to demonstrate the integrated cost software
tool. The cost comparisons with other conventional manufacturing methods
were also discussed in case study. The calculated cost results in case study
were examined by experts. The experts’ judgement confirmed the accuracy and
applicability of this integrated cost software tool. The implementation of the
research outcomes of this project can achieve accurate early cost estimation for
WAAM conveniently. Moreover, it can clarify the cost and environment
advantage of WAAM and assist to identify the most suitable situation for
adopting WAAM form cost and sustainable point of view. Other conclusion
regarding the comparative cost analysis are WAAM should become attractive
over conventional machining in case of the component has low machining rate,
high material price and high buy-to-fly ratio. The WAAM technique can
significantly reduce raw material consumption and the GHG emission amount.
85
REFERENCES
Allen, J. (2006), An Investigation into the Comparative Costs of Additive
Manufacture vs. Machine from Solid for Aero Engine Parts,RTO-MPAVT-139, RTO, Neuilly-sur-Seine,France.
Asiedu, Y. and Gu, P. (1998), "Product life cycle cost analysis: State of the art
review", International Journal of Production Research, vol. 36, no. 4, pp.
883-908.
British Standard Institution. (2011), PAS 2050: 2011 Specification for the
assessment of the life cycle greenhouse gas emissions of goods and
services, BSI, UK.
British Standard Institution. (2011), Guide to PAS 2050 How to assess the
carbon footprint of goods and services, BSI, UK.
Curran, R., Raghunathan, S. and Price, M. (2004), "Review of aerospace
engineering cost modelling: The genetic causal approach", Progress in
Aerospace Sciences, vol. 40, no. 8, pp. 487-534.
Chayoukhi, S., Bouaziz, Z., Zghal, A. (2009), "COSTWELD:a cost estimation
system of welding based on the feature model", Advances in production
engineering and management, vol. 2009, no. 4, pp. 263-274.
Chougule, R. G. and Ravi, B. (2006), "Casting cost estimation in an integrated
product and process design environment", International Journal of
Computer Integrated Manufacturing, vol. 19, no. 7, pp. 676-688.
Deherka, R. (2010), STUDY OF BUILDING HORIZONTAL AND INCLINED
WALLS USING ADDITIVE LAYER MANUFACTURE (unpublished MSc
thesis), Cranfield University.
DECC and DEFRA (2012), 2012 greenhouse gas conversion factors for
company reporting (pb13773), available
at: http://www.defra.gov.uk/publications/2012/05/30/pb13773-2012-ghgconversion/ (accessed 25/01/2013).
87
Dewhurst, P. and Boothroyd, G. (1988), "Early cost estimating in product
design", Journal of Manufacturing Systems, vol. 7, no. 3, pp. 183-191.
Ding, J., Colegrove, P., Mehnen, J., Ganguly, S., Almeida, P. M. S., Wang, F.
and Williams, S. (2011), "Thermo-mechanical analysis of Wire and Arc
Additive Layer Manufacturing process on large multi-layer parts",
Computational Materials Science, vol. 50, no. 12, pp. 3315-3322.
Hammond, G. P. and Jones, C. I. (2008), "Embodied energy and carbon in
construction materials", Proceedings of Institution of Civil Engineers:
Energy, vol. 161, no. 2, pp. 87-98.
Humphreys, K.K. (2005), Project and Cost Engineer’s Handbook, 4th ed.,
Marcel Dekker, New York.
IPCC (2001), IPCC Third Assessment Report: Climate Change 2001 (TAR),
available
at: http://ipcc.ch/publications_and_data/publications_and_data_reports.s
html#.UQdAkme8qNE (accessed 25/01/2013).
Jung, J. (2002), "Manufacturing cost estimation for machined parts based on
manufacturing features", Journal of Intelligent Manufacturing, vol. 13, no.
4, pp. 227-238.
Khangura, K. (2010), Cost and Environmental Aspects of RUAM (unpublished
MSc thesis), Cranfield University, Cranfield.
Kazanas, et al. (Cranfield University), (2011), Design for Wire And Arc Additive
Layer Manufacture (unpublished report), Cranfield.
Karunakaran, K. P., Suryakumar, S., Pushpa, V. and Akula, S. (2010), "Low
cost integration of additive and subtractive processes for hybrid layered
manufacturing", Robotics and Computer-Integrated Manufacturing, vol.
26, no. 5, pp. 490-499.
Kashoob, T. A. A. (2011), The effects of direct rolling on the residual stress,
distortion and geometry of ALM welded structures using thermomechanical models (MSc thesis), Cranfield University, Cranfield.
88
Leinonen, M. (2011), Additive‐Layer‐Manufacturing by CMT using Cu97Si3
wire on steel (unpublished MSc thesis), Cranfield University.
Levy, G. N., Schindel, R. and Kruth, J. P. (2003), "Rapid manufacturing and
rapid tooling with layer manufacturing (LM) technologies, state of the art
and future perspectives", CIRP Annals - Manufacturing Technology, vol.
52, no. 2, pp. 589-609.
Mehnen, J., Ding, J., Lockett, H., Kazanas, P. (19th-21st April 2010), "Design
for Wire and Arc Additive Layer Manufacture", in Alain Bernard (ed.)
Global Product Development: Proceedings of the 20th CIRP Design
Conference, Ecole Centrale de Nantes, Nantes, France, 19th-21st April
2010, , pp. 721-727.
Mehnen J & Trautmann H. (2008) Robust Multi-objective Optimisation of Weld
Bead Geometry for Additive Manufacturing. In: ICME 2008 Intelligent
Computation in Manufacturing Engineering, ISBN 978-88-900948-7-3, pp.
419-424, Naples, Italy, 23 - 25 July 2008.
Martina, F. (2010), Study of the benefits of plasma deposition of Ti-6Al-4V
structures made by additive layer manufacture (unpublished MSc thesis),
Cranfield University, Cranfield.
Niazi, A., Dai, J. S., Balabani, S. and Seneviratne, L. (2006), "Product cost
estimation: Technique classification and methodology review", Journal of
Manufacturing Science and Engineering, Transactions of the ASME, vol.
128, no. 2, pp. 563-575.
Nathan, S., Excell, J. (2010), "Additive Manufacturing: Dream machines ", The
Engineer, 22-26.
NASA
(2008),
at:
NASA
Cost
Estimating
Handbook,
available
http://www.nasa.gov/pdf/263676main_2008-NASA-Cost-Handbook-
FINAL_v6.pdf (accessed 30/10/2012).
Ou-Yang, C. and Lin, T. S. (1997), "Developing an integrated framework for
feature-based early manufacturing cost estimation", International Journal
of Advanced Manufacturing Technology, vol. 13, no. 9, pp. 618-629.
89
Root, T. L., Price, J. T., Hall, K. R., Schneider, S. H., Rosenzweig, C. and
Pounds, J. A. (2003), "Fingerprints of global warming on wild animals
and plants", Nature, vol. 421, no. 6918, pp. 57-60.
Roy, R. (2003), COST ENGINEERING: WHY, WHAT AND HOW? ISBN 1861940-96-3, Cranfield University, Cranfield.
Shah, J. J. (1991), "Assessment of features technology", Computer-Aided
Design, vol. 23, no. 5, pp. 331-343.
Shehab, E. M. and Abdalla, H. S. (2001), "Manufacturing cost modelling for
concurrent product development", Robotics and Computer-Integrated
Manufacturing, vol. 17, no. 4, pp. 341-353.
Shehab, E. and Abdalla, H. (2002), "An intelligent knowledge-based system for
product cost modelling", International Journal of Advanced Manufacturing
Technology, vol. 19, no. 1, pp. 49-65.
Shettigar, K. B. (2010), Feature based model for RUAM cost modelling and
comparative cost analysis (unpublished MSc thesis), Cranfield University,
Cranfield.
Stewart, R., Wyskidsa, R., and Johannes, J. (1995), Cost Estimator’s Reference
Manual, 2nd ed., Wiley Interscience.
Singh, G. (2010), Study of Cold Metal Transfer (CMT) and hybrid laser-CMT
processes for the welding of aluminium 2XXX alloy for advanced
aerospace applications (unpublished MSc thesis), Cranfield University, .
Tipaji, P. K., Allada, V. and Mishra, R. (2008), "A cost model for the Metal Inert
Gas (MIG) welding process", ASME International Design Engineering
Technical Conferences and Computers and Information in Engineering
Conference, IDETC/CIE2007, Vol. 4, 4-7 September 2007, Las Vegas,
NV, pp. 751.
Wohlers, T. (2010), "Developments in additive manufacturing", Manufacturing
Engineering, vol. 144, no. 1.
Wilson, A. (2010), "Airlines could save $300bn with laser manufacturing", The
90
telegraph, Feb 5th 2010.
Williams.
(Cranfield
University),
(undated),
(unpublished conference slide), cranfield.
91
WAAM
process
features
APPENDICES
Appendix A Industry Survey Questionnaire
INDUSTRY SURVEY QUESTIONNAIRE ON COST
ASSESSMENT FOR WIRE AND ARC ADDITIVE
MANUFACTURING
Introduction: The purpose of this questionnaire is to collect feedback on a
feature based cost model framework (attached in this questionnaire) and obtain
information on the WAAM process. This work is part of an MSc by Research
study entitled “Feature Based Cost and Carbon Emission Modelling for Wire
and Arc Additive Manufacturing” undertaken at Cranfield University.
Disclaimer: Your response will be treated in the strictest confidence.
Respondents’ names will not be disclosed nor identified in the research report.
Please be assured that the information provided will only be used for academic
and research purposes and will not be passed to a third party.
Contact Details
Jianing Guo
Department of Manufacturing and Materials
School of Applied Sciences
Cranfield University, Cranfield
Email: [email protected]
92
Interviewee Details: (or attach your business card)
Name:
Job Title:
Organisation:
Email:
Years of Experience
Thanks for taking part in this research. This questionnaire consists of three
parts, part one is cost model framework review and part two is WAAM process
information collection, while part three is questions about complex index of the
WAAM products. The questionnaire can be finished no more than half an hour.
Before you answer the questions, please read the appendix first. In which the
WAAM process map, cost breakdown structure and the cost model framework
was presented.
93
Part 1, cost model framework review
Q.1 How adequate do you think the WAAM process map, cost breakdown
structure (CBS) and cost driver can represent the actual WAAM
process activities and cost elements? Please assign a score from 0 to
5, where 5 means very adequate and 0 means not adequate at all.
Your answer:
Suggestions for the improvement of the WAAM process map, CBS and cost
driver:
Q.2 How rigorous is the cost model framework? Please assign a score
from 0 to 5, where 5 means very rigorous and 0 means not rigorous at
all.
Your answer:
Comments on making this framework more rigorous:
Q.3 Do you think the cost model framework considered all the necessary
cost items? If not, please provide items should be taken into account.
Your answer:
94
Part 2, the WAAM process information collection
Q.4 Considering the current research status, how many features do you
think have sufficient experimental data for cost assessment? Please
select from the list below. (You can also refer to appendix 1: the
WAAM Feature Taxonomy).
A vertical wall (liner), B vertical wall (curved), C inclined wall (30°to 90°), D
inclined wall (0°to 30°), E inclined wall (curved), F horizontal wall, G
vertical wall intersections, H angled wall intersections, I curved wall
intersections, J ‘T’ intersections, K mid-span wall connections, L edge wall
connections, M cladding
Your answer:
Q.5 Do you think the wall thickness should be taken as sub-feature for the
feature based cost model?
Your answer:
YES/NO*
*(please delete as appropriate)
If yes, please provide the dipartition of wall thickness range step (e.g. 1mm
per step):
If no, please give the reason you considered:
Q.6 How many activities are included in the WAAM set up process?
Please list:
95
Q.7 Before deposition, a substrate should be cut. What method is used for
substrate cutting? What factors do you think should be considered for
substrate cutting cost assessment?
Q.8 If the substrate needs to be recycled for next deposition, what method
is used for substrate recycling? What factors do you think should be
considered for recycling cost assessment?
Q.9 “Alloy Efficiency” is a term used to describe the ratio between net
shape weight (after removing surface roughness by machining) and
gross weight (initial deposited weight). From literature, it is affected by
the surface roughness, top layer edge fillet, support layer for inclined
wall (see pictures below). Is there any other factor (especially for wall
intersections and wall connections) do you think should be
considered for estimating alloy efficiency?
Your answer:
96
Q.10 Apart from wire feed speed (WFS), the tool path strategy also
influences the build rate. This influence is primarily comes from nondeposition time (e.g. torch moves from one layer end point to next
layer start point without welding deposition). Please give the ratio
between actual deposition time and gross build time of each feature
(for Continuous welding track this ratio is 1, otherwise it will less than
1).
Your answer:
Q.11 During deposition, what is the relationship among layer width, layer
height and total layer numbers?
Q.12 Please provide the proper wall thickness that can be manufactured
by WAAM. If this value varies with material or feature, please list them
respectively.
Minimum wall thickness:
maximum wall thickness:
Q.13 Individual parts with a small area but large mass (i.e. tall) are difficult
to build by WAAM due to heating of the component. Please provide
the height/area ratio suitable for WAAM. If this value varies with
material or feature, please list them respectively
Maximum height/area ratio:
97
Q.14 How many WAAM machines were developed currently? Please list
their constitution, capability and price respectively.
Part 3, Complex index of the WAAM products
The “complex index” is used to describe the geometrical complexity of a
product. From simple to complex, the WAAM products are divided into
four complex levels: low, medium, high, very high. This complex index is
used to assess the setup time before welding deposition and the material
removal rate of post machining. Each complex level will corresponding to
a correction factor, the general setup time and material removal rate of
medium-complex WAAM product will be used as a benchmark, the setup
time and material removal rate of other complex level can be calculated by
using the benchmark multiply the correction factor.
The definition of complex level:
Low: only one independent feature.*
Medium: several
connections. *
independent
features,
no
intersections
and
High: several features with intersections and/or connections between
each other.*
Very high: products need to be deposited on both side of the substrate
(a turntable is required to fix the substrate).
* If the product has a large size (>1.5 meter long), the complex index will
increase to next higher level.
98
Q.15 How reasonable do you think the definition of complex level is?
Please assign a score from 0 to 5, where 5 means very reasonable and
0 means not reasonable at all.
Your answer:
Suggestions for the improvement of the complex level definition:
Q.16 Please give the general setup time and material removal rate of
medium-complex WAAM products
Setup time before welding deposition:
Material removal rate of post machining:
Q.17 Please fill the following form to give the correction factor of each
complex level
Complex level
Set up time
correction factor
Material removal rate
correction factor
1
1
Very high
high
medium
low
This is the end of questionnaire, thanks again for your participation.
99
Appendix B Software user Manual
Instruction
This integrated cost software tool was designed to implement the featured
based cost and carbon emission model. With the input of CAD model of a
specific WAAM component, the software tool can automatically compute out the
detailed material consumption, manufacturing time, manufacturing cost and
GHG emission. No other process parameters were required when using this
software tool (they have been stored in the backend database in advance). This
user manual aims to give a detailed instruction on the function and operation of
this integrated cost software tool
Before you start
This software tool consists of 3 files: a main program, a database and a cost
report template. The user should keep these three files in same path. It is highly
recommended to put these files in an independent folder in your hard disk.
Please note some temporary files will be generated during processing, therefore
if the main program file path is read only, e.g. stored on a CD, the software will
not work correctly. To run this software you also need CATIA V5 R18 (or higher
version) and Microsoft Office 2007(or higher version) installed in your computer.
The CAD model can be identified by this software tool do need to be drawn
under some agreed order first (this means not any CATIA CAD model can be
correctly identified). The rules for drawing the CAD model are it must be
a .CATPart formatted file, only one part body is permitted in one file, each
WAAM feature should be drawn respectively by using the CATIA "sketch-based
features" tool, only "pad" "rib" "shaft" will be processed by this program, the
CAD model can contain "dress-up features" such as chamfer or fillet but it will
be ignored when processing, the wall thickness and height must be marked out
in the sketch of each feature by using the "length constraint" tool, material
property should be added in the CATIA CAD model in advance as well.
Otherwise the software may capture wrong data from the CAD model. However,
100
the user still has an opportunity to check and edit these data when the software
shows the "CAD model data verification page".
Calculate cost
The main program of this software is an .exe file, double chick the icon to start
the program. A welcome page will display when program started (see Figure1).
This page provides two options: calculate cost or edit database, click the
“calculate cost” will lead you to carry out cost calculation function.
Figure 1: Welcome page
The user needs a three step operation to finish the product cost calculation. The
first step is to select the CAD file on the “CAD model select page” which is
shown in Figure 2.
Figure 2: CAD model select page
On this page, click the “click me to select CAD model file first”, then you can
select CAD file through a dialogue window. After that, you need to input the
101
product batch size, select complex index and finish machining method form the
drop-down list. When finish this, click “connection”. If you want to return to
welcome page, click “Return”.
The backend database name is also listed on this page, if the database file
name or password were changed you can click the database name on this page
to input new file name and password.
Figure 3: CAD file connection progress bar
The “connection” button is only enabled when CAD file was selected. After click
this button, a progress bar will show to indicate the data connection progress
(Figure 3). Then the captured data will be listed on “CAD model data verification
page”, where you need to carry out the second step operation.
Figure 4: CAD model data verification page
Figure 4 shows the CAD model dada verification page; you need to select the
main feature and sub-feature (light yellow area) manually for each section of the
component. The features displayed in the drop-down list depend on the feature
102
types stored in the backend database. For some hybrid products you may
assign “substrate” as a feature, in this condition the data display for the
substrate section will change (Figure 5), and you need to input the utilization
rate of the substrate additionally.
Figure 5: Data input box for substrate features (yellow area)
Other data listed on this page were automatically captured from the CAD file;
you do not need to change them in most conditions. However, if the CAD model
is not fully match the drawing rules then some data may go wrong. If this
happens, you can manually check and trim them. When all data were confirmed,
click “confirm” to finish this operation.
When “confirm” button was clicked, the software will automatically execute the
final step: calculate and display the results. If the required data for calculation is
incomplete a message box will show to notice you to check them. Meanwhile, a
progress bar will indicate the calculation progress as well. Figure 6 is the result
display page where all the results are listed on. You can click “save” button to
save this result as a MS Excel formatted file, or click “return” to execute another
calculation, or click ”exit” to quit this program.
Figure 6: Result display page
Edit database
103
This WAAM cost software tool use a backend database to store the process
parameters, unit prices, machine information and GHG emission data which
were required for calculating the product cost and
GHG emission. The
database is an independent MS Access formatted file. You can directly open
and edit it by using MS Access software. Please aware that the name of the
data form and data record were not allowed to change. You do can change the
database name and password, whilst once you did this you have to change
them in the cost software as well.
As an alternative, you can edit these data by using the “edit data” function
provided by the cost software tool itself. To execute this operation, you need to
choose “edit data” function from the welcome page, and then the software will
lead you to the database edit page. You have to input the database password
first before you can check and edit the database (Figure 7).
Figure 7: Password input box
The confirm button will be enabled when you inputted the password, and then
the data will be displayed in 4 tabs, each tab corresponds to a data form of the
database. Figure 8 shows the database display page.
Figure 8: Database display page
104
On this page, you can click the “edit” button to enable the data edit function.
Once the “edit” button becomes dark, it indicates the data is editable; you can
directly edit the data from the data table. If you want to delete a whole record,
use the black arrow on the left of the table to select the row you want to delete,
and then click “delete”. In order to prevent disoperation, the software will show a
message box to make sure you want to delete the record. If you want to add a
new record you can just add it at the end of the table where you will find a blank
row indicated by a “*” sign. You can change the data form to be edited by switch
the tabs. When edit data is completed, click “return” button, then you will return
to the welcome page.
105
Appendix C Questionnaire for cost model validation
QUESTIONNAIRE ON COST MODELLING FOR WIRE
AND ARC ADDITIVE MANUFACTURING
Introduction: The purpose of this questionnaire is to collect feedback for a
feature based cost model and software tool design project. The result will be
used to evaluate and validate the research achievement.
Contact Details: Jianing Guo, Department of Manufacturing and Materials,
School of Applied Sciences, Cranfield University, Cranfield.
Email: [email protected]
Interviewee Details: (or attach your business card)
Name:
Job Title:
Organisation:
Email:
Years of Experience
Disclaimer: Your response will be treated in the strictest confidence.
Respondents’ names will not be disclosed nor identified in the research report.
Please be assured that the information provided will only be used for academic
and research purposes and will not be passed to a third party.
Thanks for taking part in this research. This questionnaire consists of 5
questions which are lists on the next page.
106
Please assign a score from 0 to 5 to the questions listed below, where 5
means very satisfied and 0 means not satisfied at all.
Q.1 How adequate and rigorous do you think the cost model framework can
represent the actual WAAM product cost?
Your answer:
Q.2 How reasonable do you think the cost model equations are?
Your answer:
Q.3 To what extent do you think the cost software is functional enough for
WAAM cost and GHG emission calculation?
Your answer:
Q.4 How convenient and efficient do you think the cost software is?
Your answer:
Q.5 How accurate do you think the cost and GHG emission result of the case
study is?
Your answer:
If any score of these questions above is under 3, please list the reason and
give your suggestion for improvement.
This is the end of questionnaire, thanks again for your participation.
107
Appendix D List of collected data for cost estimation
GHG emission data:
ID
Item
Figure
Unit
1 electricity
freight
2 transportation
0.49 KgCO2e/kWh
3 waste disposal
21.00 KgCO2e/Tonne
Comments
DataSource
emission factor
DEFRA
0.64 KgCO2e/TonneKm emission factor
DEFRA
emission factor
DEFRA
1.06 KgCO2e/£
emission factor
DEFRA
11.20 KgCO2e/Kg
emission factor
ICE
11.50 KgCO2e/Kg
emission factor
ICE
7 steel wire
2.83 KgCO2e/Kg
emission factor
ICE
8 steel plate
3.19 KgCO2e/Kg
emission factor
ICE
9 titanium wire
1.07 KgCO2e/£
emission factor
DEFRA
10 titanium plate
metal material
transportation
11 distance
shielding gas
transportation
12 distance
waste
transportation
13 distance
1.07 KgCO2e/£
emission factor
DEFRA
500.00 Km
activity data
testdata
100.00 Km
activity data
testdata
100.00 Km
activity data
testdata
4 shielding gas
aluminium
5 wire
aluminium
6 plate
Machine information:
ID
Category
2
CMT
machine
TIG
machine
3
wire feeder
1
4
5
robot
milling
machine
Model
FANUC
ARCMate12
0iB
Cost (GBP) AveragePo Depreciatio MachineUti Comment
werConsu
nYear
lization(%)
s
mption(kW
)
20000
5
70
15000
5
70
2000
5
70
25000
1
5
70
65000
3
5
70
108
test data
6
grinding
machine
100000
3
5
70
47000
1
5
70
test data
for
aluminu
m and
steel
42000
1
5
70
for
titanium
CMT+ROB
OT
7
WAAM
TIG+ROB
OT
8
WAAM
Unit price information:
ID
Item
Price
Unit
Comments
1
labour rate
55
£/hour
from EADS
2
electricity
1.2mm aluminium
wire
0.0725
£/kWh
80
£/kg
4
1.2mm steel wire
5
£/kg
5
1.2mm titanium wire
170
£/kg
from DECC
welding wire
2319
welding wire
mild steel
welding wire
Ti6Al4V
6
aluminium plate
50
£/kg
7
steel plate
4.5
8
titanium plate
70
9
pure argon
13.2
3
12 80%argon+20%CO2
18.78
13 50%argon+50%helium
154
substrate 2319
substrate mild
steel
substrate
£/kg
Ti6Al4V
85kg, size
£/cylinder
W,230bar,11m3
85kg, size
£/cylinder
W,230bar,11m3
87kg,size
£/cylinder
L,230bar,11m3
£/kg
Welding deposition data:
WallThickn WireDiame WireFeedSpe AlloyEffici Voltage
ess(mm)
ter(mm)
ed(m/min)
ency(%)
(V)
Current
(A)
ID
Feature
Material
1
Vertical
Wall
aluminium
2.00
1.20
2.00
65.00
13.00
43.00
2
Vertical
Wall
aluminium
3.00
1.20
3.00
78.00
13.00
45.00
3
Vertical
Wall
aluminium
4.00
1.20
3.70
90.00
12.00
60.00
4
Vertical
Wall
aluminium
5.00
1.20
4.00
90.00
12.50
75.00
109
5
Vertical
Wall
aluminium
6.00
1.20
4.20
88.00
12.50
79.00
6
Vertical
Wall
aluminium
7.00
1.20
4.70
91.00
13.50
87.00
7
Vertical
Wall
aluminium
8.00
1.20
4.80
92.00
13.90
90.00
8
Vertical
Wall
steel
2.00
1.20
2.01
93.72
9.85
56.07
9
Vertical
Wall
steel
3.00
1.20
3.84
94.67
11.33
75.78
10
Vertical
Wall
steel
4.00
1.20
8.43
93.25
14.11
112.27
11
Vertical
Wall
steel
5.00
1.20
3.84
93.68
11.33
75.78
12
Vertical
Wall
steel
6.00
1.20
10.78
92.12
14.86
144.38
13
Vertical
Wall
steel
7.00
1.20
13.01
92.78
18.33
177.13
14
Vertical
Wall
steel
8.00
1.20
6.13
86.49
11.86
92.61
15
Vertical
Wall
titanium
3.00
1.20
3.00
89.19
61.64
12.15
16
Vertical
Wall
titanium
4.00
1.20
6.00
89.36
109.87
13.63
17
Vertical
Wall
titanium
5.00
1.20
8.00
87.93
120.78
14.23
18
Vertical
Wall
titanium
6.00
1.20
8.00
87.93
120.78
14.23
19
Vertical
Wall
titanium
7.00
1.20
1.60
89.36
10.00
100.00
20
Vertical
Wall
titanium
8.00
1.20
8.00
87.93
120.78
14.23
110