1
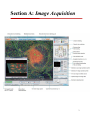
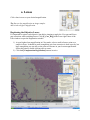
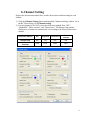
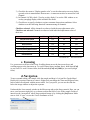
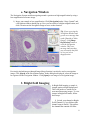
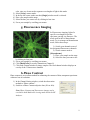
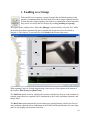
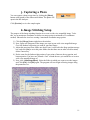
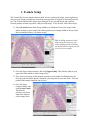
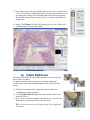
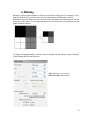
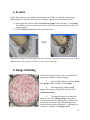
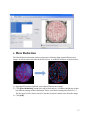
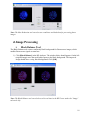
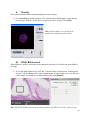
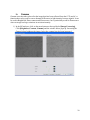
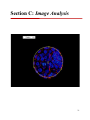
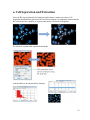
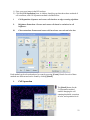
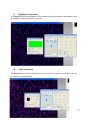
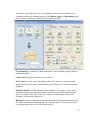
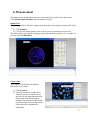
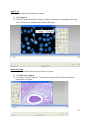
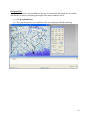
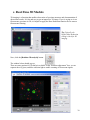
BZ-9000
Software Training
1
BZ-9000 Software Training
Table of Contents
A. Image Acquisition
a. Lenses
b. Channel Setting
c. Focusing
d. Navigation
e. Navigation Window
f. Bright field Imaging
g. Fluorescence Imaging
h. Phase Contrast
i. Loading as a Group
j. Capturing a Photo
k. Image stitching Setup
l. Z-stack Setup
m. Quick Full Focus
n. Binning
B. Image Modification
a. Z-stack
b. Image Stitching
c. Haze Reduction
d. Image Processing
i. Black Balance Tool
ii. Overlay
iii. White Balance Tool
iv. Gamma
C. Image Analysis
a. Cell Separation and Extraction
i. Cell Separation
ii. Brightness Extraction
iii. Color Extraction
b. Measurement Tools
c. Real-Time 3D Module
4
6
7
7
8
8
9
9
10
11
11
12
13
14
16
16
17
18
18
19
19
20
22
23
24
24
27
30
2
Section A: Image Acquisition
3
a. Lenses
Click a lens icon to set your desired magnification.
Tip: Start at low magnification to image samples
and switch to higher magnification.
Registering the Objective Lenses
It’s important to register each objective lens before imaging to apply the View gap and Focus
gap corrections when switching lenses. Click [Z_Corr_Reg] in the lower right corner of the
Lens window to open the Registration window.
1) At your highest lens magnification in Color mode, select a small reference point on a
sample in focus. It should be small enough that your lens correction is done correctly, but
large enough that you can still see the point of reference in your lowest magnification.
Select this point by double clicking on it to center.
2) Click both [Compensation Registration] buttons in series.
4
3) Switch to [Monochrome] imaging mode. Your sample should still be in focus. Make
sure the red target is still centered on your reference point. Click the bottom
[Compensation Registration] button for view gap correction.
4) Switch to your second highest magnification lens, focus your image, and center your
original reference point. Click the [Compensation Registration] button. Switch to
[Color] imaging mode and click the bottom [Compensation Registration] button.
5) Do the same thing for each Lens. When you are finished, each registered lens should say
“Registered” under Focus gap, View gap (power) and View gap (color).
5
b. Channel Setting
Register the observation method, filter, and the observation condition setting for each
channel.
1) Click the [Channel Setting] button underneath the Channel switching window. Or, in
the BZ Viewer Menu, click [Channel setting].
2) For each channel (CH1-CH4), select the observation method from “OFF”,
“Brightfield”, “Phase contrast”, and “Fluorescence”. The halogen lamp and the
fluorescence excitation are automatically set according to the selected observation
method.
Observation Method
OFF
Brightfield
Fluorescence
Halogen Lamp
Fluorescence
Excitation
OFF
ON
OFF
Phase
contrast
ON
Close
Close
Open
Close
6
3) Check the box next to “Display pseudo color” to set the observation screen to display
a pseudo color in monochrome fluorescence. A comment can also be entered for each
Channel.
4) In Channel 4 (CH4), check “Used as overlay display” to use the CH4 window as an
overlay (merging) display while in MultiColor mode.
5) Check boxes to specify whether to register common observation conditions. Select
whether to set the following functions common among all channels.
Checkbox selected: All the channels are observed with the same adjustment value.
Checkbox not selected: Channels are observed with individual adjustment values of
their own.
Observation Method
Gain/Preview speed
AE (photometric method)
White Balance
Light Quantity
LUT correction/Black balance
Dynamic Filter
Haze Reduction
OFF
-
Brightfield
Yes
Yes
Yes
Yes
Yes
Yes
Yes
Fluorescence
Yes
Yes
No
Yes
Yes
Yes
Yes
Phase contrast
Yes
Yes
Yes
Yes
Yes
Yes
Yes
Yes: Can be set
No: Cannot be set
c. Focusing
Use your mouse scroll bar to fine focus. Scrolling down moves the lens turret down, and
scrolling up moves the lens turret up. To scroll 8 times faster (medium focus), hold down [Ctrl]
as you scroll. To scroll 16 times faster, hold down both [Ctrl] and [Shift] as you scroll (rough
focus).
d. Navigation
To move around within your sample, click the sample and drag it. It is just like Google Maps!
Double click a point of interest to center it. Right click can change the Zoom and Exposure time,
both of which are adjusted with the mouse wheel. Or if you prefer, you can use the slide bar
below the image window to adjust the exposure.
Underneath the Lens controls window in the Microscope tab are the Stage controls. Here you can
move your lens turret right, left, up, or down to adjust the field of view of the sample. Points of
interest can be “memorized” where Stage position storage is by clicking the [Set] button. Make
sure to click “Z-sync” to save the Z-axis coordinates as well.
7
e. Navigation Window
The Navigation System enables navigating around a specimen at high magnification by using a
low magnification reference image.
1) Image your sample at low magnification. Click [Navigation] under “Stage Control” and
a Navigation window should pop up. Now you can switch to a higher magnification, and
click a location on the Navigation image to move to that location.
Tip: If you are using the
Navigation Window and
get an error message that
reads [Outside of Nabis
Range], click [Image
Registration] button to
reset the Navigation
window. This error
message indicates that
you are outside the field
of view set in low
magnification.
Previously stitched images (through Image Merge function) can also be used as a navigation
image. Click [Open] in the Navigation window. In the dialog box displayed, select the image to
be registered to the Navigation window. Click [Open] to set image as a Navigation image.
f. Bright field Imaging
In Bright field imaging, a sample is
imaged against a bright background.
This is the mode we would use for
most non-fluorescing images. To view
images in Bright field mode, follow
these steps:
1) Switch your channel to Bright
field (Channel 4, if you followed the
channel setup in Part b). This utilizes
the channel that contains NO filter
8
2)
3)
4)
5)
6)
cube, since we do not need to separate wavelengths of light in this mode.
Select [Color] camera mode.
In the top left corner, make sure that [Single] window mode is selected.
Place your sample on the stage.
Select the lens you want to use by clicking its lens icon.
Focus your sample by scrolling your mouse.
g. Fluorescence Imaging
In Fluorescence imaging, light of a
specific wavelength excites the
specimen, causing it to fluoresce. The
mode used for this is Monochrome
mode. To view images in Monochrome
mode, follow these steps:
1) Switch your channel to one of
the designated fluorescence channels.
2) Switch camera mode to
[Monochrome].
3) Place your sample on the stage.
4) Select the lens you want to use
by clicking its lens icon.
5) Focus your sample by scrolling your mouse.
6) Click [MultiColor] to overlay channels on Channel 4.
7) Click each Channel window to image samples. The final channel window displays an
overlay of the 3 fluorescence channels.
h. Phase Contrast
Phase contrast is an excellent method for enhancing the contrast of thin, transparent specimens
without a loss of resolution.
1) In the Channel Setting window, switch the observation
method to “Phase contrast”.
2) Switch to a Phase Contrast objective lens (20x or 40x).
Note: Phase Contrast and fluorescence images can be
overlaid in both Multicolor viewing mode and in the BZ
Analyzer.
9
i. Loading as a Group
When the BZ viewer captures a group of images that are linked together for the
purpose of combining them for future analysis (such as images captured from the
Z-stack function, image-stitching, time-lapse or a combination of these functions)
they can be accessed in the BZ Analyzer by clicking [Loading as a group].
This opens up the window below. Notice that [Merge] is selected when I select the “Fat” folder
on the left; the software automatically detects whether the images need to be Z-stacked, or
Merged, or Time-lapsed. To open the file, click [Load] in the bottom right corner.
When opening Z-stack or Z-stack merged images, there are two focus options at the bottom of
the window: [Full Focus] and [Best Focus]:
The Full Focus option works by sampling the locations with the best focus at each coordinate in
grouped images that were captured with a combination of the Z-stack and Merge functions, and
merges them.
The Best Focus option automatically selects and merges grouped images with the best focus at
each coordinate captured with a combination of the Z-stack and Merge functions. For time-lapse
and live cell imaging, this function works best.
10
j. Capturing a Photo
You can capture a photo at any time by clicking the [Photo]
button at the bottom of the Observation Menu. The photo will
open in the BZ Analyzer.
Click [Preview] to view the sample again.
k. Image Stitching Setup
The purpose of the Image stitching function is to create a wide-view magnified image. To do
this, we set maximum coordinates to define our merge points (a minimum of 2 coordinates
needed). Shown below involves creating 4 maximum coordinate merge points.
1) Click the [Merge] button right above the window.
2) Now, figure out what parts of the image you want in your wide-view magnified image.
Go to the farthest left portion you want in your final image.
3) Adjust this area into focus; Make sure that Z-sync is selected in the Stage position storage
box, and click [Set] to save this point. Make sure that there are no other saved locations;
delete if necessary.
4) Do the same for the farthest right portion of your point of interest, the top portion, and
bottom portion. You have now formed a “box” around the area you would like to create a
wide-view magnified image of.
5) Now, click [AutoRangePhoto]. Select the folder in which you want to save the images
and Click [Ok], click [Ok] again. The program will now begin collecting images along
the parameters set.
11
l. Z-stack Setup
The Z-stack fully focuses samples that are thick or have variations in height. In one application,
when you put a bumpy sample in a microscope some portions of it appear in focus and some do
not. The Z-stack function takes image slices along the Z-axis (up and down) and combines
focused portions of them to produce a fully-focused image. To use Z-stack, follow these steps:
1) Select [Z-stack] button from the top middle row of buttons. Focus your image on the
tallest location on your sample. The tallest point on your sample should be focused, and
the rest should be blurry. (see below image)
Tip: Scrolling the mouse wheel
away from you will focus your
tallest (highest) point. Scrolling
the mouse wheel towards you will
focus your lowest point.
2) Go to the Stage Control window, and click [Upper Limit]. This tells the software your
upper limit from which to collect image slices.
3) Now, focus your image on the shortest location on your sample. Scrolling downward
(moving your lens turret down) it should be your last point to come into focus. Your tall
points on the sample should be out of focus.
4) Go to the Stage
Control window, and
click [Lower Limit].
This tells the
software your lower
limit from which to
collect image slices.
12
5) Now, notice that we have not told the software how many image slices to
collect. We do this by adjusting the pitch, which denotes the micron level
spacing between image slices. Increasing the pitch tells the program to
increase the distance between image slices, i.e. decrease the number of
image slices.
6) Lastly, Click [Photo]. Z-stack will prompt you to save in a folder, and
will then begin collecting image slices.
m. Quick Full Focus
The Quick Full focus tool has a similar function as the Z-stack tool,
but it works even faster.
It works by utilizing the focused points in images captured by
scrolling your mouse and combining them to create a full-focused
image.
1) Find the lowest point of the image that remains in focus by
scrolling down with your mouse.
2) Click the [Quick Full Focus] button at the bottom of the screen
in the BZ Viewer.
3) Now, scroll up (without using the Ctrl button). As you scroll, you
should notice your image slowly come into focus.
Tip: You can also start from the highest point of the sample and
scroll down.
13
n. Binning
Binning is a process that combines a cluster of pixels into a single pixel. For example, in 2x2
binning, an array of 16 pixels become 4 pixels, reducing the overall number of pixels.
Binning increases the frame rate, but it also lowers the resolution. Since binning increases the
sensitivity of the camera, it is an important function to use during live cell imaging to prevent
photo bleaching samples.
To change the binning settings, click the “Camera Setting” tab and adjust the type of binning
in the Binning/ROI box shown below.
Note: Binning is only used in
[Monochrome] camera mode.
14
Section B: Image Modification
15
a. Z-stack
Follow these steps to create a fully-focused image from a folder of captured Z-stack images.
When using the Z-stack tool for fluorescence images, apply the haze reduction tool first.
1) Open up the BZ Analyzer and click [Load as a group]. Find your folder. Click [Load].
You should now have a window open with a scroll bar; you can scroll down to view the
images captured.
2) Click the [Full Focus] button at the top of the menu.
Note: When setting the Z-stack upper and lower set points in multipoint time-lapse mode, keep in
mind that these upper and lower limits are the same for all points.
b. Image Stitching
Follow these steps to create a wide-view magnified
image from a folder of captured images.
1)
Open the BZ Analyzer, and click [Load
as a group]. Find your folder. Click [Load].
2)
An Image Merge window should
appear with a group of image files selected. Click
[Confirm position].
3)
The captured image slices should be
lined up. Now, click [Merge start] to merge them.
If your final picture has stitching lines, an image can
be used for correction. Select a blank background
image next to the radio dial labeled “Using image for
correction”, and then click [Merge start].
16
c. Haze Reduction
The Haze Reduction function can be used to remove blurring from captured fluorescence
images. It can be used in real-time in the BZ Viewer, or in the BZ Analyzer as shown below.
1) Open the BZ Analyzer and load your captured fluorescence image.
2) Click [Haze Reduction] button at the top of the Analyzer. A window should pop up that
has different settings of Haze Reduction. Select your desired setting from Preview 1-5.
The box next to Noise removal may be checked to remove minute noise from the image.
3) Click [OK].
17
Note: The Haze Reduction tool can also save conditions and load them for processing future
images.
d. Image Processing
i.
Black Balance Tool
The Black Balance tool creates a uniformly black background for fluorescence images, which
enables fluorescence signals to stand out.
1) Click [Black Balance] in the BZ Analyzer. The window below should appear. On the left
(original image) move the small white square to the black background. The improved
image should have a crisp, black background. Click [OK].
Note: The Black Balance tool can also be used in real time in the BZ Viewer under the “Image”
tab on the left.
18
ii.
Overlay
The overlay function enables superimposing fluorescence images.
1) Go to [Overlay] in the BZ Analyzer. The window below should appear. At the bottom
box that says “display”, select up to 4 images you want to overlay. Click [OK].
Note: In this window, you can adjust the
pseudocolor, brightness and contrast.
iii.
White Balance tool
White Balance is used to correct the color temperature (the ratio of red, blue and green light) in
an image.
1) To use the White Balance tool, click the “Camera Setting” tab and check “Display pushset area” in White Balance box. A box should appear on your sample; move it to the area
of the sample you would like to White Balance and click [Pushset].
Note: The White Balance tool can be used in real time in the BZ Viewer in the “Camera” tab.
19
iv.
Gamma
Gamma correction takes place after the image data has been collected from the CCD, and it’s a
function that can be used to correct dramatic differences in light intensity between signals. It can
be used in Brightfield, Phase contrast and Fluorescence, but is particularly useful in fluorescence
when an image has large variations in emission intensity.
1) In the BZ analyzer, click on the menu bottom at the top labeled [Image Processing].
Click [Brightness, Contrast, Gamma] and the window below pops up. Increasing the
Gamma below brightens the image; below the contrast has also been increased.
20
Section C: Image Analysis
21
a. Cell Separation and Extraction
Since the BZ is used primarily for biological applications, it makes sense that a Cell
Separation and Extraction tool would be a necessary function. It’s important to know that the
BZ software has the capability to separate and extract cells based on brightness.
We also have customizable separation thresholds,
And the ability to do advanced Post-Analysis.
22
1) First, open your image in the BZ Analyzer.
2) Click the [Cell Separation] icon .A window should pop up that shows three methods of
cell extraction; each Cell Separation method is defined below.
i.
Cell Separation: Separates and counts cells based on an edge-counting algorithm.
ii.
Brightness Extraction: Extracts and counts cells based on variations in cell
brightness.
iii.
Color extraction: Extracts and counts cells based on a user-selected color hue.
Each method can be selected and used to count by pressing [Count]. Details for each of these
methods are different and can be found by clicking [Detail].
i.
Cell Separation
The [Detail] button for the
Cell Separation method
enables changing the cell
counting threshold, extraction
of color, and separation level.
23
ii.
Brightness Extraction
The [Detail] button for the Brightness Extraction tool bring up a histogram and enables setting
the brightness range and color for extraction.
iii.
Color extraction
The [Detail] button for the Color Extraction sets the color for extraction, the location, and sets
the tolerance and permeability.
24
The options on the right side of the cell counting software can be used with the Cell
counting modalities for additional analysis if the [Binary image] or [Mask image] radio
dials are selected. Below is a definition of the options available.
[Count] button: Automatically counts the number of cells extracted using the different
extraction methods.
Count result: Displays the number of cells counted.
[Size] button: Lists the area, circle length, radius (XY), major axis, minor axis, and
integrated value of the various cells measured in the [Dynamic cell count measurement]
dialog box.
[Statistics] button: Lists the minimum value, maximum value, range, average value,
standard deviation, total, and sample number for the various measurements including
area, circle length, radius (XY), major axis, minor axis, and integrated value in the
[Dynamic cell count stats] dialog box.
Histogram: Displays a histogram in the [Measurement results histogram] dialog box for
the various measurements including area, circle length, radius (XY), major axis, minor
axis, and integrated value as well as the data section.
25
[Switch display]: Selects the method of displaying the image. Select from the following
three types.
Original image: Displays the original image.
Binary image: Displays a binary black and white image.
Mask image: Displays an image with extraction color set in [Display details].
[Correction] button icons: Adjust the cells for counting with 9 different correction
methods: Eliminate particles, Fill holes, Expansion, Shrinkage, Separate circle, Merge
regions, Remove selection, Image correction, and Outline extraction.
Note: The Image correction function is a powerful tool that gives the user the ability to
manually adjust an image used for Cell Separation and Extraction.
Display details: Set the color and thickness of the outline of the counted cells, the label
color and extraction color.
[Save the image] button: Save adjusted images with the [Save As] dialog box. You can
enter and save [Comment] and save images in JPEG format with the [Image quality]
settings.
26
b. Measurement
The measurement module allows users to easily quantify the results of our observation.
Click [Measurement Module] in the BZ analyzer to open.
Radius Tool
The radius tool allows the user to approximate the radius of any points of interest (like cells).
1) Click [Radius].
2) Click 3 points on the outside of the circle to set the circumference of the circle.
The radius of the circle should be displayed in the Measurement result box. To see radius in
microns, check [Calibration].
Centers Tool
The Centers Tool calculates the distance
between two cell centers.
1) Click [Centers].
2) Click 3 points on the outside of the
first cell to set the circumference of
the first cell. An approximation of the
shape of the circle should appear
around it. Do the same for the second
cell. The distance between the centers
of the two cells is automatically
determined.
27
Angle Tool
The angle tool enables approximation of angles.
1) Click [Angle 1].
2) Click the 3 points that define an angle, with the second click corresponding to the angle
center. The software automatically calculates the angle.
Between 2 points
Between 2 points calculates the distance between two points.
1) Click [Between 2 points].
2) Click point 1, then click point 2. The software automatically calculates the distance
between the two points.
28
Freehand Line
The freehand line tool is an incredible tool because it can calculate the length of a curved line,
which makes it ideal for measuring the length of the mouse dendrites below.
1) Click [Freehand Line].
2) Click your start point to set it, and then click your end point to finish measuring.
29
c. Real-Time 3D Module
3D imaging is a function that enables observation of specimen structure and documentation of
observation results. It’s fast and easy to get an impressive 3D image. If you’re trying to view a
fluorescence specimen in 3D, it’s helpful to apply the Haze Reduction function first to remove
fluorescence blurring.
Tip: Typically, the
highest Haze Reduction
setting is ideal for 3D
imaging.
Now, click the [Realtime 3D analysis] button.
The window below should pop up.
There are many options for 3D analysis available. In the “Realtime adjustment” box, we can
separate the red, green, and blue emission light to enable counting of fluorescent signals.
30
To navigate your 3D image, 1) Drag with the left mouse button, 2) Zoom with your mouse
wheel, and 3) Drag with your mouse right button to visualize sections.
You can replay the movements made with your mouse by setting “Start” “Mid” and “End”
settings in the “Motion picture detailed setting” box, and then clicking [Play].
31
Recommended pitch for Z-stack Tool
Lens
Minimum Pitch
CFI Plan Apo 2x
60 micrometer
CFI Plan Apo 4x
20 micrometer
CFI Plan Apo 10x
5 micrometer
CFI Plan Apo 20x
3 micrometer
CFI Plan Apo 40x
2 micrometer
Plan Apo Oil Immersion 60x
1 micrometer
Plan Apo Oil Immersion 100x
1 micrometer
Phase contrast ELWD 20x
5 micrometer
Phase contrast ELWD 40x
2 micrometer
The pitch is the distance between Zaxis image slices taken while using
the Z-stack tool.
Increasing the pitch will increase the
distance between image slices and
therefore decrease the number of
image slices.
Conversely, decreasing the pitch will
create more image slices.
32
Additional information can be found in
the official BZ-9000 User’s Manual and
the BZ-II Analyzer Reference Manual
33