1
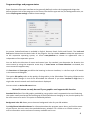
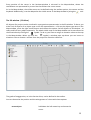
Manual
Version 6.0
1
Copyright 2014, INSIGHT Geologische Softwaresysteme GmbH
All Rights Reserved
All trademarks, service marks, and trade names referenced in this material are the property of their
respective owners and are used only for identification and explanation without intent to infringe.
SubsurfaceViewer Reader, SubsurfaceViewer XL and SubsurfaceViewer MX are trademarks of INSIGHT
Geologische Softwaresysteme GmbH, Germany.
Contact Information
INSIGHT Geologische Softwaresysteme GmbH
Hochstadenstraße 1-3
50674 Köln
Germany
Mail: [email protected]
Phone: +49 (0)221-99409981
Web: http://www.SubsurfaceViewer.com
2
Table of Contents
m
Fields of Application of SubsurfaceViewer Reader ........................................................................
Manual Structure ….......................................................................................................................
4
4
Download and Installation of SubsurfaceViewer Reader................................................................
System Requirements ….....................................................................................................
Installation of SubsurfaceViewer Reader for Windows operation systems …......................
Installation of SubsurfaceViewer for Mac OS X operating systems …..................................
4
4
4
5
User interface …............................................................................................................................
Program settings and program status …...................................................................................
The Map-window (2D-View)...............................................................................................
Map-window controlling ….................................................................................
The Sections-window. ( Section View ) ..............................................................................
The 3D-window ( 3D-View ) ..............................................................................................
The Borehole log-window …...............................................................................................
6
8
9
10
11
13
16
Info panel................................................................................................................................ 17
Objects and Projects …..................................................................................................................
18
Model data …....................................................................................................................
Digital evaluation model (GRIDs).............................................................................
Triangle Nets (TINs).................................................................................................
Geological layers …..................................................................................................
Faults …...................................................................................................................
VOXEL models …......................................................................................................
Maps and investigation data..............................................................................................
Raster Maps ….........................................................................................................
Shape files …...........................................................................................................
Boreholes …............................................................................................................
Sections …..........................................................................................................................
18
18
19
18
19
19
20
20
20
20
21
3
Fields of Application of SubsurfaceViewer Reader
With SubsurfaceViewer Reader you can visualize and analyze all geological investigation data of the
subsurface, structure models of geological layers and parameter models, in a flexible and
comprehensive way. SubsurfaceViewer can read and process most kinds of different data formats to
form 2D- and 3D graphics the user has unlimited access to. With SubsurfaceViewer, the user is free to
adapt the charts of investigation and model data to the requirements of the moment – he may for
example adapt them to any upcoming questions that may arise while presenting and discussing the
subsurface of an area with clients or team members. With SubsurfaceViewer Geologists - and this
revolutionary as compared to the conventional method - can now, at any time, produce maps and
graphics of the subsurface that lead to the best possible understanding of the data and the subsurface
situation.
Manual Structure
This manual is divided into two parts. In the first part, the basic structure of the user interface with its
different windows and control options is described. In order to get familiar with the program, we
recommend that you try the functionality described directly. Use our SubsurfaceViewer demo project to
do so; it was made for this purpose and is available for download on our website at
www.subsurfaceviewer.com (see Support/Downloads).
The second part of the manual offers an overview of the geological objects that can be visualized and
analyzed with SubsurfaceViewer. It is kept more general and meant to communicate the possibilities of
the SubsurfaceViewer system.
With the help of these two manual parts, the user should be familiar with the SubsurfaceViewer Reader
user interface and be able to import projects, to represent all objects flexibly and also to deduce crosssections and synthetic boreholes from structure models.
Download and Installation of SubsurfaceViewer Reader
SubsurfaceViewer is available as download only. There is a 32bit-, a 64bit-version and a Mac OS.X
version available at www.SubsurfaceViewer.com .
System Requirements
–
–
–
Windows XP, Windows Vista, Windows 7, Windows 8 operation systems
or MAC OS 10.6 or newer is required.
Open GL 2.1 or newer
1 GB of memory
Installation of SubsurfaceViewer Reader for Windows operation systems
In order to start the installation of SubsurfaceViewer after the download, double-click on the exe-file in
SubsurfaceViewer’s setup program to execute this file. A dialogue windows appear on the screen and
prompts you to
-
accept the license agreement. Then click Next.
-
accept or change installation path. Then click Next.
4
-
accept or refuse desktop icon. Then click Next.
–
your selections are displayed. Then click Install.
-
Start the installation immediately or choose Do not start.
–
click Exit
Shortly, the installation program will unpack all necessary files and install SubsurfaceViewer program.
You will find SubsurfaceViewer in the program list of your operating system. The start-up icon of the
program is displayed on your desktop (if accepted in the set-up). You can uninstall the program via the
Windows control panel.
Installation of SubsurfaceViewer Reader for Mac OS X operating systems
Unpack the zip-file into a folder of your choice. No special installation is necessary.
5
User interface
In order to start the program, double-click on the SubsurfaceViewer icon on your desktop or select it
from the program list. If you use a Mac OS X, double-click on the SubsurfaceViewer.jar file. Java version
6 or higher is required on your computer; if it is not installed, you are prompted to install it.
The license conditions have to be accepted before you can run the program.
When you start the program, the SubsurfaceViewer splash screen (intro screen) is displayed. After a few
seconds, there is the SubsurfaceViewer standard screen with its three standard frame-windows:
The main menu is in the top line:
On starting the program, the standard screen is displayed. It consists of three standard windows:
-
top left:
the Map-window
2D-View of subsurface data
-
top right:
the 3D-window
3D-View of subsurface data
-
below:
the Sections-window
Vertical views of cross-sections through
an area
6
Each of these three windows is divided into two parts:
The right side of each window is where the geological objects are graphically represented and displayed.
On the lift side of each window, there are two flags: Objects and Settings. Objects lists the folders that
contain the different types of geological objects - this object-list is visible by default. Use Settings to
display the setting options for each window.
In the object list, the object types are arranged as folders that contain the individual objects. You find all
geological objects of your project here – all surfaces, layers, cross-sections, maps, faults and VOXEL
models. Here, you can select the objects you would like to be added to or deleted from the graphic
representation you currently want to be displayed - on the map, in the 3D-view or in the Sectionwindow. All geological objects can be switched visible or invisible at any time, to the effect that you can
produce images that contain your selection of geological objects and the way they interconnect - in next
to no time, to the requests of the moment.
If you right-click on an individual object type, a menu pops up. It depends on the object type you select
and on the window-frame you work in, which menu is displayed. The options Hide all objects and Show
all objects are always present in these pop-up windows. They refer to the objects of the respective type
of object. There is only one exception – the cross-sections in the Sections-window, because in this
window you can display just one section at a time.
Right-click on the individual objects in the folders to set up the properties for the respective graphical
representation in the 2D- and 3D-window.
Next to Objects there is the Settings flag. If you select it, an input dialogue is displayed that allows you
to set the basic properties of the respective graphic.
The size of the window frames can be enlarged and reduced by moving the frame edges.
The 3D-window can be detached from the standard screen and be displayed separately on a second
monitor if you want to show just the 3D-window or if you want to use a data projector. Select Detach 3D
View from the Windows menu to use this option. In fact, all three windows can be detached and
positioned independent of each other on the screen. Select Split windows to do so. If you want to go
back to the standard screen mode with its three window-frames, select Default settings from the
Windows menu. You can also use the
- button in the tool bar of each individual window-frame to go
back to the standard screen mode. Additionally, there is the 3D presentation mode you can select if you
want just the 3D-window to be displayed full screen. Click on the
-button to get back to the standard
screen mode.
! If you use more than one computer screen, you can only get back to the standard
screen mode if all window-frames are displayed on one monitor.
At the top of each window frame, there is a toolbar with several symbol elements. These toolbars
contain different functions, the first four of which are the same in each toolbar:
Select background color
Save graphic as an image
Print graphic
Zoom to full extent
7
Program settings and program status
Some functions of the user interface can be generally defined, such as the language and things that
define the basic look of the program on the screen, like the font type and size, the background color, etc.
Select File/Program settings to define these settings.
At present, SubsurfaceViewer is available in English, German, Dutch, Polish and Flemish. The Look and
Feel option determines the basic looks of the program: You can choose native to adapt the appearance
to the respective operating system, or chose cross-platform to choose an appearance that is
independent of the operation system.
You can define the direction of moves and zooms here. By standard, you determine the direction the
scene moves by using the respective arrow keys. If Invert move and zoom direction is activated, the
scene moves the opposite way.
Via Font size and Font type you define the lettering in the user interface, i.e. the font style of all words
in the menus and dialogues.
The option 3D quality refers to the quality of the graphics in the 3D-window. This setting influences the
speed in which changes in size of the 3D-window are effected. If you select medium or high here, it
might take several seconds until the 3D-window is displayed.
You can switch on Active 3D stereo here.
! Active 3D stereo can only be used if your graphics card supports this function.
Standard 3D defines if the 3D graphic provided by your graphics card is supposed to be used. Selecting
this option usually accelerates the building up of the 3D-window on changing its size, but the quality can
be much worse as a result. This option is disabled by default.
Background color 3D allows you to choose a background color for your 3D-window.
See Help/about SubsurfaceViewer for information about the program status: Here, you find the status
of your license, the user name, the standard directory, whether it is a 32-bit or or a 64-bit version, as
well as information on the amount of memory available and in use.
8
The Map-window (2D-View)
A project normally consists of a huge number of geological objects. The object lists provide access to
these objects. Almost all of the objects of a project are always present in the object list of the Mapwindow, with the sole exception of individual boreholes and 3D maps. Objects are allocated to the
following object-types:
Sections
Vertical cross-sections of the model
Maps
2D map objects, like topographical maps, borehole-log maps or horizontal sections
Surfaces
Surfaces in real-space (natural ground- or groundwater surfaces)
Layers
Structures of geological layers
Faults
Geological faults
VOXEL models
3D-grids of a subsurface used to describe various properties
9
You can display a list of the objects of each object type by clicking on the respective object type name.
You can then decide which objects you want to be displayed by tagging the field next to the respective
object. By right-clicking on an individual object name you open a pop-up window which allows you to
control and change the properties of an object. For example, you can send objects to the front or to the
background or link objects with the 3D-window.
Map-window controlling
If there are objects displayed in the Map-window, you can control the size of the visible section by using
the toolbar options ZOOM to full extent, navigation mode zoom: ZOOM in, ZOOM out, navigation
mode: Move and Previous view.
Select
ZOOM to full extent to select an overview graphic of the size that automatically contains all
objects.
To put on the ZOOM mode, select
. Keep the left mouse button down to drag out a rectangle to
define the image section supposed to be visible in the Map-window. On letting go the mouse button, the
graphic displayed is adapted immediately. The image section preserves the original aspect ratio. The
reference point is the upper left corner.
You can gradually minimize the scale of the graphic if you select
the project area is displayed in the Map-window.
, to the effect that gradually more of
Select the Move button
to put on the navigation mode. If you hold down the left mouse button, the
graphic displayed can be moved in all directions.
10
You can also use the wheel of your mouse to enlarge or minimize the scale. This function is always
enabled, independent of the respective navigation mode. The reference point with this function is the
center of the respective graphic window.
In the navigation mode, you can also use the arrow keys to move the map . The view is moved to the
left, to the right, up and down. As an alternative to the arrow keys, you can use the A,S,D and W keys on
your keyboard.
! You can define the move and zoom direction in the File/ Progam settings dialogue.
You can restore the previously saved views by pressing the
stored, so that all views may be reset step by step with this tool.
button. All views are intermediately
The map visible in the Map-window can be transferred to the 3D-window by pressing the
symbol. To
do so, you have to assign a height value to the map. On pressing the symbol button, an input dialogue is
displayed where you can either enter a fixed level or select a surface of the project as height reference.
To change the shape of the cursor, use the
tool. The position of the cursor is marked by a vertical and
a horizontal line by standard which run over the entire width and height of the image. The cursor
position is the intersection point of these two perpendicularly positioned straight lines. The property of
this shape of the cursor is that it is linked to the Sections-window. If you move the mouse in the
sections-window, the cursor of the Map-window is automatically adjusted. The coordinates are
displayed in the lower left corner of the Map-window. The form of the cursor corresponds to the mode,
so you can always see which mode the window is in. If no special mode is selected the form of the cursor
changes to the full cross or to the default cursor.
If the info-mode is active, a piece of information is shown at the bottom of the window when you click
on an object. It will be visible for as long as the mouse-button is pressed. On releasing the mousebutton, the coordinates of the cursor position are displayed in this row.
On pressing the
Synthetic log symbol, a synthetic borehole is calculated at the cursor position and
shown in the borehole-log-window. If this window is not open already, it will automatically open up. The
calculation is subject to the condition that a structure model is loaded.
The cross-section button
activates the 'create new cross sections' mode. With sequent clicks, you
define the coordinates on a line along which the cross-section is supposed to be calculated. After the
first click, a line is dragged and fixed at every point you click. The line shows directly the course of the
cross-section to be calculated. Double-click to confirm the end of the cross-section, which is
automatically displayed in the Sections-window.
The Sections-window. ( Section-View )
In the Sections-window, objects are represented along a line as vertical sections. Only those objects
which have a reasonable vertical representation can be represented here. Therefore, georeferenced
maps and borehole distribution maps do not appear in the Section-View.
11
You can interactively define cross-sections by defining a line in the Map-window. According to this line,
in the Sections-window, the vertical representation of a section is done. To use this option, there must
be at least one object displayed in the Map-window. To activate this option, select Create new cross
section from the Add objects menu of the menu bar. Then, enter a section name into the input dialogue
and select i (Info) in the toolbar of the Map-window. Then, select a point in the map where you want
the section to begin by pressing the left mouse button at that position, thus defining the first coordinate
which is represented by a small red triangle.
In order to link this coordinate to the cross-section, click the
symbol (add point to section) in the
Sections-window The x-y-coordinates are displayed in a pop-up window where you can accept or
change them if desired. This point coordinate is defined to be the first point of the cross-section. With
every additional point of the section you determine, you define a line that is made up of successive
straight lines. Every additional point of the section including the last point is created in the same way as
the first point. From the second point on, the section is continuously represented by a chart in the
section window that depends on the objects visible there. You can see the run of the section in the Mapwindow, represented by a red line.
It is also possible to generate a cross-section by using borehole-log coordinates. In this case, choose
the
symbol (add borehole to section). Condition precedent is that there is a borehole-log map
displayed in the Map-window that contains the boreholes which are represented by small coordinates
symbols on the map. To do so, the Map-window must be put into the info mode by pressing the i (info)
button in the toolbar. When the cursor is on a symbol of a coordinate, the name of the borehole-log is
displayed next to the coordinates below. The boreholes are selected by clicking on the respective
coordinate symbol. The respective borehole is displayed in the borehole-log-window. You can use both
point coordinates and borehole coordinates in any order for the same cross-section. You can also
determine coordinates in the 3D-window, if the info-mode is selected, so you can also define the run of
cross-sections via the the 3D-window.
An active section is one that you can add more points to and which is always represented by a red line. A
black section line is inactive but can be re-activated and displayed in the section window. A crosssection, i.e. a section line, is never irrevocably completed. New points can always be added to a crosssection. To do so, choose the respective section via the object list of the Sections-window.
Existing point coordinates cannot be changed, but the last point respectively and the last borehole
coordinate can be deleted with the ' – ' tool in the toolbar of the Sections-window.
You can define the exaggeration of a cross-section by selecting or by entering a value in the selection
box at the right of the toolbar of the Sections-window.
The settings (properties) for the sections can be set in the Settings dialogue. They can be applied either
to the visible section or to all cross-sections of the project.
12
Every position of the cursor in the Sections-window is mirrored in the Map-window, where the
coordinates are represented by a cross-line that follows the cursor moves.
As in the Map-window, the visible sector can be defined using the toolbar options, the mouse and the
keyboard. Additionally, it can be adapted to the visible sector in the Map-window by using the
tool.
The 3D-window ( 3D-View )
All objects of a project can be visualized in a perspective representation in the 3D-window. To do so, you
either link all objects of an object type to the 3D representation – click on the object type name in the
Map-window, press the right mouse button and choose the option Link all objects to 3D-window – or
select and link every object separately. The whole visible map in the Map-window can be transferred to
the 3D-window by clicking the
symbol. To do so, you have to assign an elevation value to the map
in the Map-window. When you click the
symbol, a window pops up where you can insert an
elevation value or choose a surface from the project for elevation reference.
The grade of exaggeration can be entered in the toolbar like you do in the Sections-window.
The grade of exaggeration, as in the Section-View, can be defined in the toolbar.
You can determine the position and the enlargement of a view with these options:
turn and pan:
hold down the left mouse key and move the
cursor.
13
zoom to enlarge and minimize :
hold down the right mouse key and move the cursor or turn
the mouse wheel.
move:
hold down both the left and right mouse button and move
the cursor / or hold down both the Shift key and the left
mouse-button and move the cursor. The arrow keys and the
A,S,D and W keys of the keyboard also shift the scene.
move projection level
hold down the left mouse button and the Controlor Alt-key and move the cursor. This function allows you to
move the scene before or behind the computer screen. This
effect can be seen only if the scene is watched as an
anaglyph or as a stereo image. In the standard mode, this
function effects only the enlargement or size reduction of a
scene.
More controlling options for the 3D-View are in the toolbar of the 3D-window:
Standard view (Zoom to full extent)
Plan view
Side view
There is a menu box in the toolbar that allows you to select from which direction the 3D-graph is
viewed: (E (East), N (North), NW (North West) etc., + T (Top = from above), B (Bottom = from below) in
the selection menu box.
Counterclockwise rotation or Play video
Clockwise rotation or Reverse playback
Additional tools in the 3D-window:
Information mode on/off
If the info mode is enabled, left-click on an object to open an info window
that contains all information about that object. Simultaneously, the
respective coordinate is transferred to the Map-window where it is visible
in the form of a small red triangle. If the cross-hair is enabled, it is set at the
respective position.
Synthetic log
This symbol lets you anchor the rotation point of a scene at the last
position you defined by mouse click in the info-mode. If a position has been
14
marked in the Map-window or in Sections-window, and you click on the
anchor symbol in the 3D-window, that point is automatically selected as
the anchor point for rotation. Therefore, the position of the 3D scene can
also be determined in both of the 2D-windows.
Anaglyph image on/off
3D-view full-screen on/off / 2 computer screens.
All menus, window-frames and tool-bars are hidden in this mode.
If full screen is on and there is only one computer screen, press the Escbutton to end full screen mode.
! The tool-bar of the 3D-window can be detached from its window-frame and be
separately shifted and positioned if you click on it in a blank space between the
options and move the mouse. This is helpful if you have the 3D-view full screen on a
second computer screen and you want to enlarge the Map-window on first screen. If
you close the 3D tool-bar, it will automatically be put back in its place in the 3Dwindow.
Use the Settings dialogue to adapt your 3D-views in various ways. 3D-scenes can be stored as videos.
General
Switch on/off and select the background image, set the crossline, show a multiple quadruple view of the models and define stereoproperties.
Scale
Define the scale of the frame and the scale division, put the labels on/off and set
the position and angle of the light for the illumination of the model.
Exploded
Switch on/of exploded view / Set size of NS-, EW - displacement
Video
Set all specifications for the creation and the saving of a rotating 3D-model
as a video-file.
Label
Set the font type and size and label the x- and the y-axis
The settings of the 3D-window are mostly self-explanatory. The making of videos is an exception. If you
enable this flag, the control elements for the making of videos are displayed.
On pressing the Reset video button, a stored sequence of intermediate points is deleted and the video is
reset to the start.
The Freeze – Stop button lets you keep hold of the currently visible scene in the 3D-window. The first
intermediate position is automatically the beginning of the video.
Before you can set the next intermediate position, the scene must be turned or moved. Between these
two positions, intermediate positions will be computed, so that the transition between both points is
smooth in the video.
15
Intermediate values are assigned to the rotation angles, the shift value, the grad of displacement value
in the exploded view and to the grade of exaggeration value respectively. You can decide which objects
you want to see in each position.
When all individual positions are defined, you can start the computing of intermediate positions by
pressing the End video button. You can start the video by clicking the rotation buttons (see above) in
the tool bar of the 3D-window. Press the Save video button to save the the video as a movie file and all
pictures in the video are displayed one after the other in the 3D-window. The saving of a video can last
up to several minutes, depending on its size. The slow, medium and fast options define the Video
speed.
! On saving a video, the number of pictures and the length of the video is displayed at the
upper edge of the file input dialogue.
The three windows described are interconnected via the respective cursor position. If you move the
cross-hair in the Sections-window, the cross-hair in the Map-window is moved also. If the cursor in the
3D-window is enabled, it is moved, too. The cross-hair of the Map-window is also moving the cursor in
the 3D-window.
The Borehole log-window
In addition to the three standard windows that show 2D and 3D graphics, vertical views can be
generated at a point coordinate in the borehole-log-window. Normally, these borehole-logs exist as
layer descriptions or as so-called synthetic boreholes that represent the sequence of layers on the basis
of an existing layer model in the form of a borehole-log. There is just the 'Borehole-logs' type of object in
this window, with its subtypes 'Normal borehole-logs' and 'Syn. Borehole-logs' .
To activate the Borehole log-window, choose the Borehole-log window option from the Windows menu
and it will be displayed to the left of the main windows. It is adapted in position and size and when you
move or zoom the standard windows. If the views are detached, the borehole-log-window remains
unchanged.
If there is a borehole-log map visible in the Map-window and you click on a borehole-log symbol while
the info-mode is enabled, this borehole-log is displayed in the Borehole log-window. If the Borehole logwindow is not visible already, it will automatically be put on. If a structure model exists, a hypothetical
16
borehole-log can be generated and displayed in the Borehole log-window: Activate the
Map-window toolbar and click on a point in the structure model to do so.
icon in the
According to their respective type, the borehole-logs are assigned to the object subtypes Normal
borehole-logs and Synthetic borehole-logs. The name of synthetic borehole-logs is SDL n, whereas n is a
number starting with the number 1. If the synthetic borehole-logs are deleted, this number is put back
to 1.
The borehole-log-window has no extra settings next to the object list. Use Settings in the pop-up menu
of the normal borehole-logs and synthetic borehole-logs subtypes to adjust the layout of the boreholelogs.
You can enlarge and shift the graphic like you can do in the other windows. Just zooming by dragging out
a rectangle in not possible.
Info panel
The program produces information on the program status as well as warnings and error messages in text
format, informing the user about the processing status, possible exceptions and problems. These pieces
of information are displayed in the info-panel. Information requested in the 3D-Window when the infomode ( button) is enabled are also issued in this window. This window is not visible by default and
can be opened by selecting Windows/Info window from the main menu. If you enable the info-mode in
the 3D-View and you click on a visible object, the info-window is automatically opened.
17
Objects and Projects
Objects in SubsurfaceViewer describe and represent exploration results and also serve to analyze and
visualize digital models of real 'geological objects', like for example geological layers. Objects either
already exist in a project or they come into being through evaluation processes within
SubsurfaceViewer. There are twelve different objects, which can be allocated to seven object types.
A project is therefore a summary of a number of objects that SubsurfaceViewer can process, visualize
and analyze. You can only read in new project data either immediately after starting the program or
after selecting New project from the File menu of the toolbar. In addition to the individual objects there
is a variety of specific project data stored with the objects. These are set and administered in the
Workspace settings dialogue.
All objects are identified in the object list by an individual name. Every object is allocated to an object
type.
Objects can be sorted into three classes:
–
–
–
Model data
Maps and investigation data
Sections
The object handling is almost the same with all these three classes, though the contents of these classes
are very different and have to be understood:
Model data are defined as digital models of real geological objects. The models are divided into twodimensional (2D) and three-dimensional (3D) models. 2D models are surfaces that describe digital
elevation models or geological faults, 3D models are bodies of geological layers that all together make
up a structure model of the whole geological area. VOXEL models represent the properties of the 3D
geological space by dividing it into cuboids.
Maps and investigation data describe investigation results. There are no real counterparts to these
objects, they represent geological examination results. This class includes Raster maps, borehole-logs
and borehole-log maps as well as shape-files and automatically generated horizontal sections.
The Sections class contains only one object type: Sections (cross-sections). Sections are vertical views on
the subsurface along a defined line.
Within a cross-section, the objects of the other two classes can be visible, they are filled with
information as soon as objects of these classes exist in the project. You can also correlate layers within a
section, which are the basis for the modeling of composites. You can also include images and measuring
grids along a section.
Model data
Digital elevation model (Grid)
The objects here belong to the 'Surfaces' object type. At the coordinate points of the nodes of a virtual
grid, numerical values are defined. SubsurfaceViewer interprets the grids as digital elevation models that
18
represent a consistent surface in space. They are made up of a large number of rectangles that border
on each other and the program represents the elevation models this way. There is a dialogue window
for the selection of representation settings.
Triangle Nets (TINs)
SubsurfaceViewer interprets triangle nets – the abbreviation is TINs (Triangulated Irregular Networks) –
as digital elevation models - just as the program does with grids. TINs are also assigned to the Surfaces
object type. Defined elevation values do not form an even grid structure, they are unevenly distributed.
The whole surface is provided as a huge number of adjoining triangles that link the evaluation points
without crossing.
The possibilities to represent Grids and TINs are extensive. For your selections, use the same Settings
menu options as for the settings of all other objects.
Geological layers
One of the most outstanding features of SubsurfaceViewer is the visualization and analysis of geological
structure models. These structure models describe the distribution and the thickness of individual
geological layers. Structure models can be split into stratigraphical, lithological, hydrological and other
classes. Litho-stratigraphical structure models are commonly used.
Every layer is defined by its top-surface and base-surface and, if a surface limit is beyond the project
area, side borders are spatially defined. Top-surfaces and base-surfaces are described either in the form
of Grids or as TINs (see above). You can use only either Grids or TINs within the same project to define
geological layers. If you use Grids, all Grids must be of the same structure, that is, they must be of the
same total size and cell size.
Geological layers are the only objects of the 'Layers' object type: Normally, all existing layers in a project
form the structure model. The pop-up window of this object type offers the additional option to adapt
the sequence of layers to the sequence in the GVS file. In the Map-window, you can also specify the
order of representation accordingly. The sequence of layers can be selected as either normal or
inverted.
Faults
A fault is referred to as a tectonic division surface along which geological layers are shifted against each
other. SubsurfaceViewer Reader can represent faults in the form of TINs.
VOXEL models
A VOXEL model, along with structure models, is another kind of 3D subsurface model supported by
SubsurfaceViewer. These models allow the visualization and analysis of three-dimensional distributions
of different parameters in the subsurface. SubsurfaceViewer supports two different types of VOXELmodels.
VOXEL models in the CSV-format divide the subsurface into regular three-dimensional grids that are
made up of rectangular shaped cells. The size of the cells in the x-y-plane may be different to the zplane, which is the respective height of a VOXEL. To every cell, i.e. to every VOXEL, one or more numeric
19
values can be assigned. There must be values assigned to all grid cells. So-called null-values are assigned
to VOXELs with no values. Access to the various parameters is via names.
The second VOXEL format is GVMD, an abbreviation that means Generalized VOXEL Model Data. With
this format, space is divided into rectangles of different size. Just those areas for which data actually
exist are assigned data. It is not necessary to assign null-values, as in the CVS format. You use this
format, if lateral varying parameters are assigned to the layers of a structure model and the existing
structure is to be maintained. The size of the cells can be adapted to the respective data density. Areas
with higher data density can be divided into relatively small VOXELs, areas with less data density divide
into respectively bigger ones. In addition to numeric values, GVMD formats can also include texts as
parameters.
The Settings dialogue for VOXEL models is very comprehensive and is used not only for the controlling of
graphic representations, but also for the selection of areas and for numeric analyzes.
Maps and investigation data
Raster Maps
SubsurfaceViewer uses digital maps to visualize the position reference of the model data and of the
investigation data, for example by displaying topographical or location plans in the Map- or in the 3DWindow.
If you want to display raster maps in the 3D-window, you have to enter an elevation reference value.
This can be either a fixed value or an object of the Surfaces object type. A fixed reference can be
changed in the input dialogue, an assigned surface cannot be altered – however, you can change the
value that defines how much the map is to be represented with an offset in relation to the surface.
Shape files
The definition of shape files comes from ESRI. For a detailed description of this file format, please refer
to:
http://www.esri.com/library/whitepapers/pdfs/shapefile.pdf
SubsurfaceViewer supports only 2D shape files as yet. If a shape file contains polygons, those can be
referenced in height by a grid or a TIN. The polygons are displayed in the 3D-window with the respective
surface, for example, with a digital elevation model (Digital Terrain Model (DTM)).
The visibility of individual polygons can be controlled by selecting them from the table of polygons that
exists in addition to the general visibility control. This will affect the Map-window as well as the 3D view.
Within sections, polygons are represented as a band on the assigned surface. You can, for example,
make the geological map visible within a section, if it exists as a shape file.
! Selected polygons can be copied to the clipboard. In connection with VOXEL models,
they are used for the definition and the setting of boundaries.
In order to define the colors, use the project legend and the selected field name in the shape file. Shape
files are assigned to the 'Map' object-type.
Boreholes
20
borehole-log data certainly belong to the most important data about the investigation and visualization
of the geological subsurface. SubsurfaceViewer can represent borehole-log profiles of geological layers
together with sample data and geophysical logs.
Such a combination in the Map-window is represented as a borehole-log map and is therefore assigned
to the 'Map' object-type. borehole-logs maps are not displayed in the Sections-window. If you attach
the borehole-log maps to the 3D-window, the individual boreholes are displayed in 3D. If the cursor is
near a borehole coordinate, the name of the borehole next to the cursor is displayed at the bottom left
of the Map-window. If you select individual borehole-logs in the Map-window, these are displayed in the
Borehole log-window.
Sections
Sections form the third object class. Their job is the visualization of subsurface data along defined lines.
In the Sections-window, along defined cross-sections, all existing objects (of which a vertical
representation is sensible) are represented.
In addition to the objects in the project, images (for example manually made sections or plots of seismic
measurements) can also be represented. They are drawn first in the background of the section. If there
are geophysical measurements along the section line, for example resistance values in raster format,
you can use them alternatively.
The way you create sections interactively by entering coordinates via the Map- or the 3D-window or by
selecting borehole-logs via the Map-window, is described above. Interactively created courses of
sections can be saved as a file (File/Save sections as). They can be reloaded at any time in the future,
when a project is supposed to be analyzed and visualized again, so it will not be necessary to recreate
them.
21


![MapInfo [v9.5 - v10.0] User manual PDF](http://vs1.manualzilla.com/store/data/005662542_1-c58f11f989f54f88b5c049879cd1b1b4-150x150.png)