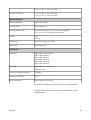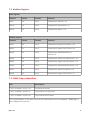
1
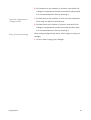
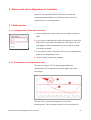
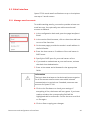
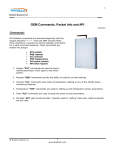
Querx PT100 Network thermometer and data logger User Guide Inhaltsverzeichnis 1 2 3 3 4 4 5 5 5 6 6 7 7 8 8 8 9 10 10 10 11 11 11 12 12 13 14 14 15 15 15 16 16 17 17 18 1 Introduction 1.1 1.2 Safety instructions About Querx PT100 Querx PT100 at a glace Features Possible fields of application Included in delivery 2 Putting into operation 2.1 2.6 Connecting the probe Connecting a single wire Sensor connection and configuration Network connection Voltage supply Network configuration with DHCP Manual network configuration Installation of Device Discoverer Assign network configuration Basic configuration 3 Accessing the web interface 3.1 3.2 3.3 3.4 Host name Homepage Log in Accessing the configuration back end 4 Configuration 4.1 Basic configuration Assign system name Configuration of the temperature probe Configure a name server Set date and time Deactivating the discovery function Reset internal memory Network configuration Automatic configuration via DHCP Manual configuration User Management Add user Edit user Delete user Deactivate anonymous access Automatic log out 2.2 2.3 2.4 2.5 4.2 4.3 18 18 19 21 21 21 22 23 23 24 24 25 26 27 27 28 28 29 29 29 30 30 30 30 31 31 32 32 32 32 33 33 33 33 34 34 34 35 35 37 38 4.4 Configuration of alerts Dead-band Temperature alerts 5 Data access and configuration of interfaces 5.1 5.7 Web interface Configuration of the web interface Visualization of temperature data Export recorded data Embed chart into other web sites Last sensor events E-Mail interface Manage email accounts Manage email recipients Email templates Cloud services Data export to ThingSpeak Data export to Xively Modbus/TCP Activate Modbus/TCP SNMP General settings Activate SNMP Agent Activate SNMP traps Download MIB Syslog Configure syslog server Android App Querx Discoverer 6 Maintenance, tips and troubleshooting 6.1 Restart Querx PT100 Warm reboot Cold reboot Configuration backup and restore Backup configuration Restore configuration Reset configuration Configuration reset via web interface Manual configuration reset Firmware updates Install firmware image Activate firmware image Activate alternative firmware image Troubleshooting Environment-friendly disposal 5.2 5.3 5.4 5.5 5.6 6.2 6.3 6.4 6.5 6.6 39 41 41 42 42 7 Appendix 7.1 7.2 7.3 7.4 7.5 Technical data Modbus Register SNMP Object Identifiers Export data formats Manufacturer and contact 1 Introduction Querx PT100 is a network based thermometer for measuring temperature with any Pt100 sensors. This manual contains the basic information needed for setting up, operating and maintaining Querx PT100. Querx PT100 online Up-to-date and in-depth information on Querx PT100 can be found on the websites http://www.egnite.de and http://sensors.egnite.de. 1.1 Safety instructions Read the manual carefully and obey the following safety instructions to minimize risks of injury and damage. Intended purpose Querx PT100 is used for stationary measurement and processing of temperature data, as well as for providing this data over several interfaces. All other use is regarded as not according to the intended purpose. egnite can not be held responsible for consequences from unintended use. Danger of death caused by electrical shocks To avoid accidents caused by electrical current, please obey the following instructions: Only use device, cable and adapter in proper condition. Disconnect voltage supply during maintenance. Do not manipulate the device or its accessories. Repairs are only to be done by trained staff. Don't submerge the device in water or other liquids. Introduction 1 Symbol explanation ⚠ ⚠ ⚠ In this manual the following symbols are used: Danger Informs on possible danger for live and health. Attention Informs on circumstances that can damage the device. Information Emphasizes useful information and tips worth reading. 1.2 About Querx PT100 Querx PT100 measures temperature values using Pt100 temperature sensors and provides the collected data over Ethernet. The alter function sends notifications over email (TLS / StartTLS), SNMP trap and syslog, if critical thresholds are exceeded. The internal memory stores at least 51 days of data. An interactive web interface provides a graphical representation of the logged data and the possibility to export it in the CSV and XML file formats. Cloud interfaces connect Querx PT100 to the Internet of Things and allow world wide data access via web and Android App. Through SNMP, you connect Querx PT100 to network management systems. Modbus/TCP allows usage in industrial environments (SCADA). Introduction 2 1.2.1 Querx PT100 at a glace (1) Button for configuration reset (2) Status LED (3) Micro-USB jack for voltage supply (4) Pt100 sensor connection cable (5) RJ-45 jack for Ethernet connection (6) Link LED 1.2.2 Features Support for any 2-, 3- and 4-wire Pt100 sensors Measuring range: -200 °C to 750 °C / -328 °F to 1382 °F (sensor dependent) Automatic network configuration with DHCP, mDNS and Bonjour Alerts via email, SNMP trap and syslog message Four alarm types: Temperature too high Temperature too low Temperature rises too fast Temperature drops too fast Secured email transmission with TLS / StartTLS M2M-Communication: SNMP and Modbus/TCP Introduction 3 Cloud export: world wide data access and programming interfaces Interactive web interface with graphical depiction of recorded data Android App available Data logger with internal memory for at least 51 days CSV and XML data export 1.2.3 Possible fields of application Food hygiene (HACCP) Process monitoring (SCADA) Server room monitoring Pharmacies and laboratories Home automation and more 1.2.4 Included in delivery Querx PT100 Set (Article EGN600414) Querx PT100 Ethernet cable Micro-USB cable USB wall plug adapter with interchangeable clippings for Europe, UK, USA and Australia DVD-ROM with software and documentation Querx PT100 (Article EGN600514) Querx PT100 without accessories Introduction 4 2 Putting into operation 2.1 Connecting the probe Querx PT100 supports any 2-, 3- and 4-wire Pt100 probes. To connect a probe you will need: A tool with a fine tip, such as a watchmaker's screwdriver or tweezers A ballpoint pen Maybe a magnifying glass 2.1.1 Connecting a single wire 1. Push the button above the clip, into which you want to insert the wire with a ball-point pen. 2. Insert the wire. 3. Release the button. 4. Check if the clip has locked by gently pulling the wire. 5. To release a wire, press the button again and pull the wire out of the clip. 2.1.2 Sensor connection and configuration Above the clips for the sensor wires, you find two DIP switches, over which you configure the type of sensor you intend to use. 1. Look up the switch configuration for your particular probe in the following image. Putting into operation 5 2. Use a tool with a fine tip to set the switches the corresponding configuration. If needed, use the magnifying glass. 3. Insert the single wires into the clips according to the following image. 4-wire probe 3-wire probe ⚠ 2-wire probe Information Depending on the applied production standard, the color encoding for you sensor might differ from the examples in the image. In this case please consult the manufacturer's data sheet. 2.2 Network connection 1. Connect Querx PT100 to your network using the supplied network cable. If no DHCP server is available in your network, you can directly connect Querx PT100 to the computer, which is used for configuration. 2.3 Voltage supply 1. Prepare the wall plug adapter by gently pushing the clipping for your country into the guide rails from above, until it locks in place. Putting into operation 6 2. Now connect the wall plug adapter to the device, using the provided micro-USB cable. 3. Put the adapter into the wall outlet. Querx PT100's status LED lights yellow. ⚠ Danger Never use the device with a broken adapter. There is a risk for live caused by electrical current. If you do not have a free wall outlet, you can directly connect Querx PT100 to the free USB port of a computer. 2.4 Network configuration with DHCP Over DHCP, Querx PT100 can obtain an automatic network configuration. If valid settings are received, the status LED lights green. If a network error has occurred, Querx PT100 blinks yellow. In this case, check whether the network cable is connected properly. If the problems remain, ask your network administrator for advice. 2.5 Manual network configuration If your network does not support DHCP and your computer does not support mDNS, you have to manually carry out the network configuration. Putting into operation 7 ⚠ Information Most users won't need the following instructions. Please continue with chapter 4, 'Accessing the web interface'. 2.5.1 Installation of Device Discoverer On the supplied DVD-ROM you will find the application Device Discoverer, that allow remote configuration of Querx PT100. 1. Start the installation software for Device Discoverer. 2. Follow the instructions of the installation wizard. 2.5.2 Assign network configuration 1. Start the application Device Discoverer. 2. Right-click on the device, which you want to configure, and choose Device configuration. 3. Enter an IP address and a network mask. 4. Click the OK button. Querx PT100 will restart with the new configuration. The status LED lights yellow. As soon as the device is available, the status LED blinks green. 2.6 Basic configuration Now, Querx PT100 is configured for network access. Please continue with chapter 3 'Accessing the web interface' and afterward carry out the basic configuration as discussed in chapter 4 'Configuration'. Putting into operation 8 3 Accessing the web interface 3.1 Host name Access via host name With mDNS, you can directly access Querx PT100 over its system name in the local network. This name can be configured in the configuration back end. 1. Open a web browser and enter the following URL in the address bar: http://<systemname>.local/ Per default, this system name is querx00000, where you have to replace the six 0s with the last six characters of the device's MAC address. This address can be found on the sticker at the bottom side of the unit. For the example image above, the address is: http://querx000000.local/ From the Safari web browser, you can also access Querx Access via Bonjour PT100 over the Bonjour menu. ⚠ Accessing the web interface Information If you cannot access the web interface, you need to manually set a network configuration. How to do this is discussed in chapter 2.5 'Manual network configuration'. 9 3.2 Homepage On Querx PT100's homepage you will find the recorded data in an interactive chart. In chapter 5 'Data access and configuration of interfaces' you will learn how to use the display and export functions. In the upper part of the homepage, you find some buttons to log in at Querx PT100 and to open the configuration back end. 3.3 Log in If you have configured users and assigned access right to them, you need to log in at Querx PT100. Enter your user name in the field User, your password in the field Password and click Login afterward. In Querx PT100's default configuration, no users are configured. You can learn more on user management in chapter 4.3 'User Management'. 3.4 Accessing the configuration back end To access the configuration back end, click on the Configuration button in the upper right corner of the homepage. Accessing the web interface 10 4 Configuration 4.1 Basic configuration For proper operation, the following configuration steps need to be carried out. 4.1.1 Assign system name On the homepage of the configuration back end, which can also be accessed via System / General, enter a system name for the device. This name is used to identify the unit and for addressing it in your network. 1. Enter the system name in System name. 2. If you want to use SNMP, enter a responsible member of staff in Contact person and the location of the device in System location. 3. Click on Save to apply your changes. 4.1.2 Configuration of the temperature probe 1. In the configuration back end, click on Sensors / Temperature. 2. Choose the physical temperature unit for Querx PT100 to work with from the field Unit. 3. Set the field Filter to the utility frequency, which is used in your county. For use in Europe, set it to 50 Hz Filter. 4. From Sensor type, choose the number of wires over which your probe is connected to the device. 5. Click on Save to apply your changes. Configuration 11 4.1.3 Configure a name server You need to provide a name server to enable services like NTP, email and cloud connectivity. 1. In the configuration back end, click on System / Network. a. If a name server is provided via DHCP, check Obtain DNS server automatically. b. To manually set a name server, select Set DNS server manually and enter the IP address at Preferred DNS server. 2. Click on Save to apply your changes. 4.1.4 Set date and time There are three ways to set date and time: If there is an NTP server available in your local network or Querx PT100 has an internet connection, you should obtain date and time automatically over SNTP. Otherwise, you can synchronize the time with the computer from which you are configuring Querx PT100 or set it manually. 1. Open the page System / Time in the configuration back end. 2. Select the appropriate time zone for your country from Set time zone. 3. Set daylight saving time options: a. If in your country daylight saving time is applied and time changeover happens at the last Sundays in March and October, check Auto DST. b. If DST is applied in your country, but time changeover does not happen at the last Sundays in March and October, do not set Auto DST. Set DST manually when DST is in effect. Configuration 12 4. Click on Save to apply your changes. Obtain date and time over network Querx PT100 can automatically obtain date and time over the Net Time Protocol, if an NTP server is available. 1. Enter the IP address or the host name of an NTP server at Set NTP, for example pool.ntp.org. 2. Click Sync NTP to receive date and time over network. ⚠ Set date and time manually Information As long as a valid NTP server is available, Querx PT100 will automatically update date and time once an hour. If you cannot receive date and time over network, you need to manually provide these values. 1. In the section Set time enter the current date in the little endian date format in the field Date. For the February 1st, 2014 this is 01.02.2014. 2. Enter the current time in the field Time, with hours, minutes and seconds separated by colons. For half past 1 pm, this is 13:30:00. 3. Click on Save to apply your changes. Synchronize date and time with your computer You can also synchronize date and time from the computer you use to configure Querx PT100. 1. In the section Set time, click on Sync PC. The time and date fields are updated. 2. After synchronization do not click on Save. 4.1.5 Deactivating the discovery function To enable network configuration with Device Discoverer, Querx PT100 has the discovery function enabled as default. To increase security, it is recommended to deactivate this function after your device is set up. Configuration 13 1. In the configuration back end, open the page System / Network. 2. Next to Discovery, deactivate the check box Enable. 3. Click on Save to apply your changes. 4.1.6 Reset internal memory Once Querx PT100 is supplied with voltage, the device starts recording data. To restart the recording with the new settings, you need to reset the internal memory. 1. In the configuration back end, open the page Maintenance / Reset. 2. Click on the Delete sensor data button. 3. Confirm the reset by ticking the check box Are you sure. 4. Click on Yes. This process can take several seconds. Afterward Querx PT100 restarts recording data with timestamps and temperature units according to your configuration. 4.2 Network configuration In the most cases, Querx PT100 automatically gets a network configuration via DHCP. It is nevertheless possible to manually configure network settings. ⚠ Configuration Information Some changes to the network configuration require a reboot of the system. See Section 6.1, 'Restart Querx PT100'. 14 4.2.1 Automatic configuration via DHCP 1. In the configuration back end, open the page System / Network. 2. Choose Obtain IP address automatically. a. If you want to obtain DNS settings automatically as well, choose Obtain DNS server automatically. b. If you want to configure your own DNS servers, choose Set DNS Server manually and enter the IP addresses of your first name server in Preferred DNS server and of your second name server in Alternate DNS server. 3. Click on Save to apply your changes. 4.2.2 Manual configuration 1. In the configuration back end, open the Page System / Network. 2. Click on Set IP address manually. 3. Enter the IP address for the device in the field Local IP address. 4. Specify a Network mask. 5. Provide the IP address of the router, which connects Querx PT100 to the Internet in Gateway IP address. 6. Provide a Preferred DNS server and Alternate DNS server for internet name resolution in the appropriate fields. 7. Click on Save to apply your changes. 8. Restart the device as discussed in chapter 6.1. 4.3 User Management You can configure up to three users with varying access restrictions to the device. Per default, data access and configuration are allowed for any user from the local network. Configuration 15 You can assign different right groups to the system users: Disabled: User has no access to the device. Read data: User can read measured data. Read data / read config: User can read measured data and device configuration. Read data / write config: User has unrestricted access to measurement data and to the device configuration. 4.3.1 Add user 1. In the configuration back end, open the Page System / User. 2. In the section Users, click on the action Add next to a free slot. 3. On the next page, provide a User name and a Password in the according fields. 4. Choose the access rights that you want to assign to the user from Group. 5. Click on Save to apply your changes. 4.3.2 Edit user 1. In the configuration back end, open the page System / User. 2. In the section Users click on Edit next to the user you want to change. 3. On the following page, carry out your changes. 4. Click on Save to apply your changes. Configuration 16 ⚠ Information You can only withdraw configuration write access from a user, as long as at least one other user with write access exists. 4.3.3 Delete user 1. In the configuration back end, open the page System / User. 2. In the section Users, click on the action Del next to the user that you want to remove. 3. On the following page, confirm you the removal by clicking on Yes. ⚠ Information A user with write access on the configuration can only be deleted, as long, as at least one other user with write access exists. 4.3.4 Deactivate anonymous access As soon as you have added a user with write access on the configuration, you can restrict the anonymous access. 1. In the configuration back end, open the page System / User. 2. In the section Users click on Edit next to the user Anonymous. 3. To completely deactivate anonymous access, choose Disabled from Group. To only restrict the access, choose the appropriate Group. 4. Click on Save to apply your changes. Configuration 17 4.3.5 Automatic log out If a user does not perform any actions for a longer period, he will be automatically logged out. You can adjust this time. 1. In the configuration back end, open the page System / User. 2. In the section Session enter the number of seconds, after which a user is logged out at Timeout. 3. Click on Save to apply your changes. 4.4 Configuration of alerts In the chapter 4.1.2 'Configuration of the sensor probe', you have already started with the configuration of the temperature sensor. This part covers the configuration of sensor alerts. 4.4.1 Dead-band To avoid repeated alarms, you can set a dead-band for alerts, which are triggered on exceeding a threshold. This value specifies the number of units, that the measured value has to move back into the direction of the normal status, after a threshold was exceeded, before another alert is triggered. Please refer to the following image: Configuration 18 This example shows an upper temperature limit of 55 °C and a lower temperature limit of 15 °C. The dead-band is set to 10. If an alert is triggered at 55 °C, the sensor has to measure 45 °C or less, before another alert is triggered on exceeding 55 °C again. 4.4.2 Temperature alerts Querx PT100 supports for types of alerts: Temperature too high Temperature too low Temperature rises too fast Temperature drops too fast How Querx PT100 reacts upon occurring alerts, will be discussed in chapter 5 'Data access and configuration of interfaces'. 1. In the configuration back end, open the page Sensors / Temperature. 2. Optionally, enter a Sensor name, through which it can be identified in alert notifications. Alert for exceeded thresholds 1. Set Upper limit to the value at which the maximum temperature is exceeded. 2. Set Lower limit to the value at which the minimum temperature is under-run. 3. Set Alarm delay to the number of seconds, that a threshold needs to be exceeded, before an alert is triggered. 4. Set Dead-band to an appropriate value, for example 0.5. Alert for temperature dropping too fast Configuration 1. Set Drop value to the number of units, that the measured value may drop within a defined time. 19 2. Set Drop time to the number of minutes, over which the change in temperature should not exceed the Drop value. You can deactivate this alert by entering 0. Alert for temperature rising too fast 1. Set Rise value to the number of units, that the measured value may rise within a defined time. 2. Set Rise time to the number of minutes, over which the change in temperature should not exceed the Rise value. You can deactivate this alert by entering 0. Save you alert settings After having configured the alerts, don't forget to save your changes. 1. Click on Save to apply your changes. Configuration 20 5 Data access and configuration of interfaces Querx PT100 provides several interfaces to make the measured data available over Ethernet and to send out notifications on occurring events. 5.1 Web interface 5.1.1 Configuration of the web interface 1. In the configuration back end, open the page Interfaces / Web. 2. In the section Web interface, select the period of time from Refresh rate, after which the dynamic information on the web pages, such as temperature, time or memory used, should be updated. 3. In the section Chart, choose the color for the temperature graph from Temperature color. 4. Click on Save to apply you changes. 5.1.2 Visualization of temperature data The chart on Querx PT100's home page shows the development of temperature since the beginning of the recordings. The red line (1) shows the progress of the mean temperatures. The red areas (2) next to this line show the Data access and configuration of interfaces 21 maximum and minimum temperatures, that were measured in the displayed time frame. The horizontal red bars show the thresholds at which alarms are triggered, their height is specified by the Dead-band. How to adjust this value is discussed in chapter 4.4 'Configuration of alerts'. Adjust timescale The gray bar beneath the chart shows the measurement period. You can use the two sliders, to scale the displayed time period. If the sliders are set to the outer limits of the gray bar, the whole measurement period is displayed. Move time period If you have adjusted the period that is shown, you can move the area between the sliders to set the time segment, that you want to display. 5.1.3 Export recorded data You can export the data, that Querx PT100 has recorded. The device supports exports in the CSV and XML file format. Data access and configuration of interfaces 22 1. Open the homepage of Querx PT100. 2. Adjust the time period for export, as discussed in the last part. 3. Click on Export. 4. Choose the Format in which you want to export the data. 5. At Steps, choose the time difference between two records. 6. Finally click on Download. Each record contains date, the beginning time of the interval, minimum, maximum and calculated mean temperatures. 5.1.4 Embed chart into other web sites Where Querx PT100 is can be reached over network, you can embed the chart in to other web sites, for example in your intranet, using an Iframe. 1. Open the homepage of Querx PT100. 2. Click on Iframe. 3. Copy the shown HTML code into the clipboard. 4. Paste the HTML-Code into the source code of the web site, into which you want to embed the chart. 5.1.5 Last sensor events In the configuration back end, you can access the last 16 sensor events, like alerts, returns to the normal state or sensor failures. 1. In the configuration back end, open the page Maintenance / Events. Data access and configuration of interfaces 23 5.2 E-Mail interface Querx PT100 sends email notifications to up to 4 recipients over up to 2 email servers. 5.2.1 Manage email accounts To enable sending emails, you need to provide at least one email account. You optionally can add a second email account as fallback. 1. In the configuration back end, open the page Interfaces / Email. 2. In the section Email accounts, click on the action Add next to one of the free slots. 3. On the next page, provide the sender's email address in the field Sender. 4. Enter the host name or IP address of the mail server in SMTP server. 5. Specify the SMTP port for your mail server at Port. 6. If you need to authenticate at your mail server, activate the check box Authentication. 7. Enter a User name and a Password in the appropriate fields. ⚠ Information The log in data is written to the device without encryption. So do not use an email account over which intimate communication is carried out. If needed, create an own account for Querx PT100. 8. Click on the Test button to check your settings. If everything is fine, the button will turn green. If you have made a mistake, the corresponding field will be highlighted with a red border. Correct the error and click on Test again. 9. Click on Save to apply your changes. Data access and configuration of interfaces 24 Edit email account 1. In the configuration back end, open the page Interfaces / Email. 2. In the section Email accounts, click on Edit next to the account, that you want to change. 3. On the following page, make your changes. 4. Click on the Test button to check your settings. If everything is fine, the button will turn green. If you have made a mistake, the corresponding field will be highlighted with a red border. Change the fields and click on Test again. 5. Click on Save to apply your changes. Remove email account 1. In the configuration back end, open the page Interfaces / Email. 2. In the section Email accounts click on the action Del next to the account you want to remove. 3. Confirm the removal by clicking Yes on the following page. 5.2.2 Manage email recipients Querx PT100 supports up to 4 email recipients, each of whom you can assign the mail server over which emails are sent. Also, you can choose the events on which notifications are sent for each recipients. 1. In the configuration back end open the page Interfaces / Email. 2. In the section Recipients, click on the action Add next to one of the free slots. 3. On the next page enter the email address for the recipient in the field Email and choose the account over which you want emails to be sent to this address. If the corresponding mail server can not be reached, Querx PT100 tries to send emails using the alternate email server. Data access and configuration of interfaces 25 4. At Notify on, choose the events for which you want to send notifications to this recipient. 5. Click on Test, to check the settings. Check your email afterward. 6. Click on Save to apply your changes. Edit email recipient 1. In the configuration back end, open the page Interfaces / Email. 2. In the section Recipients, click on the action Edit next to the recipient you want to change. 3. On the next page, make your changes. 4. Click on Test, to check the new settings. 5. Click on Save to apply your changes. Delete email recipient 1. In the configuration back end, open the page Interfaces / Email. 2. In the section Recipients click on the action Del next to the recipient, which you want to remove. 3. Confirm the removal by clicking on Yes on the next page. 5.2.3 Email templates Querx PT100 sends notifications when alerts occur or when the unit returns to the normal state. For both cases, you can define templates. 1. In the configuration back end, open the page Interfaces / Email. 2. In the section Alert notifications, enter an Email subject and an Email body for both templates. You can use following variables, that are dynamically substituted on sending out the notifications: $S Name of the sensor that has triggered the alert $V Measured value Data access and configuration of interfaces 26 $U Physical unit of the measured value $I IP address of the device $L Location of the device $N Host name of the device $C Responsible member of staff 3. Click on Save to apply you changes. 5.3 Cloud services Querx PT100 can export the measured data to the Internetof-Things clouds Xively and ThingSpeak. This allows world wide data access and easy integration into own projects. Cloud services are updated every full 10 minutes. 5.3.1 Data export to ThingSpeak For the data export to ThingSpeak, you need to set up a ThinkSpeak channel. This can be done free of charge at the cloud provider's website: www.thingspeak.com To set up a cloud connection you will need the following data: The channel ID of your think speak channel The field ID for temperature values The write API key 1. In the configuration back end, open the page Interfaces / Cloud. 2. In the section ThingSpeak, enter your write API key in the field API key. 3. Enter your Channel number in the field Channel number. 4. Enter the ID for the temperature field in Temperature Field ID. 5. Click on Save to apply your changes. Data access and configuration of interfaces 27 After saving your ThingSpeak configuration, you find a Link below. If you click on that link, your ThinkSpeak channel will be opened in a new browser window. 5.3.2 Data export to Xively To connect Querx PT100 to Xively, you will need a Xively feed. You can set this up at the cloud provider's website: www.xively.com. You will need the following data to connect Querx PT100 to Xively. The ID of the Xively feed for Querx PT100 to update The API key that allows Querx PT100 to write on that feed 1. In the configuration back end, open the page Interfaces / Cloud. 2. In the section Xively, provide the API key for write access. 3. Enter the Feed ID for your Xively feed. 4. Click on Save, to apply your changes. After saving the configuration, you will find a Link below. If you click on that link, your Xively feed will be opened in a new browser window. 5.4 Modbus/TCP Querx PT100 can send data via Modbus/TCP, for example if you want to employ the device in industrial applications (SCADA). You can find a listing of all addressable registers in chapter 7.2 Modbus registers. Hands-on examples on how to use Querx and Modbus/TCP can be found on the product page at http://sensors.egnite.de. Data access and configuration of interfaces 28 5.4.1 Activate Modbus/TCP 1. In the configuration back end, open the page Interfaces / Modbus. 2. Tick the check box Enable to activate Modbus/TCP. 3. If you want to allow configuration changes via Modbus/TCP, uncheck the check box Write Protection. 4. Click on Save to apply your changes. 5.5 SNMP The Simple Network Management Protocol SNMP allows to integrate Querx PT100 into network management systems, such as Nagios, OpenNMS or Zabbix. You can find the important SNMP OIDs in chapter 7.3, 'SNMP object Identifiers'. The MIB can directly be downloaded from the device. Some hands-on examples on how to use Querx PT100 with SNMP, can be found on the product's website at http://sensors.egnite.de. 5.5.1 General settings 1. In the configuration back end, open the page System / General. 2. Enter a System name to identify the device over SNMP. Please keep in mind, that this name is also the host name for Querx PT100, trough which it can be connected in the network. 3. In the field Contact person provide a responsible member of staff. 4. Enter a System location for Querx PT100. 5. Click on Save to apply your changes. Data access and configuration of interfaces 29 5.5.2 Activate SNMP Agent 1. In the configuration back end, open the page Interfaces / SNMP. 2. In the section SNMP agent, tick the check box Enable, to active the SNMP agent. 3. Check the Read community and adjust it, if needed. 4. Click on Save to apply your changes. 5.5.3 Activate SNMP traps 1. In the configuration back end, open the page Interfaces / SNMP. 2. In the section SNMP traps, provide the host that will receive traps sent by Querx PT100 at Trap destination. 3. Check the Trap Community and adjust it, if needed. 4. Select the events on which a SNMP trap should be send at Send trap on. 5. Click on Save to apply your changes. 5.5.4 Download MIB 1. In the configuration back end, open the page Interfaces / SNMP. 2. In the section SNMP agent, click on Download next to MIB. 5.6 Syslog Querx PT100 can send a multitude of logging, error and alert messages though syslog. If problems occur, this functionality helps you to spot their source. Software to receive syslog messages can be downloaded from the Internet. Data access and configuration of interfaces 30 5.6.1 Configure syslog server 1. In the configuration back end, open the page System / Network. 2. Provide the IP address or the host name of your syslog server at Syslog server. 3. Click on Save to apply your changes. 5.7 Android App Querx Discoverer You can find the App Querx Discoverer on Google Play: https://play.google.com/store. This App gathers measurement data over network and cloud services. The app can also be used for basic network configuration, as you can do with Device Discoverer. Data access and configuration of interfaces 31 6 Maintenance, tips and troubleshooting 6.1 Restart Querx PT100 There are two ways to restart Querx PT100. 6.1.1 Warm reboot After some configuration changes, a reboot of the system is required. 1. In the configuration back end, open the page Maintenance / Reset. 2. Click on the button System reset. 3. Confirm reboot by clicking Yes on the next page. 6.1.2 Cold reboot If the device does not react any more, you can perform a cold reboot. 1. Disconnect the device from the voltage supply. 2. Wait for about 20 seconds. 3. Reconnect the device to the voltage supply. 6.2 Configuration backup and restore To backup your configuration or to reproduce a configuration on several devices, you can export the configuration and save it away. Following settings are ignored: Manual network settings Email accounts and passwords API keys for cloud providers Maintenance, tips and troubleshooting 32 6.2.1 Backup configuration 1. In the configuration back end, open the page Maintenance / Backup. 2. In the section Configuration backup click on Download next to Configuration. 3. Save the file by clicking on OK. 6.2.2 Restore configuration 1. In the configuration back end, open the page Maintenance / Backup. 2. In the section Configuration restore click on Choose File next to Upload. 3. Choose the configuration backup that you want to restore. 4. Click on Upload. 5. Restart Querx PT100, see chapter 6.1. 6. Finally: Set up clouds, email accounts and users. 6.3 Reset configuration There are two ways to restore the factory defaults on the device. 6.3.1 Configuration reset via web interface 1. In the configuration back end, open the page Maintenance / Reset. 2. Click on Configuration reset. 3. Confirm the reset by clicking on Yes on the following page. Configuration resets carried our via Web interface will not reset the host name and the IP configuration. Maintenance, tips and troubleshooting 33 6.3.2 Manual configuration reset In case you cannot log in to Querx PT100, for example if you have lost the log in data, you can do a manual reset to restore the factory default. For that you will need: A ballpoint pen Attention ⚠ Do not use a pencil for a manual reset, as its lead could break and damage the device. 1. With the device turned on, press the reset button using the ballpoint pen. This button is just beneath the opening next to the status LED. The status LED blinks red. 2. Hold the button until the blinking stops. Querx PT100 is now rebooted with the factory defaults. Manual hardware resets will also reset the device's host name and IP configuration to the factory defaults. 6.4 Firmware updates To extend the functionality of Querx PT100, egnite occasionally provides new firmware images. If needed, they can be installed on the device and afterward be activated. There are two slots to hold firmware images. If you activate one of those images, they are transferred into the internal memory and will be booted when the device is restarted. 6.4.1 Install firmware image 1. In the configuration back end, open the page Maintenance /Firmware. In the section Version you can see the currently running firmware version. If this version is lower than the version that you can find on http://sensors.egnite.de, a firmware update can be sensible. Maintenance, tips and troubleshooting 34 Firmware installieren 1. Download the most recent firmware image from the http://sensors.egnite.de. 2. In the configuration back end, open the page Maintenance / Firmware. 3. Select the Buffer, in which you want to install the new firmware image in the section Upload. This should be the buffer with the lowest firmware version number or an empty buffer. 4. Click on Choose file and select the downloaded firmware image. 5. Afterward click on Upload to write the image into the selected buffer. 6.4.2 Activate firmware image After you have uploaded a new firmware version, you need to activate it. 1. In the configuration back end, open the page Maintenance / Firmware. 2. In the section Activation choose the Buffer with the firmware image, which you want to activate. 3. Click on the button Activate to write the firmware image into the internal memory. Afterward the device will reboot with the new firmware. ⚠ Attention Do not disconnect the device from the voltage supply while transferring the firmware into the internal memory. This could damage the device. 6.4.3 Activate alternative firmware image If, after changing the active firmware, unexpected problems occur, you can manually activate the other firmware image on the device. To do that you will need: A ballpoint pen Maintenance, tips and troubleshooting 35 ⚠ Attention Do not use a pencil for a manual reset, as its lead could break and damage the device. 1. Disconnect the device from the voltage supply. 2. Press the reset button using the ballpoint pen. You find the button beneath the opening next to the status LED. 3. Hold the button while you reconnect Querx PT100 to the voltage supply. The device starts blinking. After a couple of seconds the blinking stops and status LED lights red. 4. Now release the button. The alternate firmware image is written into the internal memory and Querx PT100 reboots. ⚠ Attention After the activation, please wait until the device has rebooted, before you disconnect it from the voltage supply. If disconnected during the transfer process, the device could be damaged. Maintenance, tips and troubleshooting 36 6.5 Troubleshooting Problem Action to take Chapter No network connection Perform a manual network configuration. 2.5 Check if there are problems with your network. Maybe ask your network administrator Querx PT100 reacts very slow In the configuration back end, open the page. Maintenance / Firmware If the value for Memory usage is bigger than 70%, close some browser windows showing Querx PT100s web interface. Querx PT100 show strange measuring values Check if the sensor cable is connected properly. 2.1 Log in data unknown Reset system configuration. 6.2 Unknown network configuration Perform a manual network configuration 2.5 Or: Reset the system configuration 6.2 NTP / Email / Cloud do not work Check if you have provided a valid DNS server. Reboot system afterward. 4.2 II need to log in every couple of seconds Increase the value for a Session timeout. 4.3 After a firmware update Querx PT100 doesn't work as expected If there is another firmware image available on the system, reactivate it. 6.4 If you have questions that are not discussed in this manual, please don't hesitate to get in touch with the manufacturer egnite. You can find contact information in chapter 7.5 'Manufacturer and contact' Maintenance, tips and troubleshooting 37 6.6 Environment-friendly disposal Please dispose Querx PT100 according to the legislation in you country and with the environment in mind. The device contains electronic components and a battery and you must not be disposed with household waste. Please hand in the device at the disposal center. Maintenance, tips and troubleshooting 38 7 Appendix 7.1 Technical data Specifications Measuring range Sensor-dependent: -200 °C to 750 °C / -328 °F to 1382 °F Accuracy Sensor-dependent: 0,5 °C 0.9 °F Resolution 0.1 °C 0.2 °F Update time 1 second Pt100 connector 2-, 3- and 4-wires Ethernet 10/100 Mbit RJ45, HP Auto-MDIX Operating System Nut/OS 5 Firmware updates Via web interface, rescue function Data capacity At least 51 days internal Protocols DHCP, HTTP, mDNS, Modbus/TCP, SMTP, SNMP, SNTP, Syslog Web interface Password protection, diagram, live update, HTML5, CSS3, JSON and SVG, User Management (3 Users / 3 Groups) Email Up to 4 recipients over 2 SMTP accounts Status LED Red, green, yellow Date / Time Battery backed real-time clock with SNTP update Power supply 5 VDC via Micro-USB Consumption Typical 120 mA, 0.6W Maximal 200 mA, 1W Environment Operating conditions Appendix -40 °C to 85 °C, max. 95 % RH 39 -40 °F to 185 °F, max. 95 % RH Storage conditions --40 °C to 85 °C, max. 95 % RH -40 °F to 185 °F, max. 95 % RH Mechanical data Housing material ABS Thermoplast Housing color Black, RAL 9011 Housing dimensions 56,3 mm x 40 mm x 21 mm plus sensing cable 2.2 in x 1.6 in x 0.8 in plus sensing cable Weight 35 g 0.07 lb Connectors RJ45 (Ethernet), micro-USB Mounting Wall mounting Certificates Immunity EN 61326-1:2013 Class A EN 61000-4-2:2009 EN 61000-4-3:2011 EN 61000-4-4:2013 EN 61000-4-6:2009 EN 61000-4-8:2010 Emissions EN 61326-1:2013 Class B EN 55011:2011 Housing / PCB flammability UL94V-0 Protection marking IP20 RoHS compliance EU Direktive 2011/65/EU We reserve the right of error and technical modifications. A EG declaration of conformity can be obtained from the manufacturer. Appendix 40 7.2 Modbus Register Read register Address Offset Format Content 30011 10 int16 Temperature Celsius * 10 30013 12 int16 Temperature Fahrenheit * 10 30014 13 int16 Temperature Kelvin * 10 Address Offset Format Content 40021 20 int16 Temperature lower limit Celsius * 10 40022 21 int16 Temperature upper limit Celsius * 10 40023 22 int16 Temperature dead-band Kelvin / Holding register Celsius* 10 40024 23 int16 Temperature lower limit Fahrenheit * 10 40025 24 int16 Temperature upper limit Fahrenheit * 10 40026 25 int16 Temperature dead-band Fahrenheit * 10 40027 26 int16 Temperature lower limit Kelvin * 10 40028 27 int16 Temperature upper limit Kelvin * 10 7.3 SNMP Object Identifiers OID Description 1.3.6.1.4.1.3444.1.14.1.2.1.5.1 Temperature sensor 1.3.6.1.4.1.3444.1.14.2.0.101 Trap code for normal state 1.3.6.1.4.1.3444.1.14.2.0.102 Trap code for alarm state The complete MIB is on the device and can be downloaded from the Interfaces / SNMP page in the configuration back end. Appendix 41 7.4 Export data formats Querx PT100 supports data exports in two file formats: CSV Data exported in the CSV file format can be opened with any spreadsheet software. XML Data exported in the XML file format can be transferred to and processed by several applications. 7.5 Manufacturer and contact egnite GmbH Erinstrasse 9 44575 Castrop-Rauxel Germany Email: [email protected] Tel.: +49 (0)2305 441256 Fax: +49 (0)2305 441487 http://www.egnite.de http://sensors.egnite.de egnite can not be held responsible for technical and typographical mistakes. We reserve the right to alter the documentation without further announcements. Revision 1.2 © 2014 egnite GmbH, Germany. All rights reserved. All trademarks used are the property of the respective holders of the rights. Appendix 42