1
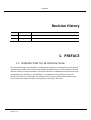
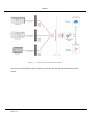
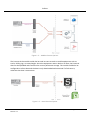
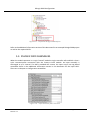
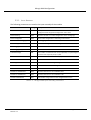
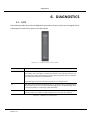
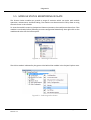
Process Cache
User Manual
A-PCM
Document No. D105-010
08/2015
Revision 1.1
Contents
CONTENTS
1.
2.
3.
PREFACE .................................................................................................................................. 3
1.1.
Introduction to the Process Cache ................................................................................... 3
1.2.
Features ............................................................................................................................ 6
1.3.
Additional Information ..................................................................................................... 8
1.4.
Support ............................................................................................................................. 8
Installation .............................................................................................................................. 9
2.1.
Module Layout ................................................................................................................. 9
2.2.
Module Mounting .......................................................................................................... 11
2.3.
Power ............................................................................................................................. 12
2.4.
RS232 Port ...................................................................................................................... 12
2.5.
Ethernet Port .................................................................................................................. 12
Setup ..................................................................................................................................... 13
3.1.
Install Configuration Software ....................................................................................... 13
3.2.
Network Parameters ...................................................................................................... 13
3.3.
Creating a New Project................................................................................................... 18
3.4.
Configuring the module ................................................................................................. 20
3.5.
Data Source Configuration ............................................................................................. 23
3.5.1.
Group and Tag Triggers ........................................................................................... 23
3.5.2.
Pi Server Digital Sets ............................................................................................... 24
3.5.3.
Logix Source ............................................................................................................ 25
3.5.4.
DF1 Source .............................................................................................................. 28
3.5.5.
Modbus Source ....................................................................................................... 29
3.6.
4.
Module Download .......................................................................................................... 29
Unload Service ...................................................................................................................... 32
4.1.
Introduction.................................................................................................................... 32
4.2.
Installation ...................................................................................................................... 32
4.3.
Service Configuration ..................................................................................................... 32
Document No. D105-010
Revision 1.1
Page i of iii
Contents
4.3.1.
General Settings ...................................................................................................... 33
4.3.2.
Add Devices ............................................................................................................. 34
4.3.3.
FT Historian / Pi Server Connection Settings .......................................................... 35
4.3.4.
SQL Server Connection Settings .............................................................................. 36
4.3.5.
Save ......................................................................................................................... 38
4.4.
5.
Operation ....................................................................................................................... 38
RSLogix 5000 Configuration .................................................................................................. 41
5.1.
Add Module to I/O Configuration .................................................................................. 41
5.2.
Importing UDTs and Mapping Routines ......................................................................... 43
5.3.
RSLogix 5000 assemblies ................................................................................................ 45
5.3.1.
6.
7.
8.
9.
Input Assembly........................................................................................................ 46
Diagnostics ............................................................................................................................ 47
6.1.
LEDs ................................................................................................................................ 47
1.1.
Module Status Monitoring in Slate ................................................................................ 48
6.2.
DF1 Packet Capture ........................................................................................................ 54
6.3.
Module Event Log........................................................................................................... 56
6.4.
Web Server ..................................................................................................................... 57
TroubleShooting.................................................................................................................... 59
7.1.
Event & Error Logging .................................................................................................... 59
7.2.
Starting and Stopping the Upload Service ..................................................................... 59
7.3.
Unlogged Records .......................................................................................................... 60
Technical Specifications ........................................................................................................ 62
8.1.
Dimensions ..................................................................................................................... 62
8.2.
Electrical ......................................................................................................................... 63
8.3.
Ethernet .......................................................................................................................... 63
8.4.
Data Cache ..................................................................................................................... 64
8.5.
Serial Port ....................................................................................................................... 64
8.6.
DF1.................................................................................................................................. 64
8.7.
Modbus .......................................................................................................................... 65
8.8.
Certifications .................................................................................................................. 65
Index...................................................................................................................................... 66
Document No. D105-010
Revision 1.1
Page ii of iii
Contents
Revision History
Revision
Date
1.0
29 May 2015
1.1
25 August 2015
Comment
Initial document
Add UL Listed mark
1. PREFACE
1.1. INTRODUCTION TO THE PROCESS CACHE
This manual describes the installation, configuration, operation, and diagnostics of the Aparian
Process Cache module. The Process Cache module (hereafter refer to as the module) can read
and store data from Logix Controllers, DF1 Serial Interfaces, or Modbus devices which can later
be uploaded to an historian or SQL database. The module has the capacity to store over
16 million records in its solid-state non-volatile memory. Each stored record includes a Date
Time stamp with a 50ms resolution, the Tag Name, Data Type, and Value.
Document No. D105-010
Revision 1.1
Page iii of iii
Preface
Figure 1.1. – Rockwell Controller Source Options
The process Cache could be used to log data at a remote site with limited communication with
its base.
Document No. D105-010
Revision 1.1
Page 4 of 63
Preface
Figure 1.2. – Modbus Source Options
The Process Cache module could also be used to store records on mobile equipment such as
trucks, drilling rigs, or snow ploughs. Once the equipment returns back to its base, the historical
data can be uploaded and transferred to a more permanent storage. The module could also be
configured to collect data and the data is only downloaded and examined if a fault occurs,
otherwise the data is overwritten.
Figure 1.3. – Non-Historian Option
Document No. D105-010
Revision 1.1
Page 5 of 63
Preface
1.2. FEATURES
The Process Cache Module provides an extensive temporary on-board storage capability for
storing process tags. A total of 16,777,216 records can be stored in the non-volatile memory.
Each record consists of the following data:
Parameter
Link
Date Time
UTC Time includes: Year, Month, Day, Hour, Minute, Second, Milliseconds.
Time has a resolution of 50 milliseconds.
Tag Name
As defined in Controller for Logix or in Slate for other sources
Data Type
BOOL, SINT, INT, DINT, or REAL
Value
Tag value
Table 1.1. – Components of a Record
The log index is managed by the module and incremented each time a new record is stored. The
unload index is managed externally by the unload service and only incremented after a record
was been logged successfully to the SQL Database, FT Historian, or text file. Both the Log Index
and Unload Indices will loop around reaching the end of the cache. The cache becomes 100%
full when the log index loops around and catches up with the unload index. In this situation,
either older records are overwritten (Log Mode = Overwrite) or newer records are not logged
(Log Mode = Hold).
Document No. D105-010
Revision 1.1
Page 6 of 63
Preface
Figure 1.4. - Memory Schematic
The Process Cache module is configured using the Aparian Slate application. This program can be
downloaded from www.aparian.com free of charge. Slate offers various configuration methods,
including a controller tag browser. Slate can also be used to monitor the modules status and
used to download the historical data to a local file.
The module can operate in both a Logix “owned” and standalone mode. With a Logix connection
the input and output assemblies will provide additional diagnostics information which will be
available in the Logix controller environment.
The module uses isolated RS232 for DF1 communication providing better noise immunity. The
RS232 port also uses a terminal block for convenient installation.
A built-in webserver provides detailed diagnostics of system configuration and operation,
including the display of received DF1 communication packets, without the need for any additional
software.
Document No. D105-010
Revision 1.1
Page 7 of 63
Preface
1.3. ADDITIONAL INFORMATION
The following documents contain additional information that can assist the user with the module
installation and operation.
Resource
Link
Slate Installation
http://www.aparian.com/software/slate
Process Cache Service
Installation
User Manual
Datasheet
Example Code & UDTs
http://www.aparian.com/products/processcache
http://www.aparian.com/products/processcache
Ethernet wiring standard
www.cisco.com/c/en/us/td/docs/video/cds/cde/cde205_220_420/installation/
guide/cde205_220_420_hig/Connectors.html
Slate User Manual
www.aparian.com/slate/D104-001 Slate User Manual.pdf
CIP Routing
The CIP Networks Library, Volume 1, Appendix C:Data Management
Table 1.1. - Additional Information
1.4. SUPPORT
Technical support is provided via the Web (in the form of user manuals, FAQ, datasheets etc.) to
assist with installation, operation, and diagnostics.
For additional support the user can use either of the following:
Resource
Link
Contact Us web link
www.aparian.com/contact-us
Support email
[email protected]
Table 1.2. – Support Details
Document No. D105-010
Revision 1.1
Page 8 of 63
Installation
2. INSTALLATION
2.1. MODULE LAYOUT
The module has three ports at the bottom of the enclosure as shown in the figure below. The
ports are used for Ethernet, RS232 serial, and power. The power port uses a three way connector
which is used for the DC power supply positive and negative (or ground) voltage as well as the
earth connection.
The RS232 port uses a four way connector. This provides connection for the communication
transmit (TX), receive (RX), and ground (GND) conductors. The fourth connection (earth) is used
for shielding the cable in high noise environments.
The Ethernet cable must be wired according to industry standards which can be found in the
additional information section of this document.
Figure 2.1. – Process Cache side and bottom view
The module provides three diagnostic LEDs as shown in the front view figure below. These LEDs
are used to provide information regarding the module system operation, the Ethernet interface,
and the auxiliary communication interface (RS232).
Document No. D105-010
Revision 1.1
Page 9 of 63
Installation
Figure 2.2. – Module front and top view
The module provides four DIP switches at the top of the enclosure as shown in the top view figure
above.
DIP Switch
Description
DIP 1
Used to force the module into “Safe Mode”. When in “Safe Mode” the module will not
load the application firmware and will wait for new firmware to be downloaded. This
should only be used in the rare occasion when a firmware update was interrupted at
a critical stage.
DIP 2
This will force the module into DHCP mode which is useful when the user has forgotten
the IP address of the module.
DIP 3
Reserved
DIP 4
Reserved
Table 2.1. - DIP Switch Settings
Document No. D105-010
Revision 1.1
Page 10 of 63
Installation
2.2. MODULE MOUNTING
The module provides a DIN rail clip to mount onto a 35mm DIN rail.
Figure 2.3. - DIN rail specification
The DIN rail clip is mounted on the bottom of the module at the back as shown in the figure
below. Use a flat screw driver to pull the clip downward. This will enable the user to mount the
module onto the DIN rail. Once the module is mounted onto the DIN rail the clip must be pushed
upwards to lock the module onto the DIN rail.
Figure 2.4. - DIN rail mouting
Document No. D105-010
Revision 1.1
Page 11 of 63
Installation
2.3. POWER
A three way power connector is used to connect Power+, Power– (GND), and earth. The module
requires an input voltage of 10 – 28Vdc. Refer to the technical specifications section in this
document.
Figure 2.5. - Power connector
2.4. RS232 PORT
The four way RS232 connector is used to connect the transmit (TX), receive (RX), and GND
conductors for serial communication. The shield terminal can be used for shielded cable in high
noise environments.
NOTE: The shield of the RS232 port is internally connected to the power connector
earth. Thus when using a shield it is important to connect the Earth terminal on
the power connector to a clean earth. Failing to do this can lower the signal quality
of the RS232 communication.
NOTE: When using a shielded cable, it is important that only one end of the shield
is connected to earth to avoid current loops. It is recommended to connect the
shield to the Process Cache module, and not to the other Serial device.
Figure 2.6. - RS232 connector
2.5. ETHERNET PORT
The Ethernet connector should be wired according to industry standards. Refer to the additional
information section in this document for further details.
Document No. D105-010
Revision 1.1
Page 12 of 63
Setup
3. SETUP
3.1. INSTALL CONFIGURATION SOFTWARE
All the network setup and configuration of the module is achieved by means of the Aparian Slate
device configuration environment. This software can be downloaded from
http://www.aparian.com/software/slate.
Figure 3.1. - Aparian Slate Environment
3.2. NETWORK PARAMETERS
The module will have DHCP (Dynamic Host Configuration Protocol) enabled as factory default.
Thus a DHCP server must be used to provide the module with the required network parameters
(IP address, subnet mask, etc.). There are a number of DHCP utilities available, however it is
recommended that the DHCP server in Slate be used.
Within the Slate environment, the DHCP server can be found under the Tools menu.
Figure 3.2. - Selecting DHCP Server
Document No. D105-010
Revision 1.1
Page 13 of 63
Setup
Once opened, the DHCP server will listen on all available network adapters for DHCP requests
and display their corresponding MAC addresses.
Figure 3.3. - DHCP Server
NOTE: If the DHCP requests are not displayed in the DHCP Server it may be due to
the local PC’s firewall. During installation the necessary firewall rules are
automatically created for the Windows firewall.
Another possibility is that another DHCP Server is operational on the network and
it has assigned the IP address.
To assign an IP address, click on the corresponding “Assign” button. The IP Address Assignment
window will open.
Figure 3.4. - Assigning IP Address
Document No. D105-010
Revision 1.1
Page 14 of 63
Setup
The required IP address can then be either entered, or a recently used IP address can be selected
by clicking on an item in the Recent List.
If the “Enable Static” checkbox is checked, then the IP address will be set to static after the IP
assignment, thereby disabling future DHCP requests.
Once the IP address window has been accepted, the DHCP server will automatically assign the IP
address to the module and then read the Identity object Product name from the device.
The successful assignment of the IP address by the device is indicated by the green background
of the associated row.
Figure 3.5. - Successful IP address assignment
It is possible to force the module back into DHCP mode by powering up the device with DIP switch
2 set to the On position.
A new IP address can then be assigned by repeating the previous steps.
NOTE: It is important to return DIP switch 2 back to Off position, to avoid the
module returning to a DHCP mode after the power is cycled again.
If the module’s DIP switch 2 is in the On position during the address assignment, the user will be
warned by the following message.
Figure 3.6. - Force DHCP warning
Document No. D105-010
Revision 1.1
Page 15 of 63
Setup
In addition to the setting the IP address, a number of other network parameters can be set during
the DHCP process. These settings can be viewed and edited in Slate’s Application Settings, in the
DHCP Server tab.
Once the DHCP process has been completed, the network settings can be set using the Ethernet
Port Configuration via the Target Browser.
The Target Browser can be accessed under the Tools menu.
Figure 3.7. - Selecting the Target Browser
The Target Browser automatically scans the Ethernet network for EtherNet/IP devices.
Figure 3.8. - Target Browser
Right-clicking on a device, reveals the context menu, including the Port Configuration option.
Document No. D105-010
Revision 1.1
Page 16 of 63
Setup
Figure 3.9. - Selecting Port Configuration
All the relevant Ethernet port configuration parameters can be modified using the Port
Configuration window.
Figure 3.10. - Port Configuration
Alternatively, these parameters can be modified using Rockwell Automation’s RSLinx software.
Document No. D105-010
Revision 1.1
Page 17 of 63
Setup
3.3. CREATING A NEW PROJECT
Before the user can configure the module, a new Slate project must be created. Under the File
menu, select New.
Figure 3.11. - Creating a new project
A Slate project will be created, showing the Project Explorer tree view. To save the project use
the Save option under the File menu.
A new device can now be added by selecting Add under the Device menu.
Figure 3.12. - Adding a new device
Document No. D105-010
Revision 1.1
Page 18 of 63
Setup
In the Add New Device window select the Process Cache Module, and click the Ok button.
Figure 3.13. – Selecting a new Process Cache Module
The device will appear in the Project Explorer tree as shown below, and its configuration window
opened.
The device configuration window can be reopened by either double clicking the module in the
Project Explorer tree or right-clicking the module and selecting Configuration.
Figure 3.14. – Process Cache module configuration
Document No. D105-010
Revision 1.1
Page 19 of 63
Setup
Refer to the additional information section in this document for Slate’s installation and operation
documentation.
3.4. CONFIGURING THE MODULE
The Process Cache module will be configured by Slate. Refer to the additional information section
for documentation and installation links for Aparian Slate. The configuration consists of a general
configuration, serial configuration for DF1 or Modbus RTU, as well as data source configuration
and tag selections. When downloading this configuration into the module it will be saved in nonvolatile memory that persists when the module is powered down.
NOTE: When a firmware upgrade is performed the module will clear all
configuration and cached records.
The general configuration consists of the following parameters:
Parameter
Description
Instance Name
This parameter is a user defined name to identify between various Process Cache
modules.
Description
This parameter is used to provide a more detail description of the application for the
module.
Major Revision
The major revision of the module
IP Address
The module’s IP address used by Slate to communicated with the module.
Data Source
This parameter selects the source of the data.
Logix – Rockwell Automation ControlLogix or Compact Logix controller.
DF1 – Serial DF1
ModbusRTU – Serial Modbus
ModbusTCP – Modbus over Ethernet
Logging Mode
This parameter determines if records are overwritten once the memory is filled.
Overwrite – old records are overwritten giving priority to newer data.
Hold – old records are preserved while new records are not stored.
LogPrefix
The LogPrefix is added the front of all tag names when uploaded and stored in the
Historian or Sql Database. A period is automatically added as the separator. Example:
LogPrefix.TagName
This parameter can be left blank if not needed.
Table 3.1 - General configuration parameters
Document No. D105-010
Revision 1.1
Page 20 of 63
Setup
The general configuration is shown in the figure below. The general configuration window is
opened by either double clicking on the module, in the tree, or right-clicking the module or
selecting Configuration.
Figure 3.15. - General Configuration
The Serial configuration found using the Serial Tab consist of general Serial and DF1 specific
parameters. For ModbusRTU, only the Baud Rate and Parity need be configured.
Parameter
Description
BAUD Rate
The BAUD rate will configure at what speed the data is sent across the RS232
serial network. The module provides the following speeds:
1200, 2400, 4800, 9600, 19200, 38400, 57600, and 115200
Parity
The parity parameter will configure the parity of the module’s RS232 serial port.
The module allows for Even, Odd, or None parity setting.
Protocol
The protocol parameter will configure the module to operate in full duplex or half
duplex mode on the DF1 network.
Document No. D105-010
Revision 1.1
Page 21 of 63
Setup
Error Detection
The module can be configured to perform either BCC or CRC checksum validation
on incoming and outgoing packets. CRC checksums is a much stronger validation
method when compared to BCC but is more processor intensive to perform.
Embedded Response
This parameter configures the module to add the acknowledge responses in the
data payload. The user can configure the module to be Auto Detect or On.
This function is only available in Full Duplex mode.
Node Address
The node address is the local node address of the module.
Retry Limit
The retry limit determines how many times the module must retry and message
exchange before failing it.
ACK Timeout
The ACK timeout is used to determine the interval between retries when a
message exchange has failed.
Reply Msg Wait
The reply message wait is the minimum delay before the DF1 reply is transmitted
to the DF1 device.
Duplicate Detection
This parameter will configure the module to check for duplicate packets and
flagging them when they occur.
Table 3.2 - Serial ModbusRTU and DF1 configuration parameters
The serial configuration tab is shown in the figure below. The Serial configuration window is
opened by either double clicking on the module in the tree or right-clicking the module and
selecting Configuration. Once in the configuration window select the second tab at the top Serial.
Figure 3.16 - Serial configuration
Document No. D105-010
Revision 1.1
Page 22 of 63
Setup
3.5. DATA SOURCE CONFIGURATION
The Data Source parameter set on the General Tab determines which the communication mode
the module will use to acquire the data. The configuration of all other modes will be disabled.
The Data Source options include:
•
Logix – ControlLogix and Compact Logix controllers.
•
DF1 – For collecting data over DF1 Serial communications.
•
Modbus – for ModbusRTU (Serial) and ModbusTCP (Ethernet) communications.
Once the mode is selected, each Tab allows the configuration of up to three source devices and
a total of 200 tags.
Tags can logged either as a result of their individual loggin criteria or via a group trigger. There
are eight trigger groups (A thru H) and a tag can be members of any combination from none to
all. Groups are in turn triggered by one or more tags. The triggering of a group ensures that all
its member’s values are logged at the same instance.
3.5.1. GROUP AND TAG TRIGGERS
Three parameters determine when each tag is triggered:
•
Delta Y (Δy) – A change in the value of the tag by this amount or more, AND
•
Min ΔT – The minimum time in seconds between each consecutive trigger, OR
•
Max ΔT – The maximum time between each consecutive trigger.
The first two parameters work together to ensure tags are not logged too frequently and the Max
ΔT set a minimum logging frequency.
Figure 3.17 – Group and Tag Triggers
Document No. D105-010
Revision 1.1
Page 23 of 63
Setup
3.5.2. PI SERVER DIGITAL SETS
Digital Sets are used to store digital enumerations in FT Historian and OSI PI Server. All Boolean
datatypes are translated to a PI Server Digital datatype which must have a predefined associated
digital set. Digital Sets are not used when logging to a SQL Server.
Example: Tag Pump.Running could be set to Digital Set OFF_ON
Value: 0 = OFF,
Value: 1 = ON.
Digital Sets can also be used to enumerate larger sets. For example an error condition with three
states defined as an SINT with values 0, 1, & 2 can be enumerated to OK, Warning, & Fault. See
FT Historian documentation for more information.
Digital Sets cannot be created through the Aparian Slate and need to be created in FT Historian
or through a PIOleDb interface. Records or type BOOL that do not have a Digital Set defined will
be logged to the error file.
NOTE: Boolean tags must have a predefined Digital Set configured in FT Historian / PI
Server for the tag to be logged. Digital Set names are Case sensitive and must match
exactly.
A list of all Digital Sets used needs to be entered under the Pi Server Digital Set tab before they
tab be associated with individual tags.
Figure 3.18. - List of Digital Sets
Document No. D105-010
Revision 1.1
Page 24 of 63
Setup
Figure 3.19. - Associating Digital Sets to Tags
3.5.3. LOGIX SOURCE
The Logix Source tab is used to configure tags from Rockwell Automation Logix controllers over
EtherNet/IP. The module can read tags from three separate controllers. A Target Name must be
provided. This acts as a reference to the Logix CIP path. The Target Name does not have to match
the actual controller name set in RSLogix. The Controller’s CIP Path can either be typed in or
selected from a list in the Target Browser.
Figure 3.17 – Logix Source Configuration Tab
Click the button in the browse column to launch the Target Browser. The Target Browser will
open and automatically scan for all available EtherNet/IP devices.
Document No. D105-010
Revision 1.1
Page 25 of 63
Setup
Figure 3.21. – Target Browser Window
If the Ethernet/IP module is a bridge module, it can be expanded by right-clicking on the module
and selecting the Scan option.
Figure 3.22. - Scanning node in the Target Browser
The required Logix controller can then be chosen by selecting it and clicking the Ok button, or by
double-clicking on the controller module.
Once the controller references have been setup, individual Logix tags can be added. Tags can
either be entered manually or selected using the Tag Browser associated with each controller.
Document No. D105-010
Revision 1.1
Page 26 of 63
Setup
Figure 3.23. - Logix Tag configuration
NOTE: Tag names need to match exactly for the module to be able to correct identity
the tag. Full tag names need to be provided for tags located in program scopes.
To launch the Tag Browser, click the Browse Tags button associated with the controller. Tags
that are were already selected and identified will be highlighted in green. See Fig 3.24.
Figure 3.24. – Tag Browser Selection
Tags can be removed by selected the rows in the left hand margin, and right clicking to display
the delete option.
Document No. D105-010
Revision 1.1
Page 27 of 63
Setup
Figure 3.25 – Deleting Tags
3.5.4. DF1 SOURCE
A maximum of three DF1 Sources can be configured. The configuration of each source requires a
Device Name (used as a reference for tag data sources), the Device Type (either PLC5 or SLC), and
a Node Address.
Each DF1 Tag requires a unique Tagname and Data Address.
Figure 3.26. – DF1 Source configuration
Document No. D105-010
Revision 1.1
Page 28 of 63
Setup
3.5.5. MODBUS SOURCE
Both Modbus RTU and Modbus TCP are configured using the same tab. When Modbus RTU is
selected as the data source, the IP Address column is not shown. A maximum of three Modbus
sources can be configured. The configuration of each source requires a Device Name (used as a
reference for tag data sources), the IP Address (for Modbus TCP), and a Node Address.
Fig 3.27 – Modbus Source Configuration
3.6. MODULE DOWNLOAD
Once the configuration has been completed, it must be downloaded to the module.
Before downloading the Connection Path of the module should be set. This path will
automatically default to the IP address of the module, as set in the module configuration. It can
however be modified, if the Process Cache Module is not on a local network.
The Connection path can be set by right-clicking on the module and selecting the Connection
Path option.
Document No. D105-010
Revision 1.1
Page 29 of 63
Setup
Figure 3.28. - Selecting Connection Path
The new connection path can then be either entered manually or selected by means of the
Target Browser.
Figure 3.29. - Connection Path
To initiate the download, right-click on the module and select the Download option.
Figure 3.30. - Selecting Download
Document No. D105-010
Revision 1.1
Page 30 of 63
Setup
Once complete, the user will be notified that the download was successful.
Figure 3.18. - Successful download
During the download process the module’s time will be compared to that of the PC’s time.
Should the difference be greater than 30 seconds, the user will be prompted to set the module
time to that of the PC time.
Figure 3.192. – Setting module time
The module time is used only for the event log.
Within the Slate environment the module will be in the Online state, indicated by the green
circle around the module.
The module is now configured.
Figure 3.33 - Module Online
Document No. D105-010
Revision 1.1
Page 31 of 63
Unload Service
4. UNLOAD SERVICE
4.1. INTRODUCTION
The Process Cache Unload Service contains two parts. A background windows service (The
Service) that communicates with the configured Process Cache modules and uploads records at
a configured interval and stores the records in either a SQL database or FT Historian or PIServer.
The second component is a User Interface to the service used to configure and monitor the
uploading process. The user Interface is hereafter referred to as The Monitor.
4.2. INSTALLATION
One setup file installs both the Service and the Monitor. The installation file can be downloaded
from http://www.aparian.com/products/processcache.
The Setup.exe installs in C:\Program Files (x86)\Aparian\Process Cache and automatically
starts the service.
4.3. SERVICE CONFIGURATION
Launch the Monitor from the start menu
Figure 4.1. - Process Cache Service Monitor
Document No. D105-010
Revision 1.1
Page 32 of 63
Unload Service
The status bar along the bottom of the form will display the word Connected with a green
background if the Monitor is able to connect to the background Service. If the status bar is Red
check that the Service is running. See Trouble Shooting.
Launch the Setup Form from the menu bar.
4.3.1. GENERAL SETTINGS
The General tab contains settings that apply to all modules that connect to the service. These
parameters include:
Setup Parameter
Description
Ping Interval
Defines the period (frequency) that the Service checks for the presence of Process
Cache modules on the network. Presence is determined by a match of the both the IP
address and the Serial Number. If present, the modules status is read.
Update Clock Interval
The frequency that the module’s clock is synchronized with the server (workstation
that the Service is running on).
Max Clock Offset
The maximum allowable offset between module clock and server clock.
Log Event Threshold
Sets the threshold of entries made to the Windows Event Viewer: under
Applications and Services Log / Aparian. See Trouble Shooting for more information.
Table 4.1. – General Monitor Setup Parameters
If the Service determines the module’s clock needs to be synchronized the actual synchronization
is performed only after the upload is completed.
Document No. D105-010
Revision 1.1
Page 33 of 63
Unload Service
Figure 4.2. – General Monitor Settings
4.3.2. ADD DEVICES
To add Process Cache modules to the Service, select the devices tab and click add. The IP
Address and module Serial Number are required to uniquely identify each module. Set the
Upload Interval and the Output To either Pi Server or SQL Database.
Setup Parameter
Description
IP Address
The IP Address of the module.
Serial Number
Module Serial Number – must be in the format XXXX-XXXX where each X is an alphanumeric value.
Upload Interval
Sets the frequency that records are uploaded from the module based on last upload
event. If the module is not online the upload will be triggered when next online as
determined by the Ping Interval Event in General settings.
Output To:
Sets where the uploaded records are to be logged. Select Pi Server for OSI Pi Server
and FT Historian, SQL Server for logging to a SQL server.
Instance Name
This value is read from the module. (Value is configured in Slate.)
Description
This value is read from the module. (Value is configured in Slate.)
Logging Mode
This value is read from the module. (Value is configured in Slate.)
Data Source
This value is read from the module. (Value is configured in Slate.)
Table 4.2. – General Monitor Setup Parameters
Document No. D105-010
Revision 1.1
Page 34 of 63
Unload Service
Figure 4.3. – Adding Devices to the Upload Service
The build (…) button next to the IP Address can be used to launch the target browser and selected
the device if it is currently online.
4.3.3. FT HISTORIAN / PI SERVER CONNECTION SETTINGS
If any of the devices are logging records to FT Historian or OSI Pi Server, the connection
parameters need to be set. The use of the piAdmin User Name is discouraged.
Figure 4.4. – FT Historian / Pi Server Connection Parameters
Document No. D105-010
Revision 1.1
Page 35 of 63
Unload Service
The connection can tested by selecting the Test Connection button. The test procedure
ensures the connection parameters are correct and ensures that it can read data from both the
Points table and Digital Sets table. If any step fails, the test is halted.
Figure 4.5. - Pi Server Connection Test
4.3.4. SQL SERVER CONNECTION SETTINGS
If any of the devices are logging records to a SQL Server database, the connection parameters
need to be set.
The Setup Parameters also include the table names for the Config and Archive tables. The
Config table contains information about each tag while the archive table contains the time
stamped data.
Document No. D105-010
Revision 1.1
Page 36 of 63
Unload Service
Figure 4.6 – SQL Server Connection Parameters
The Test Connection button test the connection to the SQL Server as well as read and write
privileges to the Config and Archive tables.
Figure 4.7. – SQL Connection Test
If either the Config or Archive table do not exist in the database, the service will create them
automatically. The service will not however create the catalog (database) if it does not exist.
Table columns are as follows:
Document No. D105-010
Revision 1.1
Page 37 of 63
Unload Service
Column
DataType
Description
LastSerialNum
varchar(12)
Serial Number of last uploaded module
ControllerName
varchar(32)
Primary Key – Controller/ Target Name as configured in Slate
TagName
varchar(32)
Primary Key – Tag Name as listed in Slate
DataType
varchar(10)
Tag data type:- BOOL, SINT, INT, DINT, or REAL
TagPreFix
varchar(64)
Prefix added to TagName in Archive Table
Table 4.3. – Config Table Columns
Column
DataType
Description
DateTime
datetime
Primary Key – UTC Date and Time including milliseconds.
SerialNum
varchar(12)
Serial Number of module record was uploaded from
ControllerName
varchar(32)
Primary Key – Tag Name as listed in Slate
TagName
varchar(96)
Primary Key – Tag Name with TagPreFix with period separator
Value
real
Prefix added to TagName in Archive Table
Table 4.4. – Archive Table Columns
4.3.5. SAVE
Once the Setup is complete – click the Save button at the bottom of the form.
The setup is passed to the service which stores an encrypted copy on the local hard drive.
C:\ProgramData\Aparian\CacheServiceConfig.pcc
4.4. OPERATION
After the Setup is passed to the service, the Monitor will display the latest status from each
module. Modules that are the process of unloading records will be highlighted in green.
Document No. D105-010
Revision 1.1
Page 38 of 63
Unload Service
Figure 4.8. - Monitor showing upload in progress
Displayed Status parameters include:
Parameter
Description
Online
Whether the module was present during the last ping event - True / False
Device Name
Device Instance Name as configured in Slate
Serial Number
Module Serial Number
Last Ping
Date & Time of last Ping Event
Last Update
Date & Time of Last Uploaded completed
Records Cached
Records Cached in the module at last Ping Event
Records Uploaded
Records Uploaded during last upload event
Clock Offset
Clock Offset in seconds between Module and server
Database Status
Connection and Logging Status:
Ok: - Connected to Database – All records logging successfully,
Minor Fault: - One or more individual records incurred a log error and were written to the
Error File,
Fault:- A connection could not be established to the database – no records are being
marked as uploaded.
Details
Display additional status information
Table 4.5. – Archive Table Columns
The following functions can be accessed by right clicking on module’s row in the Monitor:
Parameter
Description
Refresh
Requests updated status and refreshes the display
Document No. D105-010
Revision 1.1
Page 39 of 63
Unload Service
View Details
Displays additional status information
Force Upload
Overrides Update Interval and forces upload at next Ping Event
Update Clock
Sets Clock Update to occur after next upload
Table 4.6. – Monitor Functions
Figure 4.9 – Exposed Functions
Figure 4.10. – Additional Status Information
Document No. D105-010
Revision 1.1
Page 40 of 63
RSLogix 5000 Configuration
5. RSLOGIX 5000 CONFIGURATION
5.1. ADD MODULE TO I/O CONFIGURATION
The module can operate in both a Logix “owned” and standalone mode. When the module
operates in a Logix “owned” mode the Process Cache Module will need to be added to the
RSLogix 5000 / Studio5000 IO tree. The module will need to be added as a generic Ethernet
module. This is done by right clicking on the Ethernet Bridge in the RSLogix 5000 and selecting
New Module after which the ETHERNET-MODULE is selected to be added as shown in the figure
below.
NOTE: See the next section for importing the configuration (L5X).
Figure 5.1. - Add a Generic Ethernet Module in RSLogix 5000
The user must enter the IP address of the Process Cache Module that will be used. The assembly
instance and size must also be added for the input, output, and configuration in the connection
parameters section. Below are the required connection parameters.
Connection Parameter
Assembly Instance
Size
Input
103
29 (32-bit)
Output
104
1 (32-bit)
Document No. D105-010
Revision 1.1
Page 41 of 63
RSLogix 5000 Configuration
Configuration
102
0 (8-bit)
Table 5.1. - RSLogix class 1 connection parameters for the Process Cache
Figure 5.2. - RSLogix General module properties in RSLogix 5000
NOTE: The user will need to enter the exact connection parameters before the
Logix controller will establish a class 1 connection with the module.
Next the user needs to add the connection requested packet interval (RPI). This is the rate at
which the input and output assemblies are exchanged. The recommended value is 500ms. Refer
to the technical specification section in this document for further details on the limits of the RPI.
NOTE: Although the module is capable of running with an RPI of 10ms, it is
recommended to set the RPI to 500ms, to avoid unnecessary loading of the
module processor.
Document No. D105-010
Revision 1.1
Page 42 of 63
RSLogix 5000 Configuration
Figure 5.3. - Connection module properties in RSLogix 5000
Once the module has been added to the RSLogix 5000 IO tree the user must assign the User
Defined Types (UDTs) to the input and output assemblies. The user can import the required UDTs
by right-clicking on User-Defined sub-folder in the Data Types folder of the IO tree and selecting
Import Data Type. The assemblies are then assigned to the UDTs with a ladder copy instruction
(COP) as shown in the figure below.
Figure 5.4. – RSLogix 5000 I/O module tree
5.2. IMPORTING UDTS AND MAPPING ROUTINES
To simplify the mapping of the input image, an RSLogix 5000 Routine Partial Import (L5X) file is
provided.
This file can be imported by right-clicking on the required Program and selecting the Import
Routine option.
Document No. D105-010
Revision 1.1
Page 43 of 63
RSLogix 5000 Configuration
Figure 5.6. – RSLogix 5000 Importing Process Cache specific routine and UDTs
Figure 5.7. - Selecting partial import file
The import will create the following:
•
The required UDTs (user defined data types)
•
One controller tags representing the Input assembly.
•
A routine mapping the Process Cache module to the aforementioned tag.
The user may need to change the routine to map to the correct Process Cache module instance
name, and make sure that the mapping routine is called by the Program’s Main Routine.
Document No. D105-010
Revision 1.1
Page 44 of 63
RSLogix 5000 Configuration
Figure 5.8. - Imported RSLogix 5000 objects
Refer to the additional information section of this document for an example RSLogix 5000 project
as well as the required UDTs.
5.3. RSLOGIX 5000 ASSEMBLIES
When the module operates in a Logix “owned” mode the Logix controller will establish a class 1
cyclic communication connection with the Process Cache module. An input assembly is
exchanged at a fix interval. The UDTs provided will convert the input arrays into tag based
assemblies. Refer to the additional information section in this document for the input UDTs.
There are no Output or Configuration assemblies.
Figure 5.9. - Input assembly UDT structure
Document No. D105-010
Revision 1.1
Page 45 of 63
RSLogix 5000 Configuration
5.3.1. INPUT ASSEMBLY
The following parameters are used in the input assembly of the module.
Parameter
Datatype
Description
Instance
STRING
This parameter is the instance name of the module that was
configured under the general configuration tab in Slate.
Status.Running
BOOL
Set if the module has a valid configuration and is reading tags.
Status.ConfigValid
BOOL
Set if a valid configuration is executing in the module.
Status.ContinuousLogging
BOOL
Set if Logging Mode set to Overwrite, clear for Hold.
Status.ConfigurationValid
BOOL
Set if a valid configuration is executing in the module.
Status.LoggingInhibited
BOOL
Not Used.
Status.LoggingStopped
BOOL
Not Used.
CachePercentage
REAL
The number of cached records not yet uploaded, as a percentage of
the total record capacity of 16,777,216.
CacheRecordCount
DINT
The number of cached records not yet uploaded.
TotalRecordCount
DINT
The total number of cached records uploaded or not.
ActiveTagCount
DINT
The number of individual tags configured to be read.
DataSource .EtherNetIP
BOOL
Set if the data source is set to Logix.
DataSource .DF1
BOOL
Set if the data source is set to DF1.
DataSource .ModbusRTU
BOOL
Set if the data source is set to Modbus-RTU.
DataSource .ModbusTCP
BOOL
Set if the data source is set to Modbus-TCP.
DataSourceReadCount
DINT
The number of tag reads from the configured data source.
Table 5.2. - RSLogix 5000 input assembly parameters
Document No. D105-010
Revision 1.1
Page 46 of 63
Diagnostics
6. DIAGNOSTICS
6.1. LEDS
The module provides three LEDs for diagnostics purposes as shown in the front view figure below.
A description of each LED is given in the table below.
Figure 6.1 - Process Cache front view
LED
Description
Ok
The module Ok LED will provide information regarding the system-level operation of
the module. Thus if the LED is red then the module is not operating correctly. For
example if the module application firmware has been corrupted or there is a hardware
fault the module will have a red Module LED.
If the LED is green then the module has booted and is running correctly.
Act
The activity LED is used for the RS232 serial port. Thus every time a successful DF1 or
Modbus-RTU packet was received the LED will toggle green. The LED will toggle red if
a corrupted packet was received (eg. failed checksum).
Eth
The Ethernet LED will light up when an Ethernet link has been detected (by plugging in
a connected Ethernet cable). The LED will flash every time traffic was detected.
Table 6.1 - Module LED operation
Document No. D105-010
Revision 1.1
Page 47 of 63
Diagnostics
1.1. MODULE STATUS MONITORING IN SLATE
The Process Cache module can provide a range of statistics which can assist with module
operation, maintenance, and fault finding. The statistics can be accessed in full by Slate or using
the web server in the module.
To view the module’s status in the Aparian-Slate environment, the module must be online. If the
module is not already Online (following a recent configuration download), then right-click on the
module and select the Go Online option.
Figure 6.2. - Selecting to Go Online
The Online mode is indicated by the green circle behind the module in the Project Explorer tree.
Figure 6.3. - Selecting online Status
Document No. D105-010
Revision 1.1
Page 48 of 63
Diagnostics
The Status monitoring window can be opened by either double-clicking on the Status item in the
Project Explorer tree, or by right-clicking on the module and selecting Status.
The status window contains multiple tabs to display the current status of the module.
Figure 6.4. - Status monitoring - General
The General tab displays the following general parameters and can also be used to set the module
time to the PC time:
Parameter
Description
Data Source
Logix, DF1, Modbus-RTU, Modbus-TCP
State
Indicates whether or not the module is currently owned (Class 1) by a Logix controller.
Logging Mode
Hold or Overwrite – determines if records are over written when the cache is full.
Logging State
Not Used.
Owned
Indicates whether or not the module is currently owned (Class 1) by a Logix controller.
Up Time
Indicates the elapsed time since the module was powered-up.
Module Time
Indicates the module’s internal time. The module time is stored in UTC (Universal
Coordinate Time) but displayed on this page according to the local PC Time Zone
settings
MAC Address
Displays the module’s unique Ethernet MAC address.
Temperature
The internal temperature of the module.
Document No. D105-010
Revision 1.1
Page 49 of 63
Diagnostics
Processor Scan
The amount of time (microseconds) taken by the module’s processor in the last scan.
DIP Switch Position
The status of the DIP switches when the module booted.
Note that this status will not change if the DIP switches are altered when the module
is running.
Table 6.2 - Parameters displayed in the Status Monitoring – General Tab
Figure 6.5. - Status monitoring - Transactions
The Statistics tab displays the statistics associated with the record cache and data source.
Statistic
Description
Total Records
The total number of cached records uploaded or not.
Cache Records
The number of cached records not yet uploaded.
Cache Percentage
The number of cached records not yet uploaded, as a percentage of the total record
capacity of 16,777,216.
Active Tags
The number of individual tags configured to be read.
Data Source Reads
The number of tag reads from the configured data source.
Log Page
The current memory page currently being written to. Each page holds 128 records.
Log Index
The current record index being written to.
Unload Index
The upload record index. Managed by the Unload Service.
Document No. D105-010
Revision 1.1
Page 50 of 63
Diagnostics
Table 6.3 – Cache Statistics
The following Tag Mapping statistics are only relevant when the module is running in either
Reactive Tag or Scheduled Tag mode.
Statistic
Description
Current Connections
The number of current open class 3 connections.
Connection Failures
The number of failed attempts at establishing a class 3 connections with a Logix
controller.
Tag Not Exist Errors
The number of tag read and tag write transactions that failed due to the destination
tag not existing.
Privilege Violation
Errors
The number of tag read and tag write transactions that failed due to a privilege
violation error.
This may be caused by the External Access property of the Logix tag being set to
either None or Read Only.
Tag Reads
The number of tag read transactions executed by the module.
Table 6.4 - Tag Mapping statistics
The Tag Status tab provides current values for all tags together with their trigger settings.
Figure 6.6. – Tag Status
Document No. D105-010
Revision 1.1
Page 51 of 63
Diagnostics
The Recent Records tab provides a list of the last records recorded with their time stamp and
value.
The Record Management tab provides options to down load records to a comma separated
(csv) file format for import into Excel or other program. An option to Rest the Log Indices and
clear the cache are also available.
Figure 6.7 – Record Management
Ethernet Clients tab provides a count of Ethernet and EtherNet/IP connections.
Document No. D105-010
Revision 1.1
Page 52 of 63
Diagnostics
Figure 6.8 – Ethernet Connection Counts
Figure 6.9 – TCP and ARP Table Entries
Document No. D105-010
Revision 1.1
Page 53 of 63
Diagnostics
6.2. DF1 PACKET CAPTURE
The module provides the capability to capture the DF1 traffic for analysis. The will allow the user
and the support team to resolve any possible issue on site.
To invoke the capture of the module double-click on the DF1 Packet Capture item in the Project
Explorer tree.
Figure 6.10. - Selecting DF1 Packet Capture
The DF1 Packet Capture window will open and automatically start capturing all DF1 packets.
NOTE: The module keeps a circular buffer of the last 20 DF1 packets, and thus
there may be up to 20 packets in the capture that were received / sent before the
capture was initiated.
Figure 6.11 - DF1 packet capture
Document No. D105-010
Revision 1.1
Page 54 of 63
Diagnostics
To display the captured DF1 packets, the capture process must first be stopped, by pressing the
Stop button.
Figure 6.12. - DF1 Packet Capture complete
The captured DF1 packets are tabulated as follows:
Statistic
Description
Index
The packet index, incremented for each packet sent or received.
Time
The elapsed time since the module powered up.
Status
The status of the packet. Received packets are checked for valid DF1
constructs and valid checksums.
Dirn
The direction of the packet, either transmitted (Tx) or received (Rx).
Src
DF1 node address of the message source.
Dest
DF1 node address of the message destination.
Description
Brief description of the packet, usually the command.
Address
The string representing a PLC data address, where applicable.
Detail
Additional details associated with command.
TNS
Transaction number. Used to match request and reply messages.
Data
The packet’s raw data displayed in space delimited hex.
Table 6.4. - DF1 Packet Capture fields
The packet capture can be saved to a file for further analysis, by selecting the Save button on the
toolbar. Previously saved DF1 Packet Capture files can be viewed by selecting the DF1 Packet
Capture Viewer option in the tools menu.
Document No. D105-010
Revision 1.1
Page 55 of 63
Diagnostics
Figure 6.7. - Selecting the DF1 Packet Capture Viewer
6.3. MODULE EVENT LOG
The Process Cache module logs various diagnostic records to an internal event log. These logs are
stored in non-volatile memory and can be displayed using Slate or via the web interface.
To view them in Slate, select the Event Viewer option in the Project Explorer tree.
Figure 6.8. - Selecting the module Event Log
The Event Log window will open and automatically read all the events from the module.
The log entries are sorted so as to have the latest record at the top. Custom sorting is achieved
by double-clicking on the column headings.
Document No. D105-010
Revision 1.1
Page 56 of 63
Diagnostics
Figure 6.9. – Module Event Log
The log can also be stored to a file for future analysis, by selecting the Save button in the tool
menu. To view previously saved files, use the Event Log Viewer option under the tools menu.
6.4. WEB SERVER
The Process Cache module provides a web server allowing a user without Slate or RSLogix 5000
to view various diagnostics of the module. This includes Ethernet parameters, system event log,
advanced diagnostics, and application diagnostics (DF1 diagnostics).
NOTE: The web server is view only and thus no parameters or configuration can
be altered from the web interface.
Document No. D105-010
Revision 1.1
Page 57 of 63
Diagnostics
Figure 6.10. - Web interface
Document No. D105-010
Revision 1.1
Page 58 of 63
TroubleShooting
7. TROUBLESHOOTING
7.1. EVENT & ERROR LOGGING
The level of event and error can be set in the Service Monitor’s Setup form to Info, Warning, or
Error. So view the messages, open the Windows Event Viewer by clicking the Start Button and
typing Event Viewer into the Search Programs and Files box. Select the Event Viewer option under
Programs.
Figure 7.1. – Launching the Event Viewer
Aparian Logs all messages to the Applications and Services Logs, Aparian.
7.2. STARTING AND STOPPING THE UPLOAD SERVICE
To start or stop the Upload Service, launch the Windows Services Viewer by clicking the Start
Button and typing Services into the Search Programs and Files box. Select View Local Services
under Control Panel. Alternatively form the Control Panel, select Administrative Tools, and then
Services.
If the Upload Service is installed, it will be displayed as “Process Cache Service” with the
Description of “Aparian, Inc. Process Cache Upload and Logging Service”. The status will be
Started if running and the Startup Type as Automatic.
The service can be Stopped or Started by right clicking the Service in the list and selection the
appropriate option.
Document No. D105-010
Revision 1.1
Page 59 of 63
TroubleShooting
Figure 7.2. – Windows Event Viewer
If the Monitor’s Status bar is Red with the No Connection message indicates that the Service is
not running and needs to be started.
Figure 7.3. – Service Monitor with no connection to the Service
7.3. UNLOGGED RECORDS
If the Service cannot connect to the SQL database or Pi Server, the Unload Index will not be
updated and records will remain on the Process Cache Device until they are overwritten (See
Logging Mode). In this situation, the Service Monitor will display “Fault” as shown below.
Figure 7.4. – Database Connection Fault.
Document No. D105-010
Revision 1.1
Page 60 of 63
TroubleShooting
To remedy this condition, check the connection parameters and run the Test Connection
procedure in the Monitor Setup form for a more detailed diagnostics.
A Minor Fault is caused when individual records cannot be logged. Either because the
connectivity was lost or the records parameters violated one or more database rules. These
records
are
logged
to
a
text
file
located
at
C:\ProgramData\Aparian\CacheErrantData(Date).csv.
Primary Key violations are an exception and are ignored. Primary Key violations occur when a
record has already been uploaded or already exists in the database.
Figure 7.5. – Database Minor Fault.
NOTE: When opening the csv file in Microsoft Excel, the DateTime field will not
display seconds. Select the Column and change the Cell Format to
mm/dd/yyyy hh:mm:ss.000.
Text file fields are: DateTime, TagID, DataType, Value, Error Message, TagName, Source Name.
Document No. D105-010
Revision 1.1
Page 61 of 63
Technical Specifications
8. TECHNICAL SPECIFICATIONS
8.1. DIMENSIONS
Below are the enclosure dimensions as well as the required DIN rail dimensions. All dimensions
are in millimetres.
Figure
8.1 - Module enclosure dimensions
Figure 8.2 - Required DIN dimensions
Document No. D105-010
Revision 1.1
Page 62 of 63
Technical Specifications
8.2. ELECTRICAL
Specification
Rating
Power requirements
Input: 10 – 28V DC, (70 mA @ 24 VDC)
Power consumption
1.7 W
Connector
3-way terminal
Conductors
24 – 18 AWG
Enclosure rating
IP20, NEMA/UL Open Type
Temperature
0 – 60 °C
Earth connection
Yes, terminal based
Emissions
IEC61000-6-4
ESD Immunity
EN 61000-4-2
Radiated RF Immunity
IEC 61000-4-3
EFT/B Immunity
EFT: IEC 61000-4-4
Surge Immunity
Surge:IEC 61000-4-5
Conducted RF Immunity
IEC 61000-4-6
Table 8.1 - Electrical specification
8.3. ETHERNET
Specification
Rating
Connector
RJ45
Conductors
CAT5 STP/UTP
ARP connections
Max 20
TCP connections
Max 20
CIP connections
Max 10
Communication rate
10/100Mbps
Duplex mode
Full/Half
Auto-MDIX support
Yes
Table 8.2 - Ethernet specification
Document No. D105-010
Revision 1.1
Page 63 of 63
Technical Specifications
8.4. DATA CACHE
Specification
Rating
Max Record Count
16,777,216
Maximum tag count
200
Delta change
Log criteria supported
Heart beat
Tag Triggers
Minimum Log Interval
50ms
Data Types Supported
Bool, SInt, Int, DInt, Real
Cached Records Non-Volatile
Yes
Log triggers supported
Yes
Logix Tags
Data Sources
DF1 Files
Modbus (RTU and TCP) registers
Table 8.3 – Data Cache specification
8.5. SERIAL PORT
Specification
Rating
Connector
4-way terminal
Conductor
24 – 18 AWG
Isolation voltage
2.5 kV
BAUD
1200, 2400, 4800, 9600, 19200, 38400, 57600, 115200
Parity
None, Even, Odd
Table 8.4 – Serial Port specification
8.6. DF1
Specification
Rating
Duplex
Full/Half
Error detection
CRC, BCC
Document No. D105-010
Revision 1.1
Page 64 of 63
Technical Specifications
Embedded response
Auto, On
Table 8.5 - DF1 specification
8.7. MODBUS
Specification
Supported Ports
Rating
Modbus RTU
Modbus TCP
Read Discrete Inputs
Functions Supported
Read Coils
Read Input Register
Read Holding Register
Table 8.6 - Modbus specification
8.8. CERTIFICATIONS
Certification
Mark
CE Mark
UL Mark
File: E476538
Table 8.7 – Certifications
Document No. D105-010
Revision 1.1
Page 65 of 63
Index
9. INDEX
FT Historian, 6, 26, 27, 35, 37, 38, 39
A
G
Active Tags, 56
Add Devices, 37
assembly instance, 45
ground (GND), 9
I
C
input assembly, 50, 55
input voltage, 12
Cache Percentage, 56
Cache Records, 56
Certifications, 70
checksum, 24, 52
CIP path, 27
Connection Settings, 38, 40
Contact Us, 8
L
D
Data Source, 22, 25, 38, 55, 56
Data Types, 47, 69
DC power, 9
Deleting Tags, 30
Delta Y, 26
DF1, 3, 7, 22, 23, 24, 25, 31, 50, 52, 55, 59, 60, 61, 63, 69,
70
DF1 Source, 31
DF1 specification, 70
DHCP, 10, 14, 15, 16, 17
Diagnostics, 52
Digital Sets, 26, 27, 39
dimensions, 67
DIN rail, 11, 67
DIP, 10
E
Electrical specification, 68
Ethernet Bridge, 45
Ethernet connector, 13
Ethernet specification, 68
Ethernet/IP, 28
EtherNet/IP, 17, 27, 28, 58
Event Log, 61
Event Viewer, 64
Document No. D105-010
Revision 1.1
M
Max Clock Offset, 36
Max ΔT, 26
Memory Schematic, 7
Min ΔT, 26
Minor Fault, 66
Modbus, 3, 5, 22, 25, 31, 32, 51, 52, 55, 69, 70
Modbus Source, 31
ModbusRTU, 22, 23, 24, 25, 51
ModbusTCP, 22, 25, 51
Monitor, 42
N
No Connection, 65
non-volatile memory, 3, 6, 22, 61
O
owned, 7, 45, 49, 55
P
F
Fault, 65
firmware upgrade, 22
LED, 52
LEDs, 52
Log Event Threshold, 36
Logix Source, 27
LogPrefix, 23
Pi Server, 26, 27, 37, 38, 39, 65
Pi Server Digital Sets, 26
Ping Interval, 36
PIServer, 35
Primary Key violations, 66
Process Cache, i, 3, 5, 6, 7, 8, 9, 12, 21, 22, 32, 35, 36, 37,
45, 46, 48, 49, 52, 53, 61, 63, 64, 65
Index
Project Explorer tree, 20, 21, 53, 54, 59, 62
R
receive (RX), 9, 12
Record Management, 57
requested packet interval (RPI), 46
Rockwell Automation, 19
RS232, 7, 9, 10, 12, 24, 52
RSLinx, 19
RSLogix, 27, 45, 46, 47, 48, 49, 51, 63
RSLogix 5000, 28, 45, 46, 47, 49, 51, 63
S
Safe Mode, 10
Save, 42
Service Configuration, 35
Slate, 6, 7, 8, 14, 17, 20, 22, 27, 34, 37, 38, 41, 42, 50, 53,
61, 62, 63
SQL database, 3, 35, 65
SQL Server, 40
Starting and Stopping the Upload Service, 64
statistics, 53, 56
Status, 42, 53
Support email, 8
Document No. D105-010
Revision 1.1
T
Tag Browser, 29
Target Browser, 17, 18, 27, 28, 29, 33
Test Connection, 39, 40
text file, 66
Total Records, 56
transmit (TX), 9, 12
Triggers, 25
Trouble Shooting, 64
U
UDTs, 47
Unload Service, 35, 56
Unlogged Records, 65
Update Clock Interval, 36
Upload Interval, 37
User Defined Types (UDTs), 47
W
web server, 53, 63
webserver, 7