1
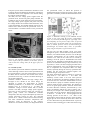
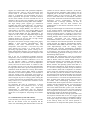
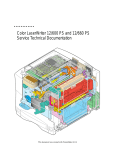
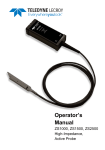
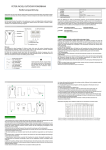
A NEUTRAL GAS MASS SPECTROMETER TO MEASURE THE CHEMICAL COMPOSITION OF THE STRATOSPHERE Dominic Abplanalp(1), Peter Wurz(1), Martin Wieser(2), Stas Barabash(2) (1) Physikalisches Institut, Universität Bern, Sidlerstrasse 5, 3012 Bern, Switzerland, Email: [email protected], [email protected] (2) Swedish Institute of Space Physics, Box 812, 98128, Kiruna, Sweden, Email: [email protected], [email protected] ABSTRACT The Polar Balloon Atmospheric Composition Experiment (P-BACE) is a new generation of neutral gas mass spectrometer based on the time-of-flight principle. P-BACE is the only scientific experiment on the Mars Environment Analogue Platform (MEAP) flown successfully on a balloon mission in summer 2008. The MEAP mission was flown with a 334,000 m3 helium balloon in the stratosphere on a semicircular trajectory from northern Sweden around the North Pole to Canada. The atmospheric conditions at an atmospheric altitude of 35 – 40 km are remarkably similar to those on the surface of Mars and thus the balloon mission was an ideal testbed for our mass spectrometer P-BACE. Originally this instrument was designed for in situ measurements of the chemical composition of the Martian atmosphere. The balloon mission lasted five days and had successfully demonstrated the functionality of the P-BACE instrument during flight conditions. We had recorded more than 4,500 mass spectra. 1. INTRODUCTION The Polar-Balloon Atmospheric Composition Experiment (P-BACE) was originally developed and built for in situ composition measurements of planetary atmospheres, especially on the surface of Mars. The laboratory model of this instrument has been tested during 18 months in which several improvements were made. For P-BACE in particular, we designed a completely new ion detector, made modifications in the ion source, and developed a new mounting system for the two cathodes of the ion source. The P-BACE mass range is 0 to 1,000 amu/q, the mass resolution m/Δm is > 1,000 and the dynamic range is at least six orders of magnitude. Every 66 seconds P-BACE produces a full mass spectrum, which is a sum of 65,535 single spectra. The operation and the performance of an instrument under laboratory conditions are significantly different from any flight conditions. Therefore, the MEAP (Mars Environment Analogue Platform) mission was an ideal testbed for a flight application of our instrument. The main differences to the laboratory model are the compact vacuum system, the gas inlet for stratospheric gas sampling, the computer system with all the electronics allowing for autonomous operations, the telecommand and telecommunication system, and the adaptation to the harsh environmental conditions in the stratosphere. We planned, built, tested, and flew the PBACE experiment after the relatively short preparation time of only seven months. The MEAP balloon mission was realised by the Swedish Space Corporation (SSC) at Esrange and is described in detail in [1]. 2. DESIGN The design of the P-BACE experiment is a result of different constraints: the experiment had to be ready within 7 months, it should not weigh more than 100 kg, should have less than 150 W power consumption, had to handle the stratospheric temperature variations over a period of two weeks, and had to work in the stratospheric pressure and temperature regime. The P-BACE experiment consists of a time-of-flight mass spectrometer with an ion getter pump and a sample gas inlet system with an integrated particle filter. To avoid contamination from the outgasing of gondola components, the ambient atmospheric gas was sampled at a distance of 3.7 meters from the side of the gondola. The spectrometer with all electronics, communication devices, and data processing units (DPU) were integrated in a pressurized vessel (an aluminium cube) maintained at a pressure of about 1 bar during flight. This pressurized vessel allowed us to use commercial of the shelf components for supporting electronics. Therefore, the P-BACE experiment had a special ultra high vacuum (UHV) part for the spectrometer inside of the pressurized vessel. This design offered the best protection for all sensitive parts and made the mechanical handling of the experiment relatively easy. The dimensions of the pressure vessel, a rectangular box, are 73 cm 71 cm 56 cm. The sample gas inlet system and the connections for power and communication are the only interfaces to the outside of the box. The total weight of the P-BACE experiment is 90 kg and the power consumption during the regular measurement mode is about 140 W. The power for the P-BACE experiment during the flight has been entirely produced by four solar arrays on the MEAP platform. ___________________________________________________________________________________ Proc. ‘19th ESA Symposium on European Rocket and Balloon Programmes and Related Research, Bad Reichenhall, Germany, 7–11 June 2009 (ESA SP-671, September 2009) 2.1. Mass analyzer All previous instruments used in planetary missions to analyze the gas composition were magnetic or quadrupole instruments and limited in the mass range below 150 amu/q. The P-BACE instrument is a novel neutral gas mass spectrometer of the time-of-flight type, based on an earlier design for the Rosetta mission [2, 3]. The design of the mass spectrometer is optimised for low weight and small size, but with a sufficient performance for measuring elemental and isotope abundances. Fig. 1 shows an engineering drawing of the mass spectrometer. The total length of the mass spectrometer is 325 mm and the inner diameter is 72.1 mm. Figure 1. Engineering drawing of the mass spectrometer. A) flange with ion source and detector and corresponding electrical feed-throughs, B) ion source with acceleration electrodes, C) sampling gas inlet, D) drift region, E) flange for external turbopump, F) ion reflectron region, G) flange for ion getter pump, H) ion detector. The mass spectrometer consists of an electron impact ion storage source with integrated acceleration electrodes, a field-free drift tube, an ion mirror (reflectron), and a detector. The electrodes are made of stainless steel. The ion source, the acceleration electrodes, and the detector together with all associated electrical feed-throughs are directly mounted on a single CF-63 flange. Also the reflectron and the drift tubes with their electrical feed-throughs are mounted on a CF63 flange. With this design, the mass spectrometer can easily be mounted in a vacuum tube. Having all ionoptical elements accommodated on only two flanges gives us high flexibility in using the same sensor in different vacuum tubes. Moreover, the compact design of the mass spectrometer limits the total volume to 1.3 liter. All front end electronic components such as capacitors and resistors are placed outside of the flange, thus contamination of the vacuum by possibly outgasing components inside the measurement volume is avoided. In addition, avoiding electronic components inside the spectrometer enables to heat the system to about 250°C, which is crucial for good vacuum conditions. The sample gas flows into the sensor volume near the ion source and is ionized by a continuous electron beam, which is emitted by a lanthanum hexaboride (LaB6) cathode from Kimball Physics®. Typical electron emission currents are in the range of 100 – 150 µA and an electron energy of 0 – 100 eV is possible. The ions are stored in the electric field depression of the electron beam for approximately 1 ms, depending on the pulse frequency. With a very fast negative pulse of about – 400 V on the extraction grid of the ion source and a frequency of 1 kHz, the stored ions are accelerated into the mass analyzing part of the spectrometer. A pulse repetition frequency of 1 kHz turned out to be an optimal value for our setup. The extracted ions are accelerated and focused (in time and space) by a multi-element electrostatic lens just in front of the ion source and then enter the field-free drift tube. At the end of this drift tube, a gridless reflectron mirrors the ions back into another drift tube, directed towards the detector. The reflectron consists of 16 stainless steel rings with different shapes and potentials, carefully adjusted to focus the ions spatially and energetically on the detector. The potentials of the acceleration lenses and the reflectron rings are between +50 V and –5 kV, the drift potential is –1,990 V. The detector was especially designed and built for this mass spectrometer and is characterised by a very small volume, bakeable to 250 °C, fast signal response (~0.8 ns peak width) facilitated by a 50 Ω impedance matched gold plated anode. We used two matched microchannel plates (MCP) from Burle® with an active detection diameter of 8 mm and a bias angle of 8° in a chevron configuration. The standard potential of the front MCP is –1.9 kV, the back MCP is on –270 V, and the anode is on ground potential. The positions, shapes, and voltages of all ion-optical elements were optimised using the computer program SIMION v7/v8 [4], in combination with several selfmade C-programs. The two main parameters in the optimization process were a high ion transmission through the whole ion-optical system and, at the same time, a high mass resolution. The efficiency of the ion source is highly sensitive to changes of electrode potentials and thus they need precise and stable low voltage power supplies. For this reason, power supplies based on operational amplifiers have been built in-home. 2.2. Mechanical setup The whole mass spectrometer is attached with 12 springs to an aluminium frame, which guarantees good mechanical isolation against vibration and shocks from the outside. Mechanical resonance frequencies were damped with silicon tubes on the surface of some selected springs. The rationale behind this mounting system was to protect the shock sensitive parts of the ion source, particularly the cathodes, during the transport by truck from Switzerland to Sweden as well as during descent and landing of the balloon. The largest mechanical forces were expected at the descent during the opening of the parachute. The DPU, the low voltage power supplies with the protection units, and the ion getter pump controller are installed on the top of the frame for good accessibility. The high voltage power supplies, the pulser unit, and the voltage dividers are mounted inside the frame, close to the spectrometer. One Iridium modem is fixed on the bottom of the frame inside the pressurized vessel. A second modem is mounted outside of the pressurized vessel. the pressurized vessel, in which the pressure is maintained through a nitrogen gas supply system, which guarantees a constant pressure of about 950 mbar inside. Figure 3. Schematic drawing of the P-BACE vacuum system. A) ion getter pump, B) pressure compensation valve, C) electrical feed-through, D) right angle valve for turbopump, E) overpressure safety valve, F) special gas inlet orifice, G) flexible tubing, H) electromagnetic valve, I) outside pressure sensor, J) measurement gas feed-through, K) manual safety valve, L) peristaltic pump, M) gas inlet filter, O) pressurized vessel. Figure 2. The P-BACE experiment in the pressurized vessel. A part of the spectrometer (in the lower part) as well as some low voltage units (in the upper part) are visible. 2.3. Vacuum system The vacuum system of the P-BACE experiment consists of the ultra-high vacuum vessel of the spectrometer and the pressurized box. The mass spectrometer as well as the DPU and all electronics are located inside of the pressurized vessel. Fig. 3 shows a schematic drawing of all vacuum components. Insulation distances between the high voltage feedthroughs on the outside of the sensor flange are designed to operate the spectrometer in normal laboratory conditions, i.e., at about 1 bar. According to Paschen’s law, at a pressure of 4 – 10 mbar, the breakdown voltage is much smaller than at normal pressure. The DPU, the high voltage power supplies, some parts of the extraction pulser unit, and the ion getter pump control are commercial available components, thus they require atmospheric pressure and normal convection cooling by fans. The expected pressure at 33 – 40 km is too low for convection cooling and some commercial electronic components like capacitors could be destroyed in low pressure conditions. For all these reasons, we designed and built The box has two MIL-C-26482 (32/41 pins) feedthroughs for power, external monitor, keyboard, mouse, ethernet, one Iridium modem, and two coax 50 Ω high frequency feed-throughs for the Iridium and GPS antennas. Five sides of the cubic box are sealed by weldings, the front panel is demountable and sealed with an O-ring. Although we tested the box with an over pressure of 1,500 mbar during 15 days without any loss of pressure, a 2 liter (150 bar) nitrogen gas bottle with a pressure compensation valve was integrated inside the box to compensate for unexpected leaks. For safety reasons, especially during the recovery operations after landing, the box itself was protected against over pressure using an overpressure valve. The mass spectrometer itself is working in a pressure range from 5 × 10⁻⁶ mbar to 1 × 10⁻¹⁰ mbar. The laboratory version works in an even lower pressure regime, if connected to an efficient pumping system. It is obvious that for continuous measurements of more than 100 hours a pump is needed to maintain the good vacuum inside the mass spectrometer. We decided to use an ion getter pump (Varian®, StarCell VacIon Plus 20 with a MiniVac controller), characterised by a low power consumption without any active cooling, and a relatively low weight. The nominal pumping speed of this pump is 20 l/s for nitrogen. Starting with a pressure of about 4 – 10 mbar at 33 – 40 km height and the working pressure of less than 5 × 10⁻⁶ mbar in the spectrometer requires that the pressure of the incoming sample gas has to be reduced by more than a factor of 106 for a failure-free long time measurement. A pressure reduction of the incoming gas is often done with a long, thin capillary. However, in a stratospheric application aerosols and water ice particles could block the thin tube, making this set-up rather error-prone. We therefore decided to use instead a bakeable pinhole and modified a CF-16 flange copper sealing for our application. The orifice itself consists of a 1 mm thick disk made of gold-platinum alloy with a laser-drilled pinhole. The smallest reproducible pinhole had a diameter of about 20 µm. The disc has been brazed vacuum-tight onto the copper gasket. Vacuum flow calculations of the system [5] yields a flow rate of 4.5 × 10⁻⁶ mbar l s-1 at an outside pressure of 5 mbar. However, first tests showed a higher flow rate. With an outside pressure of 5 mbar we obtained an instrument pressure of 2 × 10⁻⁶ mbar, i.e., close to the upper limit for the instrument. Reduction of the pinhole diameter with a special tool under a microscope finally resulted in an equilibrium pressure of about 7 × 10⁻⁷ mbar at 5 mbar outside pressure. Outside of the flange with the pinhole, we had mounted an 11 W heater-foil (Minco®), which allowed (if needed) to heat the flange up to 110 °C within a few minutes. The heater was planned to melt any ice and/or aerosols on the orifice in case of a blocked gas inlet. The gas inlet system consists of a five meter long Teflon tube to sample the stratosphere far away from the gondola. A special designed Teflon particle filter is mounted at the intake side. The filter has two mesh grids, one with 10 µm and one with 5 µm pore size, respectively. A small peristaltic pump (Alitea®, 400F/M1) with a pumping speed of 150 ml/min is placed just before the gas inlet to guarantee continuous gas throughput through the inlet system. It’s flow rate is sufficient to exchange the complete gas volume of the inlet system in one minute, which corresponds to the time interval for data acquisition. Outside of the experiment box, a right angle inlet valve (the manual safety valve) was added and was opened just a few minutes before launch. Inside of the box, a pressure sensor (Baumer®, SN 1-15010814-16) and an electromagnetic valve (Vacom®, IPVA 10EK-24VDC) were installed. As soon as the experiment reached the desired altitude, the electromagnetic valve was opened and the atmospheric gases started flowing into the UHV part. For safety reasons, we used a power-off open valve, which forms a lower risk for operation than a power-off closed valve and, in addition, does not need any power during regular operations, i.e., while it is open. However, with a power-off open valve, an extreme cold restart of the system results in an open inlet valve and therefore in gas flowing into the UHV part, which, in combination with the powered off ion getter pump, would result in a very quick venting of the UHV part. In such case, the ion getter pump would not be able to restart and no scientific data could be acquired anymore. Such a problem would be critical especially during the balloon ascend, because in this period the outside pressure is still too high to start the ion getter pump. Also a longer power failure within the measurement phase could be critical, but laboratory tests demonstrated that we can handle a power failure of at least 50 minutes. For these tests, we added an additional pressure sensor in the UHV part and turned off the power of the ion getter pump at an inside pressure of 5 × 10⁻⁷ mbar and an outside pressure of 9.1 mbar. After about 4 minutes, the inside pressure increased to 3 × 10⁻⁵ mbar and continued to increase exponentially. The maximum startup pressure for the ion getter pump is 5 × 10⁻² mbar, which corresponds to a venting time of about 50 minutes without pumping. For the prelaunch preparations, a CF-40 flange with a right angle valve was welded on the vacuum tube of the mass spectrometer, thus the instrument could be pumped during ground operations with a turbo pump. In addition, we baked the instrument while pumping with the turbo pump up to 200 °C, which significantly reduced the background in the spectrometer. 2.4. Electronics The aim of the P-BACE/MEAP experiment was to test the system in conditions similar to Mars or Moon. Therefore, we designed and built an experimental setup that is completely computerized to allow for autonomous operation. The Data Processing Unit (DPU) is a 600 MHz Celeron-M® processor embedded in an industrial PC (MPL, PIP7) with a power consumption of 16 W, an operational temperature range from –20 °C to +60 °C, and an input voltage of 28 VDC. The storage medium consists of two 16 GB flash disks, which redundantly stores all housekeeping and scientific data. The DPU is extended with a 32 channel (16-bit) low speed ADC-card (Diamond systems®, MM-32x-AT), a 16 channel (12-bit) DAC-card (Diamond systems®, RMM-1612), and a Relay-card with 20 relay channel outputs (Diamond systems®, IR-104-PBF). For the scientific data acquisition, we use a full-length PCI standard high speed ADC-card (Agilent®, U1082A, AP240 with averager firmware). In single channel mode, this card has a sampling rate of 2 GS/s with an analogue bandwidth of 1 GHz and a vertical resolution of 8 bits. To record spectra, the card digitizes the detector signal for 30 µs, which corresponds to a mass range of 0 – 1,000 amu/q. The averager firmware has up to 65,536 triggers per segment, which gives a total vertical resolution of 24 bits. The disadvantage of this card is the high power consumption (about 70 W) and the narrow operational temperature range from 0 °C to +40 °C. The protection unit is a custom-made part of the electronic system and consists of a watch dog timer and a pressure sensor for the high voltage protection in case of a loss of pressure in the vessel. Several DC/DC converters in this unit provide the different voltages needed for the experiment. All ten low voltage power supplies are custom-made with operational amplifiers, which work in the –100 V to +100 V output range. Also custom made is the cathode emission control unit, which is a completely new development for the PBACE experiment and provides a constant emission current of the cathode. We have mounted two sets of cathodes in the ion source for redundancy and a digital switch-over unit allows choosing either of the cathodes. The high voltage power supplies are commercial available units from Applied Kilovolts®. We used five different models of high voltage power supplies. One unit with a 1 kV output (HP001), one with a 2.5 kV output (HP2.5), one with a 10 kV output (HP010), and two units each with 5 kV outputs (HP005, MS005). Since the model MS005 has five independent 5 kV outputs we had in total nine independent high voltage DC-DC converters. Together with two additional potential dividers we end up with 16 high voltage potentials for the mass spectrometer. The pulser unit consists of a high voltage power supply (HP001), a pulse generator (Directedenergy®, DEI HV1000), and some custom-made front end components. A fast (rise time < 5 ns) and a very clean pulse without any ringing is a crucial factor for generating high-quality mass spectra. During the PBACE measurement campaign, we worked with a pulse repetition frequency of 1 kHz and a pulse height of –440 V. Due to the use of commercial available electronic components, we have to keep the temperature in the box to within the rather strict limits of between 0 °C to +40 °C. We therefore added a miniature temperature controller (Minco®, CT325 with a Pt-100 temperature sensor) and a 20 W resistor heater. A normal 12 VDC fan (normally used for a PC) has been mounted under the high speed ADC card to provide a homogenous heat distribution inside the whole box. Luckily, these heaters were not necessary during flight. Based on thermal calculations of the balloon gondola, it was decided to paint the outside of the pressurized vessel white to maintain a reasonable low temperature during flight. We did not integrate any active cooling systems. During the 116 hours long mission, the temperature in the box was always about +35 °C and thus never reached a critical level of above +40 °C. For measuring the local air temperature, a Pt-100 temperature sensor was installed on the 3.7 m long aluminium gas inlet boom. The temperature measurements in combination with the measured outside pressure, and the exact position of the balloon turned out to be helpful for interpreting the scientific data. 2.5. Communication system and software In the laboratory we directly used the USB ports of the DPU for the monitor screen, the keyboard, and the mouse. For downloading data from the DPU to other PC systems we used an ethernet connection. At this time, the ground support equipment (GSE) software was an integrated part of the DPU software package. In the calibration phase at the University of Bern, remote access to the P-BACE DPU via the ethernet connection was possible, which had accelerated the whole software developing process tremendously. During the instrument tests at Esrange (Sweden), we used an external computer with the GSE software and communicated via the ethernet connection with the PBACE DPU. During the balloon flight we worked with two modems of the Iridium satellite communication system. The Iridium satellites are in a low Earth orbit (~800 km) with an inclination of 86.4°, resulting in good service coverage at high latitudes. For redundancy reasons, two identical modems with a built-in GPS receiver (NAL research®, A3LA-DG) and two identical dual Iridium/GPS antennas (NAL research®, SAF4070-IG) were installed on the P-BACE experiment. The Iridium system provides two different communication modes, the Short-Burst Data (SBD) mode with a data rate of 1,960 Bytes/message (used for sending single commands and receiving housekeeping parameters every 10 minutes) and the Dial-up mode with a data rate of 2.4 kbits/sec. The Dial-up mode was used for real time housekeeping parameter checking as well as for downloading sample spectra. Controlling and communication with the experiment was located at the Swedish Institute of Space Physics (IRF) at Kiruna, where an Iridium modem and a PC with the GSE software were available. The software for the P-BACE experiment was developed by IRF at Kiruna, Sweden. The operating system of the DPU is a Debian LINUX distribution. All programs are written in C++ and were running on the DPU, except the P-BACE control software (GSE) with a Graphical User Interface (GUI), which was installed on the control station PC at IRF. The DPU provides the hardware control software for all PC104-cards, the high speed ADC-card, and both Iridium modems as well as the scientific data software and several macros. Two modes are implemented on the DPU, an IDLE mode, which acquires, stores, and sends (via SBD) some housekeeping parameters and a FLIGHT mode which acquires and stores scientific data together with all housekeeping data. To avoid long and unwanted venting phases, the system automatically starts in the IDLE mode after a power cycle. The IDLE mode is characterized by an active ion getter pump and active temperature and pressure sensors, but turned off high and low voltages for the mass spectrometer. The FLIGHT mode activates the high speed ADC-card and acquires scientific data as soon as a trigger signal occurs. A set of macros allows a comfortable ramp-up of the high voltages and changing of different settings. In the Dial-up mode, the last stored spectrum is downloaded in 59 compressed data packets, each packet consists of 500 ns long parts of the spectrum and also contains a synchronization bit to identify damaged data packets. The time for downloading one spectrum highly depends on the data structure and the contact quality to an Iridium satellite, but in general it takes about 3 minutes. In total, we downloaded 90 selected spectra during the balloon flight. 3. MEASUREMENTS We acquired 4,538 spectra in total during the flight. The first 103 spectra were residual gas measurements with a closed inlet valve during the ascent phase of the flight. Fig. 4 shows such a typical residual gas spectrum with a dynamic range of 6 decades recorded in a time frame of 66 s. Figure 5. Stratospheric gas measurement at 35 km altitude. The data is a sum of 10 full spectra. The lowest partial pressures recorded in these spectra are at 10–14 mbar. 4. Figure 4. A typical residual gas spectrum was recorded in 66 seconds, which is the nominal acquisition time for one spectrum. The residual gas pressure was 2 × 10⁻⁷ mbar, the electron emission from the cathode was 100 µA and the electron energy was 60 eV. The lanthanum (139 amu/q) in the mass spectrum originates from the LaB6 cathode. Fig. 5 shows a histogram of 10 spectra taken in the stratosphere. The lowest partial pressures recorded in these spectra are at 10–14 mbar, which corresponds to a number density of about 250 cm–3. For longer integration periods this detection threshold will be correspondingly lower. The sealing altitude of the balloon during these measurements was 35 km. In contrast to the residual gas spectrum (Fig. 4) are the stratospheric ratios 40Ar / H2O and 40Ar / CO2 significantly higher. The data analysis of the atmospheric gas measurements is part of our current activities. Due to the very short developing time of this experiment (total seven months), we were not able to perform all the calibration measurements before the launch. Consequently, most of the calibrations and data analysis are part of the ongoing work. CONCLUSIONS All primary mission goals of P-BACE were accomplished. We operated a prototype instrument for Mars atmospheric research on the balloon platform over 5 days on a flight between Kiruna and Canada. P-BACE operated mostly autonomous and all the Telecommand and Telemetry was done via Iridium satellite links. A total of 4,435 mass spectra of the stratosphere have been recorded. From this 90 spectra have been downloaded directly via Iridium network. All recorded data were recovered after the safe MEAP landing and are currently available for data handling. Due to the failure-free working of the software and its scalability, it is intended to also use the software for future laboratory versions of the P-BACE spectrometer. 5. REFERENCES [1] Wieser M., Kalla L., Barabash S., Hedqvist T., Kemi S., Widell O., Abplanalp D., and Wurz P., The Mars Environment Analogue Platform long duration balloon flight. Adv. Space Res. (2009) in press. [2] Scherer S., Altwegg K., Balsiger H., Fischer J., Jäckel A., Korth A., Mildner M., Piazza D., Rème H., and Wurz P., A novel principle for an ion mirror design in time-of-flight mass spectrometry, Int. Jou. Mass Spectr. 251 (2006) 73–81. [3] Balsiger H., Altwegg K., Bochsler P., Eberhardt P., Fischer J., Graf S., Jäckel A., Kopp E., et al., Rosetta Orbiter Spectrometer for Ion and Neutral AnalysisROSINA. Space Sci. Rev., 128 (2007), 745–801. [4] Dahl D. A. SIMION3D Version 7.0, User’s Manual, Idaho National Engineering and Environmental Laboratory, 2000. [5] Wutz, Adam, Walcher. Handbuch der Vakuumtechnik, Vieweg, 1997.