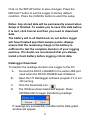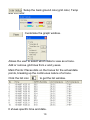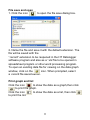
1
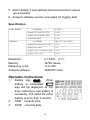
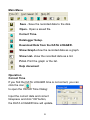
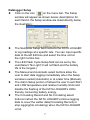
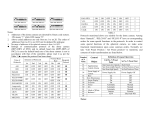
Temperature and Humidity Datalogger Instruction Manual Introduction The Temperature & Humidity Datalogger is designed with a high accuracy Temperature & Humidity Sensor. This datalogger is provided with features of high accuracy, fast response and stability. It is widely used for monitoring and collecting data of environment temperature and humidity. Functions and Technical Specifications Functions: You can monitor temperature and humidity values efficiently and conveniently for long time periods by using the Datalogger. The readings are saved in the logger and simply read out by your PC with USB. The LCD can show current readings, MAX, MIN,TIME, DATE and temperature or humidity values. Note: This Datalogger should be placed uprightly. If placed in low temperature and high humidity environment, after measurement, the Datalogger should be placed uprightly until vaporizing the beads completely before reading the data in the device. If the Datalogger is connected to the PC, some battery power can be saved. Features: 1. Memory for 32700 values; 2. LCD to show some logging information easily; 3. Freely selectable measurement cycle from 1 sec. to 24h; 4. Download collected data through PC’s USB; 2 5. Alarm display if user-defined maximum/minimum values are exceeded; 6. Analysis software used to view graph for logging data; Specification: Resolution Memory Measuring cycle Analysis software 0.1%RH, 0.1℃ 32700 values 1s to 24h 2000/XP/ Vista Operation Instructions: 1. 2. 3. Battery sign . When battery is exhausted, sign will be displayed. At this time, replacing a new battery is necessary. The useful life of the battery is more than 3 months TIME currently time DATE currently data 3 4. Time and date are automatically switch mode, And it will switch for every 10s 5. MAX display maximum value during measuring 6. MIN display minimum value during measuring 7. REC this sign showing that the data logger is under recording 8. FULL this sign showing that the memorizer is full, the data logger will stop recording 9. %RH this sign showing that the data logger is measuring humidity 10. °C Centigrade 11. °F Fahrenheit 12. When press the MAX/MIN button,it will hold MAX,MIN, time and date.The time and date is also switched for every 10s.If you don not press any key in 40s,the meter will automatically exit from the MAX MIN mode,and return to the the data hold and measure mode. 13. When loading the data, there will be “-PC-” sign displayed on the LCD. After all the data are loaded, the data logger will display the real value from current measurement. But it will stop recording. The logger need to be re-set if you need the recording function. You can only look over the data from the logger itself. All settings will be only carried through the software installed in PC. 14.Alarm function When the measured value exceeds the set upper limit or lower limit, the alarm LED will wink one time per minute. Winking Red LED shows temperature value exceeds limit, while winking Yellow LED shows humidity value exceeds limit. 4 15. There will be “-LO-” sign displayed if the temperature/ humidity sensor is not well connected. At this time, please open the back cover and re-install the sensor. Until the correct measurement value is displayed. Software installation 1. Put the CD into the CD-ROM, there will be installation interface pop-up after a moment. You can install the software to your PC accordingly. 2. After the software is installed, keep the CD in the CD-ROM and connect the datalogger with the PC by the USB cable. Then, there will be a USB Driver installation window pop-up. Follow with the clew, select the path of CD driver and you will finish the USB driver installation very soon. Software application The Datalogger USB software is a program for collecting data from the DATA LOGGER when it is connected to a PC or notebook computer. The data may be displayed graphically, as Excel or similar programs. The major functions are all listed in the main window. System Required: Windows 2000 or Windows XP or Vista Minimum Hardware Required: PC or NoteBook with Pentium 90MHz or higher 32 MB RAM ; At least 7 MB byte hard disk space available to install HT Datalogger USB software. Recommended display resolution 1024X768 with High Color(16 bit). 5 Main Menu Save - Save the recorded data to the disk. Open - Open a saved file. Correct Time. Datalogger Setup. Download Data from the DATA LOGGER. Show Graph-show the recorded data as a graph. Show List- show the recorded data as a list. Print- Print the graph or the list. Help document Operation Correct Time If you find the DATA LOGGER time is not correct, you can click the icon to open the Correct Time Dialog: Input the correct date and correct timepiece and click “OK”button, the DATA LOGGER time will update. 6 Datalogger Setup Click on the icon on the menu bar. The Setup window will appear as shown below; descriptions for each field in the Setup window are listed directly below the illustration: The Samprate Setup field instructs the DATA LOGGER to log readings at a specific rate. You can input specific data at the left Edit box,and select the time unit at the right Combo box. The LED Flash Cycle Setup field can be set by the user(Select “No Light”,It will not flash,and the battery life is the longest.) The Manual and Automatic select buttons allow the user to start data logging immediately when the Setup window is exited (Automatic) or at a later time (Manual). The Alarm Setup portion of allows the user to set HIGH and LOW temperature and relative humidity limits and disable the flashing of the DATA LOGGER’s LEDs thereby conserving battery energy. The Circulating Record and No Circulating select buttons instruct the DATA LOGGER continue logging data to cover the earlier data(Circulating Record) or stop logging(No circulating) when the DATA LOGGER is full. 7 Click on the SETUP button to save changes. Press the DEFAULT button to set the Logger to factory default condition. Press the CANCEL button to abort the setup. Notes: Any stored data will be permanently erased when Setup is finished. To enable you to save this data before it is lost, click Cancel and then you need to download data. The battery will in all likelihood run out before logger will have finished specified sample points. Always ensure that the remaining charge in the battery is sufficient to last the complete duration of your logging exercise. If in doubt, we recommend that you always install a fresh battery before logging critical data. Datalogger Download To transfer the readings stored in the Logger to the PC: A. Connect the DATA LOGGER to the same USB port used when the DATALOGGER was initialized. B. Open the HT Datalogger software program if it is not still running C. Click the Download icon . D. The Window shown below will appear. Press DOWNLOAD to begin transferring readings If readings are successfully transferred,the Data graph window will appear. 8 The top field show detail infomation of the readings(Time, Sampling rate, data numbers,Alarm Hi,Alarm Low,Max data,Min data and Avg data), Zoom in: 1. Press the left mouse button and drag a rectangle around the area to be expanded. 2. Release the mouse button. 3. Use the horizontal scrollbar to scroll through all the data. Use the left vertical scrollbar to scroll through the temperature data. Use the right vertical scrollbar to scroll through the relative humidity data. Zoom out Zoom out to full view by clicking Setup the Temp and RH Y Axis. 9 Setup the back ground color,grid color, Temp and RH color. Customize the graph window . Allows the user to select which data to view as a trace. Add or remove grid lines from x and y axes. Mark Points: Places dots on the traces for the actual data points, breaking up the continuous nature of a trace. Click the list icon to get the list window. It shows specific time and data. 10 File save and open 1. Click the icon to open the file save dialog box. 2. Name the file and save it with the default extension. The file will be saved with the “.record” extension to be reopened in the HT Datalogger software program and also as a “.xls”file to be opened in spreadsheet program or other word processing program. To open an existing data file for viewing on the data graph window, click on the icon. When prompted, select a .record file saved earlier. Print graph and list Click the icon to show the data as a graph,then click to print the graph. Click the icon to show the data as a list, then click to print the list. 11 v080911 12