1
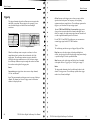
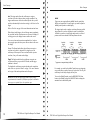
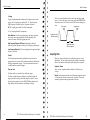
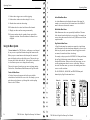
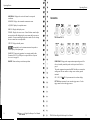
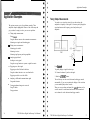
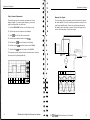
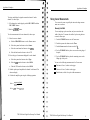
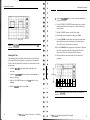
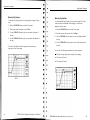
Getting Started
Probe Attenuation Setting
Probes are available with various attenuation factors which affect the
vertical scale of the signal.
Basic Concepts
To change (or check) the probe attenuation setting, press the
VERTICAL MENU button (of the channel you are using), and then
press the menu selection next to Probe until the correct setting is
displayed.
To use your oscilloscope effectively, you must understand the
following basic concepts:
This setting remains in effect until changed again.
w Acquiring data
Triggering
n
NOTE. The default Probe attenuation setting is 1X when the
oscilloscope is shipped.
Scaling and positioning waveforms
m Measuring waveforms
n
Setting Up the oscilloscope
The figure below shows a block diagram of the various functions of
an oscilloscope and their relationship to each other.
I---- --l---- ---r------1
Each
c h a n n e l1
Vertical:
gain and
position
Waveform
mode and - record:
time base
1 2500 points
I Acquire data:
?*
I
I
I
i___--_L__
I
__L_____
--
Display
Computer
- interface
(TDS2CM)
7
I --------------------
8
TDS 200-Series Digital Oscilloscope User Manual
TDS 200-Series Digital Oscilloscope User Manual
9
Basic Concepts
Basic Concepts
Triggering
AC Line. You can use this trigger source when you want to look at
The trigger determines when the oscilloscope starts to acquire data
and display a waveform. When a trigger is set up properly, it can
convert unstable displays or blank screens into meaningful
waveforms.
signals related to the power line frequency, such as lighting
equipment and power supply devices. The oscilloscope generates the
trigger, so you do not have to input a trigger signal.
External (TDS 210 and TDS 220 Only). You can use this trigger source
when you want to acquire data on two channels and trigger from a
third. For example, you might want to trigger from an external clock
or with a signal from another part of the test circuit.
For the TDS 2 10 and TDS 220 oscilloscopes, you can connect an
external trigger signal to the EXT TRIG connector.
Iiiiifiiii
Triggered waveform
Untriggered waveforms
When the oscilloscope starts to acquire a waveform, it collects
enough data so that it can draw the waveform to the left of the
trigger point. The oscilloscope continues to acquire data while
waiting for the trigger condition to occur. After it detects a trigger,
the oscilloscope continues to acquire enough data so that it can draw
the waveform to the right of the trigger point.
Types
The oscilloscope provides two types of triggers: Edge and Video.
Edge. You can use the edge trigger with analog and digital test
circuits. An edge trigger occurs when the trigger input passes through
a specified voltage level in the specified direction.
Video. You can use the video trigger on fields or lines of standard
video signals. Refer to Triggering on a Video Signal on page 52.
Modes
Source
You can derive your trigger from various sources: Input channels,
AC Line. and External.
The trigger mode determines how the oscilloscope behaves in the
absence of a trigger event. The oscilloscope provides three trigger
modes: Auto, Normal, and Single.
Input. The most commonly used trigger source is any one of the input
channels. The channel you select as a trigger source will function
whether it is displayed or not.
10
TDS 200-Series Digital Oscilloscope User Manual
TDS 200-Series Digital Oscilloscope User Manual
11
Basic Concepts
Basic Concepts
Auto. This trigger mode allows the oscilloscope to acquire a
waveform even when it does not detect a trigger condition. If no
trigger condition occurs while the oscilloscope waits for a specific
period (as determined by the time-base setting), it will force itself to
trigger.
Refer to Time Base on page 16 for more information on time bases.
When forcing invalid triggers, the oscilloscope cannot synchronize
the waveform, and the waveform seems to roll across the display. If
valid triggers occur, the display becomes stable on the screen.
Holdoff
Triggers are not recognized during holdoff time (the period that
follows each acquisition). For some signals, you need to adjust the
holdoff period to produce a stable display.
The trigger signal can be a complex waveform with many possible
trigger points on it, such as a digital pulse train. Even though the
waveform is repetitive, a simple trigger might result in a series of
patterns on the screen instead of the same pattern each time.
You can use Auto mode to monitor an amplitude level, such as a
power supply output, which may cause the waveform to roll across
the display.
Normal. The Normal mode allows the oscilloscope to acquire a
waveform only when it is triggered. If no trigger occurs, the
oscilloscope will not acquire a new waveform, and the previous
waveform, if any, will remain on the display.
Single. The Single mode allows the oscilloscope to acquire one
waveform each time you press the RUN button, and the trigger
condition is detected.
The data that the oscilloscope acquires depends on the acquisition
mode. Refer to Acquisition Modes on page 15 for more information
on the type of data each acquisition mode will acquire.
NOTE. When you use the Single trigger mode with the Average
acquisition mode, the number of waveforms specified in the number
of averages ure acquired before the acquisition stops.
Acquisition
interval
Acquisition
interval
Acquisition
interval
f-+
6
+--7
0 Indicates
trigger points
v-v
Holdoff
Holdoff
Holdoff
Triggers are not recognized during holdoff time.
For example, you could use the holdoff period to prevent triggering
on any other pulse except the first one in a pulse train. This way, the
oscilloscope would always display the first pulse.
To access the Holdoff control, press the HORIZONTAL Menu
button, select Holdoff, and use the HOLDOFF knob to change the
amount of time in the holdoff period.
TDS 200-Series Digital Oscilloscope User Manual
TDS 200-Series Digital Oscilloscope User Manual
Basic Concepts
Basic Concepts
Coupling
Trigger coupling determines what part of the signal passes on to the
trigger circuit. Coupling types include DC, AC, Noise Rejection,
High Frequency Rejection, and Low Frequency Rejection.
The Level control determines where on the edge the trigger point
occurs. To access the trigger level control, press the HORIZONTAL
Menu button, select Level, and use the LEVEL knob to change the
value.
Positive-going
DC. DC coupling passes both AC and DC components.
Negative-going
AC. AC coupling blocks DC components.
Noise Rejection. Noise Reject coupling lowers the trigger sensitivity
and requires more signal amplitude for stable triggering. This
reduces the chance of falsely triggering on noise.
Trigger level can be
adjusted vertically
Y
High Frequency Rejection. HF Reject coupling blocks the high
frequency portion and passes on only the low frequency components.
Low Frequency Rejection. LF Reject coupling does the opposite of high
frequency rejection.
Position
The horizontal position control establishes the time between the
trigger and the screen center. Refer to Horizontal Scale and Position;
Pretrigger Information on page 17 for more information on how to
use this control to position the trigger.
Slope and Level
The Slope and Level controls help to define the trigger.
The Slope control determines whether the oscilloscope finds the
trigger point on the rising or the falling edge of a signal. To access
the trigger slope control, press the TRIGGER Menu button, select
Edge, and use the Slope button to select Rising or Falling.
14
J
Trigger slope can be
positive or negative
Acquiring Data
When you acquire analog data, the oscilloscope converts it into a
digital form. You can acquire data using three different acquisition
modes. The timebase setting affects how rapidly data is acquired.
Acquisition Modes
There are three acquisition modes: Sample, Peak Detect, and
Average.
Sample. In this acquisition mode, the oscilloscope samples the signal
in evenly spaced intervals to construct the waveform. This mode
accurately represents analog signals most of the time.
TDS 200-Series Digital Oscilloscope User Manual
TDS 200-Series Digital Oscilloscope User Manual
15
Basic Concepts
Basic Concepts
However, this mode does not acquire rapid variations in the analog
signal that may occur between samples. This can result in aliasing
(described on page 18) and may cause narrow pulses to be missed. In
these cases, you should use the Peak Detect mode to acquire data.
Peak Detect. In this acquisition mode, the oscilloscope finds the
highest and lowest values of the input signal over a sample interval
and uses these values to display the waveform. In this way, the
oscilloscope can acquire and display narrow pulses, which may have
otherwise been missed in Sample mode. Noise will appear to be
higher in this mode.
Average. In this acquisition mode, the oscilloscope acquires several
waveforms, averages them, and displays the resulting waveform. You
can use this mode to reduce random noise.
Time Base
The oscilloscope digitizes waveforms by acquiring the value of an
input signal at discrete points. The time base allows you to control
how often the values are digitized.
To adjust the time base to a horizontal scale that suits your purpose,
use the SEC/DIV knob.
Scaling and Positioning Waveforms
You can change the display of waveforms by adjusting their scale
and position. When you change the scale, the waveform display will
increase or decrease in size. When you change the position, the
waveform will move up, down, right, or left.
16
TDS 200-Series Digital Oscilloscope User Manual
The channel reference indicator (located on the left of the graticule)
identifies each waveform on the display. The indicator points to the
ground level of the waveform record.
Vertical Scale and Position
You can change the vertical position of waveforms by moving them
up or down on the display. To compare data, you can align a
waveform above another or you can align waveforms on top of each
other.
You can change the vertical scale of a waveform. The waveform
display will contract or expand about the ground level.
Horizontal Scale and Position; Pretrigger Information
You can adjust the Horizontal Position control to view waveform
data before the trigger, after the trigger, or some of each. When you
change the horizontal position of a waveform, you are actually
changing the time between the trigger and the center of the display.
(This appears to move the waveform to the right or left on the
display.)
For example, if you want to find the cause of a glitch in your test
circuit, you might trigger on the glitch and make the pretrigger
period large enough to capture data before the glitch. You can then
analyze the pretrigger data and perhaps find the cause of the glitch.
You change the horizontal scale of all the waveforms by using the
SEC/DIV knob. For example, you might want to see just one cycle of
a waveform to measure the overshoot on its rising edge.
TDS 200-Series Digital Oscilloscope User Manual
Basic Concepts
Basic Concepts
The oscilloscope shows the time per division in the scale readout.
Since all active waveforms use the same time base, the oscilloscope
only displays one value for all the active channels, except when you
use a Window Zone.
The next table lists the time bases that you should use to avoid
aliasing at various frequencies and the respective sample rate.
Aliasing. Aliasing occurs when the oscilloscope does not sample the
signal fast enough to construct an accurate waveform record. When
aliasing happens, you see a waveform with a frequency lower than
the actual waveform being input or a waveform that is not stable
even though the oscilloscope triggered.
Actual high-frequency
waveform
Apparent low-frequency
waveform due to abasing
Sampled points
One way to check for aliasing is to slowly change the horizontal
scale with the SEC/DIV knob. If the shape of the waveform changes
drastically, you may have aliasing.
To represent a signal accurately and avoid aliasing, you must sample
the signal more than twice as fast as the highest frequency component. For example, a signal with frequency components of 5 MHz
would need to be sampled at 10 Megasamples per second or faster.
1 .O ms
250.0 kS/s
125.0 kHz
2.5 ms
100.0 kS/s
50.0 kHz
5.0 s
50.0 s/s
25.0 Hz
There are various ways to prevent aliasing: adjust the horizontal
scale, push the AUTOSET button, or change the acquisition mode.
NOTE. If aliasing occurs, change to the Peak Detect acquisition
mode (described on page 16). This mode samples the highest and
lowest values so that the oscilloscope can detect faster signals.
18
TDS 200-Series Digital Oscilloscope User Manual
TDS 200-Series Digital Oscilloscope User Manual
Basic Concepts
Basic Concepts
Taking Measurements
Cursors
The oscilloscope displays graphs of voltage versus time and can help
you to measure the displayed waveform.
There are several ways to take measurements. You can use the
graticule, the cursors, or an automated measurement.
This method allows you to take measurements by moving the
cursors, which always appear in pairs, and reading their numeric
values from the display readouts. There are two types of cursors:
Voltage and Time.
Graticute
Voltage Cursors. Voltage cursors appear as horizontal lines on the
display and measure the vertical parameters.
This method allows you to make a quick, visual estimate. For
example, you might look at a waveform amplitude and determine
that it is a little more than 100 mV.
Time Cursors. Time cursors appear as vertical lines on the display and
measure the horizontal parameters.
You can take simple measurements by counting the major and minor
graticule divisions involved and multiplying by the scale factor.
For example, if you counted five major vertical graticule divisions
between the minimum and maximum values of a waveform and
knew you had a scale factor of 100 mV/division, then you could
easily calculate your peak-to-peak voltage as follows:
5 divisions x 100 mV/division = 500 mV.
Automated
When you take automated measurements, the oscilloscope does all
the calculating for you. Because these measurements use the
waveform record points, they are more accurate than graticule or
cursor measurements.
Automated measurements use readouts to show measurement results.
These readouts are updated periodically as the oscilloscope acquires
new data.
Setting Up the Oscilloscope
Cursor
You should become familiar with three functions that you will use
often when operating your oscilloscope: Autoset, saving a setup, and
recalling a setup. Included is a description of the default settings for
normal operation of the oscilloscope.
Cursor
TDS 200-Series Digital Oscilloscope User Manual
TDS 200-Series Digital Oscilloscope User Manual
21
Basic Concepts
Using Autoset
The Autoset function obtains a stable waveform display for you. It
automatically adjusts the vertical and horizontal scaling, as well as
the trigger coupling, type, position, slope, level, and mode settings.
Saving a Setup
By default, the oscilloscope saves the setup each time it is powered
off. The oscilloscope automatically recalls this setup the next time it
is powered on.
Operating Basics
The front panel is divided into easy to use functional areas. This
section provides you with a quick overview of the controls and the
information displayed on the screen. The next figure shows the front
panels for a TDS 2 10 or TDS 220, and for a TDS 224 oscilloscope.
NOTE. You should wait at least five seconds after your lust change to
the setup before you turn off the power: This ensures that the setup is
saved properly.
You can also permanently save up to five setups in the memory of
the oscilloscope and overwrite setups as needed.
Recalling a Setup
The oscilloscope can recall any of the saved setups or the factory
default setup.
Defaults (Factory Setup)
The oscilloscope is set up for normal operation when it is shipped
from the factory. You can recall the factory default setup any time
you want to operate the oscilloscope using or starting from the
factory default settings.
22
TDS 200-Series Digital Oscilloscope User Manual
TDS 200-Series Digital Oscilloscope User Manual
23
1
Operating Basics
Operating Basics
Display Area
Trigger status indicates the following:
In addition to displaying waveforms, the display is filled with many
details about the waveform and the instrument control settings.
0 Armed. The instrument is acquiring pretrigger data. All
triggers are ignored in this state.
[Bl Ready. All pretrigger data has been acquired and the
instrument is ready to accept a trigger.
q Tria’d. The instrument has seen a trigger and is acquiring the
posttrigger data.
[Eo Auto. The instrument is in auto mode and is acquiring
waveforms in the absence of triggers.
0 Scan. The instrument is acquiring and displaying waveform
data continuously in scan mode.
l
Stop. The instrument has stopped acquiring waveform data.
Marker shows horizontal trigger position. This is adjusted by the
Horizontal Position control.
Readout shows the time difference between the center graticule
and horizontal trigger position. Center screen equals zero.
5. Marker shows trigger level.
6. Readout shows numeric value of the trigger level.
Icon shows selected trigger type as follows:
11
10
9
8 7 6
1. Icon display shows acquisition mode.
fl Sample mode
Jx
/
- Edge trigger for the rising edge.
1
- Edge trigger for the falling edge.
J”+ - Video trigger for line sync.
- Video trigger for field sync.
Peak detect mode
n Average mode
24
TDS 200-Series Digital Oscilloscope User Manual
TDS 200-Series Digital Oscilloscope User Manual
Operating Basics
Operating Basics
8. Readout shows trigger source used for triggering.
Action Button Menu Boxes
9. Readout shows window time base setting if it is in use,
An Action Button menu box displays the name of the action. For
example, you can use the two lowest menu boxes in the DISPLAY
menu to increase or decrease the contrast.
10. Readout shows main time base setting.
11. Readouts show the vertical scale factors of the channels.
Radio Button Menu Boxes
12. Display area shows on-line messages momentarily.
Radio Button menu boxes are separated by dashed lines. The name
of the selected menu box displays in reverse video. For example, you
can use the top three menu boxes in the ACQUIRE menu to select an
acquisition mode.
13. On-screen markers show the ground reference points of the
displayed waveforms. No marker indicates the channel is not
displayed.
Page Selection Menu Boxes
Using the Menu System
A Page Selection menu box contains two menus for a single button
on the front panel with the selected menu displayed in reverse video.
Each time you press the top menu box button to toggle between the
two menus, the menu boxes below also change.
The user interface of the TDS 200-series oscilloscopes was designed
for easy access to specialized functions through the menu structure.
When you press a menu button on the front panel, the associated
menu title displays at the top right of the screen. There can be up to
five menu boxes below the menu title. To the right of each menu box
is a bezel button you can use to change the menu setting.
For example, when you press the SAVE/RECALL front panel button,
the top Page Selection menu contains the names of two menus:
Setups and Waveforms. When you select the Setups menu, you can
use the remaining menu boxes to save or recall setups. When you
select the Waveforms menu, you can use the remaining menu boxes
to save or recall waveforms.
There are four types of menu boxes you can use to change settings:
Circular Lists, Action Buttons, Radio Buttons, and Page Selections.
The SAVE/RECALL, MEASURE, and TRIGGER front panel
buttons display Page Selection menu boxes.
Circular List Menu Boxes
A Circular List menu box appears with a title on top with the
selected choice listed below in reverse video. For example, you can
push the menu box button to cycle through the vertical coupling
choices in the CH1 Menu.
Circular List
Action Button
Radio Button
ACQUIRE
Page Selection
SAVE/RECm
!!!!I
Waveforms
or
JL”
Peak detec
_-_-n
Recall
Factory
or
26
TDS 200-Series Digital Oscilloscope User Manual
5
3
TDS 200-Series Digital Oscilloscope User Manual
27
Operating Basics
Operating Basics
Waveform Displays
Obtaining a waveform display is dependent on many instrument
settings. Once you obtain a waveform, you can take your measurements. But the appearance of these waveforms also provides key
information about the waveform.
Depending on the type, waveforms will be displayed in three
different styles: black, gray, and broken.
2. Reference waveforms and waveforms with persistence applied
appear gray.
3. A broken line appearance indicates the waveform display
accuracy is uncertain. This is the result of stopping the acquisition and then changing a control setting that the instrument
cannot modify the displayed waveform to match. For example,
changing the trigger controls on a stopped acquisition causes a
broken-line waveform.
Vertical Controls
-
^
( . .
-
1
-
2
T
.*__.__ . _. _ _.. ----*.--- . __ *
I
“.......‘.‘...,
c
!
r.......,
I
3
i
i . . . . . _ . .._..
-
VERTICAL
n POSITION
-i7
I
n POSITION
77
63
CURSOR 1
MATH
MENU
CH 1
MENU
0
63
CURSOR 2
C H 2
MENU
3
t
0
VOLTSIDIV
VOLTS/DIV
1. A solid black waveform indicates a live waveform display. The
waveform remains black when the acquisition is stopped if no
controls are changed that make the display accuracy uncertain.
Changing the vertical and horizontal controls is allowed on
stopped acquisitions.
28
TDS 200-Series Digital Oscilloscope User Manual
TDS 210 and TDS 220
TDS 200-Series Digital Oscilloscope User Manual
Operating Basics
Operating Basics
MATH
IUENU)
(
VERTICAL
n POSITION
v
CURSOR 1
CH 1
1
n POSITION
-7
n POSITION
v
CURSOR 2
CH2
CH
3
A
POSITION
v
VOLTS/DIV
VOLTWDIV
Horizontal Controls
HORIZONTAL
a POSITION p
c
HORIZONTAL
IUENU]
4~8,
SEC/DIV
lgi
CH4
[MENUJ
VOLTS/DIV
I
CI’ 3
I
ai!’ 3
I
VOLTSIDIV
HORIZONTAL
MENU
0
5s
5ns
TDS 224
SEC/DIV
2mv
5v
5v
2mV
5s
TDS 224
5”s
TDS 210 and TDS 220
CH 1,2,3 & 4 and CURSOR 1 & 2 POSITION. Positions the waveform
vertically. When cursors are turned on and the cursor menu is
displayed, these knobs position the cursors.
CH 1, CH 2, CH 3 & CH 4 MENU. Displays the channel input menu
selections and toggles the channel display on and off.
VOLTS/DlV (CH1, CH 2, CH 3 81 CH 4). Selects calibrated scale factors.
MATH MENU. Displays waveform math operations menu and can also
be used to toggle the math waveform on and off.
POSITION. Adjusts the horizontal position of all channels and math
waveforms. The resolution of this control varies with the time base.
NOTE. To make a large adjustment to the horizontal position, change
the SEC/DIV to 50 ms, change the horizontal position, and then
change the SEC/DIV back to the previous value.
HORIZONTAL MENU. Displays the horizontal menu.
30
TDS 200-Series Digital Oscilloscope User Manual
TDS 200-Series Digital Oscilloscope User Manual
31
Operating Basics
Operating Basics
SECIDIV. Selects the horizontal time/div (scale factor) for the main or
the window time base. When Window Zone is enabled, it changes
the width of the window zone by changing the window time base.
Refer to page 73 for details about creating and using the Window
Zone.
TRIGGER MENU. Displays the trigger menu.
SET LEVEL TO 50%. The trigger level is set to the vertical midpoint
between the peaks of the trigger signal.
FORCE TRIGGER. Starts an acquisition regardless of an adequate
trigger signal. This button has no effect if the acquisition is already
stopped.
Trigger Controls
TRlGGER)
LEVEL
TRIGGER
;==, (MENUJ
TRIGGER VIEW. Displays the trigger waveform in place of the channel
waveform while the TRIGGER VIEW button is held down. You can
use this to see how the trigger settings affect the trigger signal, such
as trigger coupling.
>
Menu and Control Buttons
0
HOLDOFF
TK%5R
0
TDS 224
SAVE/RECALL
MEASURE
FORCE TRIGGER
TDS 210 and TDS 220
TRIGGER VIEW
0
SAVE/ RCL
‘DS 210 and TDS 220
LEVEL and HOLDOFF. This control has a dual purpose. As an edge
trigger level control, it sets the amplitude level the signal must cross
to cause an acquisition. As a holdoff control, it sets the amount of
time before another trigger event can be accepted. Refer to Holdc$
on page 13 for more information.
32
MEASURE
ACQUIRE
(---][-]I-)
(AUTOSET)
TDS 200-Series Digital Oscilloscope User Manual
unum
0
CURSOR
0
(HARDCOPY)
DISPLAY
0
TDS 224
TDS 200-Series Digital Oscilloscope User Manual
Operating Basics
Operating Basics
SAVE/RECALL. Displays the save/recall menu for setups and
waveforms.
MEASURE. Displays the automated measurements menu.
ACQUIRE. Displays the acquisition menu.
Connectors
WlOBE CQMP
- 5”i-L
CHl
CH2
EXT TRIG
DISPLAY. Displays the display menu.
CURSOR. Displays the cursor menu. Vertical Position controls adjust
cursor position while displaying the cursor menu and the cursors are
turned on. Cursors remain displayed (unless turned off) after leaving
the cursor menu but are not adjustable.
TDS 210 and TDS 220
UTILITY. Displays the utility menus.
CH2
AUTOSET. Automatically sets the instrument controls to produce a
usable display of the input signal.
HARDCOPY. Starts print operations. An extension module with a
Centronics, RS-232, or GPIB port is required. Refer to Optional
Accessories on page 98.
RUN/STOP. Starts and stops waveform acquisition.
@ii@@
@
TDS 224
PROBE COMP. Voltage probe compensation output and ground. Use
this to electrically match the probe to the input circuit. Refer to
page 6.
The probe compensation ground and BNC shields are connected to
earth ground. Do not connect a voltage source to these ground
terminals.
CH 1, CH 2, CH 3 & CH 4. Input connectors for waveform display.
EXT TRIG. Input connector for an external trigger source. Use the
trigger menu to select the trigger source.
34
TDS 200-Series Digital Oscilloscope User Manual
TDS 200-Series Digital Oscilloscope User Manual
35
Application Examples
Application Examples
This section presents a series of application examples. These
simplified examples highlight the features of the oscilloscope and
give you ideas for using it to solve your own test problems.
n
Taking Simple Measurements
You need to see a signal in a circuit, but you do not know the
amplitude or frequency of the signal. You want to quickly display the
signal and measure the frequency, period, and peak-to-peak
amplitude.
Taking simple measurements
Using Autoset
Using the Measure menu to take automatic measurements
Measuring two signals and calculating gain
m
Taking cursor measurements
Measuring pulse width
Measuring rise time
Measuring ring frequency and ring amplitude
m
n
Analyzing signal detail
Looking at a noisy signal
Using the average function to separate a signal from noise
Triggering on a video signal
Triggering on video fields and video lines
Using the window function to see waveform details
Triggering on odd or even video fields
n
Analyzing a differential communication signal
Using math functions
n
36
Viewing impedance changes in a network
Using XY mode
Using persistence
_L
-
Using Autoset
-
To quickly display a signal, do these steps:
1. Connect the channel 1 probe to the signal.
2. Push the AUTOSET button.
The oscilloscope sets the vertical, horizontal, and trigger controls
automatically. If you want to optimize the display of the waveform,
you can manually adjust these controls.
When you use more than one channel, the autoset function sets the
vertical controls for each channel and uses the lowest-numbered
active channel to set the horizontal and trigger controls.
TDS 200-Series Digital Oscilloscope User Manual
TDS 200-Series Digital Oscilloscope User Manual
37
Application Examples
Application Examples
Taking Automatic Measurements
Measuring Two Signals
The oscilloscope can take automatic measurements of most
displayed signals. To measure signal frequency, period, and
peak-to-peak amplitude, do these steps:
You are testing a piece of equipment and need to measure the gain of
the audio amplifier. You have an audio generator that can inject a test
signal at the amplifier input. Connect two oscilloscope channels to
the amplifier input and output as shown. Measure both signal levels
and use the measurements to calculate the gain.
1. Push the MEASURE button to see the Measure menu.
2. Push the top menu box button to select Source.
3. Select CHl for the first three measurements.
4. Push the top menu box button to select ‘ljpe.
5. Push the first CHl menu box button to select Freq.
6. Push the second CHl menu box button to select Period.
7. Push the third CHl menu box button to select Pk-Pk.
The frequency, period, and peak-to-peak measurements are shown in
the menu and are updated periodically.
CHl
;
3
’
3
3
s-
CH2
,
Lj
.
3
3
3
?I
38
TDS 200-Series Digital Oscilloscope User Manual
5
TDS 200-Series Digital Oscilloscope User Manual
39
Application Examples
Application Examples
To activate and display the signals connected to channel 1 and to
channel 2, do these steps:
Taking Cursor Measurements
1. If the channels are not displayed, push the CH 1 MENU and then
CH 2 MENU buttons.
You can use the cursors to quickly take time and voltage measurements on a waveform.
2. Push the AUTOSET button.
Measuring Pulse Width
To select measurements for the two channels, do these steps:
You are analyzing a pulse waveform, and you want to know the
width of the pulse. To measure the width of a pulse using the time
cursors, do these steps:
1. Select the source channels.
a. Push the MEASURE button to see the Measure menu.
b. Push the top menu box button to select Source.
c. Push the second menu box button to select CHl.
d. Push the third menu box button to select CH2.
2. Select the type of measurement displayed for each channel.
1. Push the CURSOR button to see the Cursor menu.
2. Push the top menu box button to select Time.
3. Push the Source menu box button to select CH 1.
4. Use the CURSOR 1 knob to place a cursor on the rising edge of
the pulse.
a. Push the top menu box button to select Type.
5. Use the CURSOR 2 knob to place the remaining cursor on the
falling edge of the pulse.
b. Push the CHl menu box button to select Pk-Pk.
You can see the following measurements in the Cursor menu:
c. Push the CH2 menu box button to select Pk-Pk.
m The time at Cursor 1, relative to the trigger.
3. Read the peak-to-peak amplitudes for channel 1 and channel 2 in
the menu display.
w The time at Cursor 2, relative to the trigger.
m The delta time, which is the pulse width measurement.
4. Calculate the amplifier gain using the following equations:
Gain =
output amplitude
mput amplitude
G a i n (dB) = 20 x log(Gain)
40
TDS 200-Series Digital Oscilloscope User Manual
TDS 200-Series Digital Oscilloscope User Manual
41
Application Examples
Application Examples
5. Adjust the VOLTS/DIV knob to set the waveform amplitude to
exactly five divisions.
6. Use the VERTICAL POSITION knob to center the waveform;
position the baseline of the waveform 2.5 divisions below the
center graticule.
7. Push the CURSOR button to see the Cursor menu.
8. Push the top menu box button to set the type to Time.
9. Use the CURSOR 1 knob to place the cursor at the point where
the waveform crosses the second graticule line below center
screen. This is the 10% point on the waveform.
NOTE. The TDS2MM extension module provides pulse width as an
automatic measurement.
10. Use the CURSOR 2 knob to place the second cursor at the point
where the waveform crosses the second graticule line above
center screen. This is the 90% point on the waveform.
Measuring Rise Time
After measuring the pulse width, you decide that you need to check
the rise time of the pulse. Typically, you measure rise time between
the 10% and 90% portion of the waveform. To measure the rise time,
do these steps:
1. Adjust the SEC/DIV knob to display the rising edge of the
waveform.
2. Adjust the VOLTS/DIV knob to set the waveform amplitude to
about five divisions.
3. Push the CH 1 MENU button to see the CHl menu if it is not
displayed.
11. The delta readout in the cursor menu is the rise time of the
waveform.
-r-
5 divisions
I__
4. Push the VoltdDiv button to select Fine.
NOTE. The TDS2MM extension module provides rise time as an
automatic measurement.
42
TDS 200-Series Digital Oscilloscope User Manual
TDS 200Series Digital Oscilloscope User Manual
43
Application Examples
Application Examples
Measuring Ring Frequency
To measure the ring frequency at the rising edge of a signal, do these
steps:
Measuring Ring Amplitude
1. Push the CURSOR button to see the Cursor menu.
You measured the ring frequency in the previous example. Now you
want to measure the amplitude of the ringing. To measure the
amplitude, do these steps.
2. Push the top menu box button to select Time.
1. Push the CURSOR button to see the Cursor menu.
3. Use the CURSOR 1 knob to place a cursor on the first peak of
the ring.
2. Push the top menu box button to select Voltage.
4. Use the CURSOR 2 knob to place a cursor on the second peak of
the ring.
You can see the delta time and frequency (the measured ring
frequency) in the Cursor menu.
3. Use the CURSOR 1 knob to place a cursor on the highest peak of
the ring.
4. Use the CURSOR 2 knob to place a cursor on the lowest point of
the ring.
You can see the following measurements in the cursor menu:
w The delta voltage (peak-to-peak voltage of the ringing)
44
TDS 200-Series Digital Oscilloscope User Manual
n
The voltage at Cursor 1
n
The voltage at Cursor 2
45