1
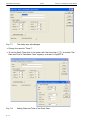
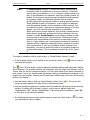
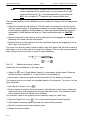
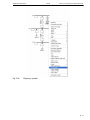
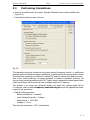
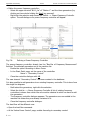
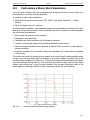
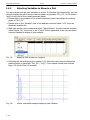
DIgSILENT PowerFactory Tutorial Exercise 7: Transient Analysis • Plots are one of the many different ways in which a VI displays the information about the variables it has. Plots show all sorts of time-domain variables depending on other variables. Plots can be used in different ways (subplots, subplots with two y axis, X-Y plots and FFT plots). In this part of the Tutorial plots are used as subplots. I.4.1 Running a Transient Simulation The main toolbar shows two icons for starting ( ulation. Click on the start ( ) and stopping ( ) the transient sim- ) icon. Enter an execution time of 10s. Press Execute The simulation is now started. The output window will show messages about the events that are processed, when they are processed. The predefined graphs (in the ''Generators'' Virtual Instrument Panel) will start to show results. All plots can be scaled automatically in the x- respectively y-direction to the best view by clicking on the icons and . Furthermore for a better analysis of certain time period or a closer look at the graphs, the x- and y-axis can easily be zoomed in using the 'Zoom x-Axis' icon ( I.4.2 ) and the 'Zoom y-Axis' icon ( ). Defining New Virtual Instruments The Tutorial Manager has already defined the Virtual Instrument Panel called ''Generators''. It contains two plots, displaying the speed and the turbine power of the generator PP1_G1. Now you are going to create the same plots for the generator PP1_G2: Open (if not already open) the Virtual Instrument Panel ''Generators'' and click on the the "Append new VI's'' ( ) icon. In the dialog that pops up, select the "Subplot (Visplot)'' object. Set the desired number of new subplots (in this case 2). Click on the icon to arrange the plots by pairs (if you prefer a vertical arrangement use the icon). Double click on the first empty (or bottom-left) subplot to open its edit dialog and define the variables to display. In the ''Curves'' field (bottom of the edit dialog), double click on the empty Element field to select an element. A data browser, showing the elements with defined variable sets, pops up (Figure I.3). Double click on the PP1_G2 icon to select it. I - 10