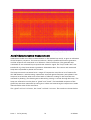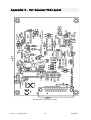
1
Acknowledgements Design Team The UKRAA VLF Receiver design is a combination of public domain material and original improvements by John Cook and Peter King. The circuit board layout was undertaken by John Cook. Testing Team The VLF Receiver was tested by David Farn, Paul Hyde, Martyn Kinder and Andrew Lutley. Aerial Characterisation experiments were undertaken by Alan Melia and Whit Reeve. Production Team The initial batch of the VLF Receivers was produced by Andrew Lutley, Paul Hyde and Norman Pomfret. Contributors The following authors have contributed to the VLF Receiver User Manual: Tony Abbey, John Cook, David Farn, Prof Tudor Jones, Martyn Kinder, Andrew Lutley, Alan Melia, Dr Laurence Newell, Whit Reeve, Dr Chris Thomas. Issue 1 2010 January 1 © UKRAA Table of Contents Introduction.........................................................................................................................5 UKRAA.............................................................................................................................5 The UKRAA VLF Receiver..................................................................................................5 VLF Receiver System Requirements...................................................................................6 Power Supply Considerations........................................................................................6 Support............................................................................................................................7 Flare Detection using VLF Radio signals................................................................................7 The Ionosphere................................................................................................................7 Flare Detection Mechanism...........................................................................................7 Ionospheric Layers.......................................................................................................8 Normal Quiet VLF Propagation..........................................................................................8 Changes due to Solar Flares.............................................................................................9 Abnormal Results.............................................................................................................9 Detection Summary........................................................................................................10 Selecting a Suitable VLF Transmitter...................................................................................12 Background....................................................................................................................12 Choosing a Transmitter for SID Monitoring.....................................................................13 VLF Receiver Technical Description.....................................................................................13 Setting up the VLF Receiver System....................................................................................14 Tools required...............................................................................................................14 Tuning the Receiver.......................................................................................................15 Tuning the Aerial...........................................................................................................17 Aerial Characterisation Measurements............................................................................18 Dimensional and Electrical Considerations......................................................................21 Inductance Method 1: Single-layer polygon coil..........................................................22 Inductance Method 2: Multi-layer polygon coil with rectangular cross-section............23 Inductance Method 3: Single-layer square coil............................................................24 Measurements............................................................................................................25 Troubleshooting and Radio Interference.........................................................................25 Interference................................................................................................................26 Sources of interference...............................................................................................26 How to clean up?........................................................................................................26 Issue 1 2010 January 2 © UKRAA Computer problems...................................................................................................27 Classification and Interpretation of Results.........................................................................28 Flare Classification.........................................................................................................28 Event Recording.............................................................................................................28 Interpretation of Recordings...........................................................................................29 The GOES X Ray Satellites...............................................................................................33 The Use of Multiple Receivers.........................................................................................34 Orientation of the Loop Aerial........................................................................................34 Using the VLF Receiver.......................................................................................................34 Configuring Output Voltage Options...............................................................................34 UKRAA Starbase.............................................................................................................35 Getting Started...........................................................................................................35 RS232 or RS485?........................................................................................................36 Data Logging..............................................................................................................37 Offline Logging Mode.................................................................................................37 Realtime Logging Mode..............................................................................................38 Advanced Topics........................................................................................................39 Data Loggers.................................................................................................................39 Radio Sky Pipe................................................................................................................41 Installing a MAX 186 chip in the VLF Receiver.............................................................42 Connecting to Radio-SkyPipe......................................................................................42 Dual-frequency Monitoring........................................................................................44 Glossary............................................................................................................................45 References.........................................................................................................................46 Internet URLs.................................................................................................................46 Books............................................................................................................................46 Contacts ...........................................................................................................................48 Appendix 1 – VLF Receiver Specifications...........................................................................49 Appendix 2 – VLF Transmitting Stations.............................................................................49 Appendix 3 – VLF Receiver PCB Layout...............................................................................50 Appendix 4 – VLF Receiver Circuit Diagram........................................................................51 Appendix 5 – I2C Address Map..........................................................................................52 Setting the Bus Address of the Temperature Sensor........................................................52 Issue 1 2010 January 3 © UKRAA Setting the Bus Address of the Configuration Memory.....................................................53 Appendix 6 – Jumper Settings and Pinouts.........................................................................53 Jumpers.........................................................................................................................53 Headers.........................................................................................................................54 DB25 Socket..................................................................................................................54 Receiver to Starbase Controller Cable.............................................................................55 Appendix 7 – Regulatory Compliance.................................................................................56 RoHS..............................................................................................................................56 WEEE..............................................................................................................................56 Revision History.................................................................................................................57 Outstanding Work..........................................................................................................57 Issue 1 2010 January 4 © UKRAA Introduction UKRAA The UK Radio Astronomy Association (UKRAA) is a non-profit-making charitable company limited by guarantee. It was established by the Radio Astronomy Group of the British Astronomical Association (BAA) to facilitate the production and sale of radio astronomy products. Any suggestions or recommendations for improvement of this Manual would be appreciated. See the Contacts page for further details. The UKRAA VLF Receiver The UKRAA VLF Receiver Circuit Board The UKRAA Very Low Frequency (VLF) Receiver is designed to record Sudden Ionospheric Disturbances (SIDs) induced by solar flares. It does this by monitoring transmissions from Earth-based beacons, which are affected by changes in the ionosphere, giving an indirect indication of events on the Sun. The main motivation for this work is to correlate these radio observations of solar activity with those from optical observers, and to follow the cycles of sunspots as they appear on the Sun. The VLF Receiver output is a voltage varying with time, which may be fed to any data logger or digital multimeter. Alternatively, it may be connected to the Starbase software (provided free of licensing charges by UKRAA), allowing observations to be stored centrally and shared with other observers. The VLF Receiver is also compatible with the popular Radio Sky Pipe data logging software, but extra components will be required. The UKRAA VLF Receiver has a tuning range of about 12kHz to 35kHz, requires a supply of 15v DC at 35mA, and provides output signals at 0 – 2.5 Volts and 0 – 5 Volts. It is designed to work with the UKRAA VLF loop Aerial and the UKRAA VLF Aerial Tuning Unit. The VLF Receiver, a VLF loop aerial and a VLF Aerial Tuning Unit are available from UKRAA in kit form, or built and tested. You may also find one of the range of VLF Signal Generators useful during tuning of the system. Issue 1 2010 January 5 © UKRAA VLF Receiver System Requirements You will need the following in order to operate your VLF Receiver: • A suitable tuned aerial such as the UKRAA VLF Aerial with the UKRAA Aerial Tuning Unit (see below); • A power supply (see below); • A length of coaxial cable with BNC connector(s) to connect the Receiver to the Aerial/ATU; • A means of reading and/or recording/logging the Receiver output (see below). The UKRAA VLF Loop Aerial and Aerial Tuning Unit Power Supply Considerations This can either be a battery or a mains adapter, in each case capable of supplying 15V DC at 35mA. For instance, UKRAA can supply the PW01806 15V regulated, linear (non-switching) as stocked by CPC. Other suitable supplies are: Maplin (UK) 15V at 500mA Unregulated (GS76H). Rapid Electronics (85-3903), Farnell (1176-275). It is important to ensure that the positive output of the power supply is connected to the 2.5mm central socket. All UKRAA modules are standardised to use this type of supply. Make sure that the power supply is not covered in any way; it should run only slightly warm to the touch. Issue 1 2010 January 6 © UKRAA Support All users of the VLF Receiver system are encouraged to make use of the support available from UKRAA for setting up and operation. Please see the Contacts section for details. Flare Detection using VLF Radio signals Alan Melia G3NYK, a Member of the Radio Society of Great Britain (RSGB) Propagation Studies Committee, contributed this section. The detection of Solar Flares can be achieved by continuously recording the signals from some of the Military radio transmitters on VLF (Very Low Frequency) radio. In the radio field these events were given the name Sudden Ionospheric Disturbances (SID) early on, and Flare detection is sometimes referred to as SID detection. The effect depends upon the response of the ionosphere to the burst of solar radiation, and the mechanics of the radio propagation mechanism. The Ionosphere The ionosphere is a region of the Earth’s atmosphere where the gas density is low enough for atoms that become ionised to exist for a significant period of time before meeting and colliding with another atom and becoming neutralised again (collisional recombination). This region is at an altitude of between 50 km and about 600 km above sea level. The ionising energy arises mainly from the Sun in the form of particles and electromagnetic radiation from the visible spectrum right through to gamma rays. Flare Detection Mechanism The part of the Ionosphere that interests us from the point of view of Flare detection is referred to as the ‘D-layer’ (at 50 km to 90 km altitude) and the ‘lower E-layer’ (90 km to 150 km altitude). In the radio field the D-layer is known mainly as an absorbing blanket that stops long distance propagation at lower “short wave” frequencies. At VLF and LF, which are defined as frequencies below 300 kHz, the D-layer provides the means by which these frequencies could reach world-wide before the short-wave bands were opened up in the 1930s. The D-layer is often explained as forming a (lossy) “waveguide” with the Earth’s surface that guides the waves round the curvature of the Earth. Squeezing of this waveguide by changes in the D-layer change the amplitude and phase of waves passing through the guide. Although the simpler analogy of a mirror “reflection” can be used to describe the propagation mechanism, the physical mechanism is actually ‘refraction’, the same mechanism that is responsible for the “bent pencil in the tumbler of water” effect. The term ‘reflection’ is used here in quotes when describing the ionosphere returning an upward radio signal back towards the Earth. The Ionosphere is characterised by an increasing electron density from about 50 km altitude upwards. At low electron densities and the higher air pressures around 50 km, the incoming radio wave loses energy to the free electrons, which recombine before they have chance to return energy to the wave. However at higher altitudes the electrons have a chance to Issue 1 2010 January 7 © UKRAA interact with the wave for longer, in a way that apparently speeds up the wave, bending its direction back towards Earth again. These two mechanisms, absorption and “reflection” are vital to the understanding the SID detection mechanism. Ionospheric Layers •Topside From F2 layer to 500/1000km transition O+ less than H+ and He+ •F Layer Above 150km, reflecting F2 layer, ions NO+ (lower) to O+ (upper) •E Layer 95 – 150km, ions are mainly O++, also thick E2, thin sporadic E •D Layer 75 – 95km, weak ionisation, absorbs HF Normal Quiet VLF Propagation At relatively short distances, less than 1000 km, the radio signal from the VLF transmitter reaches the receiver by two paths. One of these hugs the ground and is called, unsurprisingly, the “ground-wave”; the other is via “reflection” from the ionosphere, called the Ionospheric-wave, often colloquially known as the “Sky-wave”. These two paths are of different lengths, and lead to the formation of an ‘interference pattern’. In this case the term ‘interference’ is used in the optical sense and not meaning unwanted noises and lightning static as in the radio sense. The different path lengths for the two signals means that the phases of these signals will differ at the receiver. If the path difference is an even number of half wavelengths the signals on the two paths will reinforce and if the number of half-wavelengths is odd there will be some cancellation. The same kind of effect is obtained by listening to a steady sound from a loudspeaker in a sparsely furnished room and moving slowly around. You will find places whether the sound you hear is reduced and other where it is enhanced. The difference in distance between these points is one half wavelength of the sound-wave. If the amplitudes of the signals on the two paths are the same and they are out-of-phase there will be perfect cancellation. However the reflected wave is usually attenuated so it arrives weaker than the direct wave so there is less than complete cancellation. If, as in the case of the ionosphere, the “reflector” moves up and down there is a continuous change in the received signal which is normally referred to as ‘fading’. In daytime the Sky-wave is attenuated by the absorbing part of the D-layer, but the amount of absorption is dependent on the amount of penetration. High angle waves penetrate deeply and are severely attenuated, but waves at low angles of incidence penetrate more shallowly and are less attenuated. The ground-wave component of the signal progressively weakens as the receiver becomes further from the transmitter. At about 700 km range the ground and sky waves are approximately the same strength. Issue 1 2010 January 8 © UKRAA After dark the D-layer, which is mainly ionised by Solar Ultra Violet rays, quickly disappears and with it all the absorbing ionisation. “Reflection” now occurs from the lower part of the E-layer at around 90 km to 100 km altitude. The result of this is that once the mid point of the path is in shadow at 100 km altitude, the signal strength will usually increase significantly, while the ground wave signal stays exactly the same strength. Thus night-time reception is marked by large and rapid swings in signal strength as the two, now more nearly equal strength, signals swing in and out of phase. This is of little interest to the SID observer as there can be no Solar Flares detected in the Earth shadow, but it may help to set up the Receiver levels correctly, so that you do not miss or corrupt a flare-induced signal. The later section Classification and Interpretation of Results has many examples of the types of recording which may be made. Changes due to Solar Flares A Solar Flare is caused by the sudden collapse of the very highly strained magnetic field in the region of a Sun-spot. Electro-magnetic waves are generated by changing magnetic fields, and the size and strength of the field in a Sun-spot are enormous. When the twisted and strained field snaps into a lower energy condition, vast amounts of energy are released as high energy electro-magnetic radiation. This can be detected from microwaves right up to gamma-rays. This radiation travels in a straight line at the speed of light and takes about 8 minutes to reach Earth. If we had no atmosphere we would be fried!! Fortunately our atmosphere and the Earth’s magnetic field protect us from the worst of the radiation blast. The UV penetrates to the D-layer and the higher energy waves create an avalanche of particles in the very outer regions of the atmosphere. When the radiation reaches the Dlayer it produces a very high level of ionisation, pushing the “reflection” level right down through the normally lightly ionised absorbing layer. In effect we have a “mirror” at 50 km and no attenuation of the Sky-wave signals. Hence the usually displayed “shark-fin” response on the signal strength plots. The height of the trace is related to the strength of the flare (see the NOAA web site for a tutorial) though a very strong flare may saturate. From experience it is unlikely that a flare of below Class-C1.0 will be reliably detected. In solar quiet conditions it may be possible in retrospect to relate deviation in signal strength to flares of B5.0 or higher. Detection sensitivity depends upon many factors including the distance from the VLF transmitter and the time of day. It may be useful to monitor several stations to determine which gives the best sensitivity. Abnormal Results It is not unusual for an observer to get strange results that are difficult to understand at first. A common one is a negative going “shark-fin” at a flare. This has been written off by some as an equipment fault, but it is a function of the distance from the transmitter of the monitored signal. Remember the fading effect mentioned earlier; if the ground wave is much stronger than the normal quiet Sky-wave and they are out of phase, then an increase in Sky-wave strength will reduce the level of the composite signal. This can be complicated by some flares which cause the signal to go one way at first and then the other before the signal returns to the undisturbed level. Issue 1 2010 January 9 © UKRAA The shape of the recording will depend on: • The distance between the transmitter and the receiver • The effects of the signal level going both up and down before returning to normal If you are a great distance from the station (when monitoring LF beacon stations at 2000 km the flare effect will always be upward because the ground wave is very weak at this range) then there are some special effects that take place at sunrise and sunset. These are often referred to and the morning and evening “dips”. These are caused by the daytime Sky-wave being wiped out by an unexpected effect. At sunrise and sunset the Ionospheric “reflection point” is actually illuminated from underneath, by weak rays that have grazed the ground at the edge of the darkness shadow. These produce weak ionisation levels that strongly absorb radio signals but are not enough to “reflect”. They totally cloak the E-layer that will soon take up the reflection of the night-time Sky-wave, thus virtually removing the daytime Skywave. The composite signal level at this time correlates well with calculations of groundwave only signal strength, which are based on transmitter power, range, and ground conductivity. The following reference discusses these effects in more detail: www2.nict.go.jp/y/y223/sept/swgparts/groupmember/former/kikuchi/paper/13.pdf Detection Summary Quiet Sun Low level of Sky-wave signal received vs. ground-wave. Issue 1 2010 January 10 © UKRAA At Night Erratic level of Sky-wave signal vs. constant ground-wave. Active Sun High Sky-wave signal level received during a flare. Issue 1 2010 January 11 © UKRAA Selecting a Suitable VLF Transmitter Background There are a number of Military transmitting stations in VLF that normally transmit 24 hours a day every day (see the Transmitter frequency list in the Appendix). This makes them excellent beacons for probing the ionosphere for the changes produced by Solar Flares. VLF waves are used for time signals and radio navigation beacons such as the Russian hyperbolic radionavigation system RSDN-20. Since VLF can penetrate water to a depth of several metres, it is used by the military to communicate with submarines near the surface. Transmitters have a power of a few hundreds of kiloWatts. When selecting a station remember that you do not want a station that is too close, because that station will be mainly received by "ground-wave" which is not affected by ionospheric conditions and is in fact very steady in strength. At about 700 km range the ITU Recommendations suggest that the Sky-wave (or ionospheric "reflected" waves) is comparable in strength to the ground wave. At the preferred distance of about 1000km, the sky-wave is always stronger than the ground wave. The shortest range to the transmitter that is useful is around 500km. At shorter ranges like this the relative strength of the two components can lead some strange effects, like negative excursions in strength during a flare instead of the normally expected positive excursion. Unfortunately the majority of the easily received stations in the UK are within 700km because they are nearly all Naval transmitting stations. Ramsloh in Germany is a favourite, strong and easy to find station but is possibly too close to the UK to be ideal. Tavolare in Italy is nearer the right distance but may need a sensitive aerial. In recent years the level of radio interference in the VLF band has increased substantially as "switched-mode" power supplies are installed in everything from TV and PCs to mobile phone chargers, and everyone uses "dimmers" on their house lights. It is probably best to select a strong station at less than the optimum range initially, and progress later to more difficult targets when you understand the local radio environment. Radio Astronomy is dogged by radio-interference problems at all frequencies. The radio frequency spectrum has been split into regions according to ITU radio regulations, as shown in the diagram below. The VLF region corresponds to frequencies between 3kHz and 30kHz (wavelengths between 100 and 10km). Those frequencies are much lower than those used for AM broadcast radio stations (LW, MW, SW). The VLF frequency range is also home to natural electromagnetic emissions (called spherics, tweeks, whistlers...) emitted thousands of miles from the receiver. They can be turned into sound that we can hear. This is called "natural radio". The book Radio Nature (see References) describes these phenomena in more detail. Issue 1 2010 January 12 © UKRAA Choosing a Transmitter for SID Monitoring You can find in this website a list of VLF transmitters that can be used for SID monitoring. It is important to select a transmitter that is far enough to limit the ground wave field strength. The DCF77 web site (see DCF77 range) mentions a predominant ground wave until 500km (300 miles) and a similar ground and sky wave field strengths from 600 to 1100km (400 to 700 miles). Consequently, one must choose a transmitter at least 500km (300 miles) away, and preferably at more than 1100km (700 miles). The upper limit for having a single hop is about 1900km (1200 miles) during the day (assuming a D-layer at an altitude of 70km) and 2100km (1300 miles) during the night (assuming an E-layer at an altitude of 90km). Transmitters at greater distance will be received through two or more hops and will exhibit more than one sunrise and one sunset pattern. Try to choose a VLF transmitter at a range between 500km and 1000km from your location. Appendix 2 lists various VLF transmitters. The NATO transmitter at 23.4kHz, situated in Ramsloh, Germany is often chosen by UK VLF observers due to its generally favourable location, signal strength and the distinctive 2 hour daily shut down between 0700 and 0800 UT. VLF Receiver Technical Description The previous sections have shown how the SID detection mechanism relies on monitoring VLF beacons over a long period of time. The UKRAA VLF Receiver is a high-gain, very narrow band amplifier that may be tuned to the specific frequency of a VLF beacon. The loop aerial normally used is also tunable, to further enhance the selectivity of the system. Some users may find adequate results with an untuned single-wire aerial, but this will require an electrically quiet location. Please refer to the circuit diagram in the Appendix. A cascode input stage buffers the tuned aerial, providing a small gain. Its primary function is to isolate the aerial from the narrowband filter. The filter circuit uses four operational amplifiers (opamps), and is based on a circuit used in analogue computing. While it is greedy on opamps, it provides nearly independent control of gain, frequency and Q (a measure of the bandwidth), a feature that greatly speeds up initial tuning. Just two close tolerance capacitors are required. To eliminate the build-up of offset voltages in such a circuit, the filter output is AC coupled into a selectable x1 or x10 gain stage. In conjunction with the filter gain control, this can be set to fit the diurnal change in signal strength within the range of the output. The amplified and filtered signal is rectified to provide a simple DC output with a fairly long time constant of about 1 second. This will remove all of the original modulation, and produce a smoothly changing voltage free of too much noise. A final x2 amplifier drives the output to the recording device. Outputs are provided at 0…2.5V and at 0…5V, depending on the measuring device to which the receiver is connected. Further filtering can be provided by the recording system, if required. No calibration of signal strength is required, as this is an indirect recording of the Sun. The important part of the observation is to record the timing of the events. Issue 1 2010 January 13 © UKRAA A small serial memory (EEPROM) is included in the Receiver to ensure compatibility with the UKRAA Starbase system, This stores identification and configuration details for the module (as XML), allowing the Starbase Observatory to automatically identify which instruments are connected. The Receiver module also contains a temperature sensor, allowing calibration of the response with variations in ambient temperature. Setting up the VLF Receiver System Tools required Multimeter Small watchmaker’s screwdriver Audio Signal Generator The UKRAA VLF Signal Generator is shown below. The generator has one high-level output for driving an aerial, and a low-level output for direct connection to the Receiver input. Various frequencies are available; the one shown at 23.4kHz simulates the Ramsloh VLF transmitter, which is a common choice for UK residents. The UKRAA VLF Signal Generator Issue 1 2010 January 14 © UKRAA Tuning the Receiver Tuning the Receiver requires a digital multimeter, an audio signal generator operating at the frequency of your chosen VLF beacon, a screwdriver, and some patience! The characterisation section contains a receiver response curve to show what can be achieved by carefully following this procedure. • VR1 is RF gain • VR2 is Q factor of the filter • VR3 is Coarse Frequency • VR4 is Fine Frequency Proceed as follows: 1. Unscrew the four end panel screws from the DC input end of the Receiver case, ease the end panel away from the enclosure and slide off the top panel to expose the printed circuit board. The four trimmer variable resistors, coloured blue and marked on the printed circuit board, are adjusted by means of a screw on the top of the casing. 2. Connect a digital multimeter to the output terminals, set to read DC Voltage. 3. Put a shorting link on the aerial socket. 4. Wind VR1(RF gain) fully clockwise, VR2 (Q), and VR3 (Coarse Frequency) and VR4 (Fine Frequency) fully anti-clockwise – about 15 turns should do. Some trimmer pots produce an definite click when they reach the end as the guide jumps a thread, some don't. Then wind VR4 (fine Frequency) back clockwise about 7 full turns, to midposition. 5. Connect a voltmeter to the output terminals or P10. Either an analogue or digital meter will do, although digital meters are a little slower to respond when looking for tuning peaks. Connect the 15 Volt supply. If you can also measure the current drawn from the supply it should be around 30mA . If it is less than 25mA or more than 40mA remove the power and examine the board for problems. 6. Assuming the current draw is correct, observe the output voltage level on the meter across P10. It should be approximately 0.25V (between 0.2V and 0.3V is acceptable) Set the range on the output meter to a range which will display 2.5 Volts (or 5 Volts if R28 and R29 are installed). Turn VR2 (Q) clockwise slowly, say a quarter turn at a time, watching the meter for any sign of an increase in the indicated output level. At some point before the fully clockwise position the output level will start to rise rapidly. Stop turning the trimmer adjust screw and await a stable reading. In all probability this will be 2.5V (or 5.0V). Now very slowly inch the adjuster screw back (count to five between each move of say 1/8th turn) anti-clockwise until you detect the level dropping then stop and allow the meter to settle, probably at 0.2V again. You should then be able to put a further quarter turn clockwise on the adjuster without the output level changing. You have adjusted the filter to its most selective just below the point where it bursts into self-oscillation. Issue 1 2010 January 15 © UKRAA 7. Remove the power plug and the short across the aerial pins and connect a signal generator set to the desired frequency (UKRAA can supply a suitable unit). Re- connect the power to the receiver and the generator and apply a signal of a few milliVolts amplitude to the receiver (use the low level output on the UKRAA signal generator). The output level should read around 0.2V at this stage (if not, repeat step 6 above). 8. It may be useful to select a more sensitive range on the meter measuring the output level, say the 2 Volt range. Remember that the receiver has a very long time constant (5 seconds or more) so that the output changes slowly with signal changes, or a change in the tuning. 9. Now turn the coarse frequency control VR3 clockwise about a quarter turn at a time and give a few seconds between each adjustment. After a few turns you will see the output level increase significantly (several tens of mV). Allow the meter to settle, then slowly continue adjusting the control to achieve the highest reading. If however the output level reading goes to over about 1.7V, reduce the RF gain by turning VR1 anticlockwise until a reading of around 1.0V is obtained, then continue adjusting VR3 for the highest output level reading. 10. When you cannot achieve any better output, return to adjusting VR2 (Q) very slowly clockwise, watching as the output level rises. Reduce the RF gain VR1 again if the reading creeps over 1.7V. At some point the output level will rise rapidly to 2.5V. Back off the Q adjustment slowly 1/8th turn at a time until the output level just begins to drop. Stop there and wait for the output level to stabilise. You may be able to re-set another clockwise 1/8th turn or even quarter turn without the filter oscillating. 11. You now have a high selectivity and sensitivity at the required frequency, but there is some interaction between the controls and some hysteresis on the Q control. You now need to adjust the frequency to get right on the peak of the filter and you should use the Fine frequency control VR4 to give the highest output level reading. At this stage remove the signal generator connection and check that the output level drops to 0.2V again. If the level does not drop with the signal generator removed the Q setting is adjusted too high and the filter is oscillating. Turn the Q control VR2 about 1/8 turn anti-clockwise waiting several seconds between each adjustment. 12. You will soon become adept at slowly walking the receiver sensitivity and selectivity up to a maximum, by repeating the above adjustments in turn. 13. You must now check for the reliability of the setting, to ensure the receiver does not burst into oscillation with changes in room temperature or when you switch it on. We cannot do a temperature test very easily but when you start to use it you will become aware of traces that saturate your “recorder” at 2.5V. You can however set the RF gain for a reading of about 1.0V output level with the signal generator applied and then remove the power from the receiver and reconnect it. If the receiver is stable you should see it settle back each time to about the same output level. Issue 1 2010 January 16 © UKRAA 14. Tuning is now complete and you should be able to measure your selected signal now when you connect a tuned aerial or 10metres or more of wire aerial. You may find you wish to carefully readjust the fine frequency control on the live signal to get best protection against other nearby signals, because the signal generator may not be quite on the same frequency as the transmitted signal. This adjustment is not essential and the receiver as set up by the above instructions will produce a good record. 15. There are some adjustments you may need to make when using the receiver which are dependent on you distance from the target transmitter. These are covered in a later section. The RF gain (VR1) and DC gain (x1, x10 jumpers) and fine tuning (VR4) should be left until the aerial has been tuned and should be used to set a Solar-quiet level of about 1 Volt or possibly slightly less if using the 2.5 Volt output. The fine tune should be used to peak the signal from (e.g.) Ramsloh coming in on the aerial when it has been correctly identified (e.g. by the breakfast "maintenance break"). The maximum signal in event of a flare will be of similar strength to the peak signal received after dark - flares cannot be detected after dark of course. Monitoring over a period of days should allow any final adjustments to be made. Beware that signals may go off for periods of time, and may indeed not be present when initial tuning is attempted! Try different times of day / night if the signal cannot be found first time. If subsequent attempts to find a signal fail, then try for an alternative signal. Tuning the Aerial The aerial is tuned with an audio signal generator. Connect a signal generator (such as the the UKRAA signal generator ) through a 100k resistor to the aerial, and set it to the required frequency. Alternatively, if a tuned VLF Receiver is available, it will be found that sufficient signal level is present to tune the aerial by placing the signal generator on the base plate of the aerial. Monitor the voltage across the aerial with an oscilloscope or AC voltmeter (this will need to be quite sensitive), and adjust the tuning capacitor for maximum voltage. If a maximum cannot be found, then add or remove padding capacitance according to which way the tuning capacitor has stopped. Tuning is complete once the maximum is found within the range of the variable capacitor (ideally somewhere near mid-range). The Sheffield VLF monitor at http://togashef.sheffield.ac.uk/%7Esferix/vlf.png displays a useful chart of the real-time VLF spectrum for checking signal availability. Issue 1 2010 January 17 © UKRAA Aerial Characterisation Measurements UKRAA have made some basic measurements on the UKRAA loop aerial, to give an indication of the frequency response. The source used was a Philips synthesised function generator, and the response was measured on a Tektronix 7603 oscilloscope. The generator was connected to one untuned loop to provide the stimulus signal; the "loop-under-test" was tuned with a JJ Lloyd Instrument Capacitance Substitution Box. The source and measured loops were separated by about half a metre. The loops were each resonated over a range of frequencies most like to be of interest for VLF SID detection, and the tuning capacitance required against frequency was plotted. One loop was laced and the other was wound with an adhesive coating on the wire that was activated by heating. (The heating was achieved by passing a current through the loop.) The loops are referred to on the plots as "glued" and "laced". The bandwidth response of the glued loop was then measured by tuning it to 24kHz and measuring the response at 100Hz intervals either side of the resonance. The “glued” coil had 125 turns, the “laced” coil had 128 turns. The results are shown below. Issue 1 2010 January 18 © UKRAA Issue 1 2010 January 19 © UKRAA VLF Receiver Bandwidth at maximum"Q" 2500 Output in mV 2000 1500 1000 500 0 22.6 22.8 23 23.2 23.4 23.6 23.8 24 24.2 Frequency in kHz VLF Receiver Sensitivity at Max RF gain & "Q" 3 Output level in V 2.5 2 1.5 1 0.5 0 0 5 10 15 20 25 30 35 Input level in dBuV Column B Column C Column D Column B – Log Scale, Column C – DC Gain x10, Column D – DC Gain x1 Issue 1 2010 January 20 © UKRAA Dimensional and Electrical Considerations These notes were contributed by Whit Reeve, Alaska. This section gives three methods for calculating the loop inductance, as opposed to direct measurement of an assembled coil. All of the methods are estimates and none perfectly fit the actual aerial construction. Specifically, the coil cross-section on the actual aerial is more or less circular, but the methods assume either a flat, single-layer cross-section or rectangular, multi-layer cross-section. The dimensions are given in units convenient to the original equations. Mechanical Dimensions The UKRAA loop aerial has a square shape with a diagonal length of 0.575 m = 57.5 cm. The loop is made from hardwood and plywood and consists of 137 turns of 24 AWG coated magnet wire. The wire has a coated nominal diameter of approximately 0.0205 in. = 0.521 mm = 0.0521 cm and uncoated nominal diameter of 0.0201 in. = 0.511 mm = 0.0511 cm. The width of a square in terms of its diagonal length is 2 ⋅l 2 W = Eq. (1) where W = square width l = diagonal length The perimeter length of a square is p = 4⋅W Eq. (2) where p = perimeter length Therefore, for the loop in question W= 2 ⋅ 0.575 = 0.4066 m = 40.66 cm 2 p = 4 ⋅ 0.4066 = 1.626 m The enclosed area of a square is A = W 2 = (0.4066)2 = 0.165 m2 Eq. (3) where A = enclosed area of square Issue 1 2010 January 21 © UKRAA Inductance Method 1: Single-layer polygon coil The approximate inductance in µH of a polygon is given by1 L≈ 0.03948 ⋅ a 2 ⋅ n 2 ⋅K b Eq. (4) where a = Average of inscribed and circumscribed radii, π r ⋅ cos 2 (cm) 2⋅ N Eq. (5) r = radius of circumscribed circle (cm) N = number of sides (4 for a square) n = number of turns b = length of coil, or d = distance between turn centres = wire diameter for close spacing (cm) K = function of n ⋅ d (cm) 2 ⋅ a / b from Table 10, page 283 of the reference NBS document The radius of a circumscribed circle for a square is r = W l = = 0.2875 m = 28.75 cm 2 2 Eq. (6) and the average of the inscribed and circumscribed radii is π a = 28.75 ⋅ cos 2 = 24.54 cm 2⋅ 4 The estimated coil length is b = 7.9 mm = 0.79 cm. K is based on 2 ⋅ a / b = 2 ⋅ 24.5 / 0.79 = 62 and is found in the reference by interpolation, or K = 0.05158. Substituting the above values, the calculated inductance is L≈ 1 0.03948 ⋅ 24.52 ⋅ 137 2 ⋅ 0.05158 = 29,135 µH = 29.1 mH 0.79 Eq. 153, pg 252, Circular C74, Radio Instruments and Measurements, US Department of Commerce, National Bureau of Standards, 1937 Issue 1 2010 January 22 © UKRAA Inductance Method 2: Multi-layer polygon coil with rectangular cross-section The approximate inductance in µH of a square coil with rectangular cross-section is given by2 L = 0.01257 ⋅ a ⋅ n 2 2.303 ⋅ b2 c2 b2 8⋅ a 1 + + log − y + ⋅ y2 1 2 2 2 32 ⋅ a 96 ⋅ a 16 ⋅ a d Eq. (7) where a = Average of inscribed and circumscribed radii, π r ⋅ cos 2 (cm) 2⋅ N b = axial dimension of the coil cross-section (cm) c = radial dimension of the coil cross-section (cm) d = diagonal of the cross-section (cm) n = number of turns y1 = value from Table 14, pg 285 of reference based on b/c y2 = value from Table 14, pg 285 of reference based on c/b The following values apply: a = 24.54 cm b = 0.79 cm c = 0.79 cm d = 0.79 cm n = 137 b/c =1 c/b =1 y1 = 0.8483 y2 = 0.816 Substituting the above values, the calculated inductance is 0.79 2 0.79 2 8 ⋅ 24.54 ⋅ log L = 0.01257 ⋅ 24.54 ⋅ 137 2 2.303 ⋅ 1 + + − 2 2 32 ⋅ 24.54 96 ⋅ 24.54 0.79 0.8483 + 2 0.79 2 ⋅ 0.816 = 27,029 µH = 27.0 mH 2 16 ⋅ 24.54 Eq. 157, pg 257, Circular C74, Radio Instruments and Measurements, US Department of Commerce, National Bureau of Standards, 1937 Issue 1 2010 January 23 © UKRAA Inductance Method 3: Single-layer square coil The approximate inductance in µH of a square coil with rectangular cross-section is given by3 b a L = 0.008 ⋅ a ⋅ n 2 2.303 ⋅ log + 0.2231 ⋅ + 0.726 − 0.008 ⋅ a ⋅ n ⋅ [ A + B ] a b Eq. (8) where a = width of square measured between centres of the cross-section (cm) b = length of coil (cm) n = number of turns A = 0.557 (Table 11, page 284 of reference) B = 0.330 (Table 12, page 284 of reference) The coil width is a = W = 40.66 cm, coil length is turns n = 137. b = 7.9 mm = 0.79 cm and the number of Note: For calculation purposes, the estimated winding pitch, D = d (that is, wire diameter). Therefore, D/d = 1 and from Table 11, A = 0.557. Also, the correction factor, B, is based on the actual number of turns and from Table 11, B = 0.0330 by interpolation. Substituting the above values, the calculated inductance is 0.79 40.66 L = 0.008 ⋅ 40.66 ⋅ 137 2 2.303 ⋅ log + 0.726 + 0.2231⋅ 40.66 0.79 − 0.008 ⋅ 40.66 ⋅ 137 ⋅ [ 0.557 + 0.330] = 28.484 µH = 28.5 mH 3 Eq. 165, pg 264, Circular C74, Radio Instruments and Measurements, US Department of Commerce, National Bureau of Standards, 1937 Issue 1 2010 January 24 © UKRAA Measurements Note: Number of turns, n = 137 Measured inductance: 27.0 mH ( by two different instruments) Measured self-resonance frequency: 52.21 kHz Measured dc resistance: 19.17 ohms at 21 °C Calculated distributed capacitance, Cd , based on self-resonance: 344 pF Resonant frequency with external capacitance of 2.03 nF (C1): 19,978 kHz (f1) Calculated total capacitance at f1: 2.35 nF Calculated distributed capacitance based on C1 and f1: 320 pF Resonant frequency with external capacitance of 2.13 nF (C2): 19,554 kHz (f2) Calculated total capacitance at f2: 2.45 nF Calculated distributed capacitance based on C2 and f2: 324 pF Resonant frequency with external capacitance of 3.01 nF (C3): 16,812 kHz (f3) Calculated total capacitance at f3: 3.319 nF Calculated distributed capacitance based on C3 and f3: 309 pF Frequency range with Aerial Tuning Unit (assuming zero length transmission line and Cd = 320 pF): At Cmin = 30 pF (+Cd): 51.8 kHz At Cmax = 3,665 pF (+Cd): 15.9 kHz Troubleshooting and Radio Interference • It is important to make sure that your Receiver has a good quality, stable power supply of the correct voltage. • Check that the power supply pin size is 2.5mm, since 2.1mm pins may appear to fit, but will not be reliable. • Take care with the tuning process; it may require several iterations before the tuning is at the optimum setting. • The most likely cause of problems after successful tuning is interference from domestic electrical equipment. Position the aerial and the receiver well away from electrical devices, particularly those with electric motors or switched-mode power supplies. Fluorescent lighting may also be a problem. Issue 1 2010 January 25 © UKRAA Interference The military communications stations that are used for our SID detection are spaced in frequency at various intervals but generally around 500Hz to 1000Hz apart. There are few if any potentially interfering stations in located in any particular area because these stations are designed for a very wide service area. However, because of the relatively narrow spacing it is essential that the receiver be tuned with the highest possible stable "Q". (Technically this is the ratio of the centre frequency to the bandwidth.) If the receiver is tuned properly there should in theory be no reason why the signal from Ramsolh (or other stations) should not be received. In practice the radio spectrum has become extremely polluted in the last 10 years by badly-designed consumer electronic equipment and inadequate regulation and policing. It is possible if your plots do not follow the smooth lines of the example plots in daytime that you may be dogged by local domestic radio interference. Sources of interference Despite some beliefs to the contrary radio interference cannot be "filtered out" and the best solution is to tackle it at its source. Of course to do this we need to understand the cause and location of the interference. Almost any modern electrical consumer appliance my be responsible and even some older ones. Any unit that is powered by a mains-plug power supply can be a problem. The majority of these used what is referred to as a "switching regulator", which transforms the 50Hz mains frequency to a much higher frequency where it may be efficiently reduced and regulated. The switching operation is often done at 20 to 40khz, yes right in the area we wish to receive radio signals! A unit like this in your house will provide a much bigger signal at your aerial than a transmitter 700 km away, and so will swamp the wanted signal. Some people may already have noticed the effect of some low energy light bulbs (CFLs) on Long-wave BBC Radio 4 reception. Possible sources of domestic interference are • Computers, desktops, or laptops...these may create special problem if part of the logging system. • Mobile-phone battery chargers, or any other battery appliance charger. • Television • Baby alarms • Mains computer networking systems....e.g. Homeplug • ADSL , your broadband system should not be a problem but can be if the splitter and modem are not placed close to the entry point of your telephone cable. • Low-energy lightbulbs (CFL), some are better than others, try a different brand or keep a tungsten filament lamp for testing. How to clean up? Start with possible sources that are close to the aerial, for instance a PC. Use a multimeter, (preferably digital) to monitor the VLF receiver output and switch the PC off. You can then move away from the aerial, and make you self a complete nuisance to the family by switching off every piece of domestic equipment and check to see if the signal changes. This of course assumes that the interference is at a much higher level than the wanted signal. Issue 1 2010 January 26 © UKRAA You can check that you have the right item by using the loop aerial as a radio direction finder. The signal received by a loop will always be a maximum when it is located along the plane of the loop and a minimum when located on the axis of the loop. You may need to move the the location of loop to get a "triangulation" on the source and locate it more definitely. The initial intentions is to remove major sources of interference from the vicinity of the aerial. If the culprit is, say, a phone charger, you could try plugging it in to a socket in a different room. Sometimes quite small changes in position will make a significant effect. Another approach to tracking interference sources is to use an old-fashioned AM Medium and Long Wave pocket radio. Tune it to a position between stations on the long wave and then move round the house holding it close to anything that be generating interference. You are listening for a significant increase in the noise level. At a pinch a Medium Wave only radio can be used tuned to the very low end of the medium wave band (about 550kHz or 500metres ) Note that an appliance that causes an increase in noise may NOT be affecting your SID receiver if the frequency generated is above the VLF band. When you have found possible sources of problems try to move them as far away from the aerial as possible. You may be able to get a better idea of what could be possible by moving your aerial and receiver down to the bottom of the garden as far away from any houses or power lines as possible. Running your laptop on batteries will help to check out the laptop charger. Since every household has different problems it is impossible to define a way of defeating interference in all cases, but if you have an idea where the culprits are it is easier to control. If you have access to a local Radio Amateur, they may be able to provide useful advice on grounding (or earthing) though their expertise is generally at higher frequencies than we are using. Do try to contact us through the UKRAA Instrument Group on Yahoo and we will try to suggest ways to attack the problem. Computer problems These can be the most frustrating because the PC is often a vital part of the logging equipment. Generally desktop machines are fairly docile because they have metal cases which must be grounded to the mains safety "Earth" on the power plug. Laptops can be a problem because they mostly have no safety earth connected through to the laptop itself. The result of this is that all the interconnecting wiring acts like a big wire aerial conducting not only the computer's radiations but also those from any other source in the area right into the receiver. In this case it may be necessary to make an "RF ground" to the Aerial Tuner unit. The effectiveness of this can often be quickly tested by connecting the outer of the BNC socket to a nearby central heating radiator. Alternatively a yellow ESD protection plug can be modified to provide a safe grounding point. Issue 1 2010 January 27 © UKRAA Classification and Interpretation of Results Flare Classification Flares are classified on a rather curious scale, running A, B, C, M and X. The scale is logarithmic, and is calibrated as follows: Class Energy X 10-4..10-3W/m2 (measured at 0.1..0.8nm wavelength) M 10-5..10-4W/m2 C 10-6..10-5W/m2 B 10-7..10-6W/m2 A 10-8..10-7W/m2 As it is a logarithmic scale, each category can be subdivided into 10, with a resolution of 0.1, leading to a flare being quoted as C5.6 or M1.2. The background level from a ‘quiet’ sun is often within A or B-class, with most flares being of B or C-class. More energetic active regions produce M or X-class flares. At the extreme, a flare can exceed X9.9, and produce X17 or X20 flares. Flares of X-class pose a threat to orbiting satellites, as well as human space travellers. C-class flares are easily detected as sudden ionospheric disturbances, while some larger B-class events can also be recorded. X-class events produce spectacular SIDs, as the ionosphere slowly recovers from the radiation impact. Event Recording When recording SIDs, start, peak and end times are required. ‘Start’ is the time at which the event is first recorded by the Receiver. ‘Peak’ is the time at which the maximum or minimum signal strength is recorded, and ‘End’ is the time at which the signal strength returns to its previous diurnal trend. Start and peak times are easily read in most cases, while the end time often requires a little guesswork to identify. The amplitude of the disturbance usually correlates with the flare class, but will depend on the state of the ionosphere at the time. Since it is an indirect observation of solar activity, the amplitude is not recorded in VLF reports. The length (duration) of the SID recorded does not always correlate with flare class, but can be recorded as the ‘importance’ of the event on the Earth. This has traditionally been recorded as follows: Issue 1 2010 January 28 © UKRAA Duration Importance <18min 1- 19…25min 1 26…32min 1+ 33…45min 2 46...85min 2+ 86…125min 3 >126min 3+ Interpretation of Recordings The shape of recorded flares will vary from one observer to another, but a little experience while the Sun is active will allow most events to be isolated from other interference. The textbook SID has a sharp rise to a definite peak, followed by a longer recovery period. In practise, many SIDs do not look that simple, and may have multiple peaks. SIDs may also appear inverted, with the peak at a lower signal strength followed by a rising recovery period. This variation in shape is due to a combination of the path from Transmitter to Receiver, and the varying state of the ionosphere. The sun often produces multiple flares over a short period, leading to superimposed SIDs that can create confusion. The following illustrations show some typical events: This plot shows the effect of a flare event on the signals from two different transmitters at two different ranges. the red trace follows the standard "textbook" shape, whilst the yellow trace shows the effect of the same flare when the ground-wave and sky-wave are out of phase. the increased strength of the sky-wave during the flare depresses the received signal level. Issue 1 2010 January 29 © UKRAA This is typical of an ordinary SID. Measurement is fairly easy. It is inverted relative to ‘normal’, but it is clearly the correct shape. It would be recorded thus: 2005 March 10th. Start 11:39 Peak 11:42 End 12:42 Importance 2+ This is typical of a much more energetic solar flare, producing a SID that has a double peaked structure. The start and end times can be measured as usual; the peak time should be measured at the maximum point, in this case at 08:37UT. It would be recorded thus: 2005 September 15th. Start 08:33 Peak 08:37 End 10:33 Importance 3 This is much more difficult, as the flare occurred during the sunset dip in signal strength. The result is a combination of the two effects. The start is easily measured, and the peak is also clear (as above). The end time cannot be measured, and would be left blank. It would be recorded thus: 2005 September 7th. Start 17:23 Peak 17:38 End ? Importance – Issue 1 2010 January 30 © UKRAA This recording shows 2 flares in rapid succession, such that the SIDs overlap. An end time for the first event cannot be measured. They would be recorded thus: 2005 September 13th. Start 10:45 Peak 10:55 End ? Importance – 2005 September 13th. Start 11:18 Peak 11:32 End 12:05 Importance 2+ Recorded at 23.4kHz, from the Ramsloh transmitter in North Germany, this graph shows signal strength against time over a 24 hour period. It shows random variation in signal strength at night, followed by a change as the rising sun recreates the D-layer. During the day, signal strength varies with the altitude of the Sun. At sunset, the D-layer recombines and is lost, producing another change in signal strength. A C-class flare at 11:39UT disturbs the D-layer sufficiently to produce a distinctive change in signal strength, recorded as a SID. Note the sudden drop followed by a much slower recovery. SIDs can also show as a sudden increase in signal strength followed by the slow recovery. The transmitter was off-air between 07:10 and 07:50UT (the 'breakfast break'). Issue 1 2010 January 31 © UKRAA This X-class flare recorded at 10:04UT had a more dramatic effect on the D-layer, as well as causing havoc to satellites and short-wave communications. The signal received from any transmitter is a combination of waves that have travelled slightly different paths and thus interfere with each other. Large D-layer disturbances can show this multiple-dip pattern as the interference pattern moves over the receiver. The slow recovery phase lasts for several hours. Note that all times are always recorded in Universal Time (UT = GMT+0), to the nearest minute where possible. Issue 1 2010 January 32 © UKRAA The GOES X Ray Satellites When making observations of solar activity, it is sometimes useful to be able to compare your results with a reference set of observations which are known to be accurate. One very convenient set of data may be found at the NOAA Space Weather Prediction Centre (SWPC). This resource holds observations in many energy (wavelength) bands, and is also a good source of images of the Sun. The Starbase Observatory GOESXrayFluxClient Instrument The Starbase Observatory can connect to the SWPC FTP data library to retrieve observations from the GOES range of X Ray satellites. The library may be found at: ftp://ftp.swpc.noaa.gov/pub/lists/xray. A sample daily plot is given below, displayed in the Starbase GOESXrayFluxClient instrument. This shows two flux signals, and one ratio graph. The logarithmic scale of this graph corresponds to the flare classification scheme described elsewhere in this manual, and so the graph is a good way of comparing professional observations of solar activity (in two energy ranges) with your own SID observations. Over a period of time, it should be possible to calibrate your receiver in terms of the flare classification energy ranges. Sample data from GOES14 X Ray Satellite An interesting set of solar images may be found at http://umbra.nascom.nasa.gov/images. Issue 1 2010 January 33 © UKRAA The Use of Multiple Receivers Many experienced observers recommend the use of multiple receivers, tuned to different frequencies. This is because it is often possible to miss a SID event with a single receiver, since there are so many variables surrounding the location of receiver and transmitter, time of day, interference, weather,and so on. Collaboration with other observers and sharing your results will also improve your chances of seeing an event, even if vicariously. This activity is one of the main motivations behind creating the Starbase network, so that an individual observer can monitor several receivers simultaneously. Orientation of the Loop Aerial The loop aerial responds to the magnetic component of the radio wave, not the electrical component as for example in a Yagi aerial. This means that the optimum orientation of the aerial relative to the transmitter is for the plane of the aerial to be pointing towards the transmitter. In other words, the axis of the loop should be at right-angles to the transmitter direction. The magnetic response of the aerial should of course mean that it is much less sensitive to electrical interference. Using the VLF Receiver This section describes some of the various options available for logging the output of the VLF Receiver: • Starbase UKRAA’s preferred data capture option is to connect the VLF Receiver via a UKRAA Controller to the Starbase Observatory software. • Data Loggers Digital Multimeters (DMM) with computer outputs or other custom recording devices may be used. Starbase can import comma-separated or tab-separated data formats. • Radio-SkyPipe The UKRAA VLF Receiver has the socket and interface to install an optional analogueto-digital converter (ADC) that makes it compatible with software available from Radio-SkyPipe (RSP). Starbase can import RSP files. Configuring Output Voltage Options The VLF Receiver offers a choice of output voltage ranges, to allow the use of different data loggers or volt meters. Starbase data loggers and controllers are standardised on 2.5V, and Radio Sky Pipe requires 5V. The default setting on the board is to provide a 2.5V output. The circuit operation for this facility is described below. I2c is a limiter set to half the supply voltage (2.5V), and so its output cannot exceed 2.5V. The gain of I2d (a non-inverting amplifier) is given by [1 + (R29/R28)]. Therefore if R28 = R29, it has a gain of [1 + 1] = 2, and its output will therefore be 5V maximum. This would be the setting to provide a 0 to 5V output on the 25way connector, e.g. for Radio Sky Pipe. Issue 1 2010 January 34 © UKRAA Setting R29 to 0 (a short circuit) and R29 to infinity (open circuit) gives a gain of [1 + 0] = 1. Its output is then 2.5V, and would be the setting to provide a 2.5V output, e.g. for a Starbase controller. UKRAA Starbase If you have also purchased a UKRAA Controller module, the VLF Receiver can be installed as an instrument in the Starbase Observatory. The Controller is a “stand-alone” microprocessor card with a substantial amount of memory and only requires a low voltage power supply, which could be a battery for remote locations. It is capable of recording and storing data in its on-board memory that is sufficient for many thousands of readings. In addition to supporting data logging, Starbase enables you to compare your observations with those from a wider community. Access to the GOES Xray satellite data is also provided, which can be useful when confirming your flare observations. The Observatory is supplied as Java software, available as a free download from www.ukraa.com. Getting Started In order to use the VLF Receiver with Starbase, first connect the Controller module to the Receiver, using a suitable cable (with 25way to 9way D-type connectors). This cable connects the analogue output and the I2C (“eye squared see”) bus used to control the Receiver. Power is supplied to the Receiver from a mains adaptor, and then the Receiver provides power to the Controller via a cable fitted with 2.5mm sockets at each end. The Controller may then be connected to your computer; the type of connection will depend on the type of controller, but will usually be via an RS232 or RS485 cable. You may require an RS485 to USB adaptor, if your computer does not have an RS485 port. You may wish to use an adaptor with an electrically isolated connection, to protect your computer from electrical interference from the instruments in your observatory. Issue 1 2010 January 35 © UKRAA VLF Receiver used in Starbase mode RS232 or RS485? The serial UKRAA Controller can use both RS232 and RS485 protocols. RS232 is found on many PCs (e.g. Windows COM1), and is designed to work over a relatively short range of a few metres. RS485 on the other hand, is a 'differential' or 'balanced' system, with the ability to work over distances up to 1km, in an electrically noisy installation. The choice between using RS232 or RS485 depends on your local environment and your future plans for your observatory. Using RS232 restricts you to locating the Controller no more than 5 metres away from the computer, and is a single connection: the number of available communication ports on your computer will limit the number of instruments that can be connected and monitored consecutively by Starbase. On the other hand, using a single RS485 port will allow instruments to be located several hundreds of metres away from the Starbase computer and additionally, allow many different instruments to be daisy-chained together on a 'bus'. RS485 is also much more tolerant to environmental ‘noise’ that can cause data loss or corruption. The UKRAA recommends that you adopt RS485 as the interface for your VLF Receiver and Controller. Your Observatory user manual will describe how to set up the data connection, and to test the link with the VLF Controller. You should prove that e.g. the ping() command completes correctly before continuing. Issue 1 2010 January 36 © UKRAA Data Logging The Starbase Observatory VLF Receiver Instrument There are two main modes of operation that will be useful to you: firstly, the Controller may be set up as an off-line data logger. This means that once the logging operation has started, you can turn off the computer, and leave the Controller active for a long time. The recording time may be several days even at the fastest sample rate. The data you have collected are then retrieved the next time you use your computer. The second mode is in ‘real time’, i.e. you can see each data sample as it is taken, and watch the progress of the recording on the Observatory, in much the same way as using a chart recorder. You may then save the data to a file on the computer when your observation is complete. This mode is most useful for testing and setting up, when it is helpful to see the effects of changes in the system. Offline Logging Mode Perform the following steps to capture data in offline logging mode. Please refer to your Starbase user manual if these terms are unfamiliar to you. Core.reset() Ensure the Controller starts in a known state. This is always good practice, for all instruments. DataCapture.getSpace() Ensure 100% of data memory is available. If not, there may be earlier data still to be downloaded. DataCapture.setRate(1) Set the sample rate, here 1 second as an example. DataCapture.capture(true) Start the capture operation. Most commands will now return a CAPTURE_ACTIVE status until capture is stopped. Allow time to pass! The computer does not need to be DataCapture.capture(false) Stop the capture operation. All commands connected again until the next step. may now be executed again. DataCapture.getDataBlockCount() (Optional) Check to see how many data blocks have been recorded. This will help you to estimate how long the download is likely to take. DataCapture.getData(Staribus, PassThrough) Read the data from the Controller into Starbase Observatory. This may take some time on a slow connection when the memory is full. See the later comments Issue 1 2010 January 37 © UKRAA about the choice of Filter (PassThrough used here). Now view the data on the Chart, or the RawData and ProcessedData tabs. Do not turn off the Controller until you are Exporter.exportRawData(filename, timestamp, dataformat) Save the RawData to a specified filename, in sure that the data are saved on the computer. the format of your choice (initially Stardata XML). Exporter.exportChart(filename, timestamp, format, width, height) (Optional) Save the chart as an image, in the format of your choice (e.g. PNG works well). Remember that you cannot reload the data from a chart, only from the RawData file. Take some time to become familiar with the capturing and downloading process, and then experiment with processing and storage options. For instance, the ProcessedData tab shows the effect of filtering the RawData. The optional filter is enabled during the getData() download. The first release of the software includes a SimpleIntegrator, a filter which just averages a number of data samples over a period specified by the configuration property DAO.TimeConstant. In hardware terms, the effect is the same as applying an RC low pass filter to the voltage output. You may export the ProcessedData independently of the RawData. The chart shows the ProcessedData, so if you do not want to filter your data, remember to set the filter parameter to PassThrough. Realtime Logging Mode This mode is run with a single command, as below. Core.reset() DataCapture.captureRealtime(sampleinterval, captureperiod, filter, update, logging) All logging parameters are entered View the samples on the Chart or the data tabs, as they are accumulated. In order to save memory, the data in the single command. are ‘decimated’ when there are too many to fit precisely on the graph. This does not affect the underlying RawData, it is purely to improve display efficiency. Exporter.exportRawData(filename, timestamp, format) Export your data to a file on your computer. Allow the capture to run to completion after the specified captureperiod, or use Abort. The remarks under capture() concerning RawData and ProcessedData also apply to captureRealtime(). Issue 1 2010 January 38 © UKRAA Please note: if you use the captureRealtime() command for long periods at high sample rates, the number of data samples may mean high demands on the memory allocated to the Observatory. This will be indicated by an increase in the Memory Usage indicator, at the right hand end of the status bar. Eventually you may find that performance suffers, and the computer becomes progressively more unresponsive. If this happens, save your data (with export()) and close down Starbase. captureRealtime() is not intended as a substitute for offline logging! Advanced Topics It is possible to read the physical temperature of the Controller and VLF Receiver modules, using the Utilities.getTemperature() and VlfPlugin.getTemperature() commands. These may be useful if you suspect variations in output due to variations in ambient temperature. If this does occur, it may indicate a hardware fault, or suggest that calibration may be advised. The VLF Temperature channel is included in the logged data for the capture() and captureRealtime() commands. The Temperature channel can be turned off on the Chart display. The configuration of the Controller-Receiver combination is stored in XML files on the computer. (Later releases will hold the XML in ROM devices on the modules themselves.) A certain amount of customisation is possible, and you may like to experiment with this. For instance you could change the name of the Chart legend displayed in Starbase, or even the name of the instrument. Your Starbase User Manual will contain further information on this topic. The VLF Receiver instrument in the Observatory has a RegionalMap tab, which shows the PointsOfInterest (POI) described in the instrument XML file. You may add to the list of POIs, for instance the locations of other observers, or VLF beacon transmitters. You may even change the map itself, by generating new map image from data provided by NOAA at http://rimmer.ngdc.noaa.gov. Note that the map is slightly unusual in that it is a linear projection of Longitude and Latitude, so that the location of the cursor is more easily calculated. The area represented by the map is described in the Frameworks.xml file. The map may be saved as an image using the Exporter commands. Data Loggers The output from the VLF Receiver is a varying voltage that is proportional to the strength of the signals received from the target transmitter. A continuous record of this voltage is required to indicate the presence of a Sudden Ionospheric Disturbance (SID) and thus a Solar Flare. In the days before readily available computers the output would have been recorded using a chart recorder (‘strip chart’) that would trace the signal level on a long strip of graduated paper using a pen. These were fun to use but refilling the ink reservoirs could be messy. These instruments can still be found on the vintage test equipment market and are still capable of doing the job. Their disadvantage is that one cannot re-analyse the data without carefully and laboriously reading it off, and it is not easily possible to compare two events or two days recordings in detail. Issue 1 2010 January 39 © UKRAA The development of digital measuring instruments in the 1960s laid the foundation for what became known as data-loggers. These are instruments that autonomously take measurements and record the values digitally, often against some form of time-stamp. The data can then be input to a digital computer for analysis, scaling, smoothing or filtering, display, publication, and finally archive storage. There are several ways of recording the results from the VLF Receiver using data-loggers. For instance, there is a wide range of hand-held Digital Multimeters (DMM) on the market, and some can transfer their measurements to a computer, usually with an RS232 or USB connection. UK examples are from Maplin (Ref: N56FU) and one of the Digitek DMMs from CPC (Ref: IN02513). The multimeter in conjunction with appropriate (usually provided) software may be used as a data-recording device or data-logger. The software included should allow a chart-recorder emulation display or some form of plotting routine, together with a way of storing a batch of readings with vital extra information like date, time and what was being measured (the observation metadata). This can be somewhat limited for longer term study, but you can also import the data into a spreadsheet application such as Excel. Whilst you can use the OpenOffice spreadsheet application for this, it is very slow when dealing with the large amount of data produced from a typical day’s observing. Note that many spreadsheet applications are limited to 64,000 lines, which means that you cannot accommodate sampling at a rate faster than about 1.5 seconds if you want to capture 24 hours of data. In practice this is not a problem since 3 or 5 second sampling intervals are quite adequate for SID monitoring, and the inherent time constant of the VLF Receiver itself is longer than a second. A DMM is a useful general-purpose instrument. As well as measuring the voltage output from the receiver you can use it to check construction of the loop aerial, particularly if you buy one that measures capacitance with a 4nF (4,000pF) lowest range. An ability to measure frequency can also help in setting up the VLF Receiver. Issue 1 2010 January 40 © UKRAA VLF Receiver used in Data Logger mode There are also a number of stand-alone accessories that interface to a computer with software provided to do the same job but not needing the flexibility of a hand held multimeter. One UK vendor of these is Pico Technology of St Neots, in Cambridgeshire. It is not possible for UKRAA to provide any detailed assistance on third party data-loggers or software, but there are many offerings available. There are two output ports on the VLF Receiver one of which gives a 0 to 2.5 Volt range and the other a 0 to 5 Volt range: this should suit a wide range of generally available data-loggers. Radio Sky Pipe Radio-SkyPipe is a widely-used successor to the old ‘stripchart’ recorders. Full details of this free software application can be found at: http://www.radiosky.com/skypipeishere.html The VLF Receiver printed circuit board includes a socket for an Analogue to Digital Converter (ADC) chip for use with Radio-SkyPipe. The chip used is the dual in-line DIL version (NOT the surface-mount version!) of the Maxim MAX 186. This is available as an option for the basic kit; it is not supplied as standard as it is an expensive device and many users will want to use the UKRAA Starbase application with an associated Controller, which includes the ADC functionality. Please note that your computer must have a standard 25-way parallel (printer) socket to use an internal MAX 186 ADC. Issue 1 2010 January 41 © UKRAA Installing a MAX 186 chip in the VLF Receiver • Disconnect the low voltage power lead and all other external leads from the VLF Receiver. • Unscrew the end panels from the VLF Receiver, carefully, and remove the printed circuit board. • Taking appropriate antistatic precautions, place the MAX 186 chip above the 20-pin IC socket marked IC5, being very careful to locate it the right way around. The mark against Pin 1 of the chip should be facing towards the centre line of the circuit board. Also take care that all the chip pins are correctly aligned with the socket holes. You may find that the two rows of pins on the chip are splayed slightly too wide apart. Gently bending one row of the chip pins will help here, but be careful not to stress the point at which the pin enters the chip packaging, and be sure to wear an earthed anti-static wristband when doing it. Once you are sure that all the pins are aligned, push the chip home into the socket. This can take quite a bit of pressure. • Place the board back in the enclosure and reconnect the power and other leads. You should not need to readjust any of the receiver settings. Connecting to Radio-SkyPipe Use the instructions on the Radio-SkyPipe website to install the latest version on your computer. Please see the Radio-SkyPipe Support desk at http://www.radiosky.com/support.html for all queries related to the installation and operation of this application. You will need to configure the RSP application to work with the VLF Receiver. The most important step is to select the OPTIONS tab at the top of the main screen and set Data Source CH1 to be MAX186 ADC CH1. The Stripchart settings can then be set to average ten readings taken every 0.2 seconds (giving a time constant of 2 seconds), to help average out any noise. A default Chart Width of 86,400 seconds will plot a full day’s data on the screen. If you then use the Logging tab to restart charting at midnight, Radio-SkyPipe will create daily files that you can archive and review at leisure. Issue 1 2010 January 42 © UKRAA VLF Receiver used in Radio SkyPipe mode Use a standard 25-way printer cable to connect from the VLF Receiver to your computer and ensure that the VLF Receiver is switched on. Clicking on the ‘Start Chart’ button will then set things running, though with the above settings it may take a minute or so before the trace becomes visible on the chart. UKRAA Starbase is able to read Radio Sky-Pipe data files, and convert them to other formats. The simplest instrument to use for this purpose is called GenericInstrument. Issue 1 2010 January 43 © UKRAA Dual-frequency Monitoring It is possible to use a single MAX 186 chip to monitor the output of two VLF Receivers, monitoring two different frequencies. This makes it much easier to distinguish SID events from other changes, say due to variations in transmitter power. However, to do this you will need to upgrade your Radio-SkyPipe application to the professional version. See the RadioSkyPipe website for details. On the VLF Receiver with the MAX 186 fitted, remove the board from the enclosure and, again taking appropriate anti-static precautions, release the connector carrying the leads from the Red and Black 6mm (‘banana’) connectors from its normal position at P7 and transfer it to P9. The banana connectors now become an input to the second channel of the MAX 186 chip. Simply wire the output of the second VLF Receiver to these (Red to Red, Black to Black) and select the second channel on the Radio-SkyPipe Data Source menu to MAX186 ADC CH2. Two-Channel Mode for Radio SkyPipe Issue 1 2010 January 44 © UKRAA Glossary ADC Analogue to Digital Converter ATU Aerial Tuning Unit BAA British Astronomical Association BNC Bayonet Neil Concelman (connector) CDROM Compact Disc Read Only Memory EEPROM Electrically Erasable Read Only Memory GMT Greenwich Mean Time GOES Geostationary Operational Environmental Satellite I2C Inter IC Control Bus (also IIC bus) ITU International Telecommunications Union LW Long Wave MW Medium Wave NATO North Atlantic Treaty Organisation NOAA National Oceanic and Atmospheric Administration POI Point Of Interest RAG Radio Astronomy Group RF Radio Frequency RoHS Restriction of Hazardous Substances RS232 Electronics Industry Association Communications Protocol Standard RS485 Electronics Industry Association Communications Protocol Standard, differential transmission RSGB Radio Society of Great Britain RSP Radio Sky Pipe SID Sudden Ionospheric Disturbance SW Short Wave UKRAA The UK Radio Astronomy Association URL Uniform Resource Locator USB Universal Serial Bus UT Universal Time UV Ultra Violet VLF Very Low Frequency W/m 2 Watts per square metre WEEE Waste Electrical and Electronic Equipment XML Extensible Markup Language Issue 1 2010 January 45 © UKRAA References Internet URLs www.ukraa.com UKRAA www.britastro.org/radio BAA Radio Astronomy Group www.starbase.org.uk Starbase information www.czd.org.uk/astro/radioastro/sid/index.html Martyn Kinder’s BAA SID VLF Receiver www.sec.noaa.gov/today.html GOES satellite data & space weather togashef.sheffield.ac.uk/%7Esferix/vlf.png Sheffield VLF Monitor www.iaragroup.org/sole/index.htm Italian VLF group sidstation.lionelloudet.homedns.org SID Monitoring Station A118 www.ptb.de/en/org/4/44/442/dcf77_weite_e.htm DCF77 Transmitter www.i2c-bus.org I2C Bus www.rs485.com/rs485spec.html RS485 Specification www.aavso.org/observing/programs/solar/sid.shtml American Association of Variable Star Observers (SIDs) www.radiosky.com Radio Sky Publishing Books Radio Nature by Renato Romero ISBN 9781-9050-8638-2 Published 2008 220 pages 240 x 175 mm Radio Astronomy Projects by William Lonc ISBN 1-889076-03-1 Published 2003 254 pages 236 x 152 mm Issue 1 2010 January 46 © UKRAA Amateur Radio Astronomy by John Fielding ISBN 1-905086-16-4 Published 2006 312 pages 240 x 175 mm Observing the Sun by Peter Taylor ISBN-10: 0521401100 or ISBN-13: 9780521401104 Published November 1991 173 pages 279 x 215 mm BAA Radio Astronomy Group Baseline Volume 1, Numbers 1 to 4 Download from www.britastro.org/radio UKRAA Very Low Frequency Receiver User Manual Download from www.ukraa.com Issue 1 2010 January 47 © UKRAA Contacts The UK Radio Astronomy Association Springfield Rookery Hill Ashtead Park Ashtead Surrey KT21 1HY Limited by Guarantee Reg. No. 6481611 Registered UK Charity No. 1123866 E-mail: [email protected] Website: www.ukraa.com Fax: 0870 132 3728 Telephone: 01372 279066 Starbase Information Website: www.starbase.org BAA Radio Astronomy Group Website: www.britastro.org/radio Issue 1 2010 January 48 © UKRAA Appendix 1 – VLF Receiver Specifications Tuning Range 12kHz...35kHz Output Voltage Options 0...5V or 0...2.5V Time Constant (hardware) 1 second Gain Settings x1 and x10 Control Interface I2C Bus Temperature Sensor Range -40C to +150C Temperature Sensor Resolution 11 to 14 bit (11 bit in Starbase mode) Optional Analogue to Digital MAX186 12 bit Power Supply 15v DC at 35mA Appendix 2 – VLF Transmitting Stations Below is a list of frequencies currently being used by SID observers. It is not a complete list of available signals, but may prove useful in initial tuning of the Receiver and testing of a complete VLF system. Refer to http://sidstation.lionelloudet.homedns.org/stations-list-en.xhtml. 18.3kHz French Navy Rosnay, France 001° 14' 42.89" E 46° 42' 47.26" N 19.6kHz Royal Navy, Anthorn UK 003° 16' 42.44" W 54° 54' 41.91" N 20.27kHz NATO / Italian Navy, Isola di Tavolara, Italy 009° 43' 51.64" E 40° 55' 23.26" N 20.9kHz French Navy St. Assise, France 002° 34' 45.94" E 48° 32' 40.68" N 22.1kHz Royal Navy Skelton, UK 002° 52' 58.92" W 54° 43' 54.48" N 22.6kHz Rosnay, French Navy, France 001° 14' 42.89" E 46° 42' 47.26" N 23.4kHz NATO / Bundesmarine Burlage Germany (Ramsloh) 007° 36' 54.00" E 53° 04' 41.77" N Note that not all transmitters are active all of the time. Some take breaks during the day, while others may be off for periods of weeks or months at a time. If one signal cannot be found, then try for another, or try again at a different time. Also remember that the strength of the signal will depend on the time of day as well as ionospheric conditions. Other frequencies may also be in use from time to time. The UK beacons are supplied as pre-defined PointsOfInterest on the VLF Receiver RegionalMap in the Observatory. Issue 1 2010 January 49 © UKRAA Appendix 3 – VLF Receiver PCB Layout VLF Receiver Component Overlay Issue 1 2010 January 50 © UKRAA Appendix 4 – VLF Receiver Circuit Diagram Issue 1 2010 January 51 © UKRAA Appendix 5 – I2C Address Map The VLF Receiver stores its configuration data in a serial EEPROM accessed via the I2C bus. The temperature of the circuit board is monitored with a temperature sensor device, also connected via I2C. All types of I2C device have restricted bus address ranges, depending on their specific function, which are allocated during manufacture. The temperature sensor and memory devices on the VLF Receiver can respond only to the I2C bus addresses shown in the table below. The addresses marked as Starbase are the default settings, to allow the VLF Receiver to be used with the Starbase Observatory software. Developers of custom software may use any of these addresses, which are selectable by the two jumper fields P6 and P13. Address (binary) Address (Hex) Function 1001 1000 98 Starbase: Write to LM73 Temperature Sensor Pointer Register 1001 1001 99 Starbase: Read from LM73 Temperature Sensor Pointer Register 1001 1010 9A Write to LM73 Temperature Sensor Pointer Register 1001 1011 9B Read from LM73 Temperature Sensor Pointer Register 1001 1100 9C Write to LM73 Temperature Sensor Pointer Register 1001 1101 9D Read from LM73 Temperature Sensor Pointer Register 1010 0000 A0 Write to EEPROM 1010 0001 A1 Read from EEPROM 1010 0010 A2 Starbase: Write to EEPROM 1010 0011 A3 Starbase: Read from EEPROM 1010 0100 A4 Write to EEPROM 1010 0101 A5 Read from EEPROM 1010 0110 A6 Write to EEPROM 1010 0111 A7 Read from EEPROM 1010 1000 A8 Write to EEPROM 1010 1001 A9 Read from EEPROM 1010 1010 AA Write to EEPROM 1010 1011 AB Read from EEPROM 1010 1100 AC Write to EEPROM 1010 1101 AD Read from EEPROM 1010 1110 AE Write to EEPROM 1010 1111 AF Read from EEPROM Setting the Bus Address of the Temperature Sensor For compatibility with Starbase, when using the VLF Receiver as the Primary Instrument Plugin, link P13 must be left disconnected (giving addresses 98 and 99). Future developments should allow up to three receivers to be connected to the same bus, retaining the facility for separate temperature measurements for each unit by individually setting the sensor addresses. Issue 1 2010 January 52 © UKRAA Setting the Bus Address of the Configuration Memory The set of three links on P6 set the base address bits for the Configuration Memory EEPROM. For compatibility with Starbase, when using the VLF Receiver as the Primary Instrument Plugin, the links must be set to give address 001 (binary), i.e. examining the circuit diagram, the IC3 address pins A2, A1, A0 should be <link> <link> <open>, as shown in the diagram below. (Address 000 is reserved for the Controller EEPROM.) This gives bus addresses of A2, A3 Hex. Mapping IC3 addresses to I2C addresses using P6, for use as Primary Instrument Plugin Appendix 6 – Jumper Settings and Pinouts Jumpers Component Labelled Function - DC GAIN Sets Receiver gain to x1 or x10, as required X1 x10 P5 ENABLE PROTECT Set to ENABLE when programming the P6 - Sets Receiver EEPROM (IC3) base address EEPROM, otherwise set to PROTECT (000 to 111 binary). Set to 001 for Starbase compatibility. P11 IN OUT Selects whether P10 provides an Output signal (2.5V), or accepts an Input signal (5V) to Channel 1 of the MAX186 Analogue to digital Converter IC5. Used for dual-frequency operation. P13 Selects the I2C bus address for the LM73 Temperature Sensor (default is no connection, for addresses 98, 98 Hex). Issue 1 2010 January 53 © UKRAA Headers Component Labelled Function P1 Aerial Connects to aerial input socket on case. P7 Out Gnd 0 to 5V analogue output – connects to terminal 'banana' posts on the case. P9 - Provides a direct input to Channel 1 of the MAX186 Analogue to digital Converter IC5 (0 to 5V). Do not use if P11 is set to IN. P10 Analogue 0 to 2.5V analogue output – Starbase Controller compatible. DB25 Socket Pin Function Pin Function 1 Not used 14 CS 2 Clock 15 Data 3 Not used 16 Not used 4 0 to 2.5V analogue signal 17 Not used 5 SCL 18 Not used 6 Not used 19 0 to 2.5V analogue signal 7 Not used 20 Ground 8 Not used 21 SCL 9 Not used 22 SDA 10 Not used 23 Ground 11 Not used 24 Ground 12 Not used 25 Ground 13 Not used Issue 1 2010 January 54 © UKRAA Receiver to Starbase Controller Cable A standard 25 way to 9 way serial cable may be used to connect the VLF Receiver to a Starbase controller's I2C port. Note that the I2C port also provides a 5V output, which may be used to power low-current devices. The cable connections are given below for convenience. Receiver Controller Function 25way Pin 9 way Pin 20 4,5 5 8 SCL I2C clock signal 22 9 SDA I2C data signal 4 7 Receiver 2.5V output to Controller A2D input n/a 1 +5V Power Supply Output from Controller Issue 1 2010 January Ground 55 © UKRAA Appendix 7 – Regulatory Compliance RoHS The Directive on the restriction of the use of certain hazardous substances in electrical and electronic equipment 2002/95/EC, (commonly referred to as the Restriction of Hazardous Substances Directive or RoHS) was adopted in February 2003 by the European Union. The RoHS directive took effect on 2006 July 1, and is required to be enforced and become law in each member state. This directive restricts the use of six hazardous materials in the manufacture of various types of electronic and electrical equipment. In speech, RoHS is often spelled out, or pronounced “rosh”. The above paragraph was taken from the Wikipedia essay on RoHS. The RoHS Directive restricts the use of the following six hazardous substances in electronic and electrical equipment products falling within the Directive: • Lead • Mercury • Cadmium • Hexavalent chromium • Polybrominated biphenyls • Polybrominated diphenyl ethers UKRAA confirms that the suppliers of the components and materials used in the UKRAA VLF Receiver have stated that such components and materials are RoHS compliant and that reasonable steps have been taken to confirm these statements. WEEE RoHS is closely linked with the Waste Electrical and Electronic Equipment Directive (WEEE) 2002/96/EC that sets collection, recycling and recovery targets for electrical goods and is part of a legislative initiative to solve the problem of huge amounts of toxic e-waste. The Waste Electrical and Electronic Equipment (WEEE) Directive is designed to ensure the efficient collection and recycling of electrical and electronic equipment at end-of-life. If a customer purchases a new product from UKRAA which falls within the WEEE Directive to replace an existing one (of similar function to the one that has been sold) and intends to dispose of the existing one, then the customer can request that we take back the existing product and deal with the costs and logistics of recycling it. Any customer wishing to take advantage of this facility should contact us. Provided that the existing product comes within the scope of the WEEE Directive, we will make arrangements for its return or collection and will deal with its disposal. Issue 1 2010 January 56 © UKRAA Revision History Revision Date Author Status Draft E 2009-08-03 L M Newell Internal draft for peer review Draft F 2009-08-22 L M Newell Implemented reviewer's comments Issue 1 2010-01-12 L M Newell Incorporated reviewer's comments Outstanding Work None, document is at Issue status Limited by Guarantee Reg. No. 6481611 Registered UK Charity No. 1123866 Issue 1 2010 January 57 © UKRAA