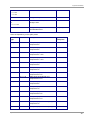
1
SPECTRA 7 Software for acquisition and evaluation of XRF spectra User Manual Bruker Nano GmbH Schwarzschildstrasse 12 D-12489 Berlin Telephone Fax E-mail Internet +49 (0) 30 67 09 90-0 +49 (0) 30 67 09 90-30 [email protected] www.bruker-nano.com Document: Version: Valid: DOC-M81-DXX002 V5 editorial deadline 03.11.2010 (Version 7.2) for ARTAX, S2 PICOFOX and D2 CRYSO © 2010 Bruker Nano GmbH These operating instructions not subject to revision control. Distribution and duplication of these operating instructions and all associated documents, as well as the use and communication of its contents is forbidden unless expressly granted in writing by Bruker Nano GmbH. Compensation for damages is binding for noncompliance. All rights reserved for registration of patent, utility patent and design. Contents Contents 1 Introduction ................................................................................................................................................5 2 Installation ..................................................................................................................................................5 3 Program Start .............................................................................................................................................6 4 User Interface .............................................................................................................................................7 4.1 Window Structure .............................................................................................................................. 7 4.2 Tool Bar and Status Bar.................................................................................................................... 8 4.2.1 Menu Structure...................................................................................................................................8 4.2.2 Tool Bar............................................................................................................................................14 4.2.3 Status Bar.........................................................................................................................................16 4.3 Working with Projects...................................................................................................................... 17 4.4 Spectrum Window ........................................................................................................................... 18 4.5 Changing Spectra Parameters........................................................................................................ 22 4.6 Display Properties ........................................................................................................................... 23 4.7 Export .............................................................................................................................................. 24 4.8 Image Parameters........................................................................................................................... 25 4.9 Crosshair Properties........................................................................................................................ 25 4.10 Crosshair Position ........................................................................................................................... 25 5 Measurements with Spectra ...................................................................................................................26 5.1 5.2 5.3 5.4 5.5 5.6 5.7 5.8 5.9 5.10 5.11 5.12 5.13 6 Spectra Processing .................................................................................................................................38 6.1 6.2 6.3 6.4 6.5 7 Start ................................................................................................................................................. 26 Carrying Out Measurements ........................................................................................................... 26 X-ray Generator............................................................................................................................... 27 Stand-by Parameters ...................................................................................................................... 28 Working with Methods ..................................................................................................................... 28 Measurements with ARTAX............................................................................................................ 31 Measurement of a job (S2 PICOFOX) ............................................................................................ 33 Repeating Measurements ............................................................................................................... 35 Sample Changer ............................................................................................................................. 35 Motor Control................................................................................................................................... 36 Calibration of the Channel-to-Energy Correlation ........................................................................... 36 Calibration of the Full Width Half Maximum .................................................................................... 37 Gain Correction ............................................................................................................................... 38 Addition and Subtraction of Spectra................................................................................................ 38 Scaling a Spectrum ......................................................................................................................... 39 Spectrum Comparison..................................................................................................................... 39 Determination of Line Parameters .................................................................................................. 40 Phases ............................................................................................................................................ 41 Qualitative and Quantitative Analysis....................................................................................................41 7.1 7.2 7.3 7.4 7.5 7.6 7.7 7.8 Spectra 7 Qualitative Analysis ......................................................................................................................... 41 Deconvolution.................................................................................................................................. 42 Spectral Profiles .............................................................................................................................. 43 Calibration Factors for Quantitative Element Analysis (DCCR) ...................................................... 44 Calibration Factors for Quantitative Element Analysis (TXRF) ....................................................... 46 Element sensitivity........................................................................................................................... 47 Job spectra revaluation ................................................................................................................... 48 Standard samples ........................................................................................................................... 48 3 Contents 7.9 Statistics of TXRF Results............................................................................................................... 49 7.10 TXRF Results Report ...................................................................................................................... 50 7.11 Concentration Calculator ................................................................................................................. 52 8 Crystal Orientation .................................................................................................................................. 52 8.1 8.2 8.3 8.4 8.5 8.6 8.7 8.8 8.9 4 Sample Types.................................................................................................................................. 52 Extinction Rules............................................................................................................................... 56 Position Rules.................................................................................................................................. 58 Calculation of the Main Orientation ................................................................................................. 60 Calculation of the Flat Orientation ................................................................................................... 62 Mapping Results.............................................................................................................................. 63 D2 CRYSO Results Report ............................................................................................................. 64 Results Database ............................................................................................................................ 65 Identification of Lattice Planes and Calculation of the Target Orientation ...................................... 68 User Manual Introduction 1 Introduction A universal program for data acquisition and evaluation has been developed for the instruments ARTAX, D2 CRYSO, and S2 PICOFOX. This software is adapted to the different spectrometers via a configuration data file (ext. “dev”). The corresponding descriptive name for the different instruments is ARTAX, CRYSO CONTROL and PICOFOX. Within this documentation the software package is called Spectra, as long as parts are described that are the same for all systems. The program enables the acquisition of measurement data including control of all system components. Parallel to measurement it is possible to carry out qualitative elemental analysis, data reduction (integral intensity calculation of the different spectral lines through Bayes deconvolution), calculation of concentrations and determination of crystal orientation The program is equipped with a user management. This enables the password protected user access to the software. In this process, the users can achieve different authorizations within Spectra. For more information about this, please refer to the User Management manual. Furthermore, for routine determination of crystal orientation using D2 CRYSO, the program module CRYSO MEASURE is available. The documentation for this program is included in the D2 CRYSO user manual. 2 Installation The required hardware is required to work with Spectra: Computer with Pentium or compatible processor and 1 GHZ clock rate (2 GHZ recommended) 1 GB memory (2 GB recommended) VGA graphic adapter and –monitor, resolution 1024*768 pixel minimum. The optimum screen display for this program is a DPI setting of 96 DPI and 120 DPI. Hard drive Mouse CD-ROM Drive Operating system Windows XP One serial port To install Spectra the installation CD-ROM has to be placed into the CD-ROM drive. The installation procedure will start after double clicking the file xxxSetup.exe, located in the main root directory of the installation CD (xxx stands for ARTAX, CRYSO or PICOFOX). Spectra 7 5 Program Start 3 Program Start The operation of Spectra is carried out according to the common windows standard. Knowledge on how to use windows applications is required to use Spectra. The windows operating system will not be further discussed in this manual. After starting the program, the user must log in with name and password. Accordingly, an empty spectra window will appear. After this the program tries to connect to the spectrometer. In case of failure one of the messages "Error transmission to device" or "Time out" will appear. After confirming the error message by clicking on the “OK”-button “OFFLINE” will be displayed in the right display panel of the status bar. The functionality to display and evaluate measured spectra is then available. Possible reasons for failure of connection can be: 1. The spectrometer is not switched on. 2. The serial connection cable between computer and spectrometer is not plugged in. 3. The hardware of the computer or the spectrometer has a malfunction. In case of errors a new connection attempt must be started by means of the command Device/Connect after repair or adjustment. After the connection is enabled successfully the program is ready for use. To start the program in offline mode the command line parameter /O can be used. The program then does not try to connect to the spectrometer. The filename of the configuration data file can be specified using the command line parameter /H followed by the filename. This allows the user to operate several device configuration with the installed program. Spectra uses the registration database of the operating system intensively. There the position of all windows and dialog boxes and their display parameters are stored. The information can be found within the registration key HKEY_CURRENT_USER/Software/ Bruker-AXS/{Programmname}. “Program name” stands for ARTAX, CRYSO CONTROL, and PICOFOX. If several users are registered within the operating system the individual data is also stored into the registry. It has to be taken into account, that this data is not automatically available after installation of the software or registration of new users. System parameters of the device are stored into a file named “Program name.ini”. Available methods are stored into a file with name “program name.mth”. All these files are located in the directory C:\Dokumente und Einstellungen\All Users\Bruker-AXS\xxx (xxx is either ARTAX, CRYSO or PICOFOX). The program is operated via the menu and the tool bar. The following menus are available: This menu opens and saves spectra files, project files, camera images (ARTAX only) and File files with ROIs and for closes the program. Measurement This menu controls the spectrometer (starts/stops measurements, switches the X-ray generator on/off, opens/shuts shutter), administrates data base of parameters, edits measurement jobs (S2 PICOFOX), administrates sample types and positioning system parameters (D2 CRYSO). Analyze 6 This menu sets up and edits calibration files for quantitative and qualitative element analysis (with display of the spectral element lines), starts the calculation of results via deconvolution, determines spectral line positions and Laue-Peaks for the evaluation of crystal orientation and for determining the incident angle (D2 CRYSO) and compares spectra (S2 PICOFOX). User Manual User Interface Spectrum This menu deletes individual or all spectra, deletes ROI, adds, subtracts, smoothes and scales spectra and displays and changes spectra parameters. Project This menu works with project files Options This menu is responsible for various options concerning the spectrum window and the report. Device This menu is responsible for amplification adjustment, positioning the measuring head (ARTAX) or the turning stage (D2 CRYSO) controlling the sample changer (S2 PICOFOX), calibrating the energy-to-channel ratio, the full width half maximum, for adjusting display parameters of the camera image and to configure the crosshair. Export This menu for exports spectra and results data in text format and also copies it to the Windows clipboard. User This menu is responsible for user login or logout ? This menu displays the help file and shows program version information. 4 User Interface 4.1 Window Structure The size of the main window of the Spectra program can be adjusted. It contains the main menu, the tool bar, the register to activate windows containing differing information, the active windows and the status bar. The following registers are active depending on the type of device and the program situation: Register Content When visible Spectrum Displays spectra, a shortened results table of the Bayes deconvolution and the table with ROIs always visible Parameter Displays the parameters of one individual spectrum after the start of a measurement or after displaying a spectrum in the spectrum window Results Displays the complete table of results of the Bayesdeconvolution and concentration calculation after executing a deconvolution or after displaying a spectrum which contains results Mapping Results Displays mapping results with D2 CRYSO (models with x-y positioning) after loading a project file (D2 CRYSO with xy stage) Match Results Displays the results of the comparison of a spectrum with several other spectra (ARTAX and S2 PICOFOX) after successfully executing Analyze/Match Report Displays a results report, this display depends on the D2 CRYSO and S2 PICOFOX after displaying a spectrum which contains results or after loading a project file (D2 CRYSO) Spectra 7 7 User Interface Project Displays project information. For all types of devices, the user who created the project and a comment on the project file. For ARTAX, the scan information of a mapping is displayed. For D2 CRYSO, the parameters of the sample type and for S2 PICOFOX, the parameters of the measurement job. after loading a project file Job Displays the progress of the processing of a measurement job (S2 PICOFOX) during the measurement of a job (S2 PICOFOX) Picture Displays an image saved in the project file (ARTAX) after an image saved in the project file is displayed (ARTAX) Scan Displays a camera image and parameter entry for the measurement of a line scan, mapping or the measurement of a number of data points ARTAX After starting the program, only the Spectrum register is visible with an empty spectrum window. The measurement parameters can be defined, measurements can be executed and measured data can be analyzed. Before performing an analysis, a project file needs to be loaded. 4.2 Tool Bar and Status Bar 4.2.1 Menu Structure The menu structure described below is only applicable for normal spectra windows (refer to last chapter). The File menu contains the following items: Open Project Opens a project file. A file list box appears where the project file can be selected. The last applied directory is suggested. The file name is copied into the list of the last modified files. During a measurement it is not possible to open projects. The file name is copied into the list of the last modified files. Open Spectrum Opens a spectrum data file. A file list box appears where the spectrum data file can be selected. The last applied directory is suggested. The file name is copied into the list of the last modified files. If the feature Options/Only one Spectrum is deactivated, then more than one data file can be opened at a time. During a measurement it is not possible to open spectrum data files. Open ROI Opens a data file with regions of interest (ROIs). Reopen Displays a list containing the last modified spectra or project files. Click to open file. During a measurement it is not possible to open projects and spectrum data files. The command Clear List deletes all entries of the list. 8 User Manual User Interface Saves an opened project file. A file list box appears where the file name can be selected. Save Project As The last applied directory is suggested. The file name is copied into the list of the last modified files. During a measurement it is not possible to save projects. Save Spectrum As Saves a spectrum. A file list box appears where the file name can be selected. The last applied directory is suggested. In the spectrum list box (Tool bar) the text string Measured_x, Add_x or Sub_x is replaced by the file name of the spectrum to be stored. This file name is also copied to the list of last modified files. During a measurement it is not possible to save spectra. Save ROI As Saves regions of interest of a spectrum to a file. Save Profiles As Saves a spectrum as a profile file for the deconvolution mode Profile-Bayes Switch to CRYSO_MEASURE Ends the program and opens CRYSO_MEASURE. It is not necessary to turn off the high voltage. If there are measured spectra in the spectrum window which were not saved when this command is executed or if an open project has been modified, then a warning will be displayed. The program can either be ended or the project or spectra may be saved. (only with D2 CRYSO) Closes the program. It is not possible to close the program during a measurement or if the high voltage has not been switched off. If there are measured spectra in the spectrum window which were not saved when this command is executed or if an open project has been modified, then a warning will be displayed. The program can either be ended or the project or spectra may be saved. The Measurement menu contains the following items: Exit Start Starts a measurement. This command is only available if the computer has been successfully connected to the spectrometer. During a measurement this command is not available. Pause This menu item can be used to interrupt and continue a measurement. The command is only available during a measurement or during an interrupted measurement. Stop This menu item can be used to stop a measurement. The command is only available during a measurement or during an interrupted measurement. High voltage on/off This menu item can be used to switch on and off the generator high voltage. This command is only available if the computer has been successfully connected to the spectrometer. High voltage stand by Open/Close Shutter Spectra 7 Adjustment of the stand-by values at the generator. This command is only available if generator high voltage is on. If the generator is already in stand-by mode, this command causes the adjustment of the measurement parameters for high voltage and tube current. Opens and closes the shutter. This command is not required during measuring as the opening/closing of the shutter is automatically controlled by the program. (ARTAX und D2 CRYSO) 9 User Interface Stand by Settings Displays the Stand-by settings dialog box Method Displays the Method Editor Job Displays the Job Editor (S2 PICOFOX) Sample Type Displays the des Sample Type Editor (D2 CRYSO) Position Rules Displays the Position Rules Editor (D2 CRYSO) The Analyze menu contains the following elements: Calibrate DCCR Displays the DCCR (Direct Comparison of Counting Rates) Calibration window. In this window, the calibration parameter files to be used for the quantitative elemental analysis can be created and modified (ARTAX). Calibrate TXRF Displays the TXRF Calibration window. In this window, the calibration parameter files to be used for the quantitative elemental analysis can be created and modified (S2 PICOFOX). Periodic Table Displays the window Periodic Table of the Elements for selecting the elements for assembling line diagrams of spectral lines. This command is not available if the file with the atomic data is missing. Evaluation Starts the deconvolution procedure and the calculation of concentrations. Revaluate Spectra Revaluation of measurement job with modified parameters (S2 PICOFOX) Evaluate Results This menu item can be used to calculate the net intensities for all spectrawithin one selected node of a project file via deconvolution. Accumulate all Spectra This menu item can be used for the summation of channels using all spectra of one selected node within a project data file. The measuring times (real time as well as live time) will also be summarized. Statistics Display the window Statistics ( S2 PICOFOX). Peak Displays the window Peak Parameter for parameter determination for a certain spectral line and for Laue-Peaks by using gauss functions. Main Orientation Displays the window Main Orientation for determination of the main orientation of the sample surface (D2 CRYSO). Flat Orientation Displays the window Flat Orientation for determination of the flat orientation (D2 CRYSO). Results Database Displays the window Results Database (D2 CRYSO) Phases Displays the editor for crystallographic phases Match Displays the editor for match parameters (ARTAX and S2 PICOFOX) Standards Displays the editor for standards (S2 PICOFOX) Elements Definition of the line series that will be used for the Bayes deconvolution method Calculator Opens a program module for volume calculation of the internal standard with given concentration and to calculate the number of atoms if the sample weight is known (S2 10 User Manual User Interface PICOFOX) or opens a program module to identify network levels and to calculate an orientation from two given orientations. (D2 CRYSO) The Spectrum menu contains the following items: C=A+B Adds two spectra. Not possible when a measurement is in progress. C=A-B Subtracts two spectra. Not possible when a measurement is in progress. A=F*A Scales a Spectrum Normalize Scales all displayed spectra to the channel under the spectrum cursor of the spectrum selected in the file-selection box. Smooth Smooths the spectrum selected in the file-selection box. Not possible while a measurement is in progress. Degrade Changes the full width at half maximum of a spectrum Close Spectrum Clears the spectrum selected in the file-selection box. Not possible while a measurement is in progress. Close All Spectra Clears all the spectra displayed in the Spectrum window. Not possible while a measurement is in progress. Delete ROI Clears a region of interest Delete All ROI Clears all regions of interest Change Parameter Changes the calibration parameters of the spectrum selected in the file-selection box or of all the spectra of a project. Not possible while a measurement is in progress. The functions of the Spectrum menu, except for the Delete All ROI function, are not available during measurements. The Project menu contains the following items: New Project Creates a new project Close Project Closes an open project. N.B.! The changes made to the project itself will be lost unless explicitly saved with the File/Save Project As command. Display Spectra Displays all spectra of the selected project explorer node. Show Results Displays the diagram showing the results of a line scan/mapping (ARTAX) Print Report Prints the reports for all the spectra of the selected node Report to PDF Export all the spectra of the selected node as PDF. Add Spectra Adds the spectrum selected from the list box to the project Add Picture Adds a camera image to the project as a bitmap. Add Clipboard Adds the contents of the Windows clipboard to the project Add Result Adds a result from the calculation of the crystal orientation to the project (D2 CRYSO). Add Node Adds a node to the project. Spectra 7 11 User Interface Remove Node Removes the selected node from the project. The Options menu contains the following items: Filled Spectrum Switches between a full line plot and a colored area plot for the spectrum. Filled Background Switches between a full line plot and a colored area plot for the background curve. It is not practical for both the spectrum and the background both to be set to Filled since the area plot of the filled spectrum would occlude the area plot of the background. Counts per Second Switches the ordinate scale’s unit between counts per second and total counts. Only one Spectrum When Only one Spectrum is selected, then only one spectrum will be displayed in the Spectrum window. The Spectrum window will be cleared if a new measurement is started or if a new spectrum data file is opened. Channel Scale Switches the abscissa scale between energy in keV and channels Logarithmic Scale Switches the ordinate between linear and logarithmic scale Automatic Scale If this option is checked, the scale of the ordinate is automatically adjusted during measurement to the maximum amplitude in the active spectrum (without considering the height of the zero peak that may be displayed). Otherwise, the scale remains fixed. Acoustic signal when finished If this option is checked, an acoustic signal (2 beeps) will be issued when a measurement task is completed under either Live Time or Counts conditions. Corrected data curve Switches between raw measured data and corrected measured data Background data curve Switches on/off the background data curve Difference curve Switches on/off the display of the difference between the original spectrum and the deconvoluted spectrum Short Result List Switches on/off the display of the shortened list of deconvolution results in the Spectrum window. Display Properties Displays the dialog box Display Properties Report Options Displays the Report Options dialog (S2 PICOFOX) Report Designer Launches the Report Designer for editing the layout of the report. The Device menu contains the following items: Connect Reconnection to the device via the serial port Gain Correction Displays the Gain Correction dialog. The gain correction can only be carried out if it is supported by the hardware. This function is not available during measurement. Stability Displays the Stability window Rate Opens a separate window to display the gross count rate Motor Control Opens the Motor Control dialog so that the positioning of the measuring head and 12 User Manual User Interface the turning stage can be executed (ARTAX und CRYSO CONTROL). Sample Changer Opens the dialog to control the sample changer (S2 PICOFOX with sample changer) Calibrate Channel/Energy Displays the dialog to calibrate the energy to channel ratio. This function is not available during measurement. Calibrate FWHM Displays the dialog to calibrate the ratio between the full width half maximum toenergy. This function is not available during measurement. Crosshair properties Displays the dialog box Crosshair Properties Crosshair position Displays the dialog box Crosshair Position Image parameters Displays the dialog box Image Parameters The Export menu contains the following items: Spectrum Export spectrum data as a text file All Spectra Exports all spectra contained in a node of a project file as a text file. Result Exports deconvolution results as a text file All Results Exports all results contained in a node of a project file as a text file. Results to Excel Exports the results of a line-scan or mapping (ARTAX) to EXCEL for each analyzed element. Displays the dialog box Export Options. Options Active Register Copy Graphic Copy Results Copy ROI Function Spectrum Exports the active spectra window data to the Windows clipboard. Mapping Results Exports the results graphic to the Windows clipboard Spectrum Exports a summary of the deconvolution results to the Windows clipboard. Results Exports the deconvolution results to the Windows clipboard. Mapping Results Exports the results table to the Windows clipboard Match Results Exports the results table to the Windows clipboard Exports the regions of interest calculation results to the Windows clipboard. The User menu contains the following items: Login Brings up a login dialog with username and password fields. When a user logs in successfully, all the functions that have been activated for that user’s group are enabled. Logout This deactivates all the commands that the previously logged in user’s privileges had enabled. If the high voltage circuits are on, then the command to turn off the high voltage remains enabled. The ? menu contains the following items: Spectra 7 13 User Interface Contents Displays the contents of the Spectra help file. About Displays general information about Spectra. 4.2.2 Tool Bar The Spectra tool bar is subdivided into six components (Standard, Analyze, Spectrum, Measurement, ARTAX and TXRF) which can be positioned as required. These components can be docked on all four sides of the window. The icon can be arranged in one or several rows. Every component can be treated as separate window. The standard tool bar contains the following control elements: Opens a project file. A file list box appears where the project file can be selected. The last applied directory is suggested. The file name is copied into the list of the last modified files. During a measurement it is not possible to open projects. Saves a spectrum. A file list box appears where the file name can be selected. The last applied directory is suggested. The file name is copied into the list of the last modified files in the file menu. During a measurement it is not possible to save projects. List box for choosing the active spectrum. Subsequent commands operate on the spectrum selected here. It is not possible to change the selection while a measurement is underway. Clears all the spectra displayed in the Spectrum window. Not possible while a measurement is in progress. Switches the ordinate between linear and logarithmic scale Activates zoom mode This menu item can be used to switch on and off the generator high voltage. This command is only available if the computer has been successfully connected to the spectrometer. Starts a measurement. This command is only available if the computer has been successfully connected to the spectrometer. During a measurement this command is not available. This menu item can be used to interrupt and continue a measurement. The command is only available during a measurement or during an interrupted measurement. This menu item can be used to stop a measurement. The command is only available during a measurement or during an interrupted measurement. Measurement time can be set here. Opens a dialog box for creating a job file and for starting and stopping a measurement job (PICOFOX) 14 User Manual User Interface Opens the Position Rule dialog box (D2 CRYSO) Displays the Sample Type dialog box (D2 CRYSO) Opens the Motor Control window so that the positioning of the measuring head and the turning stage can be executed (ARTAX und D2 CRYSO). Opens the dialog to control the sample changer (S2 PICOFOX) Displays the Method Editor dialog box Method selector Displays the window Periodic Table of the Elements for selecting the elements for assembling line diagrams of spectral lines. This command is not available if the file with the atomic data (RTADLLibrary.ADL) is missing. Starts the deconvolution procedure and the calculation of concentrations. The TXRF toolbar contains the following controls: Selection of the quantification type Selection of the standard element Displays the period table for selection of the standard element Sets the standard concentration Selection of the unit of concentration for the internal standard element and the concentration results Sample mass (for quantification types Solid and Volume only). Mass of internal standard element (for quantification types Solid and Volume only) Blank value (for quantification type Standardless only) Sample area (for quantification type Contamination only) Spectra 7 15 User Interface Status display within the tool bar: Indicates that the self-calibrating reference pass has been successfully completed for all axes (only for ARTAX and CRYSO CONTROL) Indicates that the X-ray beam window of the X-ray tube is open (ARTAX and CRYSO CONTROL) Indicates that the high voltage is on. If the high voltage is switched off, the symbol disappears. During shutdown, this symbol flashes. 4.2.3 Status Bar The status bar is displayed at the bottom edge of the program window. It contains a total of 14 fields of information. The number of fields displayed depends on the size of the program window. Ch/E: Channel or corresponding energy in keV (depending on the setting under Options/Energy Scale) at the position of the line cursor.The calibration data of the spectrum selected in the file list box are used to calculate the energy. d: Lattice plane offset in Å (D2 CRYSO) Cnts/R Displays the counts or count rate (depending on the setting under Options/Counts per Second) at cursor position of the spectrum selected in the file list box : U: Actual generator high voltage in kV I: Actual Generator tube current in μA Rate: detector group count rate in cps DT: Dead time of the measurement channel in %; RT: accumulated real time in s during a measurement. After the end of the measurement, the last value will be displayed; LT: accumulated live time in s during a measurement. After the end of the measurement, the last value will be displayed; PT: Peltier temperature of the detector in °C Pos.: Position of the sample changer (S2 PICOFOX with sample changer). Displays Empty when there is no sample in the measurement area. TT: Temperature of the X-ray tube housing (ARTAX). Turns red when the temperature exceeds the manufacturer’s recommended operating temperature by 20 K. GF: Flow rate of the helium flushing (ARTAX) in l/min. If the flow rate is 30% lower than the manufacturer’s recommended value, the field turns red and any measurement in progress is stopped. A: Atmosphere (ARTAX) F: Filter (ARTAX) O: Optics (ARTAX) User: User’s name The last field on the status bar will read OFFLINE when no connection between the workstation and the spectrometer is detected. 16 User Manual User Interface U, I, Rate, DT, PT, TT and GF are updated continuously, RT and LT only when a measurement is underway. Ch/E, d and Cnts/R are updated when the spectrum cursor is moved. Pos. is updated when a sample change is underway. 4.3 Working with Projects Project files are the best way to save spectra and analysis results. Project files make it possible to organize several spectra, images, and analysis result sets in one file. A project file is automatically created when a measurement is carried out with an ARTAX, when a measurement is done through the D2 CRYSO’s CRYSO MEASURE program, or when a measurement job is completed with a S2 PICOFOX. In addition to the spectra, the project file can also contain the results of deconvolution and concentration measurements (ARTAX, S2 PICOFOX), images (ARTAX), results of crystal orientation calculations (D2 CRYSO), the type of sample (D2 CRYSO), and information concerning the measurement job (S2 PICOFOX). Also, as many comments as desired may be saved. An existing project can be opened using the File/Open Project command. If a project is already open, executing File/Open Project will close it. The contents of a project are presented in tree view. The items “Information” and “Objects” are always visible. General information about the project is displayed in the Project panel. This window contains the following information: User: Name of the user under whose login the project was created Comment: Comment which can be entered as desired. D2 CRYSO’s CRYSO_MEASURE software automatically fills this field in with the name of the sample, the type of the sample, the positioning parameters, and the incident angle. If you change the contents of this field, save the project file to save your changes. Scan Information: Start and end points of the baseline, length of a line scan, size of a mapping region, distance of measuring point, duration of measurement (ARTAX) Sample Type: Type of sample with which the measurement was carried out (D2 CRYSO) Job: Structure and status of a measurement job (S2 PICOFOX). The color code for the status in the first column is as follows: blue: the spectrum was measured; green: the spectrum was measured and analyzed. When you load a project created by D2 CRYSO, the Report panel is brought up. When you load a project created by D2 CRYSO with xy-translation unit, the Mapping Results panel is also displayed. The user may also create a project file manually. To create a new project, use the Project/New Project command. When you click on a spectrum or an image in the tree, it is displayed immediately. The names of all the items in the tree are editable except for “Project”, “Information”, and “Objects”. To edit a particular item, doubleclick it. Use Project/Display Spectra to display all the spectra under the selected node. This function is not available if Options/Only one Spectrum has been selected. Add Spectra adds all the spectra open in the Spectrum window to the selected node of the project. The character sequence ‘@’+Date+Time will be appended to the spectrum name. You can also add the current spectrum to the project by dragging and dropping it while pressing the Alt key. Add Picture adds the picture displayed to the project as a bitmap. Add Clipboard adds the contents of the Windows clipboard to the project as a bitmap. Add Result adds the Spectra 7 17 User Interface result of a crystal orientation calculation to the project (D2 CRYSO). Add Note allows the user to add a comment node to the project. The default name of this node is “Node”. Remove Objects removes the selected nodes and all their child objects from the project. You can copy objects within a project by drag and drop. By simultaneously pressing the Alt key, you can copy the current spectrum from the Spectrum window to the project. Click on the object to be copied with the left mouse button and move the mouse pointer to the destination object without releasing the mouse button. When you release the mouse button, the object is copied. Please note that this effected a copying of the object, not a displacement. All the functions described above take place in the computer’s volatile memory. If you want the changes to be saved permanently, you have to launch the File/Save Project As command. Careful! There is no warning if you use Project/Close Project, File/Open Project or File/Exit when working with an unsaved project: your changes will not be saved to the file system. In addition to being able to save spectra within projects, you can also save them as individual spectrum files. For this there are the File/Save Spectrum As and File/Open Spectrum commands. However, these should only be used exceptionally. 4.4 Spectrum Window Choosing the Spectrum panel opens the spectrum window, where the graphic display of spectra during a measurement, the graphic display of spectra selected from a project, and analysis takes place. During a measurement, the spectrum is displayed cyclically every 1 - 2 seconds. You can choose a spectrum from a project by clicking on a spectrum on a project tree. The spectrum is then displayed immediately. Several spectra can by displayed by selecting a node and using the Project/Display Spectra command. As many spectra as desired can be displayed in the spectrum window at the same time. Please note, however, that the general view worsens and the performance of the program is impeded when a large number of spectra are displayed. The names of all of the spectra displayed are shown in the spectra choice box on the symbol bar. Using this choice box, the spectrum which is currently active can be adjusted. By clicking again on a previously displayed spectrum on the project tree, the spectrum will also be marked as being active. Changing the choice in the spectra choice box also marks the corresponding active spectrum on the project tree and vice-versa. For each active spectrum, the measurement parameters of the spectrum and the parameters of the corresponding method (if an analysis was done) are displayed in the Parameter panel. These include the following: Spectra field Date/Time: Date and time of the measurement start. The format depends on the settings of the operating system. Channel count: Number of channels in the spectrum. Energy absolute: The absolute parameter B of the Energy-to-channel equation (E=A*x+B). Energy linear: The linear parameter A of the Energy-to-channel equation (E=A*x+B). FWHM Mn-K: Full width half maximum of the Mn-Kα line. Fano factor. Describes the fluctuation of the primary ionization at the detector. Excitation field 18 User Manual User Interface Anode: Anode material of the X-ray tube. Filter: Filter material (ARTAX) Energy: Maximum excitation energy. Optic: Here the required optics can be selected. The following modules are available: Collimator, Lens, Capillary, Monochromator, HOPG and Secondary Target. (ARTAX, S2 PICOFOX) Atmosphere: Milieu of the measuring chamber. The following is available: air, He, vacuum N or Ar. (ARTAX) Measurement field Real time: Real time of measurement. Live time: Live time of measurement. Dead time: Dead time of measurement. Pulse density: Measured gross count rate. X-ray Generator field Voltage: High voltage of X-ray tube. Current: X-ray tube current. Axes field In this field, the positions of all axes present during the measurement are displayed (ARTAX and D2 CRYSO). Method field Name: Corrections: Spectra 7 Name of the method Escape: Prompts whether the satellite peaks (escape peaks) were corrected or not (Y/N) Shelf: Prompts whether the background signals in the lower energy range (shelf) were corrected or not (Y/N). Background: Prompts whether the background corrections were corrected or not (Y/N) Cycles: Number of calculation cycles Start: End of the background calculation End: End of the background calculation 19 User Interface Identification: Method: Deconvolution: Method: Deconvolution methods, those available are: Bayes, Profile Bayes (normal Fit), Profile Bayes (optimized Fit), the last two only with S2 PICOFOX Max. cycles: Maximum number of background cycles Step width: step width between background cycles Quantification: Calculate: prompts whether a concentration calculation was performed Cal. file: name of the calibration data file Spectrum Information field User: Name of the user who was logged in during the spectrum measurement Serial number: Serial number of the device with which the spectrum was measured Comment: Comment can be entered as desired. After changing the content of this field, please save the project file or the spectra file. If the results of a quantitative analysis was saved with the spectrum, then the lines of the analyzed elements will be displayed in the spectrum window. In the Results panel, the results of the analysis is displayed as a table (see Deconvolution). The spectra can be displayed in various ways. You can choose between full line plot or a colored area plot. This can be adjusted using the command Options/Filled Spectrum. Abscissa axis scaling can be changed between energy (keV) or channels (Options/Energy Scale command). On the ordinate axis, it is possible to choose between counts and counts per second (Options/Counts per Second command). The scale of the ordinate can be switched between linear and logarithmic display (Options/Logarithmic Scale command). The values of the measured results can be determined by using the cursor. On the status bar, the coordinates (channel number / Energy; count rate / counts per second) of the intersection between the cursor and the spectrum (selected from the file list box) in the active window will be displayed. If the diagram is switched to channel mode the cursor can only be placed onto existing data points. Trying to position the cursor between points is not possible. Left-clicking on a graphic to put the cursor where the mouse was positioned. If the left mouse button is pressed, the cursor will follow the mouse pointer as long as it is located on the graphic diagram. Double-clicking on the graphic will adjust both scales to the maximum count rate of the spectrum (without considering the height of the zero peak which may be displayed). The mouse or the keyboard can be used to moving and scaling in the direction of abscissa and ordinates. You can return to the original settings by double-clicking. Pressing the left mouse button together with the Ctrl key makes it possible to compress and stretch the spectrum in the direction of abscissa and ordinate. Pressing the left mouse button within the description area of the abscissa makes it possible to move its axis. The same action within the description area of the ordinate stretches or compresses its axis. After clicking on the Zoom button, the zoom mode is activated. The cursor switches from an arrow to a magnifying glass. By holding down the left mouse button in the spectra window, an area can be marked which will be displayed after releasing the mouse button. The zoom mode has to be reactivated in order to mark another area. 20 User Manual User Interface Regions of interest in the spectrum can be selected by pressing the left mouse button while holding down the shift key. In the spectra window the cursor changes into a short vertical line with the name ROI underneath it. After this the following procedure has to be carried out: Left-click on the left edge of the region to be selected. While holding down the left mouse button, move the mouse to the right edge of the region to be selected. After releasing the left mouse button, the region of interest will be indicated according to the settings in the Options/Display Properties dialog, ROI frame). It is possible to mark several different regions of interest within one spectrum. If the mouse is moved beyond a previously marked section of the spectrum, the cursor will change its appearance. An arrow will appear on either side of the vertical line with the letters ROI underneath. This indicates that the borders of this region of interest can now be modified. The different regions of interest will be numbered consecutively from 1 to N. If there are already elements marked in the spectrum, then the selected spectra region will be assigned a standard name denoting the element symbol and the line type (e.g. Cu_K). This labeling procedure is required when generating the reference data files needed to carry out the Profile Bayes deconvolution method. In the results window, the calculated count rate (Gross), the background count rate (Backgr.) and the net count rate (Net=GrossBackgr.) will be displayed. By using the Export/Copy ROI command, the results table can be copied to the Windows clipboard. The regions of interest defined refer to the content of the entire spectra window. If another active file is selected in the spectra choice box, then the spectral regions for that file will be displayed and the results will be calculated. The name of a region of interest can be altered after it has been selected. The corresponding region of interest in the results table should be selected. Clicking on the head of the Name column on the results table opens a dialog to change the title. Double-clicking a region of interest and then pressing the delete button will delete the region of interest. All selected regions of interest can be deleted using the Spectrum/Delete All ROI command. A single region of interest can be deleted using the Spectrum/Delete ROI command. Double-clicking a region of interest on a graphic and then pressing the delete button will also delete the region of interest. By using the File/Save ROI As command, selected regions of interest can be saved as separate files. File/Open ROI loads saved regions of interest. The following table gives an overview of all possible mouse and keyboard commands: Command Mouse Keyboard Movement of cursor Left mouse button Left/right arrow Compressing in direction of abscissa Left mouse button + Ctrl Left arrow + Ctrl Stretching in direction of abscissa Left mouse button + Ctrl Right arrow + Ctrl Compressing in direction of ordinate Left mouse button + Ctrl Page down Arrow down Stretching in direction of ordinate Left mouse button + Ctrl Left mouse button should be near the ordinate axis Page up Arrow up Moving in direction of abscissa Left mouse button near the area of the abscissa axis Left/right arrow + Alt Move to the beginning Home Move to the end End Spectra 7 21 User Interface It is possible to display a grid in the graphic window (Options/Display Properties command). Using the Export/Copy Graphic command, the content of the spectra window can be copied to the windows clipboard in “EMF”-format and then be used in other windows applications. Using the Spectrum/Close All Spectra command deletes all spectra in the active spectra window. The spectrum selected from the list box can be closed using the Spectrum/Close Spectrum command. The spectrum chosen in the spectrum choice box can be smoothed using the Spectrum/Smooth command. A polynomial filter of second order is utilized to effect this. The smoothed values replace the original data. The smoothed spectrum can be saved using the File/Save Spectrum As command. 4.5 Changing Spectra Parameters With this command, it is possible to change the parameters of the energy to channel calibration and the full width half maximum of all spectra of a project. This is sometimes necessary when it has been determined after measuring that a calibration was not correct. This approach should be treated as an exception. Before every measurement, be sure that the calibration is correct. After opening a project file using File/Open Project, nodes related to spectra whose parameters should be changed are marked on the project tree. At least one node needs to be marked. No change of parameters is possible by marking an individual spectrum. The spectrum window should be empty before using the command Spectrum/Change Parameter. After using this command, a dialog box appears. In this dialog box, the following parameters may be changed: Energy absolute The absolute parameter B of the Energy-to-channel equation (E=A*x+B). Energy linear The linear parameter A of the Energy-to-channel equation (E=A*x+B). FWHM Mn-K Full width half maximum of the Mn-Kα line. Fano factor Describes the fluctuation of the primary ionization at the detector. Describes the fluctuation of the primary ionization at the detector. In the left group box, the parameters of the spectra of the marked nodes are displayed. In the right group box, new values can be entered for these parameters. Values of the current spectrometer calibration are given as suggest values. By checking the control boxes, the parameters to be changed can be marked and saved. After clicking on Ok, the changes are implemented. The changes are only saved in the cache memory of the computer, however. In order to permanently save the changes, the File/Save Project As command is necessary. The approach to changing the parameters of individual spectrum files is similar. In this case, a project file should not be open at the same time. After loading the individual spectrum file with File/Open Spectrum, use the command Spectrum/Change Parameter. Then proceed the same way as a project. Please note that the changes are only stored in the cache memory. In order to permanently save the changes, the File/Save Spectrum As command is necessary. 22 User Manual User Interface 4.6 Display Properties The color and display of the spectra, the color of the background the appearance of the displayed grid and the function of the cursor can be configured by the user to a large extent. The following characteristics can be modified: Spectra frame Sequence of Colors If several spectra are displayed within one window, then the sequence of colors can be changed with this option. A click with the left mouse button opens a dialog which can be used to change the color. The sequence of colors can be changed by drag and drop. After a clicking the left mouse button on a color box while pressing the Alt key, hold down the left mouse button. Then move the cursor to another color box while keeping the left mouse button pressed. After releasing the mouse button, the colors of the selected color boxes will be exchanged. Background Changes the color of the background spectrum. A click with the left mouse button opens a dialog which can be used to change the color. Reconstructed Spectrum This is the color of the reconstructed spectrum after the deconvolution procedure has been carried out. A click with the left mouse button opens a dialog which can be used to change the color. Interpolate TypeNone Displays the spectrum with constant count rate all over the width of the channel. Linear The spectrum curve is be linearly interpolated between the channels. Grid frame ModeNone grid not visible Long Ticks Tick marks are visible only where the axis is labelled with numbers. Short Ticks Tick marks are visible at all axis marks. Color Color of the grid. A click with the left mouse button opens a dialog which can be used to change the color. Style Changes the layout of the gird lines. ROI frame Foreground The area of the spectra in the spectrum curve can be changed with this option. Background Defines the coloring of the background. Color Color of the spectrum area. A click with the left mouse button opens a dialog which can be used to change the color. Cursor frame Type Vertical The cursor is displayed as vertical line. Both The cursor is displayed as crosshair. None No cursor is visible Spectra 7 23 User Interface The horizontal line of the crosshair follows the spectrum curve. Ordinate ModeFollow Free The crosshair can be freely positioned. Color Color of the cursor A click with the left mouse button opens a dialog which can be used to change the color. Chart frame Color Background color of the spectra window. A click with the left mouse button opens a dialog which can be used to change the color. Axes Font A click with the left mouse button opens a dialog where the layout of the axes labels (color and font) can be changed. Marker Font A click with the left mouse button opens a dialog where the font of the element labels can be changed. Abscissa (low) If this checkbox is marked, the value contained in the entry field is displayed as the smallest value of the energy scale with an automatic scaling of the spectra window and a double click on the spectra window. Abscissa (high) If this checkbox is marked, the value contained in the entry field is displayed as the highest value of the energy scale with an automatic scaling of the spectra window and a double click on the spectra window. Ordinate (high) If this checkbox is marked, the value contained in the entry field is displayed as the highest value of the impulse scale with an automatic scaling of the spectra window and a double click on the spectra window. Series line width Line thickness of the spectrum curve 4.7 Export With the data export function, you can export measurements for further processing in standard programs (e.g. Excel) and user’s evaluation software. Use the menu command Export/Spectrum to export the original measurements of the currently active spectrum. Select the menu command Export/All Spectra to export all spectra contained in a node of a project file in the form of a text file. The format of a spectrum file to be exported can be specified in the Export Options dialog box. When the command is executed, a dialog box is displayed. The suggested file name is the original file name of the spectrum file with extension “txt”. The suggested path is that of the original file. Select menu command Export/Results to export the results of the deconvolution and concentration calculation of the currently active spectrum. Select the menu command Export/All Results to export all results contained in a node of a project file to a text file in csv. format. When the command is executed, a dialog box is displayed. The suggested file name is the original file name of the spectrum file with extension “csv”. The suggested path is that of the original file. Before continuing with exporting the data, we recommend checking the settings in the Export Options dialog box. The following settings can be modified: 24 User Manual User Interface Output field Only counts Only the recorded pulse counts are exported. Channels and counts The channel numbers and the recorded pulse counts are exported. Energy and counts The energy values and the recorded pulse counts are exported. Number per Line Number of measurements per line of text With header The measurements are preceded with additional information regarding the spectrum. Results field Net area Exports the calculated net intensities Concentration Exports the calculated concentrations Exported spectra files (“txt” files) with additional information (when With header is checked) can be reimported. 4.8 Image Parameters In this dialog box, all parameters which deal with color, brightness, contrast etc. can be configured. As a rule, no changes are necessary, since the hardware has already selected optimal settings. The Reset button can be used to retrieve the default settings. The settings differ from those of the devices used (DFG/LC1 or video converter). 4.9 Crosshair Properties This dialog box can be used to define the properties of the crosshairs. All changes are immediately visible on the screen. The following parameters can be defined: Crosshair length Length of the crosshair markers Centre Size of the aperture in the centre of the crosshair. Tick length Length of the tick marks on the crosshair. Tick distance Distance between the tick marks on the crosshair. Color Crosshair color Pen width Thickness of the lines on the crosshair 4.10 Crosshair Position In this dialog, the position of the crosshairs within the camera focus can be changed by using the sliders. The changes carried out using these sliders are immediately visible on the screen. Spectra 7 25 Measurements with Spectra 5 Measurements with Spectra 5.1 Start When the program starts and if the device is on (ARTAX and S2 PICOFOX) with high voltage off but the reference positioning of the axes has not been executed, then the program displays the Start dialog box, which recommends launching the automatic procedure to ready these parameters. Switch on high voltage This box will only be shown if the x-ray generator is part of the device configuration and the high voltage is turned off (This is always the case when the program is re-booted). The high voltage and x-ray current values which were saved will be displayed. Start reference move of all axis This box will only be shown if the motor axes are part of the device configuration (ARTAX with positionable measuring head, D2 CRYSO and S2 PICOFOX with sample changer) and the reference positioning of the axes has not been executed (This is always the case when the device has been restarted.). Check the box for the action you need to be carried out, then click the Continue button. As a rule, both actions are always to be run. You should check the values of the high voltage and the tube current. In order to run the reference positioning of the axes, it has to be ensured that there are no collisions (especially ARTAX). 5.2 Carrying Out Measurements When the program starts and if the device is on with high voltage off but the reference positioning of the axes has not been executed, then the program displays the Start dialog box, which recommends launching the automatic procedure to ready these parameters. Before you carry out any measurements, you should make sure that the energy-to-channel ratio and the full width at half maximum have been calibrated properly. You may want to check the calibration. Spectra gives you several options for carrying out a measurement. The simplest way is to launch a measurement by selecting the command Measurement/Start. Beforehand you should choose a method in the Method list box. The method you select determines all the parameters of the measurement. If the method includes the Live Time Stop Condition, then the toolbar will display an input box for measurement time. This is the field where you can input the measurement time for the selected method. You can enter a different method into this field and confirm it by pressing Enter. This measurement time will apply for the measurements launched from that point on, but it won’t be permanently saved to the method’s parameters. After the Measurement/Start command has been launched, the first thing the system does is check that the X-ray generator’s high-voltage circuit is on. If this is not the case, then a warning is displayed. However, this does not prevent further execution of the command. Next, the program queries the X-ray generator to see if it is going through its warm-up phase. If that is the case, then the command is aborted. Next, the program checks to see if the voltage and the tube current match the values prescribed by the method. If this is not the case, then it displays a message allowing the user to opt for aligning the voltage and the tube current with the prescribed values. If the user answers No, the command is aborted. Otherwise, the operational values are adjusted. If the Options/Only One Spectrum mode is on, all spectra which are displayed in the Spectrum window are removed. Thereafter the measurement is started. In the spectra list box () the text string Measured_x (x is a consecutive number) indicates a measured but not yet saved spectrum. The 26 User Manual Measurements with Spectra command Measurement/Start will be disabled. The commands Measurement/Pause, Measurement/Stop will be enabled. During measurement the measured spectrum is continuously updated and redrawn in the Spectrum window. If the check box Automatic scale is toggled to ON, the scale of the ordinate is automatically adjusted to the maximum count rate in the spectrum (without considering the height of the zero peak that may be displayed). These values are also continuously updated in the status bar. The progress of the measurement can be recognized particularly by observing the values in the status fields real time (RT) and live time (LT). A running measurement can be interrupted by using the command Measurement/Pause. If the same command is called again, the measurement will be continued. A running or paused measurement can be stopped by using the Measurement/Stop command. In the case of measurements started manually by Manual Start/Stop, this command is the only possibility to stop the measurement. This command is also to be used to stop a running measurement batch job (S2 PICOFOX). Depending on the selected measurement mode, the measurement operation will stop when either the preset Live Time or the total measurement Count has been reached. The sign that this has happened is that the Measurement/Start command is enabled again and the Measurement/Pause and Measurement/Stop commands are disabled. If the check box Acoustic signal when finished is toggled to ON an acoustic signal (2 beeps) will indicate the end of a measurement. The data collected through a measurement carried out using the Measurement/Start command are not saved automatically. You will need to add the spectrum to an existing project (Project/Add Spectra command) or by saving it as an individual spectrum using File/Save Spectrum As. This is the simplest way to carry out a measurement. Generally it is only used in preliminary research. Measurement procedures for the typical usage scenarios of supported devices have been implemented. ARTAX Measurements using an ARTAX should be carried out via the Scan panel. Here you can define line scans, mappings, and series of individual points at various positions. The measurement series thus defined will be carried out automatically and the spectra will be saved in a project file. Additionally, you can determine the settings for storing images from the camera in the project file. For measurement and analysis, the parameters of the currently selected method are used. D2 CRYSO Spectra only allows you to perform measurements with a D2 CRYSO in the context of the preparation and definition of measurement specifications (Sample Type). The program CRYSO_MEASURE is meant for doing measurements according to a predefined specification. S2 PICOFOX 5.3 The basis of measurements with a S2 PICOFOX is the definition of a job with the Job Editor (Measurement/Job). This applies both to setups with a sample changer and to the basic device without a sample changer. The job definition specifies the method of measurement and the parameters for the quantification of samples. When run, a job thus defined results in cycles of automatic measurement and analysis, and the spectra and results are stored in a project file. X-ray Generator The X-ray tube current determines energy range of the X-ray fluorescence coming from the element in the sample. The X-ray tube current determines the intensity of the fluorescence radiation produced. Therefore these two settings have to be defined very carefully. High voltage and x-ray tube current are the parameters of a method. The values are automatically configured before the measurement begins. If you leave the method editor by clicking on Ok, the high voltage will be turned on. If the high voltage and x-ray tube current values differ from the those of the chosen method, then the user is prompted as to whether the values of the method should be implemented. Spectra 7 27 Measurements with Spectra To extend the life of the X-ray tube and to obtain optimal performance, it is recommended that the high voltage of the X-ray tube not be changed too rapidly. All settings are therefore adjusted by using default step sizes which are defined in the configuration data file. Typical step sizes are 2 kV/s and 100 μA/s. For the same reason, the X-ray tube is breaded slowly after it hasn’t been used for a longer time. The following sizes are used: Down time 1-2 days: 5 kV / 30 s Down time 2 days - 2 weeks: 5 kV / 2 min Down time > 2 weeks: 5 kV / 5 min This step sizes are used for the range from 20 kV up to maximum voltage. The times given are examples. The time intervals defined within the configuration data file can be different for each individual device. To achieve optimal temperature stability for all makes of spectrometer, it is recommended to wait for ca. 2.5 min before starting a measurement. After switching the tube from the stand-by mode to full operation, the software automatically takes this time span into account. Also, it is not very useful for overall system stability and performance to turn off and on the high voltage frequently. Therefore it is recommended to switch the system to stand-by mode (these values are lower than those of a fully operational device) even if the spectrometer is not used over a longer period of time. The system can be switched to stand-by mode by using the Measurement/High voltage standby command or by checking the box Automatic stand-by (Stand by Settings dialog box). Choose the period of time after which the device will go to stand-by mode using the dialog box, Pause time input field. If the generator is in stand-by mode, then the Measurement/High voltage standby command adjusts the high voltage and x-ray tube current to the method in place. If the generator is in stand-by mode, then the user is prompted when starting a measurement if the high voltage and tube current should be set to the nominal values. An icon at the right corner of the tool bar indicates the status of the high voltage (on or off). The icon flashes while the high voltage and tube current are being adjusted. For certain X-ray tube types, it is not possible to adjust all voltage and current settings to the maximum power of the tube. Therefore the configuration data file contains a list of different possible values for maximum current at certain high voltage settings. 5.4 Stand-by Parameters In this dialog box, the automatic stand-by of the x-ray generator can be activated. To activate it, check the box Automatic stand by. Enter the time in minutes in the field after which the high voltage and x-ray tube current should be brought to stand-by values. The time begins after the end of a measurement. If a new measurement is executed within this period of time, then the time starts again. The stand-by values for high voltage and x-ray tube current were determined by the factory in the configuration file. 5.5 Working with Methods Within Spectra, all parameters for measuring and evaluating data according to a specific sample quality are integrated into one method. An unrestricted number of methods can be stored in the database. The different methods are classified by names. The required method can be selected via the tool bar. New methods can be assembled and existing methods changed by using the method editor. The parameters are divided up into six groups: Name and comment, 28 User Manual Measurements with Spectra Measurement parameters (Measurement panel), Data correction (Corrections panel), Element identification (Identification panel), Deconvolution (Deconvolution panel) and Quantification (Quantification panel). A list box in the right part of the dialog frame shows all methods available. All parameters within the corresponding input boxes are updated by selecting a method from the list box with mouse click. The following functions are available:Adding new methods (Add button) Changing method parameters (Replace button) Removing method (Remove button) Creating a new method requires a name that has not already been used within the database. This name has to be defined using the input box Name. After confirming the dialog with Add the program checks whether the name is already in use. Any text can be typed into the input box Comment to describe the method. This text is then displayed as tool tip when moving the mouse cursor over the select box within the toolbar. If the dialog is confirmed with OK all changes are stored into the database. If the Automatic evaluation feature is selected via the control box the program will react as follows: In the case of the Deconvolution Methods Bayes or Profile Bayes (normal Fit) and Identification Method Line Markers or Automatic are selected, the deconvolution and calculation of concentrations will be carried out immediately after the element lines are displayed within the Spectrum window.Deconvolution and calculation of concentrations will be finalized directly after a measurement is finished.The displayed date/time is the moment of the last method modification.The following Measurement parameters are displayed and defined on the Measurement panel: Voltage High Voltage Current X-ray tube current. Stop condition Possible values: Spectra 7 Manual stop The measurement will continue until it is explicitly halted via the Stop command. Live time The measurement will stop after the Live Time mode has run for the duration defined in the Time input field. Depending on the dead time of the measurement system, the actual measurement time may be longer than the specified time Counts Defined number of measurement pulses. The measurement is finished when the specified count of pulses over the defined spectral region of interest has been achieved. The bounds of the integration range can be set in the Left and Right input boxes, the required number of pulses in the Counts input field. Besides direct manual input of the values for Left, Right, and Counts, there is a simplified procedure to define the parameters for the Counts measuring mode. If regions of interest (ROI) are defined in the spectrum, the Read ROI button becomes active. Pressing this button will cause the Start, End, and PArea of the marked spectral range to be captured and filled into the appropriate input boxes (Left, Right, and Counts) 29 Measurements with Spectra Time Measurement time for Stop Condition Live Time Left Left limit of the integration area for Stop Condition Counts Right Right limit of the integration area for Stop Condition Counts Counts Pulse count for Stop condition Counts Anode Selection of the X-ray tube anode material Filter Selection of the filter material (ARTAX) The available filter materials are defined by the manufacturer in the configuration settings file during system assembly. Optic Selection of the X-ray optical system The options for optics are defined by the manufacturer in the configuration settings file during system assembly. Atmosphere Selection of the measurement atmosphere (ARTAX) Energy range Selection of the MCA energy range The corrections to be applied to the spectrum can be specified in the Corrections panel: Escape This feature can be used to decide whether the spectrum is corrected for escape peaks. Shelf This feature can be used to decide whether the spectrum is corrected for background signals in the lower energy range (Shelf). Background This feature can be used to decide whether background correction is to be carried out. The parameter Cycles can be used to tune the background calculations. The Start and End parameters determine over what energy range the background correction is to be carried out. The Identification panel can be used to select the method for element identification: If the Line Markers method is used, then the measured elements within the spectrum must be identified via the Analyze/Periodic Table command. Use of the Preset List method is recommended when the collected spectra are known to contain certain elements. The required elements have to be selected using the periodic table. If there are element lines displayed in the Spectrum window, then these elements can be added to the list using the Get Elements button.The Automatic feature enables automatic element identification within the spectrum. The periodic table can be used to exclude elements that are known not to present. The Standard button automatically excludes elements that are known to be generally impossible to measure or rare. The deconvolution parameters can be defined in the Deconvolution panel: Bayes The deconvolution will be calculated on the basis of theoretically calculated profiles. Profile Bayes (normal Fit) The deconvolution will be calculated on the basis of previously measured spectral profiles. In this case, the path to the spectral profiles has to be specified (Path to profiles). The Element Options dialog is used to define the elements and spectral line series are to be taken into account for the deconvolution procedure. Profile Bayes (optimized Fit) The deconvolution will be calculated on the basis of measured reference spectra. In this case, the path to the spectral profiles has to be specified. Unlike the Normal Fit mode, this 30 User Manual Measurements with Spectra method causes a variable number of cycles to be run for the background calculation. The first pass consists of one cycle. Then the number of cycles is increased by Stepwidth and the next pass is done. This continues until the value Max. stripping cycles has been reached. The final result for each line will be the intensity for which the smallest deviation between measured and calculated result is observed The final result for each line will be the intensity for which the smallest deviation between measured and calculated result (Chi) is observed. The following parameters for quantification can be defined on the Quantification panel: Calculate concentration Can be used to decide whether concentrations should be calculated Calibration file Specifies the full name of the calibration file (ARTAX) Calibration data Specifies the name of the data set with the calibration factors to be used (PICOFOX) Excluded elements Specifies which elements are to be deconvoluted but excluded from quantification (only available in TXRF quantification mode). A button over the input box brings up a periodic table for entering the elements. Unit Unit in which the calculated concentrations are to be expressed (% or ppm) (only available in DCCR quantification mode) Balance to 100% Normalizes the calculated concentration to 100% (only available in DCCR quantification mode) 5.6 Measurements with ARTAX The Scan panel is where you can carry out measurements using an ARTAX. The hardware required is a movable measuring head on motorized axes. The left side of the window presents the image from the camera. If your device has two cameras, you can select which image to display using the toggle buttons. The Image Parameter dialog (under Device/Image Parameter) allows you to set the luminance and the contrast of the image. If the Crosshair box is checked, a crosshair is overlaid onto the camera image. You can adjust the size, color and shape of the crosshair in the Crosshair Properties dialog box (under Device/Crosshair Properties). The two buttons next to the image allow you to zoom the camera image in and out. You can set the level of the LED assist light and the laser pointer using the two sliders. The measuring head can be positioned via the keyboard. For this functionality to be available, the device has to run through a self-calibration reference pass of the x, y, and z axes. This can be launched right after the program is started or at any point in time through the Motor Control dialog box (under Device/Motor Control). Movement along the x axis is effected using the Alt+arrow left/right keys, along the y axis using Alt+arrow up/down, and along the z axis using with Alt+page up/down. The movement continues until you release the key. The movement will stop only when the key is released or when the value for Lower limit or Upper limit defined in the configuration file have been reached. Steering the head from the keyboard is only possible when the Spectrum window is the active window. The measurement parameters can be entered on the left side of the window. First, use the radio buttons to select a Scan Type. The following modes are available: Spectra 7 31 Measurements with Spectra Line scan A line scan is defined by the coordinates of its starting point (First) and its end point (Last) and by the distance between measurement points along the line (Spot distance). To enter the starting point, drive the measuring head to the desired position and click on the Get First button. Then set the end point in the same way, using the Get Last button. The number of and distance between measurement points along the line thus defined is determined by the value of the Spot distance or Measurements fields. You can change the value of either of these two fields, and the other one will automatically be updated. Area mapping A mapping is defined by a baseline (determined by a starting point and an end point) and a width (Total width). The distance between measuring points (Spot distance) will be the same in both dimensions. The baseline is set in the same manner as for the line scan. One must take care, however, to set the baseline parallel to the x axis and to have the xcoordinate of the starting point be less than that of the end point. The width of the surface is to be entered into the Total Width field. Single point Any desired set of measurement points can be set in this mode. To add a measuring point, drive the measuring head to the desired position and click on the Get Point button. The coordinates of this point will appear in the table. An individual name for the position can be specified in the Name column. If no name is given, the program will create a default name. The window will display the following information about the scan: number of measurement points (Measurements), length of the baseline (Length) or surface area of the mapping (Mapping Area), measurement time (Meas. Time) at every measurement point, and total time (Time for Scan, does not take into account head travel time and dead time). The system can also be set to store a picture from the camera at every measurement point. This Picture radio button can be used to activate this option. The available settings depend on whether one is doing a line scan, a mapping, or a single-point measurement sequence. The following table shows the matrix of possibilities and their meaning. One should note that this functionality may lead to large amounts of bitmap data being added to the project file, which can cause degraded performance as well as storage problems. Therefore it is advisable to forgo capturing a picture at every measurement point for mappings with a large number of points. Meaning Line scan Area mapping Single point No No picture is saved ja ja ja On first/last point Picture saved at first and last point ja no no On every point Picture saved at every measurement point ja ja ja On area corner Picture saved at the corner of the area no ja no The path to and name of the project file are to be entered under Directory and Filename. Clicking on the Start button launches the measurement. Prior to starting the measurement, the system validates the parameters. A progress bar at the bottom of the window shows how far along the measurement is. You can stop the measurement by selecting the Measurement/Stop command. 32 User Manual Measurements with Spectra 5.7 Measurement of a job (S2 PICOFOX) The Job Editor allows you to create and edit a measurement job for subsequent automatic analysis with S2 PICOFOX. From the job editor, you can start a measurement job. Measurement jobs can be used in conjunction with device models with or without sample changer. If no sample changer is used, the system prompts the user to manually change the sample. When menu command Measurement/Job is selected, a blank table is displayed. The Job Editor window can be resized. The number of rows in the table is not limited, and the table grows as data is introduced. The width of the columns can be resized. You can do this by positioning the cursor on the right edge of the top row of a column. The pointer changes its form to two vertical lines with two arrows pointing left and right. Keep the mouse button pressed down and adjust the column width by dragging. The Comment column is adjusted accordingly. To create a new job, enter the name of the first sample (Sample name). When the column entry is confirmed by pressing the Enter key, the cursor moves to the next column. When the last column is completed, the cursors moves to the next row. Most columns are preset with useful default values. Name_xxx is suggested for the spectrum name, whereby the name corresponds to the sample name and xxx to the row number. The sample changer position (Pos.) is incremented by 1 in each row. In most of the other columns, the values of the previous row are adopted as default values. Depending on the chosen qualification type, some of the columns might not be accessible. Content of the table columns: Sample name Name of the sample (maximum 50 characters; processed by the program as a comment). Spectrum name Name of the spectrum (maximum 50 characters; the spectrum name must be unique). Id. Number Identification number (maximum 50 characters; processed by the program as a comment) Disc Name of sample carrier (maximum 10 characters; processed by the program as a comment) Pos. Sample changer position (only with S2 PICOFOX with sample changer). Time Measuring time (Live time). Method Method name Quant. Type Quantification type (None indicates that no quantification is performed). Standard element Standard element (enter text or click the button to call up the periodic system; only for quantification types Liquid, Solid and User defined). Standard conc. Standard concentration (only for quantification types Liquid and User defined). Unit Unit of the standard concentration and the result (for quantification type User defined maximum 10 characters). Sample amount Mass of sample (for quantification types Solid and Volume only). Standard amount Standard mass (for quantification types Solid and Volume only). Blank value Blank value (for quantification type Standardless). Area Sample area (for quantification type Contamination). Comment Comment (maximum 255 characters). Spectra 7 33 Measurements with Spectra At the bottom of the table, the Total measuring time of the job is shown. This time corresponds to the sum of the measuring times and the mean sample change time. Dead time is not taken into account. Click the Gain Corr. button to insert the measurement of the gain correction at the appropriate point in the job. During the measurement the measuring time and the element for the gain correction are taken from the settings as defined in the Gain Correction dialog box. Check the Print Report to box to automatically print a report after the end of the measurement with the printer selected in the choice box . For this, it is required that a printer is already installed in the operating system. Check the Save Report as PDF to box to automatically save the report as a pdf after the end of the measurement. Enter the name of the folder where the pdf is to be saved in the field provided. After completion of the entry, you can save the job by clicking the Save button. The system thereby automatically checks the figures for plausibility. Each job is saved as a Project file. Afterwards, you can start a job by clicking the Start button. The Job editor is automatically closed and the job is displayed in a status window (Job panel). The spectrum that is currently measured is marked in the first column with a red rectangle. A green rectangle indicates that the spectrum has been measured and analyzed. A blue square indicates that the spectrum has only been measured. The Measurement/Stop command can cancel a measurement. The program provides a number of options for editing previously entered data. Double-click a cell to edit the data in it. Right-click a cell to call up a shortcut menu with the following commands: Select Row Selects the row where the cursor is positioned Select Column Selects the column where the cursor is positioned Copy Selection Copies the selected cells to the Windows clipboard Paste Selection Pastes the content of the Windows clipboard to cells; the first data is entered in the first selected cell. Delete Selection Deletes the selected cells When editing jobs, please observe the following: Only cells in rows where a sample name has been entered are accessible. The sample name cannot be deleted, only changed. When using the Copy and Paste functions, data can only be pasted into rows in which a sample name has been entered. The rest of the buttons in the Job Editor window have the following functions: Start Starts the processing of a measurement job New Deletes all cell contents so that a new measurement job can be set up Load... Loads a measurement job Save... Saves a measurement job Delete Rows Deletes the selected rows Gain Corr. Includes a gain correction during the measurement job Print... Prints the table Close Closes the dialog box Help Calls up the help file 34 User Manual Measurements with Spectra If a previously completed job is loaded to the Job Editor, the rows shown with a background color cannot be edited (since they contain values which were already measured). Blue indicates a measured spectrum and green indicates a measured and analysed spectrum. It is however possible to add more rows to a measured job. When the Start button is clicked, the measurement begins with the first spectrum not yet measured. 5.8 Repeating Measurements The Device/Stability command brings up the Stability window. The following fields are required: Time Measurement time for a single measurement Pause Time during which no measurement takes place Left limit Left boundary of the integration range Right limit Right boundary of the integration range Intensity The integral intensity is calculated over the integration range. Position The position of the greatest line in the integration range is calculated. Save to If this box is checked, the spectrum is saved in the directory specified Filename The first (maximum six) characters of the automatically generated file name. The next characters will be a sequential number. The file type will be “spx” The buttons do the following: Start Starts the measurement, a constantly repeating measurement of duration specified in Time. At the end of the measurement, the integral intensity over the integration range and/or the position of the greatest line in the integration range are calculated and displayed in the table and in the graph. The actually elapsed time will be given in the table and in the graph. If the Pause field contains a value > 0, then the system will wait that long before starting the next measurement. You can stop the measurement by selecting the Measurement/Stop command. Copy Chart Copies the chart to the Windows clipboard Copy Table Copies the table to the Windows clipboard Close Closes this window 5.9 Sample Changer This dialog box is where you steer the sample changer on a S2 PICOFOX. If you’ve just turned the device on, the Sample display shows “???”, which indicates that first you have to hit the Reference button to carry out a self-calibrating reference pass to center the sample charger. The displacements along the individual axes during the reference pass are displayed in the status bar of the dialog box. After the reference pass has been successfully completed, the Sample display will read “Empty”, which means there is no sample in the measurement slot. Set the desired sample in New Sample and click on the Change button to bring the sample you want to measure into position. After this if you hit the Change button again, the sample that is Spectra 7 35 Measurements with Spectra currently in the measurement slot is taken back to the sample cassette and the next selected sample is driven into position. If you click on Remove, the sample that is currently in the measurement slot is taken back to the sample cassette and then the sample cassette is brought to rest in position 1. This allows you to remove the sample cassette from the device and to reload it with new samples. Careful! You must issue the Remove command before removing the cassette. If a sample is still in the measurement slot and a new, fully loaded cassette is introduced into the device, this could result in mechanical damage to the samples and to the sample changer. The Close button closes the dialog box. 5.10 Motor Control This dialog box allows you to adjust the positioning of the measuring head (ARTAX) or of the sample stage, the detector axis, and the xy-translation unit (D2 CRYSO). The number of axes, the labeling, and units are defined in the configuration file. On a D2 CRYSO, positioning the axes is only relevant in case of preliminary testing. When working with an ARTAX, the usual way of positioning the axes is by key presses in the main window (Scan panel). Every time you power any of these devices, a reference auto-calibration pass has to be carried out before they can be used. Because the reference buttons are located at the ends of the corresponding axes, this procedure has to be carried out carefully to avoid collisions between the measuring head and the sample, especially on an ARTAX. If the All Axes box is checked, then all axes are moved simultaneously to find the reference positions. If this option is not checked, the auto-zeroing pass is only carried out for the axes whose reference buttons are depressed. After successful reference calibration, the position display changes from “???” to the actual value. Thereafter the axes are driven to the positions defined in the configuration file. After this procedure is finished, further positioning of the axes is possible using the < and > buttons. Clicking on one of these buttons will move the axis in the direction indicated by the arrow by the distance specified in the corresponding input box. The keyboard can also be used to change the positions of the axes. The first axis can be moved using the Alt+arrow left/right keys, the second axis can be moved using Alt+arrow up/down, and the third axis can be moved with Alt+page up/down respectively. If your system supports a fourth axis, this is not steerable from the keyboard. Unlike moving the axes by using the buttons on the screen, with the keyboard the movement of the axes will continue as long as the corresponding key is pressed. The movement will only stop when the key is released or when the value for Lower Limit or Upper Limit defined in the configuration file have been reached. Piloting the axes using the keyboard is only possible when the Motor Control window is active. One can also position the axes by typing a destination value into the Position input box and pressing the Drive button. The axis indicated by the option button will then be driven to the destination specified. You can halt the reference auto-calibration or the movement to a defined position by clicking the Stop button.The Close button closes the window. 5.11 Calibration of the Channel-to-Energy Correlation Use the Device/Calibrate Channel/Energy command to calibrate the channel-to-energy correlation. This correlation is described by the linear equation E=A*x+B. x is the number of channels and E is the energy that is assigned to these channels. The values for A and B are calculated by means of this command. To carry out this calibration procedure, a spectrum of the sample with known composition is needed. The corresponding spectrum should show clearly detectable spectral signals throughout the whole channel range. In principle, two spectral lines and the zero peak are sufficient to determine the values for A and B, but to increase accuracy, it is recommended to use more than two. 36 User Manual Measurements with Spectra After loading the spectrum data file with the File/Open Spectrum command, select the spectral lines. Afterwards, the Device/Calibrate Channel/Energy command is to be executed. The Calibrate window will then be displayed. The title bar of this window displays the name of the spectrum to be used to execute the calibration. By use of the zero peak together with the selected lines of the K-series, the maximal values are determined by fitting a parabola and the values are entered into the data grid. Immediately after the values appear in the data grid, the A and B values are calculated. For calculation, a minimum of two entries in the data grid is required. If there are three or more data pairs, the root mean square R and the error (1*σ) of A and B as well as the Deviation of the defined energies from the regression line are calculated. In the lower part of the window using the group field Current Device Parameter, the current calibration parameters of the device can be displayed. If the Device/Calibrate Channel/Energy command was used on an empty spectrum window, then the calibration parameters can be directly edited in the input field. To create additional data entries, the position of a spectral line maximum and the corresponding energy value have to be typed into the input fields Channel and Energy. To transfer these values into the data grid, click the Add button. This pair of values are then transferred to the list box. Besides manually entering the values for channel position and energy into the input fields, an additional interactive method also exists. By moving the cursor directly onto the maximum of a spectral line, then the value for the channel position will be transferred to the Channel field. Entering line energy values can be simplified by using the Element select box. These values will be standardized using a ratio of 2:1 for the energies of Kα1 und Kα2. The functions of the other elements to be found on the window Calibrate are as follows: Add Copies the two values for Energy and Channel into the data grid. Determination of the regression coefficients starts after the second row has been filled with data. Replace Replaces the data pair that was selected in the list box with the values typed into the input boxes Channel and Energy, after which a new regression calculation begins. Please note that by changing the input box, the corresponding values are also copied into the input boxes Channel and Energy. Remove Removes a selected data pair from the list, after which a new regression calculation is carried out. Remove All Removes all entries from the list. Plot Displays a diagram with the calculated regression line E=A*x+B together with the individual value pairs as data points so that the accuracy of the regression can be checked visually. Close Closes the Calibrate window. If no calculation has been carried out, a warning will appear to ask if the window shall really be closed. If the values for A and B were calculated, you will be prompted as to whether the values shall be stored or not. If this question is confirmed with “yes” the parameters A and B will be permanently saved to the program Spectra and will thereafter be used for the following measurements. Help Displays this help page 5.12 Calibration of the Full Width Half Maximum The Device/Calibrate FWHM command calibrates the full width half maximum to energy ratio. This ratio is required to calculate the parameters FWHM Mn-Kα and Fano factor. To carry out this calibration procedure, a spectrum of the sample with known composition is needed. This spectrum must contain the zero peak and a well measurable and seperate K-Line at the medium or higher energy range. Spectra 7 37 Spectra Processing After loading the spectrum using the File/Open command, use the Device/Calibrate FWHM command. The title bar of this dialog displays the name of the spectrum to be used to execute the calibration. The element required to execute the calibration can be selected from the Element drop down list. Using the group field Current Device Parameter, the current calibration parameters of the device can be displayed. If the command Device/Calibrate FWHM was used on an empty spectrum window, then the calibration parameters can be directly edited in the input field. The calculation can then be started using Calculate. The full width half maximum of the zero peak and the selected element peak will be determined by fitting a Gaussian function. If the FWHM Mn-Kα and Fano factor were calculated, it will be asked whether these values shall be saved. If confirmed, then the values of the parameters FWHM Mn-Kα and Fano factor are permanently saved to the program Spectra and will then be used for all further measurements. These parameters are also changed within the spectrum file that was used for the calibration. N.B.! These changes are only saved to the cache memory. Therefore, the execution of the command File/Save Spectrum As is eventually required. In order to evaluate quality of the fit, the recalculated curve resulting from the fitting procedure will be displayed in the spectra window. 5.13 Gain Correction XFlash detectors tend to show low drift rates. This drift results in change of the energy to channel ratio. In principle, this effect can be compensated by re-calibration of the energy to channel ratio. If the Profile Bayes deconvolution method is used, then it is necessary that the measured spectra and the required reference spectra have the same energy to channel ratio. An electronic fine adjustment is built into recent spectroscopic amplifiers. This feature can be used to compensate for drift. Therefore the re-calibration of the energy to channel ratio is no longer necessary. After execution of the Device/Gain Correction command, a dialog appears (The command is only available if the electronics supports this function). On the Energy absolute and Energy linear display panels, the parameters of the energy to channel ratio are displayed. To carry out the automatic gain correction, an appropriate sample is required. The elements present in the sample as well as the spectral line used for the gain correction are displayed in the next row. The element can be selected within the Element drop down list. The Time input box can be used to define the counting time for the correction measurement. If the sample to be used for the correction has been placed into the beam path, then the correction measurement can be started with the Start button. In total, two measurements are carried out to determine the correction factor. After this measurement is finished, the new gain correction factor will be displayed in the GC new field. For comparison purposes, the old value is shown in the GC old field. If this dialog is confirmed with OK, then the new value (GC new) will be used for the electronics. A job definition can be determined when using S2 PICOFOX as to when the gain correction should be carried out. In this case, the measurement will be carried out automatically. 6 Spectra Processing 6.1 Addition and Subtraction of Spectra Adding and subtracting spectra is possible with the commands Spectrum/C = A + B and Spectrum /C = A B. After execution of one of these commands the Select Spectra dialog appears. Choose the spectra to be added or subtracted. For every measured or imported spectrum displayed, four spectra are managed within the program (the original data, the corrected spectrum, the calculatedbackground count rate and the 38 User Manual Spectra Processing recalculated spectrum from the deconvolution procedure). There are no restrictions regarding choosing the type of spectrum, although not every selection or combination makes sense. The selected procedure will be executed after confirming the dialog with OK. This procedure will result in a new spectrum, which is named Add_x or Sub_x (x being a consecutive number). Using the Project/Add Spectra command or File/Save Spectrum As, a new spectrum may be added to a project or can be saved as an individual spectrum. The defined spectrum parameter values used for the new spectrum will be copied from spectrum A. The time and date of the start of the procedure will be used as create time and create date. The button Cancel will close the dialog without execution of the procedure. 6.2 Scaling a Spectrum The Spectrum/A = F * A and Spectrum/Normalize commands are available for scaling a spectrum. Selecting the Spectrum/A = F * A command displays a dialog box for entering the scaling factor. This is where you can type in a previously derived scaling factor. When you click OK, all the pulse counts of the active spectrum will be multiplied by that factor. Selecting the Spectrum/Normalize command causes all the spectra in the Spectrum window to be normalized to the active spectrum. The scaling factor is determined by the relation of the pulse counts at the spectrum cursor. Both commands also multiply the measurement times by the scaling factor. The button Cancel will close the dialog without execution of the procedure. Using the Project/Add Spectra command or File/Save Spectrum As, a new spectrum may be added to a project or can be saved as an individual spectrum. Care should be taken to enter a different file name so as not to overwrite the original values. 6.3 Spectrum Comparison This command allows you to compare the active spectrum displayed in the spectrum window with saved spectra. The latter may be spectra that you have saved individually or in project files. The comparison is done by calculating the likelihood of match in %. Selecting the Analyze/Match command displays the Match dialog. This dialog box contains the following fields: Search in Directory in which to look for the project files or the individual spectrum files. Subdirectories will also be searched. Start energy Lower boundary of the energy range in which to compare the spectra End energy Upper boundary of the energy range in which to compare the spectra Min. correlation Minimum likelihood of match for spectra to be considered as matching Number of hits Maximum number of matches displayed. Clicking on the Start button will launch the comparisons. The status bar of the dialog box will display the progress of the comparisons. The first status field shows the number of files found, the second shows number of spectra being pulled into the comparison, and the third displays a count of matches found so far. After the comparisons have been run, the dialog box will close automatically. If the search turned up hits, the Match Results panel appears. The top part of the panel summarizes the parameters used in the comparison. Underneath, the results are displayed in tabular form: Spectra 7 39 Spectra Processing Correlation Likelihood of match Spectrum Name of the spectrum Date Date and time the spectrum was recorded Filename Directory and filename of the project file or of the individual spectrum file Double-click on a line in the results table to display the selected spectrum in the spectrum window.The Match Results panel will remain visible until the program quits or until a new comparison is run and results in zero hits. 6.4 Determination of Line Parameters The Analyze/Peak command is used to determine the energy, the peak maximum, the full width at half maximum, and the integral intensity of spectral lines and the Laue peaks of the active spectrum in the Spectrum window. After the Analyze/Peak command has been selected, the Peak Parameter and Fit window will be displayed. Within the left upper part of the window a quick determination of line parameters can be done by positioning the spectrum cursor. The spectrum cursor should be placed at peak maximum. The peak energy, the pulse count at maximum, the width at half maximum, the relative width at half maximum, and lattice plane offset are displayed in the Energy, Intensity, FWHM, FWHM rel., and d fields. For accurate determination of the peak maximum it is fitted using a parabola. The number of data points used to calculate this parabola can be defined using the option Fitting Points.The second function that this window allows is fitting Gaussian functions to part of the spectrum. Specify the spectral range of interest using the Start and End input boxes. The spectral lines of the selected elements are inserted into the table via the Add Spec. button. The table contains the line type (Line), the energy (E/keV), the maximum intensity (Max) and the full width half maximum (FWHM/keV). The Laue peaks can be added to the table by selecting the peak with the line cursor and clicking the Add Laue button. Another possibility is to insert Laue peaks by importing data from a Lauepeaks database. You can select phases of interest under the Phase field. The Get command loads the Phase values. The table contains the d-value (d/Å), the maximum intensity (Max) and the full width at half maximum (FWHM/keV). Single lines can be removed by clicking the Remove button. Least squares minimization is then carried out by clicking the Fit button. The resulting spectrum is displayed. The fitting procedure can consist of two steps. From the Spectrum and Laue panels, the parameters (intensity, position, FWHM) to be fitted can be selected separately for spectral lines and Laue peaks and for both steps respectively. If the 2nd Step Automatically box is checked, then the second step will launch without prompting the user beforehand. After the fitting process is completed, the energy (E calc/keV), d-value (d calc/Å), maximum intensity (Max calc), full width at half maximum (FWHM/keV), and integral intensity (Integral) are inserted into the table. The quality of the fit between measured and calculated spectrum is indicated by the values Chi 1 and Chi 2. The number of iterations is displayed in the Iterations 1 and Iterations 2 fields. Ideally, Test 1 and Test 2 should be 3. A value of 0 indicates that the fitting process failed. Use the Save button to save the contents of the table in a text file (file type txt), and Restore to reload a saved result. The contents of the table can also be copied to the Windows clipboard using Copy.The parameter 2ϑ is required to convert d-values into energy values. If the spectrum file contains a value for the 2T axis, this value is copied into the corresponding input box. The starting values for the full width at half maximum of the spectral lines are derived using the values for width at half maximum for the Mn Kα line and the Fano factor that are stored together with the spectrum data. The parameter Epsilon indicates the azimuth divergence of the measuring system. This value is important in calculating the starting values for the full width at half maximum of the Laue peaks. 40 User Manual Qualitative and Quantitative Analysis 6.5 Phases The dialog box Lattice Planes is used to create and maintain the database of crystallographic phases. The individual phases can be loaded into the Line parameters calculation window as Laue peaks. The list box on the right side of the dialog box shows all available phases. Clicking on an item in this list will display the parameters of that phase. The New database-management buttons have the following Clears all input fields to enter a new phase. functions: Add Adds a phase to the database Replace Replaces the parameters of the selected phase with the values in the input fields Remove Deletes a phase Enter the name of the phase in the Name field. Duplicate names are not allowed. You can enter an optional comment on this phase in the Comment field. Enter the lattice plane offsets and the corresponding Laue indices into the table on the left. 7 Qualitative and Quantitative Analysis 7.1 Qualitative Analysis In the dialog Periodic Table of the Elements, the elements to be charted in the spectrum window can be specified. The choice of possible elements is restricted by the energy range, and the selection is to be done from the Element Options dialog box. If Profile Bayes was chosen as the deconvolution method, the list of possible elements is further restricted based on the included profile files. The symbols of elements with no corresponding reference data are underlined. The line types to be displayed can be selected using the K series lines, L series lines, and M series lines check boxes. Toggling these check boxes to ON or OFF is immediately reflected in the lines displayed in the graphical display. Click on the element-symbol button to have its lines overlaid in the spectrum window. The relative height of the lines within one line series corresponds approximately to the expected intensity. If Lines is checked, the spectral lines are indicated using thin vertical marks. If Text is checked, the symbols of the elements are displayed. For the selected elements, the color of the button corresponds to the color of the visible lines in the diagram. Clicking an element button again will hide the lines corresponding to that element. An element can also be activated by typing the element symbol or atomic number into the New element input box, followed by Enter. The up arrow and down arrow buttons allow you to step back and forward through the element selection. The Clear All button removes all selected elements. When you hover the mouse pointer over an element-symbol button, the atomic number and the full name of the element is displayed as a tool tip. A right-click on the element-symbol button will bring up a dialog box showing the energies of all the lines of the element in question, as well as its atomic mass and its density. If the method currently active calls for Automatic evaluation with Identification Method Line Markers and either Deconvolution Method Bayes or Profile Bayes (normal Fit), then the deconvolution of the spectrum follows as soon as the element lines are displayed. You can change the colors of the overlaid element lines by drag and drop. Left-click on one of the color squares at the bottom of the dialog box. Then without releasing the left mouse button drag the pointer over to Spectra 7 41 Qualitative and Quantitative Analysis the element symbol. The mouse pointer will change shape. When you are over an element symbol and you release the left mouse button, the color of the overlaid lines and of the button changes. This can only be done with elements that are already selected. The changed colors will remain the same as long as the program is running.The right side of the Periodic Table of the Elements window is used for identification of the spectral element lines. All the elements that would show characteristic lines at the position of the line cursor will be displayed in the element list. Clicking on an item in the element list will add the corresponding element to the selected elements. The bandwidth for recognizing a line is adjustable (the default is 0.05 keV).The Auto Ident button can be used for automatic qualitative identification of the elements in the sample. All identified elements are added to the sub-selection of elements. In most cases, careful verification of the automatic results will nevertheless be necessary. 7.2 Deconvolution The following procedures to analyze the measured data are provided by the program Spectra: • Spectra correction (Escape, Shelf, Background), • Qualitative analysis, • Calculation of the spectral line intensities by deconvolution and • Calculation of element concentrations using the procedure of direct comparison of count rates (DCCR, ARTAX) or with an internal standard (TXRF, S2 PICOFOX). The parameters to be used for the single steps are defined by the method selected. Prior to determining the intensities via deconvolution, qualitative analysis and display of the element lines are required. The calculation is carried out using the command Analyze/Evaluation. All calculations and results always refer to the active spectrum of the spectra window. The curve resulting from deconvolution is added to the active spectrum in the spectrum window. If the Options/Difference curve is ON, then the difference between the original values and those determined via deconvolution will be presented in an extra window. The process of deconvolution depends on the set identification method (in Identification Method) and the method of the concentration calculation (DCCR or TXRF). The process differs also for spectra for which results have been obtained previously. If such results are not available for the active spectrum and identification method, then Line markers can be chosen to perform the deconvolution and concentration calculation with the elements whose line markers are shown. With the identification method Preset list, the elements in the list are used, unless there were line markers for certain elements shown before the Evaluation command was started. With the identification method Automatic, the elements to be used for the evaluation are determined automatically, unless there were line markers for certain elements shown before the Evaluation command was started. If line markers of elements are shown before the Evaluation command is started, then the deconvolution and concentration calculation are only completed for these elements. With TXRF, the quantification parameters that are currently shown in the TXRF tool bar are used for the concentration calculation. If there are already results for the active spectrum and the relevant spectrum is activated, the elements are shown in the spectrum window. The results table will be shown on the Results panel. With TXRF, the quantification parameters are updated on the TXRF tool bar. If the Analyze/Evaluation command is selected at this point, the name of the method of the existing results is compared with the current set method. If the two methods are the same, the method data is compared. If they match, the calculation is repeated for the elements shown, irrespective of the method of identification. The Analyze/Periodic Table command can thus be used to change the range of elements to be taken into account for the calculation. If you wish to clear an element from the sample list, first delete all elements in the spectrum window. If the method data do not match, the following prompt is displayed: Method of spectrum and method of data 42 User Manual Qualitative and Quantitative Analysis base are not equal! Continue? Confirm with Yes to calculate the values applying the current method data; click No if you do not wish to complete the calculation. If the method names of previous results do not correspond to that of the method currently set, the user is prompted to specify whether the currently selected method is to be applied. If No is clicked, the method database is searched for a method with a name that corresponds to the spectrum data. If there is such a method in the database, it is activated. The method data is now compared. If it matches, the calculation is performed. If it does not match, the procedure is continued as described above. If no method with the required name is found in the database, an error message to this fact is displayed, and no calculation is performed. After completion of the calculation, the method data and results (as well as the quantification parameters in the case of TXRF) are stored in the spectrum. Please note that this information is stored only temporarily in cache memory the computer. To save the data permanently, select menu command File/Save Spectrum As or add the spectrum to a project file and select menu command File/Save Project As. In the Results register, the results of the deconvolution and concentration calculation are presented in a table: consecutive number No. Element Symbol of element Line Spectral line Energy Energy in keV Cycl. Number of cycles for the background calculation; with deconvolution method Profile Bayes (optimized fit), there might be different cycle times for individual lines. Net Integral intensity (net) after deduction of background intensity Backgr. Background intensity Sigma Standard deviation of integral intensity Chi Sum of the squares of the deviations between the measured and the calculated values Conc. Concentration SigmaC Standard deviation of the concentration LLD Lower limit of detection (for S2 PICOFOX only) By using the command Export/Copy Result, the result table can be copied to the Windows clipboard. 7.3 Spectral Profiles Reference spectral profiles of single elements are needed to carry out the Profile Bayes deconvolution procedure. The file type which is used to store spectral profiles is “spx”. A reference spectral profile is needed for every element, every spectral line and for every excitation condition. Within Spectra, these files can be opened like normal spectra of type “spx”. As opposed to normal spectrum files the spectral profile contain additional information that is required to execute deconvolution. The file names of these spectra are created using the following scheme. Spectra 7 43 Qualitative and Quantitative Analysis The first characters represent the element symbol (one or two letters). The next character is a number from 0 to 3 referring to the energy range. The next symbol stands for the spectral line (K, L, or M). This leads, for example, to: Ge0K.spx, W0L.spx. The default installation of the program contains reference spectra for some elements. To assemble new spectral profiles the following procedure is recommended: • Measure a sample that contains a sufficient amount of the element of interest. • Display the spectral lines of the element of interest. • Define a region of interest within the spectrum. The name of this region must be created using the following rule: The first characters represent the element symbol (one or two letters). The next character is an underline “_”. The next symbol stands for the spectral line (K, L, or M). This leads, for example, to: Ge_K, W_L. If prior to defining the region of interest element lines were displayed, then the name is created automatically. • Save the spectral profile using File/Save Profile As. The file name of the spectral profile must follow the rules given above. If the region of interest is named correctly, a valid file name will be suggested. If several regions of interest were defined in the spectrum one of them must be specified by mouse click before the File/Save Profile As can be executed. The measurement data stored in a spectral profile is the difference between the corrected measured values and the background. 7.4 Calibration Factors for Quantitative Element Analysis (DCCR) Direct comparison of count rates is the easiest method for quantitative element analysis of unknown samples. After determining calibration factors using standards with known element concentrations, the content of an element in an unknown sample is calculated using the following formula: Ci = Ci Ni T I Ki Ni T ⋅ I ⋅ Ki Concentration of the element i net count rate of element i counting time in s X-ray tube current in μA calibration factor of element i With this formula, the absorption and other element to element interactions of a sample are not taken into account. Therefore this calculation method is only applicable for samples which are similar in composition to the standard samples. The same is valid for the measurement conditions. This means that sample and standard have to be measured using the same spectrometer settings. The data of the calibration data file is organized in three different layers. They are the temporary data (field Temporary Data), data buffer (field Buffer Data/Calibration Data) and the actual calibration factors (field Buffer Data/Calibration Data). The temporary data consists of the values resulting directly from the calculation of the net intensities of the standard samples. One calibration file can also contain data of several standard samples. If the same element is present in different standards, an average calibration factor will be calculated using the different data sets. The K-, L- and M- series are treated in separate data sets.. After the 44 User Manual Qualitative and Quantitative Analysis temporary data is transferred into the data buffer, the calibration factors can be edited or deleted within this buffer. If calibration factors are available for at least two elements per line series, then it is possible to either interpolate or extrapolate those factors for additional elements. Interpolation and extrapolation can be carried out within the data buffer repeatedly and can also be divided up into several single parts. To generate a calibration data file, the spectrum of a standard sample has to be loaded. Then the existing elements have to be selected and then the net intensities must be calculated. After execution of the Analyze/Calibrate DCCR command, the DCCR Calibration window appears. In this window, select the field Temporary Data and click the Add button. This button is only active if a spectrum is loaded into the spectra window and if the net intensities have been already calculated. The Standard dialog will appear. The entries from the results table of the spectra window are copied into the table shown. By toggling the check boxes of the Use column, is possible to decide which entries will transferred to the calibration data set. The known element concentrations of the standards should be entered in the cells of the Conc. column. The chosen unit should be selected from the Unit column. If several spectral lines are available or already calculated for an element (e.g. the K- and the L-line), then the concentration for this element only needs to be typed on the first row referring to this element. The other rows which correspond to this element will automatically be filled in with the same concentration value. The calibration factor is calculated automatically after the concentration is entered. This factor will then be displayed in the Calib. column. In the Unit column, either % units or ppm may be chosen. By clicking the top of the Unit column, the concentration unit can be changed for all rows of the table at the same time. After all concentrations are entered, the dialog has to be confirmed using the OK button. You will be prompted whether the data should be transfered to the buffer. As a rule, click OK if dealing with a new calibration file. The calibration factors will then be transferred into the table that contains the temporary data and the calibration factors are copied into column Kij. All other spectra of standard samples which are required for completing the calibration file have to be treated in the described way. Immediately after the calibration data has been copied into the temporary file, the average and the standard deviation are calculated (columns Mean und Dev.). When trying to add a file that already exists within the temporary data set, you will be asked whether the existing data shall be overwritten. The names of all added files are transferred into the list box at the lower part of the window. If a name is selected, the corresponding data column will be marked in yellow. A data column can also be selected with the left mouse button by clicking onto the column heading. To remove a selected data set (marked in yellow) from the Temporary Data field, use the Delete button. The Buffer button can be used to copy the temporary data into the data buffer. It is important that the buffer has been cleared prior to this operation. The concentration values, defined within the Standard dialog are transferred to the result table within the spectrum window and can be stored to the standard data file. Therefore the concentrations do not have to be defined again when reloading the standard file.The measuring conditions of the first spectrum that was added to the list of data sets are copied to the Header field. The user is responsible that only spectra which have been measured with the same measuring conditions are transferred into a calibration file. To describe the calibration file in detail, any text can be written into the Comment field. Additional editing of the calibration data can be carried out in the Buffer Data/Calibration Data field. The content of the data buffer is displayed graphically as well as in form of a table. Clicking the left mouse button on one of the entries in the table selects the corresponding data point within the diagram. Clicking on one of the data points in the diagram selects the corresponding data set in the table. The table entries in the data buffer can be edited as required. If a value has been changed, this change will immediately be visible within the diagram. By using the button Delete Value the actual selected value can be deleted. Spectra 7 45 Qualitative and Quantitative Analysis To interpolate or extrapolate missing calibration factors, the interpolation function should be selected from the lower left list box. There it is possible to choose between a polynome, a rational function or a cubic spline. After this, the supporting points for the interpolation have to be defined using the left mouse button + Shift. The corresponding points will be indicated within the diagram. The same result can be achieved by changing the entries in the list boxes First Element and Last Element. Defining a region for the extrapolation can only be done via these list boxes. The interpolation/extrapolation procedure is executed by pushing the button Interpolate. The interpolated/extrapolated values are indicated in green and are initially only displayed on the diagram. The calculation can then be repeated using different functions. The Int.>Buffer button transfers the calculated values to the buffer. The Buffer->Calib button copies the data from the buffer to the final calibration data set. It is important that the existing calibration data is completely replaced by the data from the buffer. If this procedure is finalized, the resulting calibration data set must be stored by using the Save button. The New button can be used to generate a new calibration data set and to clear all data fields. By using the Load button a file list box will open to enable existing calibration data files to be loaded for further editing. 7.5 Calibration Factors for Quantitative Element Analysis (TXRF) In order to measure concentrations in TXRF for the Liquid, Solid, User defined and Volume quantification methods, basic knowledge concerning relative sensitivities is necessary. To measure concentrations for the Absolute and Contamination quantification methods, knowledge of the absolute sensitivity of the element (normally Ni) is necessary. Element sensitivity depends on the excitation spectrum of the device. After being computed at the factory, all such values are made available to the user in a database, where various sets of calibrated data can be managed. To select the desired data set, go to Method Editor/Quantification/Calibration Data. The Method Editor dialog field allows for database editing and creation based on element sensitivities. However, users will only need to perform such operations in very rare cases. To open the calibration database Editor, click Analyze/Calibrate TXRF. To view the data set parameters, click an item on the list. The functions of the database editing commands are as follows: Add Adds a data set to the database Replace Replaces the parameters of the marked database with the parameters in the input fields. Remove Deletes a data set. The following information is displayed for each data set: Name Data set name Created Date and time of creation User User Excitation mode Device excitation mode Sensitivity Symbol of the element and its absolute sensitivity in 1/(ng*s*mA). To edit these values, click Device/Sensitivity. Comment Comment 46 User Manual Qualitative and Quantitative Analysis Calibration parameter Relative sensitivity of the B ... U elements The relative-sensitivity table shows the element’s periodic number, the element symbol, the relative sensitivity for the K, L, and M series, and the line series that has been selected and will be used to compute the concentration. Only one line series can be used for each concentration computation procedure, which can only be carried out if an element’s selected line series is also taken into account in the computation. To define computation procedure settings, open the Element Options dialog. Defining these settings here results in the relevant elements being shaded in the table; this enables you to see immediately which elements and line series actually need calibration values. Calibration values can be modified by making entries in the relevant table fields. The line series input field contains only those series for which calibration values have been entered. After editing a data set, save your changes by clicking Add or Remove. These additional buttons have the following functions: Copy Copies table data to the Windows clipboard. Paste Pastes clipboard data into a table. Import Imports txr calibration files from versions 6.2 and lower, so as to allow for downward compatibility. Help Opens the Help function 7.6 Element sensitivity To compute concentrations for the Absolute and Contamination quantification methods, knowledge of the absolute sensitivity of the element (normally Ni) is necessary. The Device/Sensitivity dialog field allows for the experimental determination of this value. To perform this operation, a sample containing the element and its known mass is required. Click Device/Sensitivity to open the Device/Sensitivity dialog field, whose display fields contain the following parameters: Element Elements whose sensitivity is to be determined Mass Mass of the sample element Method Measurement and valuation method Calibration data Name of the calibration data set (see Analyze/Calibrate TXRF) whose sensitivity is to be determined. Old sensitivity Shows the sensitivity that was previously stored in the database. New sensitivity Shows the sensitivity that was determined via the measurement. For the measurement and evaluation method, select Identification Preset list in the register. The element list must contain the element for which the sensitivity determination is being realized. Additional elements in the sample can be added to the element list. Spectra 7 47 Qualitative and Quantitative Analysis To launch the measurement process, click Start. On completion of the measurement, sensitivity is computed and the result is shown in the New sensitivity field. Click OK to export the computed value to the selected data set in the calibration database. 7.7 Job spectra revaluation This command allows for the comfortable revaluation of the spectra in a project file. To perform this operation, after loading a project file that was generated during a job measurement procedure, click Analyze/Revaluate Spectra. A dialog field containing the Parameter for selected spectra and Select spectra for revaluation tables will appear. The Select spectra for revaluation table shows all spectra for the Spectra node of the relevant project file. These nodes contain all spectra following the measurement of a job. To select all spectra for which a revaluation is to be realized, check the All Spectra checkbox. All checkboxes are selected by default. If the parameters in a column are the same in all selected spectra, the parameter value will also be shown in the relevant column of the Parameter for selected spectra table. To modify the evaluation parameters for each individual spectrum without regard for quantification type, use the following columns in the Select spectra for revaluation table: Method, Quant type, Standard element, Standard conc., Unit, Sample amount, Standard amount, Blank value, and Table Area. To modify successive values in a table, extend the marking to all column rows that are to be modified by holding the left mouse button down in the lower right corner of the cell marking (the cursor will change to a cross) and moving the cursor to the desired lines. The value in the first marked line will then appear in all of the successive lines that were marked in this fashion. To modify the parameters for all selected spectra, use the Parameter for selected spectra table. Click Enter to enter all entries in this table for the spectra that were selected in the Evaluate column of the Select spectra for revaluation table. Use the New Node input field to enter the name of the project file node where the revaluated spectra are to be saved. Click OK to evaluate all selected spectra using the selected parameters. Revaluated spectra will be saved under the defined name in the project file. However, as this data is initially saved in the computer’s memory only, click File/Save Project As to save the data in the database. 7.8 Standard samples This dialog box is used to create and maintain the database of standard samples. “Standard samples” are samples with known element composition. The element concentrations of the standard samples can be determined anew and compared with the known concentrations in the Statistics window. The list box on the right side of the dialog box shows all available standard samples. Clicking on an item in this list will display the elements in the sample and their concentration in the table on the left. The database-management buttons have the following functions: New Clears all input fields to enter a new standard sample. Add Adds a standard sample to the database Replace Replaces the parameters of the selected standard sample with the values in the input fields Remove Removes a standard sample 48 User Manual Qualitative and Quantitative Analysis Enter the name of the standard in the Name field. Duplicate names are not allowed. The Unit field allows you to enter the unit of measurement for concentration. In the table on the left, you can enter: Element Element symbol. It is automatically rendered in the proper case. You can click on the area inside the field to open a periodic table in which you can select the element by point and click. If you erase the element symbol in a given row, then Add and Replace will only operate on the entries above that row. Conc. Concentration of the element Conf. Limit Standard error of the concentration Click on OK to save changes to the database. 7.9 Statistics of TXRF Results The TXRF Statistics window has three functions. First, it offers a summarized view of the concentrations of several samples (spectra). Second, it presents the results of the calculation of the mean value and the standard deviation of several measurements of the same sample. Third, it allows you to compare the measured data with the data from standard samples. To display the TXRF Statistics window, select the Analyze/Statistics command. This is enabled only when a project file is loaded. If a node of the tree or a spectrum is selected when you launch the command, the results (concentrations) for the selected spectrum or spectra will be displayed in the window. It is also possible to add results by dragging and dropping from the project tree. To do this, left-click on a node or a spectrum in the project tree. Then without releasing the left mouse button drag the pointer over to the TXRF Statistics window. The mouse pointer will change shape. When you release the left mouse button, the results will appear. Newly added results will always be added in the first available column. This makes it possible to see the results from several project files side by side. The table’s rows list the concentrations. The data in this window are not editable. There is no limit to the number of rows or columns in this window. To move a column, left-click on the first or second row of that column, keep the mouse button pressed, and drag it where you want it. You can calculate means by selecting the columns you’re interested in averaging with the mouse. To select several columns, keep the Ctrl key pressed while clicking on concentration cells in the desired columns. The selected columns are highlighted in gray-blue. You can select several non-adjacent columns in this way. Click on a selected column to deselect it. When the columns of interest have been selected, click on the Mean button to calculate the mean and the standard deviation of the concentrations for the selected columns. The following conditions have to be met to be able to calculate the mean: • the units in the selected columns must be the same • the quantification type must be the same • for measurements with internal standard, the standard element must be the same The results of the mean and standard deviation calculations are shown in separate columns. The columns contain the labels “Mean” and “Sigma” respectively, followed by the names of the spectra taken into account in the calculations. It is not possible to include the calculated means in the calculation of further means. To compare the measurement data to the standard sample data, you need to load a standard sample. In order to do this, click on the Standards button. The Standards dialog box appears. Select the desired standard sample from the list box on the right and click OK. The standard values will be added to a column of the table. The heading of the column is set to “Standard” followed by the name of the standard sample. To do a comparison, select one column of measurement data and one column of standard data and click on the Compare button. The result of the comparison will be displayed in a new column showing the recovery Spectra 7 49 Qualitative and Quantitative Analysis rate (the ratio of the measured concentration to the concentration of the standard sample in %). The heading of the column is set to “Recovery rate” followed by the name of the spectrum, and the label “Standard” followed by the name of the standard sample. In the column containing the measured spectrum, all the concentrations that deviate from the concentrations of the standard sample by more than the sum of the measurement errors are marked in red. The units of the values to compare must be the same. The buttons in this window have the following functions: Standards Displays the Standards dialog box. After the user has clicked OK, the data from the standard sample is copied into a new column. Compare Does a comparison between a column of measured values and a standard sample. Mean Calculates the mean and the standard deviation of the selected columns. Delete All Clears all the data Report Prints or displays a report for an average Copy Copies the table data to the Windows clipboard Close Closes the window Help Calls up the help file Right-click a cell in the data area of the table to call up a contextual menu with the following functions: Copy Selection Copies the data of the selected columns to the Windows clipboard Delete Selection Clears the data in the selected columns Delete Column Deletes the data in the column in which the mouse pointer is 7.10 TXRF Results Report Reports are used to output the results of quantitative element analyses on a printer or in the form of PDF files. The contents of a report can be configured in the Report Options dialog box. The following fields can be output: Details of measurement and analysis parameters: Name of the user (as entered at program start-up) User Serial number Serial number of the device Project Complete name of the project file Sample Name of the sample (entered in the measurement job) ID.-No. ID number (entered in the measurement job) Disc Sample carrier identifier (entered in the measurement job) Quant. Type Quantification type Blank value Parameter for Standard less quantification type Spectrum Name of the spectrum (entered in the measurement job) Meas. date Date/time of measurement Method Name of the method Live time Measurement duration 50 User Manual Qualitative and Quantitative Analysis Count rate Pulse rate Dead time Dead time Voltage High voltage of X-ray tube. Current X-ray tube current. Excitation Excitation type (S2 PICOFOX) Anode Anode material Filter Filter material Optic Optical system of X-ray device Atmosphere Atmosphere Comment Comment (entered in the measurement job) Table of concentrations: Measured element Element Line Line series Concentration Concentration Sigma Standard deviation of the concentration RSD Relative standard deviation of the concentration in percent LLD Lower limit of detection Peak area Area of peak used for the calculation Background Background area Chi Quality of the approximation through deconvolution of the peak Stripping cycles Number of passes for background detection Select the Graphic check box if you wish to include the spectrum as a chart in the report. The toolbar of the Report panel contains the following functions: Zoom in on the report Zoom out on the report Print the report. A printer must be installed at the OS level. Before confirming the print job, you will be able to select the printer you want to use. Export the report as PDF file. You can enter the filename you want. Use the Report Designer (Options/Report Designer) to change the layout of the report. Spectra 7 51 7.11 Concentration Calculator Especially in TXRF, the parameters concentration, volume and mass have to be combined frequently. It is for example a typical problem to dope a sample with an internal standard. Using the concentration calculator, the amount of a standard with a specified element concentration required to achieve a certain element concentration within the sample, referring to a particular initial volume, can be calculated. Within this dialog, the following input is required: Selection of the probe type (Liquid/Solid). Sample volume / Sample The sample volume (in mg or µg) or sample mass (in mg orµg). The unit depends on the selection Liquid/Solid. mass Concentration of internal Required internal standard concentration in g/l, mg/l or µg/l if Liquid is selected or mg/kg if Solid is selected. standard Concentration of standard Element concentration of the standard solution in g/l, mg/l orµg/l solution The calculated standard volume in ml or µl is shown in the display panel Standard Volume. For Solid, the mass of the standards is also given in μg or ng under Standard mass. The calculation is constantly updated during input. The number or the area density of atoms within a defined amount of an element can be calculated in the second field of the dialog. The element can initially be selected by using the drop down list. The following also should be entered: Mass Amount of sample in ng or pg. Diameter Sample diameter in mm. The total number of atoms will be shown on the display panel Number of atoms and the Area density of the atoms will be also shown on its corresponding display panel. 8 Crystal Orientation 8.1 Sample Types The sample type concept was introduced to simplify the definition of measurement and analysis parameters within the CRYSO_MEASURE program. You can manage a sample-type database of any size. Within CRYSO_MEASURE you will then be able to choose from a list the sample type required for a measurement. You cannot change this database from within CRYSO_MEASURE. The values of the required parameters can be defined in the dialog box called up by the Measurement/Sample Type command. The parameters are divided into five groups: 52 • General parameters • Parameters for measurement and evaluation of the main orientation (Main Orientation tab) • Parameters for measurement and evaluation of the flat orientation (Flat Orientation tab) User Manual Crystal Orientation • Formulas to calculate user-specific results from the calculation of the main orientation (Formulas tab) • List of lattice planes (Lattice Planes tab) • Parameters for the automatic determination of an unknown orientation (Search tab) The general parameters are: • Name (Name), • Group (Group), • Crystal system (Crystal system), • Lattice parameters (a, b, c, α, β, γ ) • Method for determining main orientation (Method for Main Orientation), • Preselection of the measurement type to be used within CRYSO_MEASURE (Main Orientation and Flat Orientation controls). A name is required for every sample type. There can be no duplicate names. After you click Insert, the program checks whether the name is already in use. Every sample type can be assigned to a group via the Group combo box. You can choose the name of an existing group from the list or enter the name of a new group. The number of sample types displayed in the Sample Type field in the panes used to determine the orientation (Main Orientation, Flat Orientation) and in the CRYSO_MEASURE program can be reduced by selecting a group. If you have a lot of sample types stored, this will make it a lot easier to find a particular sample type. The values for the lattice parameters are required for calculation of the lattice plane distances and the angles between the different crystallographic directions.The method for calculating the main orientation can be selected in the Method for Main Orientation input group. Usually this should be set to Full Phi Range. If the orientation error exceeds 5° the Partial Phi Range method should be used.A list box in the right upper part of the dialog show all sample types available. When you click on an item in the list, all of its parameters are loaded into the corresponding input boxes. The fields for the main orientation parameters are dependent on the values given in the Method for Main Orientation input group.To determine the main orientation in Full Phi Range the following parameters have to be specified in the Main Orientation tab: Measurements Number of measurement positions used to measure a spectrum φ Time Measurement time of a spectrum Sample points Number of sample positions. With this feature it is possible to carry out a semiautomatic determination of the main orientation at different locations on the sample. Energy range Selection of the MCA energy range Line range Boundaries of the region wherein the Laue peak is expected Voltage High voltage of X-ray tube. Current X-ray tube current. Indices The indices of the lattice plane normal vectors The number of measurement positions φ can be 2, 4, 8, or 12. The following angles φ are used in each case: Meas. positions Angle φ 2 Spectra 7 0°, 90° 53 Crystal Orientation 4 0°, 90°, 180°, 270° 8 0°, 45°, 90°, 135°, 180°, 225°, 270°, 315° 12 0°, 30°, 60°, 90°, 120°, 150°, 180°, 210°, 240°, 270°, 300°, 330° To determine the main orientation in Partial Phi Range the following parameters have to be specified: Measurement time of a spectrum for the coarse scan Coarse Scan Time Coarse width Scan Step Step width for the coarse scan Fine scan Time Measurement time of a spectrum for a fine scan FineScan Step width Step width for the fine scan Measurements Number of measurement positions φ for a fine scan Φ target Target angle φ – this entry is only required if CRYSO_MEASURE shall carry out the measurement without a coarse scan Sample points Number of sample positions. With this feature it is possible to carry out a semiautomatic determination of the main orientation at different locations on the sample. Energy range Selection of the MCA energy range Line range Boundaries of the region wherein the Laue peak is expected Voltage High voltage of X-ray tube. Current X-ray tube current. Lattice (Main)/Indices Angle Plane Indices of the lattice plane used for the measurement of the main orientation Estimated value of the orientation error δ Enter the Formulas to calculate user-specific results from the calculation of the main orientation in the Formulas tab: 1: Formula to calculate the value Result 1 Formula to calculate the corresponding error 2: Formula to calculate the value Result 2 Formula to calculate the corresponding error The formulas can comprise any expression of the form y=f(x). The left-hand symbol can be any valid identifier. On the right-hand side, you can use the special symbols $D, $G, $DD, and $DD: $D Value of the orientation angle δ $G Value of the orientation angle γ $D Standard deviation of δ $GG Standard deviation of γ It is possible to create arbitrary mathematical expressions using the variables and constants mentioned above. The four basic mathematical operations +, -, * and / can be used, as well as any number of nested 54 User Manual Crystal Orientation parenthetical expressions. The mathematical functions sin, cos, tan, arcsin, arccos, arctan, abs, exp, ln, sqr, and sqrt are available.To determine the flat orientation the following parameters have to be defined: Measurement time of a spectrum for the coarse scan Coarse Scan Time Coarse width Scan Step Step width for the coarse scan Fine scan Time Measurement time of a spectrum for a fine scan FineScan Step width Step width for the fine scan Measurements Number of measurement positions φ for a fine scan Φ target Target angle φ, – this entry is only required if CRYSO_MEASURE shall carry out the measurement without a coarse scan Phi(Flat)), Target angle for the flat plane. This value is only active if the corresponding check box is marked. In CRYSO_MEASURE, this value is used to derive the flat angle from the difference observed with the value entered here. Energy range Selection of the MCA energy range Line range Boundaries of the region wherein the Laue peak is expected Off angle main This box is to be checked when measuring the flat for crystals with large off angles. δ Target angle δ of the main orientation (only if Off angle main is checked) γ Target angle γ of the main orientation (only if Off angle main is checked) Φ(Meas) Azimuthal direction of the measuring plane (not for cubic crystal systems and only if Off angle main is checked) Voltage High voltage of X-ray tube. Current X-ray tube current. Lattice (Meas)/Indices Plane Indices of the lattice plane used for the measurement of the flat orientation Lattice (Flat)/Indices Plane Indices of the flat lattice plane The Lattice Plane (Meas) and Lattice Plane (Flat) angles are to be understood as the angles formed with respect to the main orientation, in each one of those directions. The Lattice Planes panel shows the potential Laue peaks of the substance under scrutiny. The table contains: No. consecutive number HKL Indices of the lattice plane. The possible values are constrained through extinction rules. d Lattice plane offset E Energy for orientation δ=0° Click on the Extinc. Rules button to display the dialog box to enter extinction rules.The Search tab allows you to enter the following parameters for the automatic determination of an unknown orientation: Spectra 7 55 Crystal Orientation Min. energy Lower boundary of the search range Max. energy Upper boundary of the search range Min.counts per second Minimum pulse rate for recognition of a peak Counts for measurement single Minimum number of pulses for a single measurement. This value is used to calculate the measurement time for a single measurement. Time for test Measurement time for the test measurement Excluded ranges Energy ranges that will be excluded in the peak search (e.g. ranges where fluorescence is known to occur) The functions of the other elements to be found in the Sample Type window are as follows: Clicking the default button next to Line Range causes the software to calculate suggested values for the left and the right bound of the peak range based on the specified lattice plane offsets and a maximum orientation error of δ=5° Default Clicking the default button next to Φ target causes the software to calculate the target angle φ. Creates a new sample type with the parameter values from the input fields Insert Replace The parameter values of the sample type selected in the list box are overwritten with the current values from the input fields. Remove Deletes the sample type selected in the list box. Import Loads a sample type from a project file Copy Copies the parameters of the sample type to the Windows clipboard The changes carried out through the buttons described above need to be confirmed by clicking on the OK button. Please note that after you’ve clicked OK, the parameter values of the sample type selected in the list box are overwritten with the current values from the input fields. Clicking Cancel reverts all the changes. 8.2 Extinction Rules In this dialog box, enter the rules for the reflexes that are permitted for the HKL generation. These rules are determined by the possible symmetry operations in an elementary cell. Restrictions as regards the possible HKL are due to the lattice type, the existing glide planes and the rotation axes. It is also possible to enter directly the Miller indices of accidental extincted reflections. Rules of dependency on the lattice type Restriction Lattice Type Lattice Symbol all (hkl) simple P, C(hex.), R h + k + l = 2n body-centered I h + k = 2n (001) face-centered c h + l = 2n (010) face-centered b k + l = 2n (100) face-centered A 56 User Manual Crystal Orientation h + k = 2n h + l = 2n k + l = 2n face-centered F h - k = 3n hexagonal simple H -h + k + l = 3n or h - k + l = 2n rhombohedral lattice, indicated with hexagon axes R h + k + l = 3n hexagonal simple lattice, indicated by rhombohedral axes P, C(hex.) Rules of dependency on the glide planes Reflex type Restriction Glide plane Symbol of glide plane (hk0) h = 2n Glide plane perpendicular to c, component a/2 A k = 2n Glide plane perpendicular to c, component b/2 b h + k = 2n Glide plane perpendicular to c, component a/2 + b/2 n h + k = 4n Glide plane perpendicular to c, component a/4 + b/4 d h = 2n Glide plane perpendicular to b, component a/2 a l = 2n Glide plane perpendicular to b, component c/2 c h + l = 2n Glide plane perpendicular to b, component a/2+c/2 n h + l = 4n Glide plane perpendicular to b, component a/4+c/4 d k = 2n Glide plane perpendicular to a, component b/2 b l = 2n Glide plane perpendicular to a, component c/2 c k + l = 2n Glide plane perpendicular to a, component b/2+c/2 n k + l = 4n Glide plane perpendicular to a, component b/4+c/4 d l = 2n Glide plane perpendicular to [110], component c/2 c h = 2n Glide plane perpendicular to [110], b (h0l) (0kl) (hhl) Spectra 7 57 Crystal Orientation component a/4 + b/4 h + l = 2n Glide plane perpendicular to [110], component a/4+b/4+c/2 n 2h + l = 4n Glide plane perpendicular to [110], component a/4+b/4+c/4 d Rules of dependency on the rotation axes Reflex type Restriction Rotation axis Symbol of rotation axis (h00) h = 2n Rotation axis parallel to [100], component a/2 21, 42 h = 4n Rotation axis parallel to [100], component a/4 41, 43 k = 2n Rotation axis parallel to [010], component b/2 21, 42 k = 4n Rotation axis parallel to [010], component b/4 41, 43 l = 2n Rotation axis parallel to [001], component c/2 21, 42, 63 l = 3n Rotation axis parallel to [001], component c/3 31, 32, 62, 64 l = 4n Rotation axis parallel to [001], component c/4 41, 43 l = 6n Rotation axis parallel to [001], component c/6 61, 65 h = 2n Rotation axis parallel to [110], component a/4+b/4 21 (0k0) (00l) (hh0) 8.3 Position Rules The automatic measurement at different sample positions on a D2 CRYSO device with xy-translation unit requires establishing a position rule. A position rule is composed of any number of scan specifications. A scan is understood to mean: • a series of single points, • a series of equidistant points along a line, • a series of equidistant points distributed over a rectangle, or • a series of equidistant points along the perimeter of a circle. The definition of the characteristic points of a given scan is done by entering their coordinates.Any number of position rules can be stored in the database. The desired position rule is to be selected within the CRYSO_MEASURE software. You cannot change this database from within CRYSO_MEASURE.The list 58 User Manual Crystal Orientation box in the Position Rules input group shows all available position rules. The list box in the Scans input group shows all the scans belonging to the selected position rule. The controls in the Position Rules input group have the following functions: Input field for the name of the position rule. The name of an existing position rule can not be Name modified. Group Every position rule can be assigned to a group using this combo box. You can choose the name of an existing group from the list or enter the name of a new group. Within the CRYSO_MEASURE program, the number of position rules displayed in the Position Rules list box can be reduced by restricting the items displayed to those belonging to a specific group. This will make it easier to find a particular position rule if you have a large number of position rules defined. Date Date/Time a position rule was created New Creates a new position rule. It must be given a name that is not yet used in the database. The position rule thus created does not contain any scans yet. Remove Removes the position rule selected in the list box. The scan type can be specified in the Scan Type input area. Depending on the scan type, the contents of the middle input group on the right side changes.The controls in the Scans input group have the following functions: Input field for the name of a position rule. The names of the scans of a given position rule must be Name unique. Moves the scan up in the list box Moves the scan down in the list box Add Add a scan to the position rule. The parameters of the scan are taken from the Scan Type input area and from Points/Line/Rectangle/Circle. Replace Replace the parameter values of the selected scan with the parameter values from the Scan Type input group and from Points/Line/Rectangle/Circle. Remove Remove a scan from a position rule The type of sample for the position rule is to be selected in the Sample Type choice field. This choice is only preliminary and can still be changed from within CRYSO_MEASURE. The following parameters have to be entered for the different scan types: A sequence of any number of x-y coordinates can be entered into the table. The Delete and Point Delete All buttons will delete a single point and all points in the table, respectively. Line The starting point and end point of the line along which the measuring head shall travel are to be entered here. The Spot distance input specifies how far apart the measuring points are to be from each other along this line. The number of measuring points is then derived from the length of the line and the spot distance. The actual spot distance will then be calculated based on the length of the line and the number of measuring points. In this way it is guaranteed that a measurement will also be taken exactly at the end point. Rectangle The x-y coordinates of the starting point and of the end point of a baseline (First and Last) and the width of the area (Total Width) are to be entered. One should take care to note that the directions implied by the starting point, the end point, and the width unambiguously define the measurement area. The distance between measuring points both parallel to the baseline and Spectra 7 59 Crystal Orientation parallel to the width is to be specified in the Spot distance field. The number of measurement points both along the baseline and along the width is then derived from the length of the baseline and from the width divided by the spot distance. Then the actual spot distance in each direction is calculated based on the lengths of the sides and the number of measurement points. The x-y coordinate of the center of the circle (Centre) and the radius (Radius) are to be entered. The Spot distance input specifies how far apart the measuring points are to be from each other along the perimeter of the circle. Alternatively, you can specify the number of measurement points along the perimeter of the circle. If you change the number of the measurement points, the program calculates the spot distance based on the circumference of the circle, and vice versa. Circle The Estimated measuring time field group displays: Points of scan Number of points in the scan Length of line Length of the line (Line) Area rectangle Area of circle of Area of the rectangle (Rectangle) Area of the circle (Circle) Total points of Total number of points in the position rule rule Total time Total measurement time implied by the position rule. Every φ setting is measured at every (x,y) position. Optimized Total measurement time implied by the position rule. Every (x,y) position is measured at every φ setting. The left side of the dialog box shows a graphic representation of all the measurement points of the position rule. The points of the selected scan are red, while the others are blue.Clicking OK saves all changes to the database. 8.4 Calculation of the Main Orientation The Analyze/Main Orientation command is used to calculate the main orientation of a crystal. At first, a project file of the measurement has to be opened by using the File/Open Project command. Thereafter the project explorer has to be expanded to display the measured spectra by selecting the node Main and executing the Project/Display Spectra command . After the command Analyze/Main Orientation is executed, the program will automatically load the sample type saved in the project file into the Sample type list box. If the sample type is not found in the database, a warning will be displayed. This warning will also be displayed if the sub-selection of sample types of the corresponding group does not contain the required sample type defined in the project. After the sample type is selected, the data of the sample type in the project file relevant for the evaluation will be compared to the corresponding data in the sample type database. If there are differences, a warning will be displayed as well. If no differences are found, the calculation of all Laue-Peaks and the calculation of the main orientation will be carried out automatically. If differences occur, they should be corrected. Afterwards, the values of the φ angles and the energies of the Laue-Peak maxima that are required for the spectrum evaluation can be determined by using the option Get Values. The data pairs φ/energy will automatically be transferred into the list box. Please note that the 60 User Manual Crystal Orientation program tries to determine a value pair φ/energy for all spectra that are present in the spectra window. Therefore it is recommended to display only those spectra that are required to carry out the evaluation. Another option to determine the data pairs φ/energy is to move the line cursor in the spectra window onto the Laue-Peak that is used for evaluation. The energy of the peak maximum will then directly be displayed in the Energy display panel. For exact determination of the peak energy a parabola is fitted through the peak maximum. After this, the corresponding angle φ has to be entered in or selected from the combo box Phi. This command is finalized by clicking the Add button or the Replace button. This procedure has to be carried out for all spectra to determine all data pairs φ/energy. If the measured data was stored into individual “spx” files, then the sample type has to be selected from the Sample type list box. If a large number of sample types have already been defined, selecting a group of sample types from the Group list box helps to simplify this procedure. The incident angle can also be fitted during the regression calculation by selecting the Fit feature by checking the appropriate box. It is then possible to check the incident angle using a crystal with known displacement. After this the calculation can be started via the button Calculate. The orientation angles δ und γ derived from the value of the incident angle calculated by the fitting procedure, the values 1 and 2 as the result of the formulae evaluation and their standard deviations are displayed in the corresponding display panels. For this calculation, it is always required that a measurement has been carried out at the angle positions φ=0° and φ=90°. If only two angles φ were measured, then the orientation angles are determined directly. If more than two angles φ were used, then the orientation angles are determined by regression analysis. In this case, the Plot button can be used to display the history of calculated dependencies of energy from the angle φ including the supporting points in the form of a graphic. Thus it is simple to notice typing mistakes. The Spacing (calc) panel displays the lattice plane distance calculated using the lattice parameters. The Spacing (obs) panel displays the lattice plane distance of the main direction estimated from the energies at φ=0°, 90°, 180° and 270°. A warning indicates a difference larger than 0.008 Å between these two lattice plane distances. There will also be a warning if the fitted incident angle differs more than 0.2° from the adjusted value of the incident angle. As a rule, both warnings indicate that the wrong indices (Lattice Plane (Main)) or wrong lattice parameters (Crystal Data) are defined in the sample type or that the wrong LauePeaks were used forevaluation. The Copy button transfers the result of this calculation onto the windows clipboard. The Add, Replace, Remove and Remove All buttons are used to edit the list of the data pairs φ/energy. The functions of these buttons are described below: Add Adds data pairs from the input boxes Phi and Energy to the list. Replace Replaces the data pair that was selected in the list box with the values typed into the inputboxes Phi and Energy. Please note that by changing the input box, the correspondingvalues are also copied into the input boxes Phi and Energy. Remove Removes a selected data pair from the list. Remove All Removes all entries from the list. The Plot button can be used to show the history of calculated dependencies of energy from the angle φ including the supporting points in one window. Large deviations of the supporting points from the calculated function indicate an inaccurate measurement. Further reasons can be that the wrong indices (Lattice Plane (Main)) or wrong lattice parameters (Crystal Data) for the sample type were entered or that the wrong Laue- Spectra 7 61 Crystal Orientation Peaks were used for evaluation. The graphic can be copied to the windows clipboard in *.EMF format using the Copy button. To store the results of the calculation into the project data file, the Project/Add Result command should be used. It is important that the File/Save Project As command be executed to save the project. 8.5 Calculation of the Flat Orientation The flat orientation of a crystal can be calculated using the command Analyze/Flat Orientation. At first, a project has to be opened by using the File/Open Project command. Thereafter the project explorer has to be expanded to display the measured spectra by selecting the node Flat and executing the command Project/Display Spectra. After the command Analyze/Flat Orientation is executed, the program will automatically load the sample type saved in the project file into the Sample type list box. If the sample type is not found in the database, a warning will be displayed. This warning will also be displayed if the subselection of sample types of the corresponding group does not contain the required sample type defined in the project. After the sample type is selected, the data of the sample type in the project file relevant for the evaluation will be compared to the corresponding data in the sample type database. If there are differences, a warning will be displayed as well. If no differences are found, the calculation of all Laue-Peaks and the calculation of the flat orientation is carried out automatically. If differences occur, they should be corrected. Afterwards, the values of the φ angles and the energies of the Laue-Peak maxima that are required for the spectrum evaluation can be determined by using the option Get Values. The data pairs φ /energy will automatically be transferred into the list box. Please note that the program tries to determine a value pair φ/energy for all spectra that are present in the spectra window. Therefore it is recommended to display only those spectra that are required to carry out the evaluation. Another option to determine the data pairs φ/energy is to move the line cursor in the spectra window onto the Laue-Peak that is used for evaluation. The energy of the peak maximum will then directly be displayed in the Energy display panel. For exact determination of the peak energy a parabola is fitted through the peak maximum. After this, the corresponding angle φ has to be entered in or selected from the combo box Phi. This command is finalized by pushing the button Add or the button Replace. This procedure has to be carried out for all spectra to determine all data pairs φ/energy.If the measured data was stored into individual “.spx” files, then the sample type has to be selected from the Sample type list box. If a large number of sample types have already been defined, selecting a group of sample types from the Group list box helps to simplify this procedure. The values for displacement of the main direction which were determined beforehand have to be filled into the input boxes labeled δ and γ. As a default, these input boxes show the values that were used for the last calculation of the main orientation. After this the calculation can be started via the button Calculate. The orientation angles δ and γ of the measurement levels, their standard deviations and the angle of flat φ will be displayed in the corresponding display panels. Please note that the correct values should be entered into the fields behind the symbols δ und γ. The orientation angles will be calculated using a regression function.The Copy button transfers the result of this calculation onto the windows clipboard. The Add, Replace, Remove and Remove All buttons are used to edit the list of the data pairs φ/energy. The functions of these buttons are described below: Add Adds data pairs from the input boxes Phi and Energy to the list. Replace Replaces the data pair that was selected in the list box with the values typed into the inputboxes Φ and Energy. Please note that by changing the input box, the correspondingvalues are also copied into the input boxes Φ and Energy. Remove Removes a selected data pair from the list. Remove All Removes all entries from the list. 62 User Manual Crystal Orientation The Plot button can be used to display the history of calculated dependencies of energy from the angle φ including the supporting points in one window. Large deviations of the supporting points from the calculated function indicate an inaccurate measurement. Further reasons can be that the wrong indices (Lattice Plane (Meas)) or wrong lattice parameters (Crystal Data) for the sample type were entered or that the wrong LauePeaks were used for evaluation. The graphic can be copied to the windows clipboard in *.EMF format using the Copy button. To store the results of the calculation into the project data file, the Project/Add Result command can be used. It is important that the File/Save Project As command be executed to save the project. 8.6 Mapping Results After loading a project file with a measurement of the D2 CRYSO with x-y positioning stage, the results are displayed in the Mapping Results panel. In the right part of the window, the table results are displayed: No. consecutive number x x-coordinate of the position y y-coordinate of the position δ δ angle of the main orientation σ(δ) standard deviation of the δ angle of the main orientation γ γ angle of the main orientation σ(γ) standard deviation of the γ angle of the main orientation R1 result value calculated from the formulas σ(R 1) standard deviation from the result value calculated from the formulas. R2 result value calculated from the formulas σ(R 2) standard deviation from the result value calculated from the formulas. φ φ angle of the flat σ(φ) standard deviation of φ angle of the flat In the last for rows, the following values are given for the δ, γ, and φ columns: A mean value R difference between largest and smallest value σ standard deviation from the mean value R/2A quotient stemming from half of the difference between the largest and smallest value and the mean value On the left side of the window, the results are displayed in a graphic. One of the following display options may be chosen: δ/γ Spectra 7 δ and γ are displayed as arrows.. The length of the arrow is proportional to the orientation angle δ. In the input fields for Rmin and Rmax, the length of the arrows can be scaled. The arrow’s 63 Crystal Orientation direction is determined by orientation angle γ in the sample coordinate system. The graphic thus corresponds to a projection of lattice plane norms on the x-y-level. δ δ is displayed as a colored point in the graphic. In the Point diameter input field, the diameter of the point can be adjusted. Clicking on the colored area behind Color 1 and Color 2 will open a color selection dialog where the color for the minimal and maximal value of δ may be chosen. The colors for the values between the two are interpoliert. The attributed values of δ are shown above the colored areas. γ γ is displayed as a colored point in the graphic. In the Point diameter input field, the diameter of the point can be adjusted. Clicking on the colored area behind Color 1 and Color 2 will open a color selection dialog where the color for the minimal and maximal value of γ may be chosen. The colors for the values between the two are interpoliert. The attributed values of γ are shown above the colored areas. φ φ is displayed as a colored point in the graphic. In the Point diameter input field, the diameter of the point can be adjusted. Clicking on the colored area behind Color1 and Color2 will open a color selection dialog where the color for the minimal and maximal value of φ may be chosen. The colors for the values between the two are interpoliert. The attributed values of φ are shown above the colored areas. By checking the δ/γ, δ, γ and φ under Report, you can choose which graphic should be displayed in the report. By clicking on a row on the table, the corresponding point in the graphic will be colored red and the corresponding entry is marked in the project display. By clicking on a point on the graphic, the cursor will go to corresponding point in the table the corresponding entry is marked in the project display. 8.7 D2 CRYSO Results Report The Report panel is displayed when a D2 CRYSO project file is loaded. A results report will be created when you click on the Report panel. The layout of the report will depend on whether the project was done on a D2 CRYSO with or without an xy-translation unit. The first table shows the information that is shared in both layouts: Operator Name of the user under whose login the project was created Sample Sample name Sample Type Type of sample with which the measurement was carried out File Path and name of the project file In case of a D2 CRYSO report, the following is then output: Results Orientation Main Results under the main orientation Delta δ angle of the main orientation Gamma γ angle of the main orientation 64 User Manual Crystal Orientation Result 1 result value calculated from the formulas Result 2 result value calculated from the formulas Sigma(Delta) standard deviation of the δ angle of the main orientation Sigma(Gamma) standard deviation of the γ angle of the main orientation Sigma(Result 1) standard deviation from the result value calculated from the formulas. Sigma(Result 2) standard deviation from the result value calculated from the formulas. Flat Results under the flat orientation Results Orientation Delta Angle δ of the measuring plane Gamma Angle γ of the measuring plane Sigma(Delta) Standard deviation of the angle δ of the measuring plane Sigma(Gamma) Standard deviation of the angle γ of the measuring plane Phi φ angle of the flat When there are several sample points in the measurements, the results are output in tabular form. Then will follow the graphic representations activated in the Mapping Results panel.The toolbar of the Report panel contains the following functions: Zoom in on the report Zoom out on the report Print the report. A printer must be installed at the OS level. Before confirming the print job, you will be able to select the printer you want to use. Export the report as PDF file. You can enter the filename you want. Use the Report Designer (Options/Report Designer) to change the layout of the report. 8.8 Results Database The CRYSO_MEASURE program logs all measurements in a file called CRYSO_CONTROL.CSV. The format of the entries changes depending on the type of measurement: Measurement of the The results of the measurement are written to one line in the file (see the table main and flat orientation below). Determination of an The values Sample, Sample type, Date/Time, User, δ (Main), γ (Main), Result 1 unknown orientation (Main) and Result 2 (Main) are written to one line in the file. δ (Main) and γ (Search) (Main) are the angles describing the unknown orientation being sought. Mapping The values Sample, Sample type, Date/Time, User, Project File, δ (Main), σ(δ) (Main), γ (Main) and σ(γ) (Main) are written to one line in the file. δ (Main) und γ (Main) are the means of the measurements at all positions (x,y) and σ(δ) (Main) und σ(γ) (Main) are the standard deviations of the means. If the flat orientation Spectra 7 65 Crystal Orientation was measured as well, then the values for δ (Meas), σ(Delta) (Meas), γ (Meas), σ(γ) (Meas) and φ/° (Flat) are written out as well. To see the contents of the file in tabular form, issue the Analyze/Results Database command.The individual columns will contain the following information (the first column will contain a sequential number): Name of the sample Sample Sample Type Sample type δ/° (Main) Angle δ of the main orientation σ(δ) (Main)/° standard deviation of the δ angle of the main orientation γ/° (Main) γ angle of the main orientation σ (γ)/°(Main) Standard deviation of the main orientation angle γ Result 1 (Main) User-specific calculated value (calculated by means of Formula 1 of the sample type) σ(Result 1) (Main) Standard deviation of the user-specific calculated value Result 2 (Main) User-specific calculated value (calculated by means of Formula 2 of the sample type) σ(Result 2) (Main) Standard deviation of the user-specific calculated value δ/° (Meas) Orientation angle δ of the measurement plane σ(Delta)/° (Meas) Standard deviation of the angle δ of the measuring plane γ/° (Meas) Orientation angle γ of the measurement plane σ(γ)/° (Meas) Standard deviation of the angle γ of the measuring plane φ/° (Flat) Azimuthal angle πφ of the flat plane Date/Time Date/Time of measurement User User name Project File Path and name of the project file The columns to be displayed can be configured in the Columns input area.You can sort the table by the values of one column in ascending order by clicking on the header of that column. Clicking on the same column again will reverse the sort order.The Constraints For Selection input area allows you to set filters for the displayed rows. A logical AND will be performed if more than one constraint is specified. You can specify the following conditions: Without date No date constraint constraint Between Only display measurements that were done between the dates specified. By clicking on the button next to the input fields the date can be chosen from a calendar. During the previous Display the measurements done in the previous x weeks (x=1...52). The number of weeks is to be specified via the input field next to the label. x week(s) During the previous Display the measurements done in the previous x days (x=1...365). The number of days is to be specified via the input field next to the label. x day(s) During the previous Display the measurements done in the previous x hours (x=1...240). The number of 66 User Manual Crystal Orientation x hours(s) hours is to be specified via the input field next to the label. User Display the measurements don by a specific user or a specific group of users. The name is to be specified via the input field next to the label. The name can be chosen from the list. It is also possible to type the names in directly, with wildcards: “?” (question mark) will match any character and “*” (star) will match any string of arbitrary length (including the empty string). This makes it possible to select multiple users. Sample Display the measurements of one or more samples. The sample name is to be specified via the input field next to the label. Wildcards are available: “?” (question mark) will match any character and “*” (star) will match any string of arbitrary length (including the empty string). This makes it possible to select multiple samples. Sample Type Display the measurements of one or more sample types. The sample type is to be specified via the input field next to the label. The sample type can be chosen from the list. It is also possible to type the names in directly, with wildcards: “?” (question mark) will match any character and “*” (star) will match any string of arbitrary length (including the empty string). This makes it possible to select multiple sample types. After you have changed the filter constraints, you must hit the Refresh button to see them reflected in the result list.The Print Options input area shows the options for printing. You can choose to have the results output directly to the print (Print) or to see a preview of the printed output (Preview). You can also launch the printing from within the print preview window. You can use the Printer list box to choose which of the printers installed on your system you would like to use for the print job.You need to have one or more rows selected in the table to use the buttons described in the following list. You can select a single row by leftclicking anywhere on the row. You can select several rows in a row by pressing down on the left mouse button on the row at one end of the range of rows you are interested in selecting and then, without releasing the mouse button, swiping the mouse pointer over the rest of the rows you wish to select, or by selecting the row at one end of the range of rows you wish to select and then left-clicking on the row at the other end of the range while pressing down the Shift key. You can select another row or range of rows that are unconnected to the previously selected ones by pressing the Control key and left-clicking on the new row or left-clicking and swiping over the new rows.The dialog box contains the following functions: Load Load and display a results database Move to Move the selected rows of the table to another database, to be entered by name. If the database exists, the rows will be added at the end of the table. Copy Copy the selected rows and the column headers to the Windows clipboard. Print Table Print the selected rows in tabular form. The page is printed in landscape mode. The font size is adjusted to the table width. If you are printing particularly wide columns such as Sample, Sample Type, or Project File, you may want to consider limiting the number of columns displayed in order to obtain a printed result that is easily legible. Load Project Display the project file corresponding to a measurement in the Spectrum window. This button is activated only when a single table row is selected. Help Calls up the help file Close Closes the window Spectra 7 67 Crystal Orientation 8.9 Identification of Lattice Planes and Calculation of the Target Orientation This command helps identify lattice planes from the measurement of energy positions at three different angles φ and to calculate a target orientation on the basis of two known orientations. The sample type can be selected on the upper part of the dialog. If a large number of sample types have already been defined, selecting a group of sample types from the Group list box helps to simplify this procedure. The angle of incidence can be introduced in the field α. The register permits the selection of the operation to be executed: HKL identification Identification of lattice planes Orientation Calculation of a target orientation on the basis of two known orientations. Identification of lattice planes The angles φ and the corresponding energies E can be introduced in the fields φ1, φ2, φ3, E1, E2 und E3. 2ϑ is the detector angle and ΔE indicates the maximum deviation of the theoretically calculated energies from the experimental values. The calculation of the possible lattice planes takes place after activation of the button Calculate. The result table contains information on the Miller indices HKL, the distance between lattice planes d, the orientation of the lattice planes (Delta and Gamma) and the deviation of calculated and experimentally ascertained energy. Using the Copy button will send the contents of the dialog field to the Windows clipboard. Calculation of a target orientation on the basis of two known orientations The fields after 1. plane and 2. plane are to be filled with the Miller indices HKL and the experimentally calculated orientations (δ and γ) of two lattice planes. The Miller indices HKL of the lattice plane for which the orientation is being calculated should be introduced after the field 3. plane. Using the Calculate button will calculate the orientation of the target plane. The result table contains the orientation angles δ and γ and the values 1 and 2 as result of the formula evaluation. If detector angle 2 Theta is adjustable on the device, this angle together with the angle Phi and the expected energy E will also be displayed. Using the Copy button will send the contents of the dialog field to the Windows clipboard. 68 User Manual