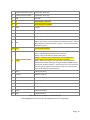
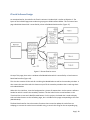
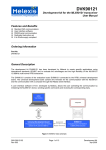
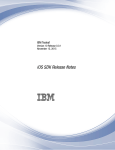
1
Virtual Guide Systems
PCP 0802
A Major Qualifying Project Proposal
Submitted to the faculty
of
Worcester Polytechnic Institute
in partial fulfillment of the requirements for the
Degree of Bachelor of Science
by
__________________
Karan Arora
On 5th May 2009
Approved:
_________________________
Prof. Pedersen, Project Advisor
Table of Contents
1. Introduction
2. System Description
3. Theory related to the RFID Module
a. Why RFID
b. Introduction
c. In-depth Analysis
i. Quality Factor Q
ii. Coupling Factor k
iii. Backscatter Modulation
d. RFID Reader Board Communication
4. Theory related to iTouch
a. Why iTouch
b. Introduction
c. Stats
d. Programming
i. The SDK
ii. Cocoa Touch
iii. Xcode
e. iTouch Communication
5. System Design
a. iTouch Software Design
b. RFID Module
i. RFID Reader Board
ii. Software Design
6. Testing and Measurements
a. Range and Orientation
b. Battery Life
c. Timing Cycle
7. Looking into the Future
8. The Budget
9. The Citations
10. Appendixes
a. Code Listing – iPod Software
b. Code Listing – RFID Module
c. Power Booster Schematic
d. User Manual
2
4
6
7
10
11
12
14
16
18
19
19
20
20
21
21
22
25
28
34
35
38
41
41
41
43
44
45
Page | 1
1 INTRODUCTION
We have all visited museums and gone on tours where we are given an audio (and sometimes video)
device. To use this device we walk around the museum and when we see something we are interested
in we stop, type the number displayed next to the exhibit into the device and listen (or view) the
relevant data. These have been around for a while now. A recent innovation was the GPS audio tour
guide systems for cities in Europe. [1]
Another notable innovation in the tour guide industry is RFID technology. For example, the Museum of
Siena University gives its patrons an RFID tracker embedded in a replica of an 800 year old staff. The
individuals can then walk around and wave the staff at exhibits they find interesting. The last exhibit of
the museum is a computer terminal at which the user waves the staff on the reader. The computer then
displays all pictures and information on each of the displays that they found interesting. They can then
edit out which ones they want and email those to themselves or friends. [2]
The Cleveland Museum of Art is planning to deploy a data gathering system using RFID in its museum in
October. However, this will not be to improve the user experience but rather to collect data on how
individuals or groups approach exhibits so that the museum can use this information when it undergoes
renovations next year. While this has created a little controversy about privacy issues, the museum is
not tracking personal data and hence this has not become a big issue. [3]
What this project proposes is to update the personal tour experience. It proposes a device that not only
has audio and video but also knows when the user has stopped at a particular exhibit and hence plays
the corresponding a/v file. The device will also feature the data logging feature seen in the Cleveland
museum.
One of the main reasons for this device is to give visiting parents and prospective students a unique
experience which will help them remember WPI. Another basic reason for implementation of this
project is the incoming freshman tour groups that visit Atwater Kent building (later referred to as AK). I
believe that such a device will motivate the incoming students while giving them the opportunity to play
around with a device prototyped in WPI. While giving potential students insight in what they can do
here, the device can also be used as an intellectual treasure hunt game to screen out the best talent in
the tour groups, by challenging the students to gather specific facts about the ECE department.
The goal is also to implement data logging to improve the undergraduate (or graduate) programs in ECE
in WPI. When tour groups come in, we can view which labs the potential students seem most interested
in. For example if 40% of the students visit the signals lab, we can predict that in three years the
advanced signals classes shall have more demand.
The basic theory behind this device is RFID tracking. The device we have envisioned includes a video
playing device attached to an RFID interrogator. We have RFID readers in the rooms and labs in AK
Page | 2
which communicate with a unique tag attached to the display device which can thereby tell which video
to play.
Through research and personal choice we have chosen the iTouch and a 13.56 MHz interrogator along
with passive tags.
The descriptions and reasons for choosing these shall follow later on.
Since the iTouch has a built in motion sensor and accelerometer, we can also track when the user has
stopped and thereby play videos only when the user is still.
Page | 3
2 System Description
Like all tour guide systems, our device has to be able to detect the location of the user. Unlike
commercially available systems, our system is supposed to do this without the user having to type in
numbers. Our device then has to be able to give the user the opportunity to view descriptive videos of
his or her choosing. In essence, the device has to fulfill all the requirements shown through the
flowchart in Figure 1.
Figure 1: System Usage Flowchart
An obvious result of having a device that detects its own location inside a building is that the device
needs to have two parts, a mobile part which the user can carry around, and a stationary part, placed
outside the research labs which can detect the proximity of the mobile module. The two parts must
have the ability to communicate with each other, preferably wirelessly.
The technical requirements to fulfill these system requirements, and their solutions, have been shown in
the next two sections. The solutions that ended up being chosen were an iTouch as the mobile module
Page | 4
which the user carried around and a RFID system for the stationary module proximity detection. It was
decided to have RFID reader boards outside each room, and a RFID tag attached to each mobile module
(iTouch). Figure 2 below shows a modification of the flowchart in Figure 1 to show the addition of the
iTouch as a mobile module and a RFID system as a stationary module.
Figure 2: System Description Flowchart
Page | 5
3 Theory related to RFID
Our needs:
1.
2.
3.
4.
5.
Read range of at least 10cm with a max range of 1m to prevent interference
Low power consumption of reader device so that it can draw power from video playback device.
Should not be too big or too heavy.
Ease of communication with video playback device.
The fixed sections in each room should have really long battery life or be powered from the wall
so we do not need to bother about them too much.
Possible Sensor Approaches:
1. RFID –
Range:
Shielding:
Cost:
Cons:
2. Infrared –
Range:
Cost:
Pros:
Cons:
3. Bluetooth –
Range:
Cost:
Shielding:
Pros:
Cons:
10cm to 10m (using passive RFID circuits)
up to 25m (using active RFID circuits)
Low frequencies – not impacted by body and metal shielding
High frequencies – metal shielding when within few centimeters of metal
UH frequencies – can be shielded even with layer of plastic
Low cost
Could face protests from privacy groups who believe RFID tags are a
intrusion on our privacy
Depends on line of vision. Gets absorbed by walls and human body.
Low cost.
Very little interference outside the room. IR sensors are easy to configure
If your back is to the transmitter then you won’t detect the signal
Very high (1m at 1mW to 100m at 100mW) [20]
Higher than the other 2 options
Very little shielding effects
Most cellular smart phones (Nokia N72, N95; iPhone; O2; HTC touch; Palm
Centro etc) have video play back facilities for Bluetooth video transfers
Interference between Bluetooth modules placed outside adjacent rooms
becomes a major issue
We have chose RFID as our design approach due to feasibility, cost and range features.
Page | 6
RFID – Introduction
It’s generally said that the roots of radio frequency identification technology can be traced back to
World War II. The Germans, Japanese, Americans and British were all using radar—which had been
developed in 1935 by Scottish physicist Sir Robert Alexander Watson-Watt—to warn of approaching
planes while they were still miles away. The problem was there was no way to identify which planes
belonged to the enemy and which were a country’s own pilots returning from a mission.
The Germans discovered that if pilots rolled their planes as they returned to base, it would change the
radio signal reflected back. This crude method alerted the radar crew on the ground that these were
German planes and not Allied aircraft (this is, essentially, the first passive RFID system). [4]
Under Watson-Watt, who headed a secret project, the British developed the first active Identify Friend
or Foe (IFF) system. They put a transmitter on each British plane. When it received signals from radar
stations on the ground, it began broadcasting a signal back that identified the aircraft as friendly. RFID
works on this same basic concept. A signal is sent to a transponder, which wakes up and either reflects
back a signal (passive system) or broadcasts a signal (active system). [4]
In the 1970’s the Los Alamos National Laboratory developed passive tags using ultra high frequencies for
the agricultural department for use in tracking sick cows and their medication dosages. [4]
Eventually, commercial procedure companies started using the 125 KHz radio wave band coupled with
RFID systems to identify goods sold instead of barcodes and later moved up the bandwidth to
13.56 MHz for supply chain usages.
The biggest turning point was in 2004-05 when Wal-Mart decided to make it compulsory for suppliers to
have an RFID tag on each consignment for stock records. Increased volumes resulted in further research
and a drop in prices thereby increasing volumes further.
An RFID couple is broken up into two parts, the reader (also known as the interrogator) and the tag (also
called a transponder). The reader sends out a signal which the tag detects. Then the tag either reflects
back a modulated signal or sends its own signal which the reader detects. This is used to identify the tag
as well as the data stored. This is shown as a top level diagram on the next page (Figure 3)
Page | 7
Figure 3: Active and Passive RFID Systems
There are two broad categories of tags in RFID systems—passive and active. Passive RFID tags do not
have a transmitter; they simply reflect back energy (radio waves) coming from the interrogator antenna.
Active tags have their own transmitter and a power source, usually—but not always—a battery (active
tags could draw energy from the sun or other sources). They broadcast a signal to transmit the
information stored on the microchip. Readers in active tag systems broadcast signals and then listen for
the active tag reply signal and on hearing it, parse the information and then pass it on to another device.
Passive tag systems work differently. The two passive devices communicate using backscatter
modulation. This basically means that the reader transmits a signal which the tag reflects. The tag
antenna and transistor system causes variations in the amplitude of the reflected wave at a much higher
frequency than the basic signal (sub carrier frequency). The reader then receives this signal and decodes
the message in the variations. Since in our system is one with passive tags, a more detailed diagram of
the passive tag is shown in Figure 4.
Passive tags are cheaper than active tags (20 cents to 40 cents) and require no maintenance, which is
why retailers and manufacturers are looking to use passive tags in their supply chains. However, passive
tags have a shorter read range, few inches at 125 KHz (Low Frequency RF) to 30 feet at 930 MHz (Ultra
High Frequency).
Radio waves behave differently at each of these frequencies, which means that different frequencies are
suitable for different applications. It is useful to think of low frequency waves as the waves that reach
your radio. They can penetrate walls well, but can't go through metal. Low-frequency tags are ideal for
applications where the tag needs to be read through material or water at close range. As you increase
the frequency of radio waves they start gaining range but losing penetration. They can't penetrate
materials as well and tend to bounce off many objects. Waves in the UHF band are also absorbed by
water.
Page | 8
The most common frequencies are the 125 KHz band and 13.56 MHz band. There are also a few 400
MHz and 900 to 930 MHz devices available. [5], [6]
Figure 4: RFID block diagram (with a passive tag) [17]
A typical RFID tag consists of a microchip attached to a radio antenna mounted on a substrate. The chip
can store as much as 2 kilobytes of data on its EEPROM (seen in Figure 4). For example, information
about a product or shipment such as date of manufacture, destination and sell-by date can be written to
a tag. Some tags also contain encryption hardware for security.
As mentioned earlier, our system shall be using passive tags. The tag shall be mobile and identify each
user uniquely. The RFID reader shall be fixed outside each room and uniquely identify each room. As the
user walks to a room, he/she can swipe the tag outside the room. At this point, our application can
uniquely identify where each user is in the building.
Page | 9
RFID – In-depth
We chose to use passive tags (they are more common and have fewer problems) and a 13.56 MHz band
(gives us the range that we need as well as being less affected by shielding).
In the wireless world, antennas are used to transmit radio frequency energy from location A to location
B in the most efficient manner, radiating the power that is fed to them. If we were dealing with UHF
(roughly 900 MHz) RFID systems, this hypothesis would be true. However, at 13.56MHz, the picture is
quite different. The wavelength in free space at 13.56 MHz is = 300/13.56 = 22.12 meters. A standard
ground plane antenna has a length of one quarter of the wavelength which is 5.53 meters. It has a
radiation resistance close to 50 ohms. In the world of 13.56 MHz RFID systems, we are unlikely to come
close to such dimensions. And even if we do, the amount of radiated power will remain quite small. Let
us consider an example. Say that we have a loop antenna and that its area is one square meter. The
radiation resistance, RR, is given by: RR = [Area2/ 2] * 31200 [7]. In our case, this yields RR = 130
milliohms and we probably have used 4 meters of wire to construct the loop, assuming a square shape
seen in Figure 5.
Figure 5: RFID Tags
So, if we do not radiate too much energy, how do we transfer enough energy to the passive tag (Figure
5) we intend to communicate with? The answer is magnetic coupling. Some people refer to HF
(13.56Mhz) RFID systems as “couplers”. This terminology is certainly quite appropriate in our case. We
have indeed to consider the RFID system, antenna plus tag, as a loosely coupled transformer, with the
interrogator acting as the primary of this transformer. This concept is of paramount importance for the
system designer. One must always remember it. The tag AND the antenna of the reader constitute THE
system, and cannot be studied separately.
The other point to remember is that if we feed 5W to a loop RFID antenna, these 5W, being NOT
radiated, will have to be dissipated somewhere. As a result, we shall need high power resistors in series
with the antenna to prevent it from suffering thermal damage.
Page | 10
The first module is our reader antenna (please refer to Figure 4). In order to maximize the
communication range with the tag, we must create the strongest possible magnetic field, so that the tag
will be able to pick up enough power in order to energize itself. Since the magnetic field from the loop is
proportional to the current flowing through the conductor that actually constitutes the loop, we have to
maximize this current. The second module is the tag. The tag wants to be able to collect in as much
energy as possible from the ambient magnetic field generated by the base station loop antenna. We
must maximize this energy gathering capacity. [7]
Quality Factor Q
From our base station antenna point of view, there is only one way to have a strong current flowing
through the conductors: the loop has to form a resonant circuit, tuned to the required frequency. The
same holds true for the tag. And here comes the first problem. If we had no data to transmit back and
forth, we could increase the Q factor of both devices up to the tolerances or the components used. This
would be the best way on both sides to fulfill our characters requirements. However, we must leave
enough bandwidth for the modulation side bands for both the tag and the base.
We can now define a set of rules for the minimum bandwidth requirements:
BW = FTOL + FSUB + Data Rate [7]
where:
BW is the minimum bandwidth, that is fc/2*Q, and our fc = 13.56 MHz [7].
FTOL is the frequency tolerance of the tuned circuit comprising the tag and reader antennas. The
Frequency Tolerance is the maximum permissible departure by the center frequency of the frequency
band occupied by an emission from the assigned frequency or, by the characteristic frequency of an
emission from the reference frequency. The frequency tolerance is expressed as a percentage [21].
FSUB is the sub carrier frequency. The Sub Carrier Frequency is the frequency of the data being
transferred on the main signal as a modulated wave. (Modulation is explained in detail later on)
And we must have Q <= fc/2 x BW (derived from the earlier equation)
This gives us a Q under 9. However we should also consider these bandwidth requirements only as a
good starting point, and always remember that only experimental results should say the final word. For
instance, it might be possible that designing a base station antenna with a slightly higher Q than what
theory suggests will increase the reading range, because the magnetic field strength improvement will
outweigh the reduction in the tag backscatter signal strength. In practical life, we see Qs ranging from 9
to 16 [7], [18], [22].
Page | 11
Coupling factor k
To analyze the coupling factor k, we shall look at the response graphs of the following example circuit
(Figure 6) which was modeled on SPICE by Melexis.
Figure 6: An antenna coupling system [7]
On the left is the base antenna, while the tag is on the right. For simplicity Q is chosen to be 9. k is
currently set to 0.1 but can be varied to simulate the movement of the user with respect to the tag. Also
the capacitors and inductors have been chosen so that resonating frequency (fc ) = 13.56MHz.
Page | 12
Figure 7: A graph representing power transfer between the two antennas in fig 3 with k = 0.1and
fc=13.56Mhz
Figure 8: A graph representing power transfer between the two antennas in fig 3 with varying k
Page | 13
As is clearly visible in Figure 7, the graph is not a perfect peak. While this is an ‘imperfection’, it is this
peak that allows a varied frequency response to the twin power peaks (of 15dB) while having a 14dB
transfer at 13.56MHz. This basically means that the two antennas can communicate with each other
using backscatter modulation.
Looking at Figure 8, we see that if k > 0.1 (for the 2 lines with the largest troughs) the 2 devices will have
problems communicating with each other while for k<0.5 (the 4 nearly perfect lines) will not have as
much energy transfer. [7]
NOTE: The variable k depends on the orientation of the two antennas relative to each other in free
space and the distance between them. If we consider the very base choice of circular coils and no
interference, we get –
where r1 = radius of 1st coil, r2 = radius of 2nd coil, A = tilt axis (if either is considered the normal), and
d=distance between the two coils. Solving, we get maximum k if r1=r2.
Backscattering Modulation
This terminology refers to the communication method used by a passive RFID tag to send data back to
the reader. By repeatedly shunting the tag coil through a transistor, the tag can cause slight fluctuations
in the reader’s RF carrier amplitude. The RF link behaves essentially as a transformer; as the secondary
winding (tag coil) is momentarily shunted, the primary winding (reader coil) experiences a momentary
voltage drop [8]. As seen in Figure 9, the graph on the right shows significant modulation while the
graph on the left has none.
Page | 14
Figure 9: Example of backscatter modulation [8]
This graph represents an example of one type of backscatter modulation. As you can see, a 0 is
represented by a sharp increase followed by a drop for this particular tag using EPC C1G1 protocol. The
C1G1 protocol is a commercial RFID protocol used by a few companies such as Plitek and Skyetek to
define standards such as bits/second and maximum modulation amplitude. Since there are many such
commercial protocols available, it’s advisable to check the data sheet of the RFID readers to see which
tags are compatible with it.
It is possible for backscatter modulation to show up to 60dB changes in the original signal in extreme
cases.
Figure 10 illustrates a few of the various types of backscatter modulation techniques.
Page | 15
Figure 10: Various encoding techniques for backscatter modulation [9]
RFID Reader Communication
Our RFID reader needs to communicate information regarding the detected tag with the outside world.
It can either do this through USB or RS232 links. Since our board uses RS232 and not USB, only RS232
has been explained below.
RS232 is a standard developed for serial communication such as between computers and modems.
However RS232 has been used extensively beyond this scope for connection various peripherals to
computers serially. RS232 has been around since 1969 and hence uses archaic voltage levels and
symbolism.
A typical RS232 connection has 3 wires, which are: transmit, receive and ground. In this simple
configuration, both communicating devices need to agree on a bit transfer rate (known as the BAUD
rate) in bits/second. Also, both devices need to know how many bits shall be present in each transfer.
Page | 16
The voltage levels for RS232, as mentioned before, are archaic and almost never seen elsewhere. A logic
low is represented by +12V and a logic high by -12V typically. However, the standard dictates the
receiver should be able to read any voltage between 3V and 15V to represent the logic levels (Figure
11).
Figure 11: Typical RS232 transfer
As can be seen in the figure, all transfers start with a logic 0 start bit and end with a logic 1 stop bit.
Some systems implement an even or odd parity bit to ensure that the correct data has been transferred.
This parity bit is sent just before the stop bit.
Page | 17
4 Theory related to iTouch
Our needs:
1.
2.
3.
4.
5.
Ease of use (for end user)
Programmable interface
Video and audio playback
Ease of communication with RFID interrogator
Storage for the videos
Possible video player interface devices:
1. iPhone or any other phone :
1. The iPhone has no infrared / RFID capabilities. All the new phones, which have
Bluetooth AND video capabilities, do not have infrared / RFID modules. However they
do have Bluetooth, so if we decide to use Bluetooth modules then a phone is the best
bet.
2. The iPhone SDK works only on MAC OSX which would mean learning a new OS and a
new language in which to code.
3. The flexibility of this device will be limited.
4. While initial costs will be lower per piece costs will be high due to having to procure x
number of devices for tour group usage.
5. Not having to build a video playback device saves us an entire design cycle
2. Building a device from scratch :
1. Much more time consuming having to design a receiver / video playback device.
2. We can design any receiver module we need into this device.
3. The device will only contain what we need (no need for calling capabilities) so its
footprint and per piece cost shall be lower.
4. We can use languages and platforms that we are familiar with to develop the code.
We chose the iPhone due to the fact that I do not have the expertise to build a player from scratch.
However, after looking into it a little deeper, we picked the iPod Touch (henceforth referred to as
iTouch) which basically consists of all the iPhone modules except access to any phone network, a
microphone, a camera, Bluetooth capability and a GPS receiver. The iTouch dock has a simple serial
interface which can be configured to communicate with the RFID interrogator. Also, the fact that we are
using the iTouch means that we can make a fancy GUI to supplement our application.
Page | 18
ITouch Introduction
The iPod Touch (trademarked iPod touch, always incorrectly referred to as the iTouch) is a portable
media player and Wi-Fi mobile platform designed and marketed by Apple Inc. The product was launched
on September 5, 2007 through an event called The Beat Goes On [2]. The iPod Touch adds the MultiTouch graphical user interface to the iPod line and is available with 8, 16, or 32 GB of flash memory. It
includes Apple's Safari web browser and is the first iPod with wireless access to the iTunes Store. With a
software update, which is sold by Apple, it also has access to Apple's App Store which includes 3rd party
applications such as ours [10].
Stats
Size and Weight
Height:
Width:
Depth:
Weight:
4.1 inches (110 mm)
2.4 inches (61.8 mm)
0.33 inch (8.5 mm)
4.05 ounces (115 grams)
Display
3.5-inch (diagonal) Multi-Touch color LCD
320 by 480 pixels at 163 ppi
Capacity
8GB, 16GB, or 32GB flash drive
Stores up to 1,750, 3,500, or 7,000 songs in 128-Kbps AAC format
Stores up to 10,000, 20,000, or 25,000 iPod-viewable photos
Stores up to 10 hours, 20 hours, or 40 hours of video
Audio
Frequency response: 20Hz to 20,000Hz
Audio formats supported: AAC (16 to 320 Kbps), Protected AAC (from iTunes Store), MP3 (16 to
320 Kbps), MP3 VBR, Audible (formats 2, 3, and 4), Apple Lossless, AIFF, and WAV
Video
H.264 video, up to 2.5 Mbps, 640 by 480 pixels, 30 frames per second, Baseline Profile up to
Level 3.0 with AAC-LC audio up to 160 Kbps, 48kHz, stereo audio in .m4v, .mp4, and .mov file
formats; MPEG-4 video, up to 2.5 Mbps, 640 by 480 pixels, 30 frames per second, Simple Profile
with AAC-LC audio up to 160 Kbps, 48kHz, stereo audio in .m4v, .mp4, and .mov file formats.
Battery
Built-in rechargeable lithium ion battery
Music playback time: Up to 36 hours when fully charged
Video playback time: Up to 6 hours when fully charged
Input and Output
Dock connector
3.5-mm stereo headphone jack
Wireless
Wi-Fi (802.11b/g)
[10]
Page | 19
iTouch Programming
The operating system (OS) is known as OSX and is based on the Darwin Foundation. Darwin is an open
source UNIX-based computer operating system released by Apple Inc. It is composed of code developed
by Apple, as well as code derived from NEXTSTEP, FreeBSD, and other free software projects. It has four
abstraction layers: the Core OS layer, the Core Services layer, the Media layer, and the Cocoa Touch
layer.
This layering provides the programmer with choices when it comes to implementing their code. For
example, the Core OS and Core Services layers contain the fundamental interfaces for iPhone OS,
including those used for accessing files, low-level data types, Bonjour services, network sockets, and so
on. These interfaces are mostly C-based and include technologies such as Core Foundation, CFNetwork,
SQLite, and access to POSIX threads and UNIX sockets among others.
As the programmer moves into the upper layers, he or she finds more advanced technologies that use a
mixture of C-based and Objective-C based interfaces. For example, the Media layer contains the
fundamental technologies used to support 2D and 3D drawing, audio, and video. This layer includes the
C-based technologies OpenGL ES, Quartz, and Core Audio. It also contains Core Animation, which is an
advanced Objective-C based animation engine.
In the Cocoa Touch layer, most of the technologies use Objective-C. The frameworks at these layers
provide the fundamental infrastructure used by one’s application. For example, the Foundation
framework provides object-oriented support for collections, file management, network operations,
among other things. The UIKit framework provides the visual infrastructure for the application, including
classes for windows, views, controls, and the controllers that manage those objects. Other frameworks
at this level give the application access to the user’s physical contact information and to the
accelerometers and other hardware features of the device.
As the iPhone/iTouch is based on a variant of the same XNU kernel that is found in Mac OS X, the tool
chain used for developing on the iTouch is also based on Xcode.
The SDK is broken down into the following sets:
Cocoa Touch
· Multi-touch events and controls
· Accelerometer support
· View hierarchy
· Localization (i18n)
Media
· OpenAL
· Audio mixing and recording
· Video playback
· Image file formats
Page | 20
· Quartz
· Core Animation
· OpenGL ES
Core Services
· Networking
· Embedded SQLite database
· GeoLocation
· Threads
OS X Kernel
· TCP/IP
· Sockets
· Power management
· File system
· Security
Figure 12: iTouch OS technology layers
[12], [13]
Cocoa Touch is based on the Cocoa API toolset for building software programs for Mac computers.
Cocoa API is derived from the NeXTSTEP and OPENSTEP programming environments developed by NeXT
in the late 1980s. Apple acquired NeXT in December 1996, and subsequently went to work on the
Rhapsody operating system that was supposed to be the direct successor of OPENSTEP. It was to have
an emulation base for Mac OS applications, called Blue Box. The OPENSTEP base of libraries and binary
support was termed Yellow Box. Rhapsody evolved into Mac OS X, and the Yellow Box became Cocoa.
As a result, Cocoa classes begin with the acronym "NS" (standing either for the NeXT-Sun creation of
OPENSTEP, or for the original proprietary term for the OPENSTEP framework, NeXTSTEP): NSString,
NSArray, etc. [14]
Xcode is a suite of tools for developing software on Mac OS X, developed by Apple. The Xcode suite also
includes most of Apple's developer documentation, and Interface Builder, an application used to
construct graphical interfaces.
The Xcode suite includes a modified version of free software GNU Compiler Collection (GCC, appledarwin9-gcc-4.0.1), and supports C, C++, Fortran, Objective-C, Objective-C++, Java, AppleScript, Python
Page | 21
and Ruby source code with a variety of programming models, including but not limited to Cocoa,
Carbon, and Java. Third parties have added support for GNU Pascal, Free Pascal, Ada, C#, Perl, Haskell
and D. The Xcode suite uses GDB as the back-end for its debugger. Xcode is also the development
environment for the iPhone, starting with Xcode version 3.1. [15]
ITouch Communication
The iTouch has various ways to communicate with the outside world. The most obvious of these is the
user driven input using a keypad. This form of communication is used during the development and
debugging phase of the project.
Figure 13: iTouch Keypad input
The second, less obvious, method is to use the dock connector found at the base of the device. The base
contains 30 pins as seen in the table below.
Pin
Signal
Description
1
GND
Ground (-), internally connected with Pin 2 on iPod motherboard
2
GND
Audio & Video ground (-), internally connected with Pin 1 on iPod motherboard
3
Right
Line Out - R (+) (Audio output, right channel)
4
Left
Line Out - L(+) (Audio output, left channel)
5
Right In
Line In - R (+)
6
Left In
Line In - L (+)
8
Video Out
Composite video output (only when slideshow active on iPod Photo)
Page | 22
9
S-Video Chrominance output for iPod Color, Photo only
10
S-Video Luminance output
for iPod Color, Photo only
11
GND
Serial GND
12
Tx
iPod sending line, Serial TxD
13
Rx
iPod receiving line, Serial RxD
14
RSVD
Reserved
15
GND
Ground (-), internally connected with pin 16 on iPod motherboard
16
GND
USB GND (-), internally connected with pin 15 on iPod motherboard
17
RSVD
Reserved
3.3V
3.3V Power (+)
Stepped up to provide +5 VDC to USB on iPod Camera Connector. If iPod is
put to sleep while Camera Connector is present, +5 VDC at this pin slowly
drains back to 0 VDC.
18
19,20 +12V
Firewire Power 12 VDC (+)
21
Accessory Indicator/Serial
enable
Different resistances indicate accessory type:
1kOhm - iPod docking station, beeps when connected
10kOhm - Takes some iPods into photo import mode
500kOhm - related to serial communication / used to enable serial
communications Used in Dension Ice Link Plus car interface
1MOhm - Belkin auto adaptor, iPod shuts down automatically when
power disconnected Connecting pin 21 to ground with a 1MOhm resistor
does stop the iPod when power (i.e. Firewire-12V) is cut. Looks to be that
when this pin is grounded it closes a switch so that on loss of power the
IPod shuts off. Dock has the same Resister.
22
TPA (-)
FireWire Data TPA (-)
23
5 VDC (+)
USB Power 5 VDC (+)
24
TPA (+)
FireWire Data TPA (+)
25
Data (-)
USB Data (-)
26
TPB (-)
FireWire Data TPB (-)
27
Data (+)
USB Data (+)
28
TPB (+)
FireWire Data TPB (+)
29,30 GND
FireWire Ground (-)
Table 1: Table of pin numbers on the iTouch [16]
(The highlighted fields indicate pins of importance to us for this project)
Page | 23
However, even after repeated requests, Apple has decided to keep the drivers for the pins on the
connecter (shown in Figure 14) private. As a result, our application on the iTouch needed a new way to
receive data from the RFID part of the system.
Figure 14: iTouch Dock Connector
The third way the iTouch that can communicate with the outside world is through the internet. It uses
caches and a persistent TCP connection to obtain objects over the web without having to open a web
browser.
As explained earlier, Xcode is highly object based. Therefore to create a web connection, the
programmer creates an NSURLRequest object using a website address that should have been stored
earlier. The application also needs to have a function that interrupts the rest of the code when data is
received. This function needs to append the received data packet (if there are no errors) onto an array
variable. Then, the stored data can be used however necessary (the data can hold information for a text
file, picture or even music). To get a new page, this data needs to be cleared and the NSURLRequest
object made to point to another webpage.
Page | 24
5 System Design
The block diagram of the entire system is shown in Figure 15.
Figure 15: Block Diagram of system
The entire system as shown in Figure 16 should be able to fit all our requirements as described in the
System Description section of this report. The RFID reader detects an RFID tag which is attached to the
back of an iTouch and then communicates this information to an application running on the iTouch.
As is visible from this block diagram, we have chosen to use the wireless connection option for the
communication the iTouch has with the outside world. Initially we had decided to use the dock
connector’s serial communication but we learned that it is not Apple policy to allow 3rd parties to use
their drivers.
We have split our system into two basic parts, the iTouch module that the users carry with them and the
RFID module that concerns tag detection. The RFID module can further be split into a hardware part that
Page | 25
communicates with the tags and a software part (running on the PC) that controls the hardware and
also communicates with the internet (a webpage).
The control and data flow is as follows:
Figure 16: Control and Data Flowchart
Figure 16 shows the control and data flow depicted by the double solid lines and single dotted lines
respectively.
Basically what this flowchart shows is that initially the user will open our application and be shown a
main page. The user then walks to a laboratory (or room) and scans his/her iTouch (with a tag behind it)
against an antenna located outside the lab.
Page | 26
When the tag receives a signal, it initially uses that energy to charge up. It then modulates and
backscatters that signal hence responding to the reader. When the reader detects this response, it
decodes the encoded modulation, identifies the tag that sent it and passes on the information to the PC
through an RS232 link.
The PC updates a webpage corresponding to that room. The webpage we are currently using for our
reader is http://ece.wpi.edu/rfidlab/test2.txt .
The iTouch then accesses all the various pages that correspond to all the labs and rooms available in the
Atwater Kent building. If it finds a positive ID corresponding to its particular tag, it will raise a flag that
corresponds to that particular room. It then switches to the window representing that room. This
window will give the user the option of viewing videos particular to the room or clicking done to go
back.
After the user has viewed whichever videos he/she wants to, they will click done which takes them back
to the main page.
While on the main page, the user can chose to walk to the second room and scan the tag there, or can
rescan the tag at the same room to view the page again.
The most important thing Figure 16 shows us is the parallelism of the design. While the iTouch module
depends on data from the RFID module, the RFID module is completely independent of the iTouch
module. This leads to the advantage of being able to leave the RFID module running all the time rather
than switching it on only when tour groups are coming. Also, the portable units (the iTouch with a RFID
tag), can conserve its batteries when it is not in use without affecting the stationary units (RFID reader
and PC software) which runs off AC power.
This modularity also has a disadvantage in that you cannot use the iTouch module to tell if the RFID
module is working or vice versa. If the RFID module malfunctions, the iTouch will simply read it as no tag
detected. If the iTouch module malfunctions it will not affect the RFID module at all.
Page | 27
iTouch Software Design
As mentioned earlier, the code for the iTouch is written in Xcode which is similar to Objective C. The
layout of the individual pages was made using a program called Interface Builder. This GUI uses a base
page called MainView which is controlled by a class called MainViewController. (Figure 17)
Figure 17: Classes Flow Structure
On top of this page, there exists a window called MainWindow which is controlled by a class known as
RootViewController (Figure 18).
This class also contains all the code for initializing the MainWindow as well as the secondary windows. It
also creates the control bar which is shown on top of all the secondary windows that is used to go back
to the MainWindow.
When this class initializes, it sets the background to a picture of Atwater Kent. It also creates a software
header bar which is used in the secondary windows. This bar looks like the normal toolbars on the
iTouch and has a name and a Back/Forward button. For this project, the header bar is used to display
titles and a done button on the secondary pages, but it is hidden on the page corresponding to this class
(MainWindow).
The RootViewController class also contains functions that are used to update the cache from our
webpage, to convert the cache into a searchable string, to search this string for the corresponding tag
Page | 28
code and to switch to the secondary window representing the room that corresponds to the webpage
that the tag code was found in.
This class also has a timer interrupt built into it. Using a timer interrupt is necessary as Xcode does not
work with infinite loops unlike most embedded system languages available. When the timer interrupts,
the script calls a function to update the cache with the contents of the webpage.
It then calls another function that searches thru the contents to see if a room was found. If a room was
found it calls the switching room function.
Figure 18: RootViewController Software Flow
Page | 29
Each secondary page has its own view and ViewController so that if we want to have separate pictures
for each it will be easy to do. Except for the name, all the secondary page ViewControllers are identical
(Figure 19).
This class accepts input from 2 or 3 buttons which are set up on the secondary views using Interface
Builder. The code is written such that increasing the number of buttons is again just a case of copying,
pasting and changing variable names. The main function in this code is the playmovie function. This
function is called when the user’s finger lifts after touching the button on the screen. The reason for
using the finger lift method is so that I do not get repeated function calls when the finger stays clicking
the button which will play havoc with the code.
The playmovie function calls the other functions in the class that are used to load and play the movie
corresponding to the button pressed. The class also contains another function that currently does
nothing but is called when the movie ends. This class has been added in case the functionality is needed
later on.
Figure 19: <roomname>ViewController Software Flow
The entire code listing is shown in Appendix 1
Page | 30
Figures 20 and 21 below show two examples of how the Views correspond with the ViewControllers.
These views were made during development to serve template for secondary pages and to demonstrate
the flexibility in terms of background pictures and button sizes, their names and their orientations.
In this example Figure 20 (FlipsideView) corresponds to FlipsideViewController while Figure 21 (View2)
corresponds to View2Controller. As explained earlier, both the ViewController are identical barring
changes to function and variable names.
Figure 20: FlipsideView Interface file showing linkages between buttons and functions
Figure 21: View2 Interface file showing linkages between buttons and function
Page | 31
Figure 22 is a depiction of the finished GUI in action showing the flow structure of the program. It is a
replication of Figure 17 with actual screen captures included. The picture right at the bottom represents
a video being played. As can be seen from the labels, there have been extra controls to play, pause, fast
forward, rewind and stop the video, and also to change the volume.
This figure also gives the reader a good indication of the way the laboratory name and done button shall
look on the software created header bar, which was missing from Figures 20 and 21.
Page | 32
Figure 22: Flow Structure using screen captures with the application working
Page | 33
RFID Module Design
Figure 23 is a block diagram showing us the control and data flow of the RFID module. The software
running on the PC sends control signals to the microcontroller on the RFID reader board through the
RS232 module. The microcontroller sends control signals to the onboard RFID reader chip which then
exchanges data with the RFID tag through the antenna. The RFID reader chip passes on this data to the
Microcontroller which passes it onto the PC software and then the iTouch via the internet.
Figure 23: RFID Module Block Diagram
As mentioned earlier, and can also be seen in Figure 23, the RFID Module is split up into two parts that
are integrated with each other through the RS232 module. However we can consider the software
running on the PC and the software running on the microcontroller to be one system communicating
through the serial port. Such a simplification makes sense because the two parts are passing data back
and forth in real-time to perform all the tasks necessary for this module. Therefore, for this design
section, the microcontroller is explained along with the PC software instead of in the RFID Reader Board
section even though it is housed on the board.
Page | 34
RFID Reader Board
Figure 24: RFID reader board showing connections [23]
The main component of our RFID reader board, seen in Figure 24, is the MLX90121 chip. This is the chip
that generates the signals that get sent out through the antenna and decodes the modulated signal
received from the RFID tags. The board in its entirety uses a maximum 300mA of current at 15V input
through the power supply connector.
Power Supplies
Our reader board accepts a 15V input through an adapter that plugs into the wall. However, the
microcontroller and RFID reader chip require +- 5V input voltage whereas the RS232 module requires
12V VCC. To step down from 15V to 12V and to +-5V we use two voltage regulators in parallel (Figure 25).
Page | 35
Figure 25: Power Supplies [25]
Both the regulators are 3 pin fixed voltage regulators. As with all regulators of this type, the output
voltage varies according to temperature (see Figure 26). For this reason, both regulators are covered
with heat sinks.
Figure 26: Vo v/s T(oC) for the L7812 12V regulator [24]
Page | 36
RFID Reader Chip: MLX90121
The MLX90121 is the heart of the reader board. This is the part of the circuit that generates a signal to
be sent through the antenna to the tag and decodes the modulated reply. The chip takes an input from
a 13.56MHz oscillator present on board as well as control signals from the microcontroller. These
control signals tell the chip when to transmit and also pick the transmission mode. The chip has two
modes, with anti-collision (Iso15) and without (Iso14). Iso15 refers to the ISO 15693-3 protocol
regarding anti-collision and transmission for RFID. More information on the protocol can be found on
the ISO website [24]. The MLX90121 also allows us to use the ISO 14443-4 protocol which doesn’t have
any anti-collision algorithms.
In the Iso15 mode, using anti-collision algorithms, the chip can detect multiple tags whereas in Iso14, it
can only detect a single tag, i.e. the tag with the strongest reply. For this project we have used the anticollision mode throughout.
The MLX90121 outputs a 13.56MHz signal with a power rating of 100mW. At this power, the range we
achieve is not satisfactory for our system. Therefore we send the signal through a power booster circuit
(shown in appendix 3) to amplify the power to 1W (amplification of 10). At this power we can achieve
the range required in our initial specifications
RFID Antenna
Figure 27: RFID antenna [23]
The antenna that is being used with the RFID board is shown above. The SMA connector is used to
connect to a coaxial cable running from the RFID board itself.
Page | 37
Figure 28: Antenna Schematic
The trimmer capacitor in the schematic (Figure 28) is adjusted to give a total impedance of 50ohms for
the circuit. The measured Q of this antenna is 17. The 2.4ohm resistor is rated for 5W so that it can
dissipate the extra energy, which doesn’t get transmitted (refer to RFID theory).
Software Design (Microcontroller and PC)
As mentioned earlier the software for both the microcontroller and the PC shall be tackled together. The
main reason for this is that the software running on the microcontroller depends entirely on the
software running on the PC for start and stop commands (Figure 29). Also, after the PC software sends
the command to the microcontroller it has to wait till it gets a response.
The two programs communicate via an RS232 module running at a BAUD rate of 57600, which basically
means it takes 17.36 microseconds to send each bit. The protocol for the MAX202CS3 chip uses 1 start
bit, 1 stop bit, 8 bit data and no parity bit. This means that each byte of data has a 2 bit overhead and
takes 173.6 microseconds to transfer each byte of data.
For this project, the two commands that the PC software sends over the RS232 link are Iso15 Inventory
DS and Iso15 07010101 crc slot 16.
The command Iso15 Inventory DS tells the microcontroller to set the command signals for the RFID chip
to dual subcarrier (which allows longer range and also allows us to use anti collision settings which
means it can detect more than one tag at one time). In response to this message, the microcontroller
scans for tags and returns the number of tags that were found.
The command Iso15 07010101 crc slot 16 is also dual subcarrier. In response to this message, the
microcontroller scans for all available tags and returns the unique ids for each and every one of the tags
found.
It should be immediately noticeable that both commands are utilizing ISO15693-3 protocol.
Page | 38
Figure 29: PC and Microcontroller Software Flowcharts
This flowchart (Figure 29) should be self explanatory. The PC software is running an infinite loop. During
each iteration it sends a command to the RFID reader. It waits for a response and updates the website
with that response. It then sleeps for 0.5 seconds before starting the loop again.
Running parallel to this is the software on the microcontroller on the RFID board. It is normally in an idle
mode. When it receives a command from the PC, it wakes up from the low power mode (Figure 29). It
then parses the command received through the code written in the file ‘Parser.c’ and ‘Iso15par.c’
(please refer to Figure 30). Once the command has been parsed, the microcontroller looks into ‘Iso15.c’
and ‘MLX90121.c’ to determine which control pins for the MLX90121 chip should be high for the signal
to be sent out.
The reply from the MLX is stored in a buffer before it is decoded (through ‘Iso15.c’ and ‘Iso15ac.c’) and
eventually sent back to the PC.
Page | 39
The flow of the message on the microcontroller through the various C files is shown in Figure 30.
Figure 30: Software Flow on the ATMega8 Microcontroller
The files ‘Bios.c’ and ‘Comm.c’ are used only for communicating through the RS232 link. All the code
files depicted in Figure 30 can be found in Appendix 2.
Page | 40
6 Testing and Measurements
Range and Orientations of the RFID tag
The range of the tag depends on our orientation with respect to the reader antenna. This is
depicted in Figure 31. In this figure, the reader antenna is placed flat on the xy plane while the
tag starts of parallel to the xy plane and rotates clockwise about the x axis. The maximum read
range is at the points when the tag is parallel to the xy plane (and the reader antenna). The
minimum is at the points where the tag is parallel to the xz plane (and perpendicular to the
reader antenna).
Figure 31: Read range for RFID tags
Battery Life
The battery life of the iTouch depends on the usage of the virtual guide application. For
example, if the user spends more time walking around and less time viewing a room page
and/or its videos, the application is constantly scanning the internet. Also, if the user keeps
viewing videos over and over again, the iTouch has to power the video along with the speakers
(or headphones) that are attached. These two modes use up the maximum power. On the
flipside, if the user leaves the application on a room page, without viewing any videos or
switching back to the main page, the application is running no processes and hence the least
power is consumed.
Under normal usage, it was found that the battery life is approximately 4½ hours. The time
taken for the battery to charge up full again is about 45 to 60 minutes.
Timing Cycles
As explained earlier in the system design stage, this project has two parallel programs running
simultaneously on two different devices. Therefore it is imperative that the timing cycles are
chosen in such a way that
a. The RFID module doesn’t miss a tag being scanned on it (minimize time between scans t0).
b. The website needs to be updated at least every time a scan has been made (time between
updates, t1 has to be smaller than t0).
c. The iTouch needs to check the website at least every time it has been updated (time between
Page | 41
checks, t2 has to be smaller than t1).
d. The updating of the website should be done as little as possible to prevent long waits
(maximize t1)
By examining these three terms, and through experimentation, a conclusion was reached
yielding t0 = .75s, t1 = .7s and t2 = .5s.
When graphed it looked like this:
Figure 32: Timing Cycles
Each rising and falling edge represents an event in that time scale. The flat part of the graph
represents the steady state between events during which the lower process must sample the
data processed at the event. As can be seen, there is no occurrence where a t1 edge did not
sample a t0 steady state or a t2 event did not sample a t1 steady state.
The only problem this system may have is if the user takes less than .75 of a second to scan their
iTouch tag on the reader. In other words, if the tag is not in the antenna range for at least 0.75
seconds, there is a chance that the swipe will be missed.
Page | 42
7 Looking into the Future
1. Expandability
As explained previously, due to budgeting concerns, we only have a single iTouch and a single
RFID reader board. As a result, what our system currently does is cycle through all the available
laboratories with each swipe of the card. In the future we will want a particular board to bring
up a particular room.
To do this, we need to change some of the commands in the RFID software section of this
project. Currently our code just checks for the presence of tags rather than asking the tag for its
unique ID. Such a improvement is trivial and yet vital for a multi-reader multi-tag situation.
Also, in the iTouch software design code, we currently search for the phrase “Tag*s+ Found” on
the webpage which we need to change to “<unique tag code> Found”.
Other than that we need to make a design choice. We have the option of using 1 webpage per
room or 1 webpage per iTouch. 1 webpage per iTouch is more efficient in terms of scans made
per cycle and hence will give the user a better sensation of being instantaneous. On the other
hand, there is the probability of errors if the user scans the tag at 2 readers in quick succession.
The second choice we have is 1 webpage per iTouch. I personally favor this choice as it is more
expandable in the sense that the number of rooms shall stay constant whereas the number of
iTouches being used may increase substantially.
For this system we need to change a function of the RootViewController class of the iTouch
software to stop cycling thru the rooms and instead switch to and from rooms. We also need to
create as many caches as there are rooms. Then we need to update each cache from separate
websites and use this info to determine which rooms we switch to and from.
2. The PC program
The current version of the software running on the PC is a foreground program. The implication
this has is that when we are using our system, the PC that is running the software cannot be
used for anything else. This is a very inefficient system if we expect to be leaving our PC on all
the time. Before deployment, this program must be made to run in the background.
3. Data Logging
As it stands, our application has no need for data logging (as each user will be forced to cycle
through all rooms anyway). However in the future a function that displays which rooms the user
has visited already is needed so he/she need not visit those rooms again.
Page | 43
8 The Budget
1. Prototyping Cost
iTouch – free with iMac
Apple Computer to run the SDK – $999
RFID Kit – $300
Subscription to the iPhone Developer Program – $99
2. Cost per additional room
RFID reader board – approx $100
RFID antenna – approx $50
3. Cost per additional tour guide unit
iTouch – $230
RFID Tag – approx $1
Page | 44
9 The Citations
1 - http://www.waygate-audio.com/
2 - http://www.adesignedpath.com/htmlPath/news/Museum/
3 - http://www.cio.com/article/8820/_Putting_the_RFID_in_Art
4 - http://www.rfidjournal.com/article/articleview/1338/1/129/
5 – Wikipedia page on RFID
6 – www.rfidjournal.com
7 – Published paper by Melexis (13.56MHz RFID systems and antennas design guide)
8 – Power Analysis of RFID Tags by Yossi Oren and Adi Shamir
9 – Published paper by MicroChip (Passive RFID Basics)
10 – Wikipedia page on iPod touch
11 - http://store.apple.com/us/browse/home/shop_ipod/family/ipod_touch?mco=MTcyODE5Mg
12 – Wikipedia page on iPhone SDK
13 - http://developer.apple.com/iphone/gettingstarted/docs/iphoneosoverview.action
14 – Wikipedia page on Cocoa
15 – Wikipedia page on Xcode
16 – http://pinouts.ru/PortableDevices/ipod_pinout.shtml (referred to from sparkfun.com and
http://revision3.com/systm/ipodcables/ )
17 – Open Communication RFID by Louis E. Frenzel page 2
18 – TI HF Antenna Design Notes, Technical Application Report
19 – www.sparkfun.com 's pages on iPod connectors, RFID interrogators and tags, and their datasheets
20 – http://en.wikipedia.org/wiki/Bluetooth#Uses
21 – http://www.its.bldrdoc.gov/projects/devglossary/_frequency_tolerance.html
22 – http://www.edaboard.com/ftopic328097.html
23 – Long Range RFID Demo User Manual from Melexis
24 – ISO 15693-3 protocol
http://www.iso.org/iso/iso_catalogue/catalogue_tc/catalogue_detail.htm?csnumber=31428
25 – L7800 Series Positive Voltage Regulators Datasheet from STMicroelectronics
Page | 45