1
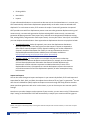
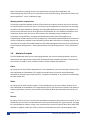
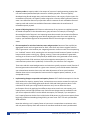
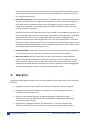
Clean Power Plan Planning Tool (CP3T) User Manual Version 2.2 Updated November 23, 2015 AUTHOR Pat Knight 485 Massachusetts Avenue, Suite 2 Cambridge, Massachusetts 02139 617.661.3248 | www.synapse-energy.com C ONTENTS INTRODUCTION........................................................................................................ 1 1. WALKTHROUGH ............................................................................................... 2 1.1. Select state and load pre-sets ...........................................................................................4 1.2. Select a compliance pathway and set basic assumptions ...................................................5 Selecting a compliance pathway ............................................................................................... 5 Setting basic assumptions ......................................................................................................... 6 1.3. Calibrate Scenario .......................................................................................................... 10 Meeting generation requirements .......................................................................................... 10 Meeting emission rate requirements ...................................................................................... 10 Meeting emission requirements ............................................................................................. 11 1.4. Analysis of Outputs ........................................................................................................ 11 Charts ...................................................................................................................................... 11 Tables ...................................................................................................................................... 11 Sources .................................................................................................................................... 11 2. CHECKLIST OF CONSIDERATIONS WHEN USING CP3T .............................................. 12 3. NEXT STEPS AND CONTACT ............................................................................... 14 APPENDIX A. CONDUCTING A SCENARIO ANALYSIS ......................................................... 15 Scenario Design ....................................................................................................................... 15 Interpreting Scenario Results .................................................................................................. 15 APPENDIX B. CP3T LICENSE AGREEMENT .................................................................... 18 INTRODUCTION This user manual serves as documentation for Synapse’s Clean Power Plan Planning Tool (“CP3T”) available at cp3t.com. CP3T is used to screen the expected cost and carbon dioxide (CO2) emission impacts of potential scenarios for compliance with EPA’s final Clean Power Plan, which sets out the regulation of Section 111(d) of the Clean Air Act for existing power plants. In CP3T, users set up a scenario by selecting a state or a set of states, and adjust generation, emission rates, and capacity factors until EPA’s emission rate and emission cap requirements are met. CP3T also requires users to meet peak demand requirements and annual generation requirements for their selected states, thus ensuring that their scenario adequately meets reliability requirements. Users may increase capacity factors, enter unit retirements, add energy efficiency or renewables, add new generation from Clean Power Plan-exempt natural gas-fired combined cycle or combustion turbine generators, adjust imports and exports, and/or simulate purchases of compliance credits. Users then evaluate peak demand and generation requirements in each year of the study period (2012-2031) to ensure reliability requirements are met. Finally, users evaluate the emission rates and emissions that result in each year to ensure the scenario complies with the target emission rates and emissions proposed by EPA. This tool is intended to give users the greatest flexibility possible in the creation of their scenarios. Although this guide details the general ways most users will want to make changes to the screening tool, CP3T is completely open-source; users are free to make any changes to any of the formulas and/or inputs that they wish.1 In this document, we discuss preliminary instructions for operating CP3T, considerations that a user should be aware of when using CP3T and interpreting CP3T’s outputs, and our anticipated next steps for updating the screening tool. To make suggestions for updates to CP3T, or to inquire about technical help in using the tool, please email [email protected]. 1 See Appendix B for additional information on open source and how it relates to CP3T’s license agreement. Synapse Energy Economics, Inc. Clean Power Plan Planning Tool User Manual 1 1. WALKTHROUGH This section provides an overview for operating CP3T. Before running CP3T, please be aware of the following requirements: CP3T requires that you have Excel 2007, Excel 2010, and Excel 2013. CP3T will not function correctly on older versions of Excel and is unlikely to work on Mac computers. CP3T requires that macros be enabled. Select “Enable Content” from the yellow “Security Warning” banner that appears at the top of your screen.2 In addition, you may click the “Developer” button on the ribbon, select “Macro Security” from the list of available options, then click the radio button “Enable all macros” from the list of available options. Note that the “Developer” tab is not activated by default in most versions of Excel; you can enable it by clicking File > Options > Customize Ribbon and checking the “Developer” box in the right-hand panel. Please set Excel calculations to “Automatic” to ensure that CP3T is updating when any changes are made. This can be done by selecting the “Formulas” button from the ribbon, clicking “Calculation Options” from the “Calculation” section, and selecting “Automatic” from the dropdown that appears. If you are using an older machine, selecting “Automatic” may cause it to run slower. As a workaround, you may instead choose “Manual” calculation so that the workbook does not continuously calculate. In this case, press the “Calculate Now” button in the Excel ribbon or strike F9 on your keyboard after making a change in CP3T. Note that some users may experience issues with text not correctly fitting in cells or buttons. If you are encountering this problem, make sure that your screen magnification is set to 100 percent by going to the Control Panel, selecting display, and clicking the “Smaller – 100%” radio button. Each workbook (i.e., copy of the CP3T file) represents a single scenario. Most user-driven analyses will require at least two scenario workbooks: a base scenario, and a scenario representing any adjustments to the base scenario; for example, a different composition of renewables or energy efficiency. See Appendix A for suggestions on how to conduct scenario analysis. 2 This “Security Warning” banner will typically only appear the first time you open CP3T on your computer. Synapse Energy Economics, Inc. Clean Power Plan Planning Tool User Manual 2 Once you have decided on a set of scenarios, open a copy of CP3T. On the initial splash screen, you can click on links to view this user manual or the CP3T license agreement.3 When you’re ready to get started, press “Begin Analysis.” Each scenario in CP3T is constructed using the following four steps: (1) selecting a state and loading presets, (2) selecting a compliance pathway and setting basic assumptions, (3) calibrating the state electric system, and (4) analyzing outputs. See Figure 1 for a schematic of the screening tool. Note that it is expected that each scenario will likely require numerous iterations of input adjustments before CP3T’s requirements are satisfied. Figure 1. Schematic of CP3T 3 You may also elect to click the button “Restore typical Excel functionality.” Some basic Excel functionality has been disabled in CP3T in order to facilitate a guided walkthrough of the screening tool. Clicking this button will reveal the worksheets that make up CP3T, including the sheets discussed in the following section, and other sheets that feed background data into the tool. Synapse Energy Economics, Inc. Clean Power Plan Planning Tool User Manual 3 1.1. Select state and load pre-sets Once you hit “Begin analysis” on the launch page (or “Ready to get started?” if you choose to read the Quick Start tips), CP3T asks you to select a state or set of states. Add a state to your selection by entering an “X” to the right of each state. Once you’ve selected all the states you’d like to analyze, click the “Load state(s)” button. This causes CP3T to run a set of calculations that result in state-specific data for your state or states being loaded. This state-specific data includes unit-level generation and emissions for 2012 through 2014, load forecasts, and region-specific renewable capacity factors. When CP3T loads your state or set of states, several pre-set options also get loaded automatically. These presets include settings relating to: Renewables: CP3T assumes the set of states you have selected will build the level of incremental renewables required by those states’ renewable portfolio standards, if these exist. Energy efficiency: CP3T assumes the selected states increase energy efficiency savings in line with the levels specified by each states’ energy efficiency standard, if these exist. Heat rate improvements: CP3T assumes coal units in the selected states do not have heat rate improvements implemented beginning in 2020. NGCC capacity factor improvements: CP3T assumes existing natural gas combined-cycle (NGCC) units in the selected states maintain historical capacity factors and do not increase their capacity factors to 75 percent beginning in 2020. Displacement: By default, CP3T assumes coal generation, existing NGCC generation, and generation from imports are displaced evenly (i.e., one-third each) by new renewables, new energy efficiency, and ramped-up NGCC units. Coal plant retrofits: CP3T loads the expected cost for environmental retrofits at coal units in future years per Synapse’s mid-case projection.4 Note that this does not include the Synapse mid CO2 price case, which is otherwise typically included in this projection. Imports and exports: After all of the above presets have been loaded, CP3T checks to make sure generation requirements are met. If your state does not have enough potential generation in any given year, CP3T automatically adjusts imports or exports to or from your state so that generation requirements are met. You can change or completely disable these presets if you choose. For most states, these presets result in a loaded scenario that meets the future generation requirements for your state, and in many cases will also result in automatic compliance with the Clean Power Plan. 4 Details on Synapse’s mid-case projection for future environmental retrofits at coal units can be found at http://www.synapse- energy.com/sites/default/files/Forecasting-Coal-Unit-Competitiveness-14-021.pdf. Synapse Energy Economics, Inc. Clean Power Plan Planning Tool User Manual 4 CP3T displays the initial results of using these presets on a state-specific “Dashboard” page. On this page, you can name a scenario, edit input assumptions, and review outputs. If you’d like to modify a scenario further, the next section gives an overview to the inputs that you now have an opportunity to change to create a unique scenario. 1.2. Select a compliance pathway and set basic assumptions In this step, you select the compliance pathway your state or states will meet and change the characteristics of your scenario’s electric system. Selecting a compliance pathway The Clean Power Plan allows states to select from one of seven compliance pathways, split up into two categories: rate-based and mass-based compliance. CP3T always simultaneously displays whether or not your scenario is meeting both a rate-based pathway and a mass-based pathway for comparative purposes; the user chooses the variation of each of those pathways with which CP3T evaluates compliance. Rate-based compliance The Clean Power Plan allows for state regulators to choose from three approaches for rate-based compliance: R1. Technology-Specific: Each affected unit in the state(s) selected needs to meet a technology-specific emission rate standard. There are two types of technologies: Fossil Steam (coal and oil/gas steam) and NGCCs. R2. State Average: Each affected unit in the state(s) selected needs to meet a single statewide emissions rate standard. If you've selected more than one state, this number gets calculated based on the 2012 generation composition of the selected multi-state region. R3. Unit-Specific: States choose their own unit-specific emission rates. These might be based around very specific technology types, unit vintage, etc. The average statewide emission rates in each compliance period must match the R2 emissions rate. In each rate-based pathway, units comply with the Clean Power Plan by procuring a special type of compliance credit called an “Emission Rate Credit,” or ERC. Typically, these are generated by renewables, energy efficiency, or high-performing fossil units. If there are not enough ERCs in your scenario for all of your units to meet compliance, Clean Power Plan compliance is not achieved. See section 1.3 of this user manual and CP3T itself (click “Have questions about rate-base compliance?” on the Dashboard) for additional information on ERCs. Synapse Energy Economics, Inc. Clean Power Plan Planning Tool User Manual 5 Mass-based compliance Alternately, state regulators can choose mass-based compliance. Here, state regulators can choose from four different approaches: M1. Existing Cap: There is a state cap on emission allowances for each compliance period. These allowances apply to existing affected units only. M2. Existing & New Cap: There is a state cap on emission allowances for each compliance period. These allowances apply to both existing and new units. M3. State Measures - Existing: States submit a plan containing a portfolio of strategies that show they will meet the M1 cap. These strategies apply to existing affected units only. M4. State Measures - Existing & New: States submit a plan containing a portfolio of strategies that show they will meet the M2 cap. These strategies apply to both existing units and new units. In the first two mass-based pathways, states distribute allowances to units. Units must hold an allowance for each ton of CO2 they emit. If your state’s fossil units produced more CO2 emissions than allowed under the selected cap, Clean Power Plan compliance is not achieved. In the second two mass-based pathways, states have more freedom to integrate strategies other than allowance allocation into their compliance approach. However, these states must still meet the same mass-based caps described in the first two mass-based pathways. As a result, all the approaches are analyzed in the same way in CP3T. See CP3T for additional information on CO2 allowances (click “Have questions about mass-based compliance?” on the Dashboard). Regardless of whether you have selected rate- or mass-based compliance, you must then ensure that you have enough ERCs or allowances to meet compliance in each of the four compliance periods. Setting basic assumptions In addition to selecting the compliance pathway, you can create a scenario by adjusting other inputs and assumptions. These include assumptions relating to renewables, energy efficiency, new and existing fossil and nuclear units, imports and exports, and displacement. Renewables When your states are first loaded, CP3T loads a preset called “State RPS”. This loads the level of renewable generation required for your state(s) based on Synapse research on renewable portfolio standards and the level of forecasted sales you have selected. If your state has a specific carve-out for solar generation, CP3T estimates the level of required solar capacity. Otherwise, state RPS generation is assumed to be met through on-shore wind. Synapse Energy Economics, Inc. Clean Power Plan Planning Tool User Manual 6 Another option you have is to select “CPP Default” preset. In this preset, CP3T assumes your scenario builds the level of renewables that EPA uses in its Clean Power Plan target setting. CP3T assumes 50 percent of this renewable generation is met using on-shore wind, while the other 50 percent is met using utility-scale solar. Note that both these presets are meant to be high-level starting points. If you have more detailed information about the types of renewables likely to be built in your state under the CPP Default or the State RPS, feel free to enter this information. In addition to these two presets, CP3T also allows you to overwrite or make changes to many different aspects of renewable characteristics for your scenario. Characteristics able to be modified include: Renewable types (including on-shore wind, off-shore wind, utility-scale solar, distributed solar, biomass, combined heat-and-power (CHP), geothermal, bundled RECs, and unbundled RECs) Location of renewables Renewable capacities Renewable capacity factors Renewable capacity ratings (to meet peak demand requirements) Renewable costs You can enter these changes as “User Input” settings, or you can make modifications to either the “CPP Default” or “State RPS” options. Energy efficiency When your states are first loaded, CP3T assumes that your states’ business-as-usual forecast for sales equals the projection set out for the selected states’ region in the 2015 Annual Energy Outlook. In addition, CP3T assumes future energy efficiency savings are equal to those required for your state(s) to meet its energy efficiency resource standard (EERS), if such a standard exists. Another available option is to select the “Synapse Default” preset, wherein CP3T assumes that your state continues its 2012 energy efficiency savings trajectory until 2020, at which point savings increase by 0.2 percent per year until a goal of 1 percent savings as a percent of sales is met.5 CP3T assumes annual savings expire over time, and are split between residential, low-income, and commercial and industrial sectors according to historical data. Note that CP3T also loads historical data on savings and sales for 2012, 2013, and 2014. 5 Historical data on sales and energy efficiency savings is based on EIA Form 861, available at http://www.eia.gov/electricity/data/eia861/ Synapse Energy Economics, Inc. Clean Power Plan Planning Tool User Manual 7 As with renewables, you are encouraged to make changes to energy efficiency assumptions in order to create a unique scenario. Energy efficiency inputs that can be configured include: Sales growth rate 2012 savings level, savings ramp rate, and savings goal level Split of savings and costs among residential, low-income, and commercial and industrial sectors Split of costs between program administrators (commonly the utility) and energy efficiency participants First-year costs of energy efficiency New and existing fossil and nuclear units You can also make changes to new and existing fossil and nuclear units. For example, you can add new capacity for new NGCCs, new natural gas-fired combustion turbines (NGGTs), and new nuclear units. In addition, you can change the estimated future capacity factors and emission units associated with these units. Furthermore, users can review and edit capital costs for new units and fixed and variable operating costs, heat rates, and fuel prices for new and existing units. CP3T also allows users to access and modify a vast array of unit-specific variables. Users may enter retirement dates, uprate or derate future capacities, alter future capacity factors (or set a universal assumption of a 75 percent capacity factor for existing NGCCs), alter future emission rates (or set a universal assumption of interconnect-specific improvement percentages to emission rates at all coal units), switch fuel types, or apply unit-specific emission rate standards for users analyzing an “R3” compliance pathway. Finally, users may make edits to future costs of environmental retrofits at coal units. CP3T bases its estimates of environmental retrofit costs at coal units on the Synapse mid case, originally developed using the Synapse Coal Asset Valuation Tool (CAVT). You can download low- and high-cases at www.cp3t.com, or go to www.synapse-energy.com/cavt to download the CAVT tool and develop your own scenario-specific environmental retrofit costs. Displacement CP3T allows users to specify the degree to which existing fossil units will be displaced by new “musttake” generation, such as renewables or energy efficiency. Practically speaking, this means that if your scenario features 100 new megawatt-hour (MWh) of renewables (for example), you can decide whether this new 100 MWh displaces 50 MWh of Fossil Steam generation and 50 MWh of NGCC generation, 60 MWh and 40 MWh, or some other combination. Users have the option of distributing displacement among four different resources: Existing Fossil Steam Synapse Energy Economics, Inc. Clean Power Plan Planning Tool User Manual 8 Existing NGCCs New NGCCs Imports If a user allocates distribution to a resource that does not exist in the selected state or in a certain year, CP3T automatically re-distributes displacement proportionally to the other resources selected to be displaced. If no such resources exist, CP3T assumes the surplus “must-take” generation is exported. CP3T provides users with four displacement presets: new must-take generation displaces existing coal resources only, new must-take generation displaces existing NGCC resources only, new must-take generation displaces generation from imports only, and new must-take generation displaces existing coal, existing NGCCs, and generation from imports evenly. You may also select “User Input” and choose your own displacement distribution. Some approaches to displacement the users may explore include: Actual displacement: Under this approach, users enter the displacement distribution that they expect to see in the future given how that scenario’s inputs are expected to affect future economic dispatch. Electric dispatch modeling, such as that conducted in Synapse’s complete Clean Power Plan Toolkit, is one way to determine what this expected displacement distribution could be (more information available at http://synapse-energy.com/synapse-clean-power-plan-toolkit). Boundary-setting: It is often helpful to run multiple scenarios that are otherwise identical but have different displacement distributions (for example, one that features all-Fossil Steam displacement and another that features all-NGCC displacement). Because each of these selections represents an absolute boundary in terms of the displaceable emissions, this approach to scenario development captures the maximum and minimum amount of emission displacement possible, all other assumptions being held constant. Imports and exports You can also make changes to imports and exports in your scenario. By default, CP3T loads import and export data for 2012, 2013, and 2014, then adjusts these values to fill any “gaps” in generation.6 You can also elect to hold baseline (2014) imports and exports constant through the study period to simulate power purchase agreements with units in other states, or you can choose your own scenario-specific settings. Note that as you make changes to other aspects of your scenario, you can return to the “Fill Generation Gaps” setting on the Dashboard. CP3T will automatically re-analyze your scenario and fill any gaps as 6 Often, such gaps are caused by quickly increasing sales without adequate new resource additions, or near-term coal plant retirements. Synapse Energy Economics, Inc. Clean Power Plan Planning Tool User Manual 9 needed. This can be helpful as imports and exports frequently fluctuate year-to-year and are an easy way to calibrate generation. 1.3. Calibrate scenario After setting up your scenario’s inputs, the Dashboard will inform you whether the screening tool has encountered any errors in providing annual generation sufficient to meet sales and exports, Clean Power Plan emission rate targets, and Clean Power Plan emission targets.7 Meeting generation requirements Note that CP3T will not run correctly if the annual generation plus imports (or less exports) are insufficient to meet sales. If in any year generation requirements are not met, a red “ERROR” message will appear under the Dashboard’s generation chart. Clicking this message will bring you to a page where you can review detail on the years that feature generation gaps. In these years, you must increase potential generation for each year until it is equal to or greater than sales plus exports for your selected state or group of states. Once these adjustments have been made, CP3T will then be able to properly displace generation (using the selected displacement distribution) until the projected level of sales and exports is reached. Again, note that a quick way to do this is by again selecting the “Fill Generation Gaps” setting for imports and exports; selecting this option causes CP3T to automatically re-adjust the levels of imports and exports such that generation gaps are met. Meeting emission rate requirements The Clean Power Plan, at the most general level, requires units to meet CO2 emission rate standards in future years. These standards vary according to what you, the user, have selected for a compliance pathway. More specifically, a unit achieves its standard by procuring a set of ERCs (or 1-MWh offset credits) that reduce its Clean Power Plan emission rate. CP3T determines whether emission rate requirements are met by calculating the number of ERCs required to meet compliance by all the selected states’ units jointly and comparing this value to the number of ERCs expected to be supplied by renewables, energy efficiency measures installed after 2012, new nuclear units, purchases from out of state, and banking from previous years. This comparison is done for four different compliance periods: 2022-2024, 2025-2027, 2028-2029, and 2030-2031. 7 Clicking the “Summary Tables” link allows you to see whether demand plus reserve requirements are also being met. Note that meeting the peak demand goal is not a “requirement,” per se, for most states or groups of states. Many states participate in regional reliability organizations, and reserve requirements for peak demand are commonly applied on a regional, rather than a state, basis. The peak demand goal is using the estimated peak demand plus a reserve margin. Reserve margins are assumed on a regional basis using NERC data. Specific reserve margins and their source are available by clicking the “Main Library” link on the Dashboard page. CP3T will run successfully even if the capacity reserve requirement goal is not achieved, but will flag capacity as a potential area of concern. Synapse Energy Economics, Inc. Clean Power Plan Planning Tool User Manual 10 More information on meeting emission rate requirements, the types of available ERCs, and understanding how CP3T portrays this information can be found by clicking “Have questions about ratebased compliance?” on the “Dashboard” page. Meeting emission requirements An alternate compliance pathway under the Clean Power Plan requires states to restrict CO2 emissions to a specified level in tons in each year. This emissions cap and applicable unit emissions vary according to whether you have selected the Existing or the Existing plus New Source Complements pathway. CO2 emissions from affected units can be no greater than the number of 1-ton allowances available in each compliance period. Users must ensure that emissions are reduced by using a combination of renewables, energy efficiency, and generation displacement (which work both together and independently to reduce emissions from emitting units). Purchased and banked allowances increase the number of allowances available in each compliance period. More information on meeting emission cap requirements, the types of available allowances, and understanding how CP3T portrays this information can be found by clicking the link, “Have questions about mass-based compliance?” on the “Dashboard” page. 1.4. Analysis of outputs The CP3T Dashboard allows you to quickly gauge whether your scenario meets generation, emissions, and emission rate requirements. Importantly, the Dashboard also provides information on the costs of your scenario. In addition, CP3T provides a number of other outputs described here. Charts By clicking the link titled “More detailed charts” on the Dashboard, you can access larger versions of the charts displayed on the Dashboard. This page also provides charts on capacity and peak demand requirements and total system-wide emissions, irrespective of whether or not resources are affected by the Clean Power Plan. Tables By clicking the link titled “Summary tables” on the Dashboard, you can access tabular versions of the charts displayed on the Dashboard. This page displays year-by-year and resource-specific information on capacity, generation, emissions, Clean Power Plan compliance (both rate-based and mass-based), and costs. Sources By clicking “Click here to see a list of sources and default assumptions being used in this scenario” on the Dashboard, you can access a condensed version of the inputs and outputs for a given scenario. This page lists relevant data on capacity, energy, costs, and emissions by resource type for 2012, 2015, 2020, 2025, and 2030. In addition, under each resource CP3T lists the default sources for cost and capacity factor Synapse Energy Economics, Inc. Clean Power Plan Planning Tool User Manual 11 assumptions. This sheet can be printed out onto a single 8.5” x 11” sheet, and is intended to accompany any analysis of CP3T in order to show the high-level assumptions used in that specific scenario. 2. CHECKLIST OF CONSIDERATIONS WHEN USING CP3T Referencing the following list of considerations is strongly recommended whenever you design an analysis and interpret results using CP3T. Note that this list is not exhaustive; the user is responsible for ensuring that the 2012, 2013, and 2014 baseline data used for your state in CP3T is as accurate as possible, and that all assumptions for future years are reasonable. 2013 and 2014 unit-specific data: While CP3T uses 2012 unit-specific data that is identical to that used by EPA in its Clean Power Plan target setting for other variables, the unit-specific data for generation in 2013 and 2014 is calculated by Synapse based on a best-possible approximation of EPA’s methodology for apportioning generation to existing Clean Power Planaffected units. Actual generation and emissions that come from these units in any of these three historical years may differ from those MWh and emissions assigned to that unit in EPA’s methodology. Nuclear unit capacity and generation: A number of nuclear units are slated to be retired and several others have received approval from the Nuclear Regulatory Commission (NRC) to expand their generating capacity in future years. The user should ensure that if a state contains nuclear units, future capacities reflect all anticipated modifications. Furthermore, while EPA assumes all nuclear units (including those currently under construction) will be able to operate at a 90 percent capacity factor in all future years, it is unlikely that units will actually achieve this level of operation. Accuracy may also be improved by accounting for refueling outages; for example, since plants commonly operate on 18-month refueling cycles, you could assume a somewhat lower capacity factor in every other year. “Under-construction” capital costs: EPA assumes that several nuclear and NGCC units not yet in operation are generating in its 2012 baseline. An important effect of this assumption is that these units capital costs are treated as past expenditures or “sunk”—zero for the purposes of assessing future costs in this analysis. If these plants were treated as still under construction, it would be possible to include their capital costs in the analysis depending on the specific assumptions used. Sales assumptions: CP3T includes default 2012, 2013, and 2014 sales data aggregated to the state-level from the U.S. Energy Information Administration (EIA) Form 861. For 2014, this data is considered to be “early release,” and, as such, may change in future versions of CP3T. In addition, CP3T attempts to offset the impact of historical energy efficiency in the AEO 2015 Reference Case. This is intended to avoid issues of implementing future energy efficiency savings that would otherwise go to replace expiring savings assumed in the AEO. Synapse Energy Economics, Inc. Clean Power Plan Planning Tool User Manual 12 Capacity credits: A capacity credit is the amount of a resource’s peak generating capacity that can count toward peak demand plus reserve for reliability purposes. These are typically developed using forced outage rates, peak coincident factors, and a variety of other inputs. For renewables in particular, the capacity credits assigned to a resource differ significantly state-tostate. Users should be aware of your particular state’s treatment of each renewable resource’s capacity credit and use the best available information to determine the contribution of renewable capacity to peak. Impact of adjusting imports: CP3T does not take account of any impacts on neighboring states of altered assumptions in the selected state or group of states. For example, increasing or decreasing the level of imports in net importing states does not take into account the effect on resource adequacy in neighboring states. When adjusting the values for a state’s level of net imports, you should be cognizant of the potential effects of these changes on neighboring states. EPA assumptions for unit-level emissions rates and generation: Because of the way EPA has aggregated annual unit-level generation for 2012, some fossil units have a negative value for electric generation in the baseline year. Negative generation is often a result of a unit operating in a “mothball” status in 2012, meaning the unit consumed a small amount of power in order to keep essential systems running (e.g., lighting, security). These units produced no generation, resulting in an emissions rate of zero pounds per MWh. Other units generated a small amount, causing a small level of CO2 emissions, but had net negative consumption (i.e., the unit consumed more power than it produced). For these units, the emissions rate is negative. These units and their associated generation and emissions typically represent a small fraction of the total generation and emissions in a given state. However, you should be aware of whether your selected state contains these units, and make adjustments in future years based on whether these units are anticipated to continue to be net negative power producers, or are anticipated to retire. Implementing changes to capacities and capacity factors: CP3T’s default assumption is that the 2012 baseline for capacity, capacity factor, and emissions rate remains constant for each year. CP3T assists you by also loading generation data for 2013 and 2014 (emissions data is “backcalculated” for these years using the 2012 emissions rate). You can affect the future performance of units by applying three different time series to each unit: unit capacity, unit capacity factor, and unit CO2 emissions rate. Each of these changes must be entered for each year that is expected to differ from the default assumption; for example, if you anticipate a unit’s capacity factor to decline from its 2012 value of 80 percent to a 50 percent capacity factor beginning in 2020 and extending through 2031, you must enter “50%” for each year between 2020 and 2031. Note that reducing a unit’s capacity factor to 0 percent is not equivalent to retirement: units with a 0 percent capacity factor will continue to contribute towards the state’s peak demand Synapse Energy Economics, Inc. Clean Power Plan Planning Tool User Manual 13 requirements and will continue to incur fixed costs. You should represent retirement by setting the unit’s capacity (not capacity factor) to zero for every modeled year in which it is retired, or by entering a retirement year. Renewable energy costs: Current assumptions for renewable costs in CP3T include construction, operation, and maintenance of the generators themselves, but do not account for integration costs. Note that you should take care to account for integration costs for all new resources, including non-renewables. Users should replace the default renewable costs wherever they have more relevant information. Note that transmission and integration costs are not included in the renewable energy costs, nor are they included in the costs of constructing new 111(b) NGCC or NGGT generation. You should adjust all generation costs if you anticipate additional transmission or integration to be a significant component of incremental generation costs. The cost of bundled RECs, on the other hand, does include transmission costs. The cost is calculated on a regional basis using the sum of the regional unbundled REC cost plus the cost of a dedicated transmission line from the selected state’s region to the closest Class V wind resource. Revenue from RECs: While CP3T currently accounts for the costs of procuring out-of-state RECs, it is not currently set up to account for any revenues accrued from the sale of RECs. Multi-state analysis: Analysis of more than one state is inherently more complicated than analysis of a single state. Depending on interstate agreements, there is a large spectrum as to what it means for a group of states to collectively comply with the Clean Power Plan. Careful consideration should be applied to how your CP3T scenario represents the selected aggregation of states, and the degree to which it may differ from any possible reality. 3. NEXT STEPS Synapse anticipates regular updates to CP3T in coming months. Future versions of CP3T may include the following: Upgrades and edits to historical data, tool usability, tool calibration, and tool navigation Changes to reflect new announcements, clarifications, or technical support documents from EPA on the Clean Power Plan Revisions to the dispatch algorithm, including tying together information on ERC or allowance prices and the displacement order, or developing a displacement order based on historical marginal emitters Deployment of “suggested pathways” for compliance (i.e., a scenario in which energy efficiency is used to “fill in” generation gaps, or a scenario that optimizes for least costs) Synapse Energy Economics, Inc. Clean Power Plan Planning Tool User Manual 14 APPENDIX A. CONDUCTING A SCENARIO ANALYSIS CP3T is a screening tool designed for conducting scenario analyses. In a scenario analysis, users set up different assumptions to inputs in order to understand different possible outcomes. In a typical scenario analysis multiple scenarios are compared to one another. This appendix offers suggestions for setting up scenario analyses in CP3T and interpreting the results. Scenario design First, you should design your preliminary scenarios before any analysis is conducted. One option is to set up several scenarios and change only a single input. For example, you could set up a set of scenarios called “Low Renewables,” “Medium Renewables,” and “High Renewables,” in which the only change is the generation available from new renewables in each year. In this example, you could use the default Clean Power Plan assumptions for “Medium Renewables,” halve this assumption for each year for “Low Renewables,” and double it for “High Renewables.” This type of analysis tests the sensitivity of the scenario results to a single input. Alternately, you could design scenarios that have more comprehensive changes. For example, you could set up one scenario to closely match all the default Clean Power Plan inputs for a given state as designed by EPA, and set up a second scenario in which future renewable generation and energy efficiency savings are higher than default EPA assumptions, future renewable and energy efficiency costs are lower than default EPA assumptions, and all coal units in the specified state are retired. This type of scenario analysis could be used to test a “business-as-usual” future versus an “all-in” future, where there are many new policies implemented to accelerate the use of low-carbon energy. After a preliminary run of your scenarios is conducted, it may be helpful to revisit and adjust scenario inputs and re-run your analysis. Interpreting scenario results From the Dashboard, you may access a page of resource- and year-specific tables by clicking the link “Summary Tables.” This page includes tables summarizing capacity, generation, emissions, emission rates, and annual costs for 2012 through 2031. These tables can be copied to a separate workbook so that the time series of each of the above variables can be compared among all the scenarios you have analyzed. Figure 2 is a chart created using such a workbook. This figure compares the Clean Power Planaffected emissions that result from two different scenarios against the EPA’s target Clean Power Plan emission cap for Wisconsin. “Scenario 1” utilizes all the CP3T presets for Wisconsin except the redispatch to 75 percent beginning in 2022. “Scenario 2” is an identical scenario, except for the addition of NGCC re-dispatch over coal units beginning in 2022. Note that while Scenario 2 is lower than the state’s emission cap (compliant with the Clean Power Plan), Scenario 1 is higher than the emission cap (noncompliant). Figure 3 displays the key difference between the two scenarios—the displacement of coal generation by NGCC generation. Synapse Energy Economics, Inc. Clean Power Plan Planning Tool User Manual 15 Figure 2. Comparison of Clean Power Plan-affected emissions of two example scenarios versus the EPA target Figure 3. Comparison of coal and NGCC generation in two example scenarios In this example, despite only changing one “lever” in scenario inputs, the resulting emissions between the two scenarios are very different, and make the difference between compliance with the Clean Power Plan and non-compliance. Synapse Energy Economics, Inc. Clean Power Plan Planning Tool User Manual 16 In addition, by exporting data to a separate workbook, users may also compare costs between scenarios. Figure 4 presents the annual costs of each scenario. Also shown on this chart are the 2012-2031 net present values (NPVs) of each scenario assuming a 3 percent discount rate. Figure 4. Comparison of annual costs and 2012-2031 NPVs of two example scenarios As a result of this scenario analysis, it can be observed that despite the re-dispatch to a more expensive fuel, Scenario 2 is actually less expensive than Scenario 1, largely as a result of avoiding costly environmental retrofits and heat rate improvements at coal units. In net present value over the study period, Scenario 2 saves 4 percent in system costs compared to Scenario 1. Scenario analysis permits meaningful comparisons of different potential futures, both Clean Power Plan compliance and in future system costs. Synapse Energy Economics, Inc. Clean Power Plan Planning Tool User Manual 17 APPENDIX B. CP3T LICENSE AGREEMENT This work is licensed under a Creative Commons Attribution-ShareAlike 4.0 International License. You are free to: Share — copy and redistribute the material in any medium or format Adapt — remix, transform, and build upon the material for any purpose, even commercially. The licensor cannot revoke these freedoms as long as you follow the license terms. Under the following terms: Attribution — You must give appropriate credit, provide a link to the license, and indicate if changes were made. You may do so in any reasonable manner, but not in any way that suggests the licensor endorses you or your use. ShareAlike — If you remix, transform, or build upon the material, you must distribute your contributions under the same license as the original. No additional restrictions — You may not apply legal terms or technological measures that legally restrict others from doing anything the license permits. Notices: You do not have to comply with the license for elements of the material in the public domain or where your use is permitted by an applicable exception or limitation. No warranties are given. The license may not give you all of the permissions necessary for your intended use. For example, other rights such as publicity, privacy, or moral rights may limit how you use the material. The Clean Power Plan Planning Tool (“CP3T”) is a free and open source tool created by Synapse Energy Economics, Inc. (“Synapse”). CP3T is meant as a tool for performing “first-pass” planning of statewide compliance with EPA’s Clean Power Plan. Users should verify all inputs and assumptions before making use of CP3T’s outputs. Users may share and adapt CP3T and derivative work in any medium or format for any use, under the attribution terms outlined above. Synapse is not responsible and does not assume liability for any errors in CP3T’s input data or functions, nor is it responsible for any of the resulting output generated by its users. All responsibility for the validity of CP3T inputs are assumed by the user. By using CP3T, users agree to the following: 1. Reporting of any incorrect data or functions in CP3T to Synapse Energy Economics, Inc. Synapse Energy Economics, Inc. Clean Power Plan Planning Tool User Manual 18 2. Assumption of responsibility for the validity of CP3T inputs. 3. Operation of CP3T under the attribution and ShareAlike terms outlined above. 4. Disclosure of the source of any resulting information (i.e., CP3T) and provide a citation to the tool. Please use the following citation: Clean Power Plan Planning Tool (“CP3T”). Synapse Energy Economics, Inc. Version 2.1. Available at www.synapse-energy.com. Synapse is not responsible and does not assume liability for any errors in CP3T’s input data or functions, or for any of the resulting output generated by its users. All later versions of CP3T shall contain this license and user agreement unless otherwise stated or modified. Synapse reserves the right to suspend or terminate any or all of this agreement at its own discretion, at any moment and for any reason, with no prior warning or liability. Version November 2015 Synapse Energy Economics, Inc. Clean Power Plan Planning Tool User Manual 19