1
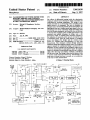
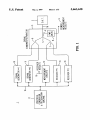
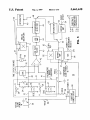
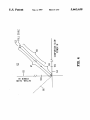
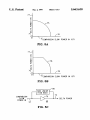
USOO566363 8A
United States Patent [19]
[11]
Patent Number:
5,663,638
Humpherys
[45]
Date of Patent:
Sep. 2, 1997
[57]
[54] CALORIM'ETRIC RF POWER METER WITH
DYNAMIC ZEROING AND CONSTANT
TEMPERATURE AND POWER DISSIPATION
IN THE CALORIMETRIC BRIDGE
The etl'ects of di?erential heating inside the calorimetric
bridge are reduced by ?rst heating the bridge externally and
controlling the resulting temperature. The bridge is also
heated internally by an amount that varies according to the
applied power to be measured. This acts to eliminate the
principal source of thermal gradients in the ?rst instance. By
applying this heat as a common mode input signal to the two
[75] Inventor: Melvin D. Humpherys. Spokane.
Wash.
[73] Assignee: Hewlett-Packard Company. Palo Alto.
terminating loads of the calorirnetric bridge the bridge itself
Calif.
does not become unbalanced. and therefore does not attempt
to measure that common power. Actual input power to be
Appl. No.: 681,564
Filed:
ABSTRACT
measured does initially unbalance the bridge. and is still
measured as usual. A constant power circuit is response to
the indication of measured power and acts to keep the sum
Jul. 29, 1996
Int. Cl.6 .......................... .. 601R 21/02; 601R 19/03
of measured power (plus the equal amount of feedback
US. Cl. ........... ..
324/95; 324/106
power that balances the bridge) and the common mode
Field of Search .............................. .. 324/95. 96. 105.
power at a constant value corresponding to a full scale
324/106; 455/61.1-67.1. 2261-2264. 115
measurement. This eliminates internal thermal transients
within the bridge that lengthen response time. The feedback
signal to balance the calorimetric bridge is produced by an
integrator. To allow operation of the integrator output closer
References Cited
to zero for measurement of small applied signals. the applied
input to be measured is periodically removed and a suitable
slight otfset from the true balance condition is introduced
into the servo loop. The bridge is then exactly balanced with
a separate sample and hold control loop. “Periodically” can
U.S. PATENT DOCUMENTS
3,665,322
3,845,388
5/1972 Julie ...................................... .. 324/106
10/1974 Ley et a1. ..
.... .. 324/106
3,928,800 12/1975 Strenglein
324/106
mean once a second. ten times a second. or as is preferred.
Primary Examiner-Ernest F. Karlsen
Assistant Examiner-Anh Phung
Attorney Agent, or Fimt-EdWard L. Miller
,
,
; 9WD
;
-|—
POWER
Ti
m
._.".__ :
S
H73
f‘
5O
W
I
58
32
g
6 Claims, 5 Drawing Sheets
FlNE STATIC BALANCE
__________________ _~
ACTUAL
SLOW
at the start of each measurement.
(47
on],
5 kHz
34
r
51s
36
DAC
__—__—-€
(y)
INTEGRATOR
ANALOG
46
MULTIPLIER
70
_| S
49
|
m
30
mm
'
35
5 40
71
m
B
"'3'
A
41
'
T
°_AL3§,1§‘§ETR‘¢
»' I’ SUBSTRATE
.
:
An
-
_
FILTER
81
s2
S
43
‘ """" “
BUAFMEPER
T
E
*
4B
DETECTOR
484
as
i
i
455
:
INTEGRATOR
'
i T
BUFFER
55
SLOW mm
POWER CIRCUIT
AMP
SYNCHRONOUS
|
515366
TN
_’
\_
COMPARISON
DELTA POWER 74
l
LOG
i
,
g ....................... f ‘‘‘‘ “Te-25 kHz :
—--4
:
: X I:61 REF
:
400g
_______________ '7
F72
LOW PASS
42
i
58
+
POWER~/‘9
ggé??gmm
ADC
84
27*’
AMP
[53
‘ 5
SLIGHT
OFFSET
54
A
r61
R<~ SUBSTRATE
TEMPERATURE
0<— CONTROLLER
0<
US. Patent
Sep. 2, 1997
%
2:5<53E:
Sheet 5 of s
5,663,638
75
\v COMPARISON
SLOW POWER IN (57)
FIG. 5A
77
w
78
(76
COMPARISON SLOW POWER m (57)
FIG. 5B
NON LINEAR
FEED BACK
f
74
COMPARISON
SLOW
POWER IN
/> DELTA POWER
>
S
57
FIG. 5C
5,663,638
1
2
CALORIMETRIC RF POWER METER WITH
DYNAMIC ZEROING AND CONSTANT
TEIVIPERATURE AND POWER DISSIPATION
IN THE CALORIMET'RIC BRIDGE
be desirable if this need for thermal time constant response
time could be eliminated.
A control loop can use an ampli?er or an integrator to
form the feedback signal. In many situations where a small
change is to be measured and a DC measurement technique
is prone to unacceptable drift. it is advisable to shift to AC
measurement techniques. In these cases a synchronous
detector coupled to an integrator form an attractive combi
REFERENCE TO RELATED APPLICATION
The subject matter of this application is related to what is
disclosed in US. Pat. application Ser. No. 08/548.067
entitled METHOD AND APPARATUS FOR MEASURING
RF POWER INATEST SET. ?led on 25 Oct. 1995 pending
by Melvin D. Humpherys and assigned to Hewlett-Packard
Co. US. patent application Ser. No. 081548.067 is hereby
nation for forming the actual feedback signal from the
10
power measurement technique. the integrator output is used
to produce heat. then either polarity of output from the
integrator can cause a point of balance. However. one
expressly incorporated herein by reference.
BACKGROUND OF THE INVENTION
15
Developments in semiconductors in the last decade or so
and recent changes in the allocation of portions of the radio
frequency spectrum have contributed to the vigorous growth
to zero. even when the bridge is actually balanced. As a
needed. repaired and tested. The advent of spread spectrum
technologies. such as CDMA in the United States and GSM
included in the test equipment. to allow that aspect of the
performance of the device under test to be evaluated. Such
25
bridge is indeed balanced.
SUMMARY OF THE INVENTION
separate instruments need not apply . . . ) as well as 30
adaptable to future developments.
Among the things that such a test set has to do is measure
RF power. The power measurement module of such a test set
ought therefore to be small. accurate. broad band. suitable
power into a terminating load. and thermally couples the
heat generated to a temperature dependent resistance that is
does not attempt to measure that common power. Actual
input power to be measured does initially unbalance the
45
meters of this sort have been known for some time. See for
eliminates internal thermal transients within the bridge that
lengthen response time.
Journal entitled “Microprocessor-Enhanced Performance in
of the components within the bridge can be trimmed into
balance. they still have temperature coe?icients. and it is
exceedingly di?icult to control the thermal paths within the
physical part. The result is that under a thermal gradient.
such as the application of power to be measured. the bridge
can become unbalanced owing to an unsymmetrical
bridge. and is still measured as before. A constant power
circuit is response to the indication of measured power and
acts to keep the sum of measured power (plus the equal
amount of feedback power that balances the bridge) and the
common mode power at a constant value corresponding to
a full scale measurement. or perhaps even a little more. This
example. the Operating and Service Manual for the Hewlett
Packard Model 434A Calorimetric Power Meter (circa
1961). A more recent example of this technique can be found
in an article on page 26 of the July 1987 Hewlett-Packard
The accuracy of calorimetric bridges is affected by
temperature. and especially by temperature diiferentials
occurring across the bridge. Even though the electrical value
A second solution to the problem of differential heating is
to heat the bridge internally by an amount that varies
according to the applied power to be measured. This acts to
eliminate the principal source of thermal gradients in the
?rst instance. By applying this heat as a common mode input
signal to the two terminating loads of the calorimetric bridge
the bridge itself does not become unbalanced. and therefore
one arm of a bridge. This unbalances the bridge and pro
duces an error signal within a servo loop. The servo responds
by applying DC or low frequency power to a separate but
an Analog Power Meter".
A solution to the problem of differential heating inside the
calorimetric bridge is to first heat the bridge externally and
control the resulting temperature. An actual insulated oven
could be used if desired. although it may be su?‘icient to rely
upon a heated thermal mass without insulation.
35
and poses a signi?cant challenge to the designers of a test set
to be used with radio equipment such as cellular telephones.
A calorimetric RF power meter is a device that accepts RF
identical terminating load whose heat is coupled to another
arm of the temperature sensitive bridge. The applied power
is measured by metering how much power is required of the
servo loop to rebalance the bridge. Calorimetric RF power
complication to the logic of the servo loop. that brute force
solution is indeed manageable. but it can nevertheless have
the disadvantage of limiting the accuracy with which small
signal levels can be measured. It would be desirable if this
limit on dynamic range could be eliminated by allowing the
integrator output to operate much closer to zero when the
test equipment ought to be reliable and relatively compact
(those wishing to sell systems comprising a rack full of
for pulse modulation applications in addition to CW. and.
inexpensive. That is quite a list of disparate requirements.
polarity has associated therewith the wrong logical sense of
change as between the feedback signal and the error signal.
If the system gets into that state the feedback is not longer
negative. but becomes positive. As a result. it is generally
necessary to anticipate a worst case of margins and then
prevent the integrator output from getting within that close
in the uses and markets for various portable transceivers.
such as used in cellular telephone swim and GMRS. That
which is to be manufactured must also be tested and. as
in Europe. require that additional levels of sophistication be
ampli?ed error signal. If. as in the case of a calorimetric
55
A solution to the problem of being unable to operate the
integrator output su?iciently close to zero is to periodically
remove the applied input and introduce into the servo loop
a suitable slight offset from the true balance condition. and
then exactly balance the bridge with a separate sample and
hold control loop. “Periodically” can mean once a second.
ten times a second. or as is preferred. at the start of each
measurement.
BRIEF DESCRIPTION OF THE DRAWINGS
FIG. 1 is a simplified block diagram of a test set for radio
communication equipment. such as cellular telephones and
response of the bridge itself to the thermal gradient. In time.
if steady state conditions are maintained. the gradient will
GMRS transceivers. and that includes an RF power mea
level out and an accurate answer will be available. It would
with the invention;
surement capability constructed and operating in accordance
5,663,638
3
4
FIG. 2 is a an expanded yet still simpli?ed block diagram
of an RF power measurement portion of the test set FIG. 1;
FIG. 3 is an expanded block diagram. for a portion of the
block diagram of FIG. 2. representing a calorimetric RF
power meter that includes dynamic zeroing and constant
temperature and power dissipation in the calorimetric
RF power from the DUI‘ 2 is coupled by line 18 and coupler
bridge;
4 to a gain stage 20 whose gain may be set to a convenient
amount. which includes zero. The signal from the gain stage
20 is applied to a switch 21. When the switch 21 is thrown
5
20) connected to a test port. This facilitates test and cali
bration of the test set itself. The switch 21 may also be set
to position 23. which couples the DUT to a “fast” power
.
FIG. 4 is diagram indicating certain aspects of operation
measurement module 25 that uses a diode power sensor. The
that are of interest for the calorimetric RF power meter of
response time of the “fast” power measurement module 25
is in the microseconds and its output information 27a is
made available as a part of POWER MEASUREMENT
RESULTS 9. as well as being applied as an input to an auto
range controller 28. The output of the auto range controller
FIG. 3; and
FIGS. SA~C are diagrams describing a constant power
circuit shown in the block diagram of FIG. 3.
DESCRIPTION OF A PREFERRED
EMBODIMENT
Refer now to FIG. 1. wherein is shown a simpli?ed block
diagram 1 of a test set for use with radio communication
equipment. such as cellular telephones and GMRS trans
ceivers. A DUI‘ 2. or Device Under Test. represents the radio
communication equipment to be tested. In this particular test
set 1 there are two signal generators l0 and 11 and two
receivers 13 and 14. Of the two receivers. receiver #1 I3 is
coupled to various measurement circuits that provide mea
to position 22 the output of the DUT is (via the gain stage
28 is used to set the gain of the gain stage 20. The embedded
control system periodically sets switch 21 to position 23
expressly so that the gain of gain stage 20 may be set to a
value that places the output power level of the gain stage
20
within the dynamic range of the “slow” power measurement
module 26. It will be understood. of course. that the “fast”
power measurement module 25 can also be used to perform
primary power measurements on the DUT whenever a fast
response is required; e.g.. pulsed power measurements.
sured data called RECEIVER RESULTS 15. The operation
‘Those interested in more information about what is in the
fast power measurement module 25 may ?nd it instructive to
of the receivers (13. 14) and signal generators (10. 11) is
controlled by a protocol generation and recognition machine
08/548,067.
17. This is principally an embedded microprocessor con
trolled system that interacts on the one hand with an operator
arrangement that obtains when switch 21 is set to position
through a display and control panel (not shown) or with
external controller such as another computer system (not
shown) to select or specify the type of measurement or test
to be performed. and on the other hand with the internal
resources of the test set (e.g.. the signal generators 10 8: 11
and receivers 13 & 14) to set up and perform those mea
surements and tests. An important task of the protocol
generation and recognition machine 17 is the ability to take
into account the speci?c properties and behaviors that make
up the various standards by which the radio communication
consult the aforementioned patent application Ser. No.
To continue. we shall ?nd it convenient to dwell on the
30
measurement module 26 whose power sensor is a calori
men'ic bridge. The output of the “slow" power measurement
module 26 is information 27b that is part of the POWER
35
Now consider the block diagram shown in FIG. 3. What
is shown is a simpli?ed block diagram of the “slow" power
measurement module 26. At the upper left of the block
diagram is the input signal ACTUAL SLOW POWER IN 30.
while at the lower right appears the output signal 27b that is
part of POWER MEASUREMENT RESULTS 9. We are
interested now in what goes on inbetween these two signals.
ter and power combiner to allow simultaneous access to the 45
DUT 2 by the signal generators 10 and 11 and by the
receivers 13 and 14. This action is represented schematically
by individual components 5. 6 and 7. We shan’t have much
power present in the path 18 connecting the combiner]
splitter element 5 to the DUT 2.
To this end. note sampler 4. which may be a suitable
directional coupler. which extracts a signal. say. 20 db below
that present in line 18 and applies it to a power measurement
module 8 whose output may be called POWER MEASURE
MENT RESULTS 9. POWER MEASUREMENT
RESULTS 9 may be taken with RECEIVER RESULTS 15
as comprising the raw measurements of the performance of
the DUT 2. These measurements are interpreted by the
protocol generation and recognition machine 17.
Refer now to FIG. 2. wherein is shown in block diagram
form 19 an expansion of the power measurement module 8.
The input signal ACI‘UAL SLOW POWER IN 30 is
applied to a calorimetric bridge substrate 31 that includes a
509 terminating resistor 32 that is closely thermally coupled
to a sensing resistor 35 whose resistive value has a signi?
cant dependence upon temperature. Sensing resistor 32 is in
more to say about the elements 5. 6 and 7 in combiner]
separator 3. save that they must provide certain desirable
MEASUREMENT RESULTS 9. Our interest is primarily in
certain aspects of the operation and construction of the
“slow" power measurement module 26.
equipment is to operate, such as CDMA and GSM.
That said. it will be appreciated that a signal combiner!
separator 3 couples the DUT 2 to the various signal gen
m'ators and receivers in the test set 1. Principally. the
combiner/separator 3 functions as a specialized power split
isolation between various ones of the DUT and the signal
generators and receivers. must not be lossy. and must be
fairly broad band (say. ?at from below 50 MHz to above 2
GHZ). Our present interest is in the measurement of RF
24. In such a case we shall say that the signal ACTUAL
SLOW POWER 30 is coupled to the input of a “slow” power
50
series with a load resistor 34. and forms a voltage divider
therewith. Areference signal generator 46 produces a 5 KHz
signal 47 that. among a number of other places. is applied to
the top of the voltage divider formed by resistors 34 and 35.
Thus. the amplitude of the 5 KHz signal 49 at the tap of the
55
voltage divider is (principally) determined by the amount of
power being dissipated in terminating resistor 32.
Now observe the signal COMPARISON SLOW POWER
IN 57. It is a DC or low ?'equency signal applied to a 500
resistor 33 identical to resistor 32. Resistor 33 is closely
thermally coupled to a sensing resistor 37 identical to
sensing resistor 35. Resistor 37 is also in series with a load
resistor 36 identical with load resistor 34. so that resistors 36
and 37 form a voltage divider corresponding to the voltage
divider formed by resistors 34 and 35. The voltage divider
formed by resistors 36 and 37 is also occupied at its top to
the 5 X112 reference signal 47. Ideally. the amplitude of the
signal 41 produced at the tap of this second voltage divider
5,663,638
5
6
will equal that of the signal whenever power level of the
That is. what we really seek is the measured power when
power is applied minus any residual “measured power”
signal COMPARISON SLOW POWER IN 57 is the same as
that ACTUAL SLOW POWER IN 30. It is the job of the
circuitry inbetween the two signal 30 and 57 to servo signal
57 to match signal 30 by nulling to zero the di?’erence
between signals 40 and 41. That done. the power level of
signal 30 can be inferred by a direct measurement of the
amplitude of signal 57. and the knowledge that resistor 33 is
509. Along the way however. there arise some signi?cant
opportunities for error.
To continue. the calorimetric bridge substrate 31 is a
when power is not applied. Of course. the residual measured
power does not represent real power. but drift or other
imbalance in the system. One of these imbalances concerns
the operating point of the main servo loop when there is
indeed no power applied.
Let’s assume for a moment that the system is truly ideal.
Then. for zero RF in signals 40 and 41 are exactly equal. and
the error signal all around the loop would be zero. In
particular. the output of integrator 52 would be zero. Now.
if there were just a slight amount of power applied to the
ACI‘UAL SLOW POWER IN 30. the error signal from error
uni?ed assembly fabricated using thin ?lm and integrated
circuit techniques. The 50!! resistors 32 and 33 are formed
of meandering titanium traces. for example. and the entire
assembly 31 is packaged up in its own little can. It is not.
however. a part that was speci?cally designed for this
particular application. It was designed to be an RF power
15
back into balance. If the integrator overshot. or the actual
input power level decreased. the synchronous detector 45
sensor. to be sure. but for us happens to be an already
would reverse the sign of the recti?ed error signal. and the
existing part whose speci?cations and tolerances were
selected to suit an earlier application. For reasons of
ampli?er 42 would be recti?ed and produce. say. a positive
signal to apply to integrator 52. In turn. it would produce a
positive going ramp that would eventually bring the loop
20
economy. it is desirable to take advantage of this existing
part. and ?nd a way to live with certain “shortcomings” that
result. (It is not that the part is a “bad” part; it is more that
if we were designing it for the ?rst time we would change
integrator would ramp back down. The sign of the integrator
output would still be positive. however.
Now. in a real system there are always imbalances and
offsets. however small. This means that the loop will come
into balance with a slight integrator output. Absent the need
some things to be more appropriate to our intended use. 25 to measure applied power. that quiescent state of slight
Even if we did. however. issues we are about to explore do
integrator output could as easily be a slight negative output;
after all. that would still produce power in resistor 33 that
ought to balance the loop. Heat is heat. Ah. but what then of
the logical sense of the control signal? If the loop overshoots
not altogether vanish.)
So. let us ?rst describe the overall servo loop that nulls the
diiference between signals 40 and 41 by adjusting the power
level of signal 57. That done. we can return to a description 30 the polarity of the signal from the synchronous detector 45
would still be negative. which would drive the output of the
of the “shortcomings” and what to do about them.
To begin. then. note that signals 40 and 41 are coupled to
a difference ampli?er 42 whose output is applied to a low
pass ?lter 43. The main purposes of the low pass ?lter 43 are
to assist in setting the dynamic behavior (step response) of
35
integrator 52 still more negative. further adding to the
overshoot. In other words. the logical sense of the control
signal has been reversed. The result is that the servo drives
itself to the rail. and locks up. Clearly. this mode of operation
the servo loop and to suppress harmonics of the ampli?ed
error signal. The output of the low pass ?lter 43 is coupled
to a log ampli?er 44. whose output is in turn applied to a
must be avoided. As a practical matter. this means that actual
operational “zero point" of the loop must not be set so close
to the actual zero crossover of the integrator that noise. drift
synchronous detector 45. The synchronous detector 45 oper
ates to rectify the ampli?ed 5 KHz error signal; the resulting
DC signal has a polarity indicative of whether COMPARI
or other loss-of-margin conditions inadvm‘tently pushes the
servo system over the edge. Absent some better mechanism.
the brute force accommodation for this situation is to simply
put the operational zero point at what is really the ten percent
SON SLOW POWER IN 57 is too high or too low. and is
applied via switch 48 to either an integrator 49 during an
instance of dynamic zeroing. or to an integrator 52 at other
point in the safe operating region. This works. but uses up
dynamic range and make the measurement of low power
times. Integrator 52 responds to the continued presence of a 45 levels less accurate.
Reference to FIG. 4 will be useful at this point. FIG. 4 is
recti?ed error signal by ramping its output up or down until
a graph 62 of the COMPARISON SLOW POWER 1N along
the recti?ed error signal vanishes. During these “other
abscissa 64 needed to null the servo loop for different
times” (i.e.. during power measurement) the output of the
mounts of ACTUAL SLOW POWER 1N along ordinate 65.
integrator 52 is coupled via switch 55 to a bu?’er ampli?er
56. which may be a unity gain ampli?er. It supplies the heft 50 Because of the symmetry of the calorimetric bridge 31. the
slope of the resulting line in the graph is one; ten milliwatts
needed to drive the relatively low impedance of the 500
of comparison signal 57 balances ten milliwatts of input
resistor 33. It will further be appreciated that bulfer ampli?er
signal 30. Thus. line 63 is depicted as being at forty-?ve
56 might be replaced by an analog multiplier circuit 82
degrees to the axes. Range 67 would be the ideal range over
whose two inputs were the output of the integrator 52 via
switch 55 and a low frequency AC signal 83 (say. 25 I612). 55 which the loop would operate if there were no concerns
about the output of the integrator 52 going negative.
In this way the signal COMPARISON SLOW POWER IN
57 would become an AC signal instead of one that is DC.
Once this main servo loop comes into balance. (which is
perhaps on the order of several milliseconds) an ADC
However. as we have seen. that is not a practical realization;
(analog to digital converter) 84 measures the amplitude of
the integrator output signal (applied to the input of the bu?er
ampli?er 56 or to the input of multiplier 82) to produce
output 27b which is part of the POWER MEASUREMENT
RESULTS 9.
We now consider certain improvements that make the
thing work better. To begin with. it will be appreciated that
crossover point of the loop one might adopt operating range
68. This would be done by simply building into the loop
a power measurement is really a di?erence measurement.
dotted line 66 represents the unhealthy case. To keep the
zero applied power condition from approaching the actual
su?icient o?’set to prevent the worst case pile-up of bad
65
margins from producing an actual operating point that was
too close the origin of the graph 62. One simply then scales
the range 68 to represent the range of actual applied power.
That is. the ten percent point at the lower end of range 68
represents no applied power. while the full scale point
5,663,638
7
8
represents full scale applied power. As mentioned above. it
idea of modifying the part. 80. we located the sensing
is not that this does not work. It is more that it interferes with
resistor close to the bridge sensor. put then both under a
common canopy of thermal mass. and then surrounded all of
that with a ring of heater resistors. All that stuff is mounted
on a printed circuit board. This controls the temperature of
the calorimetric bridge sensor (substrate) to about one
dynamic range and makes measurement of low power levels
less accurate.
A better way would be to be able to safely adopt range 69
as the operating range; it’s lower end is at. say. one percent.
degree Celsius. The whole works just described occupies
This is desired. even though we are either unable to. or
choose to not. decrease the olfsets and imbalances that
combine to suggest the need for a ten percent margin in the
?rst place. Simply put. we instead choose to operate the
main loop ?ght next to the hairy edge. as it were. under the
control of another control loop. With reference again to FIG.
3. here is how it is done.
about one half a square inch of board space. for perhaps a
10
oven were used.
Even then however. there would still be short term
changes in the average tempaature of the various elements
within the bridge. owing to the application and removal of
ACTUAL SLOW POWER IN 30 accompanied by the
First. we need a way to counter any imbalance in the
caloritnetric bridge 31 traceable to the two resistive dividers
(34/35 and 36/37). The ?rst tool for this is the ability to
remove any input otherwise present on line 30. ACTUAL
duplicate (done by the main servo loop) application and
SLOW POWER IN. This is accomplished by setting the gain
of gain stage 29 (see FIG. 2) to zero. The second tool for this
is resistor 70 and DAC 51 (think: “programmable resistor”).
Resistor 70 is small enough to. by itself. ensure that the loop
quarter of an inch high. Greater control of the temperature
of the bridge sensor could be achieved if a genuine insulated
20
removal of COMPARISON SLOW POWER IN 57. These
transient changes in operating temperature can reveal track~
ing errors in the temperature coe?icients of the resistors
making up the voltage dividers. How can we keep the bridge
31 warmed as if power were applied even when it isn't?
Suppose that no power is being applied via lines 30 and
57. Now apply duplicate amounts of power via resistors 58
and 59 to resistors 32 and 33. respectively. Let the amount
applied be approximately the amount resistors 32 and 33
would experience under full scale measurement conditions.
gets unbalanced one way. no matter where in the allowable
range of tolerances the voltage dividers end up. DAC 51 is
then chosen to be able to move the loop back the other way
by at least an amount equal to any worst Case imbalance in
the ?rst way. This is a long way of saying that it is
guaranteed that some setting for DAC 51 will serve to
balance the loop right at the true zero crossover. perhaps plus
even a little more for safety. DAC 51 is initially set at say;
(An actual measurement initially unbalances the bridge. and
so provokes a rebalancing via the error signal.) However.
these conditions we speak of now are not measurement
the one percent mark. Note that DAC 51 is not an active part
conditions! We are assuming that we apply the same power
to each of resistors 32 and 33. so their heating does not
unbalance the bridge; no error signal appears at error ampli
of the dynamic zero control loop promised above; it simply
provides an initial operating point which may drift. but
nevertheless “centers” the range of that dynamic zero con
integrator 49 whose output 50 is applied as one input to an
?er 42. and integrator 52 does not ramp. MEASUREMENT
CONDITIONS DO PRODUCE AN INTTLAL UNBAL
ANCE OFTHE BRIDGE; WHILE DRIVING RESISTORS
58 AND 59 DOES NOT. Resistors 58 and 59 are driven by
a signal DELTA POWER 74 that is produced by a constant
power circuit 60. The main servo loop cannot tell if constant
power circuit 60 is driving resistors 58 and 59 or not. for its
etfect is common mode, and does not unbalance the calori
analog multiplier 71. The other input to the analog multiplier
mettic bridge 31. So. the main servo does its thing for
trol loop.
The control loop we seek dynamically sets the operational
35
zero point of the main servo loop. To do this. switches 48
and 55 are periodically set (together) to the positions oppo
site the way they are shown in the ?gure. This connects the
output of the synchronous detector 45 to the input of
71 is the 5 KHZ reference signal 47. The output of the analog
multiplier 71 may be thought of as a false en-or signal (as if
from the voltage dividers in the bridge 31) that is coupled to
the arm ampli?er 42. As before. the main servo system nulls
itself. so that the output from the error ampli?er goes to zero.
Now. if there were no power going into bridge resistor 33
applied power. regardless of whether or not the constant
power circuit is present.
The constant power circuit 61 knows how much power
45
during this operation. this hulling would indeed tend to put
the main loop right onto the exact loop crossover point: a
very risky thing to do and almost certain to result in disaster.
However. we do not let the power in bridge resistor 33 be
zero! No Sir. we set it at the one percent mark by the action
of switch 55 and the slight offset 54 applied to bu?’er
ampli?er 53. Thus it is that the dynamic zm'o servo loop of
integrator 49 and analog multiplier 71 nulls to the one
percent mark. Once this null has been achieved. switches 48
and 55 are set back to their normal positions. Integrator 49
simply holds its last output with very little drift until the next
(DELTA POWER 74) to apply to the bridge via resistors 58
and 59 because it monitors the same signal 57 that is metered
to determine the POWER MEASUREMENT RESULTS 9.
If zero power is being applied for measurement. then signal
57 is at its minimum (the dynamic zero loop keeps it close
to. but safely away from zero. remember). then the constant
power circuit 60 needs to produce exactly equal full power
heating in each of resistors 32 and 33. If the input power to
be measured were half of full scale. then the balance of full
scale would be made up in the terminating resistors 32 and
55
33 by the constant power circuit 60. And if the input power
to be measured were full scale. then no power would be
supplied by the constant power circuit 60.
So. the constant power circuit 60 simply maps the mini
dynamic zero cycle.
A further enhancement in the performance of the calori
metric bridge 31 may be obtained by arranging that it
mum to maximum excursion of signal 57 into an appropriate
excursion at the common end of resistors 58 and 59. The
operate at a constant temperature. To this end a substrate
temperature controller 61 is provided. in conjunction with a
resistance of 4009 for resistors 58 and 59 in comparison to
the values of 509 for resistors 32 and 33. The value of 4009
exact relationship of that mapping is determined by chosen
heater resistor 39 and a sensing resistor 38. These two
for resistors 58 and 59 was selected to minimize the dis
elements are not actually part of the bridge substrate 31.
continuity caused by their presence.
although they could be. It will be recalled that we used an
Despite what was earlier said about the possibility that
COMPARISON SLOW POWER IN 57 could be either an
existing part. and the keeper of the masks was cool to the
5 ,663,638
9
10
AC or a DC signal. it can now be appreciated that if the
POWER 74 by the constant power circuit 60. It can be
shown. given the simpli?cations set out above. that the curve
75 is a quadrant of a circle.
Analog circuits that have (exactly) such a transfer func
tion from input to output are. well. di?icult. It turns out that
in the present situation an approximation works quite satis
factorily. The approximation is shown in FIG. 5B as the
graph 78. It is a piecewise linear approximation that can be
obtained by those skilled in the art using any of a variety of
constant power circuit 60 is to be employed. it may be
advantageous if COMPARISON SLOW POWER IN 57 is
an AC signal. In this way it can be arranged that there be DC
blocks at locations 72 and 73. In this way it is now certain
that the DC power added by the constant power circuit will
indeed be dissipated in the terminating resistor 33. regard
less of the presence or absence of COMPARISON SLOW
POWER IN 57. To the same end. it could be arranged that
the power provided by the constant power circuit 60 be
shaped ampli?er circuits similar to what is depicted in FIG.
5C. FIG. 5C shows the generalized form a shaped ampli?er
delivered as AC.
The particular way we have shown the constant power
circuit 60 is one that is perhaps best suited for an analog
circuit that operates on the analog value of COMPARISON
SLOW POWER IN 57 to produce the drive DELTA POWER
74 to resistors 58 and 59. An alternate method of producing
the drive to resistors 58 and 59 is to let the constant power
circuit 60 include a DAC whose setting is obtained either
from a calculation or a look-up table based on the digital
value 27b (POWER MEASUREMENT RESULTS 9).
20
Certain aspects of one possible such constant power
circuit 60 is shown in FIGS. SA-C. The relationship we are
interested in is Papp+Pmp+AP=C By this we mean that the
fairly well represented by the approximation produced by
applied power to be measured (30) and the resulting com
parison power (57) produced to balance the calorimen'ic
25
bridge. when added to delta power (74) sum to some
constant amount. probably best taken to be twice full scale
for Paw. We could also say that 2PcomP+AP=C. For the sake
of brevity we omit the rigorous demonstration. merely
reminding the reader to keep in mind that power is propor
tional to the square of the voltage and that overall amount of
power that the constant power circuit 60 needs to produce
must be divided among the isolation resistors 58 and 59 in
order to get it to the terminating resistors 32 and 33.
For the sake of simplicity let us also temporarily assume
30
as shown in FIG. 5C or with a DAC driven by a look-up
table or computation based on signal 27b. than it is to do it
35
for a quadrant of a circle.
It will be appreciated that the constant power circuit 60
enhances the operation of the dynamic zero mechanism (49.
50. 71). Why this is so may be understood by recalling that
the dynamic zero mechanism ?rst removes the applied input
or roughly from 25 mv to 500 mv for a 509 system. The
30, and then does the zero. If there were a substantial level
analog multiplier 82 is much better suited to operating at a
higher level (several volts). The solution is to attenuate the
of power applied at the time of removal. then a signi?cant
amount of time would need to pass to allow the thermal
output of the analog multiplier 82. rather that try to operate
transient to expire before an accurate zero could be set.
it at levels where noise and nonlinearity are less favorable.
45
Likewise. after the zero set operation the re-application of
power would cause another thermal transient whose pres
ence interferes with accurate readings. The constant power
circuit 60 eliminates these transients. and allows the overall
measurement system to dispense with thermal equilibration
time associated with temporary imbalances introduced by
legitimate changes in operating temperature. It does this by
big.) Overall. this is good for the multiplier performance
reasons stated above. but it also provides the simplicity (or
removing those changes in operating temperature.
removes a complication) that was alleged in the ?rst sen
Finally. if the constant power circuit is present. a further
purpose for either bu?’er ampli?er 56 or multiplier 82 will be
55
POWER 74 all involve the same nine to one attenuation.
Because of this symmetry our earlier statements about
Papp+PmW+AP=C and 2?
+AP=C can be understood not
only as applying to the 509. terminating resistors 32 and 33.
but also to the series combination of those with an appro
priate one of the 400!) isolation/attenuation resistors.
With all these preliminaries safely understood. now con
changes is that the graph 75 in FIG. 5A changes from being
a quadrant of a circle to a quadrant of some ellipse. It is no
more dii?cult to approximate that with either a circuit such
range of power levels that may be applied to either of the
terminating resistors 32 and 33 is from —16 dbm to +8 dbm.
tence of the paragraph. The simplicity arises because now
the circuits (82 or 56) that originate COMPARISON SLOW
POWER IN 57 and the circuit 60 that originates DELTA
the shaped ampli?er circuit of FIG. 5C. If the constant power
circuit 60 were implemented with a DAC (not shown) driven
by a look-up table or computation based on signal 27b. then
the approximation could be very near to perfect. indeed
Now. what of those who desire that there be a value of
resistance at location 81 that is different from that of the
isolation resistors 58 and 59. Perhaps there is to be no
resistance at all at that location. What then? Well. all that
that buffer ampli?er 56 is absent and that in its place is
multiplier 82 and 25 KHz reference signal 83. Now. the
Suppose we put a 4000 resistor at location 81; this produces
a 9:1 attenuation between the output of the analog multiplier
82 and what is produced across terminating resistor 33.
(Note that it is now also necessary to adjust the interpretation
of the output 27b of the ADC 84; it is now nine times too
circuit that may be used as an analog instance of constant
power circuit 60. As seen in the ?gure. the basic idea is to
surround an ampli?er 79 with a nonlinear feedback network
80. The nonlinear feedback network 80 may contain diodes.
zeners. and perhaps other ampli?ers. One of the reasons that
such an approximation works quite well is that. at low power
levels the exact graph 75 in FIG. SA has the lowest dx/dy.
and at high power levels has the greatest dx/dy. These
extremes are perhaps the regions of greatest interest. and are
60
appreciated. That further purpose is isolation. That is. they
prevent any levels generated by the constant power circuit
60 from being measured by the ADC 84 and contributing
(incorrectly. as it would be) to the signal 27b and POWER
MEASUREMENT RESULTS 9.
I claim:
1. An RF power meter comprising:
a calorimetric bridge including an incident power port
sider the graph 75 in FIG. 5A. The abscissa 76 represents the
coupled to receive an RF work signal whose power
voltage produced at the output of analog multiplier 82 (or.
level is to be measured. a comparison port coupled to
receive a balancing signal. a bias input coupled to
receive a bias signal. and ?rst and second difference
possibly at the output of buffer ampli?er 56. so long as there
is a 4009 resistor at location 81). The ordinate 77 represents
the corresponding voltage that is to be produced for DELTA
65
outputs at which appear respective ?rst and second
5,663,638
11
12
difference signals derived from the bias signal and
whose amplitudes di?er in proportion to the ditference
in power level between the work signal and the bal
having an input coupled to the digital compensation value
and having an output coupled to the compensation output.
5. An RF power meter as in claim 1 further comprising:
ancing signal;
a heater resistance thermally coupled to the calorimetric
a servo circuit coupled to the ?rst and second di?erence
bridge;
signals and producing therefrom the balancing signal.
a temperature sensor thermally coupled to the calorimetric
the servo circuit adjusting the power level of the
bridge; and
balancing signal to minimize the amplitude diiference
a temperature controller. coupled to the temperature
between the ?rst and second difference signals;
a compensation circuit having an input coupled to the
sensor. that maintains the calorimetric bridge at a
constant ambient temperature.
balancing signal and having a compensation output;
?rst and second isolation networks each coupled at one
6. An RF power meter as in claim 1 wherein the servo
end to the compensation output and respectively at their
other ends to the incident power port and the compari
circuit includes an integrator and the RF power meter further
son port; and
comprises:
15
comparison port. the compensation circuit adjusting
these additional powers such that the sum of these
additional powers. the power of the work signal and the
power of balancing signal. is a constant.
2. An RF power meter as in claim 1 wherein the ?rst and
second isolation networks are resistors whose values of
resistance are equal.
20
25
3. An RF power meter as in claim 1 wherein the com
pensation circuit comprises an analog shaping ampli?er.
4. An RF power meter as in claim 1 further comprising an
analog to digital converter coupled to the balancing signal to
produce a digital power level signal and fln'ther wherein the
compensation circuit comprises a look-up table addressed by
the digital power level signal to produce a digital compen
sation value and also comprises a digital to analog converter
a circuit. in series with the RF work signal before the RF
work signal is applied to the incident power port. that
at selected times reduces the power level of the RF
work signal at the incident power port to substantially
the compensation circuit applying equal amounts of addi
tional power to the incident power port and to the
30
zero;
an oifset circuit that during the selected times causes the
servo circuit to produce for the balancing signal a
selected ?xed value corresponding to a minimally
detectable non zero power level for the RF work signal;
and
a zero balance circuit coupled to an error signal within the
servo circuit that during the selected times nulls to zero
that error signal by varying the conduction in a shunt
between the bias input and the ?rst di?terence output
and that during other times maintains the conduction in
the shunt at its most recent value during a selected time.
*
*
*
*
*
UNITED STATES PATENT AND TRADEMARK OFFICE
CERTIFICATE OF CORRECTION
Page 1 of 2
PATENT NO.
DATED
:
5 , 663 , 638
September 2, 1997
|NVENTOR(S) ; Melvin D. Humpherys
It is certified that error appears in the above-identified patent and that said Letters Patent is hereby
corrected as shown below:
Column 2, line 16, "not" should read --no--; and
line 46, "response" should read --responsive--.
Column 3, line I, delete "a" after "is";
line 8, insert --a-- after "Fig. 4";
lines 29 and 30, between "with" and "external" insert --an--;
line 58, "20db" should read -—20dB-~.
Column 4, line 31, "SLOWPOWER 30“ should read --SLOW P OWER IN
30--;
line 65, ”occupied" should read ~—coupled--.
Column 5, line 1, "signal" should read --signal 40—-;
line 3, "that ACTUAL" should read —-that of ACTUAL--; and
line 4, "signal 30" should read --signals 30-
Column 7, line 11, ”?ght" should read --right--;
line 25, "Case" should read --case--;
line 29, "at say;" should read --at say,--; and
line 48, "hulllng" should read --nulling--.
Column 8, line 61, insert —-a-- after "by".
UNITED STATES PATENT AND TRADEMARK OFFICE
CERTIFICATE OF CORRECTION
Page 2 of Z
PATENT NO.
DATED
: 5,663,638
; September 2, 1997
mvemorus); Melvin D. Humpherys
It is certified that error appears in the above-identified patent and that said Letters Patent is hereby
corrected as shown below:
Column 9, line 36, "is" should read --are--;
line 39, "-16dbm" should read -- -l6dBm--; and
" +8dbm" should read --+8dBm--.
Signed and Sealed this
Eighth Day of February, 2000
Q. TODD DICKINSON
AIIéSIHlg ODCICEV
(‘mnmiaxsiunvr of Parents and Trudemurkx


![Imprima este artículo - Poli[Papers]](http://vs1.manualzilla.com/store/data/006296209_1-1b337421890e8df5407f26e081d22ead-150x150.png)