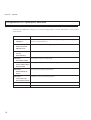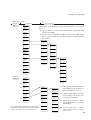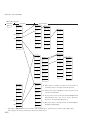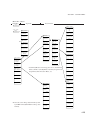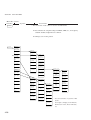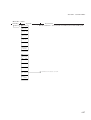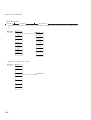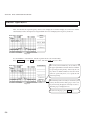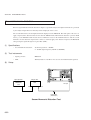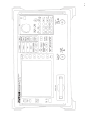
1
MS2661N
Spectrum Analyzer
Operation Manual
Vol. 1
(Basic Operating instructions)
Fourth Edition
Read this manual before using the equipment.
Keep this manual with the equipment.
ANRITSU CORPORATION
Document No.: M-W1813AE-4.0
i
Safety Symbols
To prevent the risk of personal injury or loss related to equipment malfunction, Anritsu Corporation uses the following
safety symbols to indicate safety-related information. Insure that you clearly understand the meanings of the symbols
BEFORE using the equipment. Some or all of the following five symbols may not be used on all Anritsu equipment.
In addition, there may be other labels attached to products which are not shown in the diagrams in this manual.
Symbols used in manual
DANGER
This indicates a very dangerous procedure that could result in serious injury or
death if not performed properly.
WARNING
This indicates a hazardous procedure that could result in serious injury or death if
not performed properly.
CAUTION
This indicates a hazardous procedure or danger that could result in light-to-severe
injury, or loss related to equipment malfunction, if proper precautions are not taken.
Safety Symbols Used on Equipment and in Manual
The following safety symbols are used inside or on the equipment near operation locations to provide information
about safety items and operation precautions. Insure that you clearly understand the meanings of the symbols
and take the necessary precautions BEFORE using the equipment.
This indicates a prohibited operation. The prohibited operation is indicated
symbolically in or near the barred circle.
This indicates an obligatory safety precaution. The obligatory operation is indicated symbolically in or near the circle.
This indicates warning or caution. The contents are indicated symbolically in or
near the triangle.
This indicates a note. The contents are described in the box.
These indicate that the marked part should be recycled.
MS2661N
Spectrum Analyzer
Operation Manual Vol. 1 (Basic Operating Instructions)
1 July
10 May
1996 (First Edition)
2004 (Fourth Edition)
Copyright © 1996-2004, ANRITSU CORPORATION.
All rights reserved. No part of this manual may be reproduced without the prior written permission of the
publisher.
The contents of this manual may be changed without prior notice.
Printed in Japan
ii
For Safety
WARNING
1. ALWAYS refer to the operation manual when working near locations at
which the alert mark shown on the left is attached. If the operation, etc.,
is performed without heeding the advice in the operation manual, there
is a risk of personal injury. In addition, the equipment performance may
be reduced.
Moreover, this alert mark is sometimes used with other marks and descriptions indicating other dangers.
2. Measurement Categories
This instrument is designed for Measurement category I (CAT I). Don't
use this instrument at the locations of measurement categories from
CAT II to CAT IV.
In order to secure the safety of the user making measurements, IEC
61010 clarifies the range of use of instruments by classifying the location of measurement into measurement categories from I to IV.
The category outline is as follows:
Measurement category I (CAT I):
Secondary circuits of a device connected to an outlet via a power transformer etc.
Measurement category II (CAT II):
Primary circuits of a device with a power cord (portable tools, home
appliance etc.) connected to an outlet.
Measurement category III (CAT III):
Primary circuits of a device (fixed equipment) to which power is directly
supplied from the power distribution panel, and circuits from the distribution panel to outlets.
Measurement category IV (CAT IV):
All building service-line entrance circuits through the integrating wattmeter and primary circuit breaker (power distribution panel).
or
3. When supplying power to this equipment, connect the accessory 3-pin
power cord to a grounded outlet. If a grounded outlet is not available,
before supplying power to the equipment, use a conversion adapter and
ground the green wire, or connect the frame ground on the rear panel of
the equipment to ground. If power is supplied without grounding the
equipment, there is a risk of receiving a severe or fatal electric shock.
iii
For Safety
WARNING
Repair
WARNING
Falling Over
iv
4. This equipment cannot be repaired by the user. DO NOT attempt to
open the cabinet or to disassemble internal parts. Only Anritsu-trained
service personnel or staff from your sales representative with a knowledge of electrical fire and shock hazards should service this equipment.
There are high-voltage parts in this equipment presenting a risk of severe injury or fatal electric shock to untrained personnel. In addition,
there is a risk of damage to precision parts.
5. This equipment should be used in the correct position. If the cabinet is
turned on its side, etc., it will be unstable and may be damaged if it falls
over as a result of receiving a slight mechanical shock.
And also DO NOT use this equipment in the position where the power
switch operation is difficult.
For Safety
CAUTION
Replacing Fuse
1. Before Replacing the fuses, ALWAYS remove the power cord from the
poweroutlet and replace the blown fuses. ALWAYS use new fuses of
the type and rating specified on the fuse marking on the rear panel of
the cabinet.
CAUTION
T5A indicates a time-lag fuse.
There is risk of receiving a fatal electric shock if the fuses are replaced
with the power cord connected.
Cleaning
Check Terminal
2. Keep the power supply and cooling fan free of dust.
• Clean the power inlet regularly. If dust accumulates around the
power pins, there is a risk of fire.
• Keep the cooling fan clean so that the ventilation holes are not obstructed. If the ventilation is obstructed, the cabinet may overheat
and catch fire.
3. •
•
•
•
•
Maximum DC voltage ratings:
RF Input
0 Vdc
TG Output 0 Vdc
Maximum AC power ratings:
RF Input
±30 dBm
TG Output ±20 dBm
NEVER input a >±30 dBm and >0 Vdc power to RF Input.
NEVER input a >±20 dBm and >0 Vdc reverse power to TG Output.
Excessive power may damage the internal circuits.
v
For Safety
CAUTION
Replacing Memory
Back-up Battery
This equipment uses a Poly-carbomonofluoride lithium battery to back-up
the memory. This battery must be replaced by a service engineer when it
has reached the end of its useful life; contact the Anritsu sales section or
your nearest representative.
Note: The battery used in this equipment has a maximum useful life of
7 years. It should be replaced before this period has elapsed.
External
Storage Media
This equipment stores data and programs using Memory card.
Data and programs may be lost due to improper use or failure.
ANRITSU therefore recommends that you back-up the memory.
ANRITSU CANNOT COMPENSATE FOR ANY MEMORY LOSS.
Please pay careful attention to the following points.
•
•
•
Do not remove the memory card from equipment being accessed.
Isolate the card from static electricity.
The back-up battery in the SRAM memory card has a limited life;
replace the battery periodically.
For replacing the battery, see page 2-15 of the Operation Manual Vol. 1.
vi
Equipment Certificate
Anritsu Corporation certifies that this equipment was tested before shipment using
calibrated measuring instruments with direct traceability to public testing organizations recognized by national research laboratories including the National Institute of
Advanced Industrial Science and Technology, and the Communications Research
Laboratory, and was found to meet the published specifications.
Anritsu Warranty
Anritsu Corporation will repair this equipment free-of-charge if a malfunction occurs
within 1 year after shipment due to a manufacturing fault, provided that this warranty is
rendered void under any or all of the following conditions.
• The fault is outside the scope of the warranty conditions described in the operation
manual.
• The fault is due to mishandling, misuse, or unauthorized modification or repair of
the equipment by the customer.
• The fault is due to severe usage clearly exceeding normal usage.
• The fault is due to improper or insufficient maintenance by the customer.
• The fault is due to natural disaster including fire, flooding, earthquake, etc.
• The fault is due to use of non-specified peripheral equipment, peripheral parts,
consumables, etc.
• The fault is due to use of a non-specified power supply or in a non-specified installation location.
In addition, this warranty is valid only for the original equipment purchaser. It is not
transferable if the equipment is resold.
Anritsu Corporation will not accept liability for equipment faults due to unforeseen and
unusual circumstances, nor for faults due to mishandling by the customer.
Anritsu Corporation Contact
If this equipment develops a fault, contact Anritsu Service and Sales offices at the
address at the end of paper-edition manual or the separate file of CD-edition manual.
vii
Front Panel Power Switch
To prevent malfunction caused by accidental touching, the front power switch of this equipment turns on
the power if it is pressed continuously for about one second in the standby state. If the switch is pressed
continuously for one second in the power-on state, the equipment enters the standby state.
In the power-on state, if the power plug is removed from the outlet, then reinserted into it, the power will
not be turned on. Also, if the lines is disconnected due to momentary power supply interruption or power
failure, the power will not be turned on (enters the standby state) even if the line is recovered.
This is because this equipment enters the standby state and prevents incorrect data from being acquired
when the line has to be disconnected and reconnected.
For example, if the sweep time is 1,000 seconds and data acquisition requires a long time, momentary
power supply interruption (power failure) might occur during measurement and the line could be recovered automatically to power-on. In such a case, the equipment may mistake incorrect data for correct data
without recognizing the momentary power supply interruption.
If this equipment enters the standby state due to momentary power supply interruption or power failure,
check the state of the measuring system and press the front power switch to restore power to this equipment.
Further, if this equipment is built into a system and the system power has to be disconnected then reconnected, the power for this equipment must also be restored by pressing the front power switch.
Consequently, if this equipment is built into remote monitoring systems that use MODEMs, the standby
function of this equipment must be modified.
viii
ABOUT DETECTION MODE
This instrument is a spectrum analyzer which uses a digital storage system. The spectrum analyzer makes
level measurements in frequency steps obtained by dividing the frequency span by the number of measurement data points (501). This method of measurement cannot detect the signal peak level if the spectrum of
a received signal is narrower than these frequency steps.
To resolve this problem, this instrument usually operates in positive peak detection mode and normal
detection mode. In the positive peak detection mode, the highest level within the frequency range between
the sample points can be held and traced. In the normal detection mode, both the positive peak and the
negative peak can be traced.
Positive peak detection mode should be used for almost all measurements including normal signal level
measurement, pulsed noise analysis, and others. It is impossible to measure the signal level accurately in
sample detection mode or in negative peak detection mode.
Use of sample detection mode is restricted to random noise measurement, occupied frequency bandwidth
measurement for analog communication systems, and adjacent-channel leakage power measurement, etc.
•
•
•
•
•
Measurement
item
Normal signal
......................................................................................... POS PEAK
Random noise ......................................................................................... SAMPLE
Pulsed noise
......................................................................................... NORMAL (POSI-NEG)
Occupied frequency bandwidth, adjacent-channel leakage power .............. SAMPLE
(for analog communication systems)
Occupied frequency bandwidth, adjacent-channel leakage power .............. POS PEAK or SAMPLE
(for digital communication systems)
When a detection mode is specified as one of the measurement methods, make the measurement in the
specified detection mode.
ix
Notes On Export Management
This product and its manuals may require an Export License/Approval by
the Government of the product's country of origin for re-export from your
country.
Before re-exporting the product or manuals, please contact us to confirm
whether they are export-controlled items or not.
When you dispose of export-controlled items, the products/manuals are
needed to be broken/shredded so as not to be unlawfully used for
military purpose.
x
C-tick Conformity marking
Anritsu affixes the C-tick marking on the following product (s) in accordance with the
regulation to indicate that they conform with the EMC framework of Australia/New
Zealand.
C-tick marking
N274
1. Product Model
Model:
MS2661N Spectrum Analyzer
2. Applied Standards
EMC: Emission:
AS/NZS 2064.1/2 (ISM, Group 1, Class A equipment)
xi
xii
ABOUT THIS MANUAL
(1) Composition of MS2661N Operation Manuals
The MS2661N Spectrum Analyzer operation manuals of the standard type are composed of the following
three documents. Use them properly according to the usage purpose.
Basic operating instruction part
Vol. 1
Detailed operating instruction part
Composition
of
Operation Manuals
Vol. 2
Programming part
Vol. 3
(Remote control part)
(PTA control part)
Basic operating instruction part:
Basic Operating Instructions: Provides information on the MS2661N
outline, preparation before use, panel description, basic operation,
soft-key menu and performance tests.
Detailed operating instruction part:
Detailed Operating Instructions: Provides information on the detailed
panel operating instructions on MS2661N that expand on the basic
operation and soft-key menu in the Basic Operating Instruction Part.
Programming part:
Composed of the Remote Control Part and PTA Control Part. The
Remote Control Part provides information on RS-232C remote
control, GPIB remote control and sample programs, while the PTA
Control Part describes about PTA operation and PTL commands.
I
TABLE OF CONTENTS
For Safety
................................................................................................................. iii
ABOUT THIS MANUAL .................................................................................................... I
SECTION 1
GENERAL ............................................................................................. 1-1
Product Outline ............................................................................................................................ 1-3
Composition of Operation Manual .............................................................................................. 1-4
Equipment Configuration ............................................................................................................ 1-5
Standard configuration .................................................................................................. 1-5
Options .......................................................................................................................... 1-6
Optional Accessories and Peripherals .......................................................................................... 1-7
Specifications ............................................................................................................................... 1-8
SECTION 2
PREPARATIONS BEFORE USE .......................................................... 2-1
Installation Site and Environment Conditions ............................................................................. 2-3
Locations to be avoided ................................................................................................ 2-3
Fan clearance ................................................................................................................. 2-3
Safety Measures ........................................................................................................................... 2-4
Power-on ....................................................................................................................... 2-4
Input level to RF Input .................................................................................................. 2-5
Installation ................................................................................................................................... 2-6
Rack mounting .............................................................................................................. 2-6
Preparations before Power-on ...................................................................................................... 2-7
Protective grounding ..................................................................................................... 2-8
Replacing fuse ............................................................................................................... 2-9
Precaution for Handling Memory Card ..................................................................................... 2-11
SECTION 3
PANEL DESCRIPTION ......................................................................... 3-1
Table of Front and Rear Panel Features ....................................................................................... 3-3
II
SECTION 4
SOFT-KEY MENU ................................................................................. 4-1
Soft-key Menu List ...................................................................................................................... 4-4
Menu Tree .................................................................................................................................... 4-6
SECTION 5
BASIC OPERATION PROCEDURE ..................................................... 5-1
Signal Display .............................................................................................................................. 5-3
Turn the power on ......................................................................................................... 5-3
Set the signal to the center of the screen ....................................................................... 5-4
Enlarge and display the signal ....................................................................................... 5-5
Marker Operation ......................................................................................................................... 5-6
Check of the zone marker function ....................................................................................
The "marker → CF" function check ..................................................................................
"Measure" Function Check .......................................................................................................... 5-8
Screen Hard Copy ........................................................................................................................ 5-9
SECTION 6
PERFORMANCE TESTS ...................................................................... 6-1
Requirement for Performance Tests ............................................................................................ 6-3
Instruments Required for Performance Test ................................................................................ 6-4
Performance Test ......................................................................................................................... 6-6
Reference oscillator frequency stability ....................................................................................... 6-6
Center frequency readout accuracy .............................................................................................. 6-9
Frequency span readout accuracy .............................................................................................. 6-12
Resolution bandwidth (RBW) ................................................................................................... 6-15
Sideband noise ........................................................................................................................... 6-19
Frequency measurement accuracy ............................................................................................. 6-21
Amplitude display linearity ....................................................................................................... 6-23
Frequency response .................................................................................................................... 6-27
Second harmonic distortion ....................................................................................................... 6-30
Input attenuator switching error ................................................................................................. 6-33
Sweep time and time span accuracy .......................................................................................... 6-36
Tracking generator output level flatness .................................................................................... 6-40
Service ..................................................................................................................................... 6-43
III
SECTION 7
STORAGE AND TRANSPORTATION .................................................. 7-1
Cleaning Cabinet .......................................................................................................................... 7-3
Storage Precautions ...................................................................................................................... 7-4
Precautions before storage ............................................................................................ 7-4
Recommended storage precautions ............................................................................... 7-4
Repacking and Transportation ..................................................................................................... 7-5
Repacking ...................................................................................................................... 7-5
Transportation ............................................................................................................... 7-5
APPENDIX A FRONT AND REAR PANEL LAYOUT ................................................ A-1
APPENDIX B BLOCK DIAGRAM ............................................................................... B-1
IV .
SECTION 1 GENERAL
SECTION 1
GENERAL
This section outlines the MS2661N Spectrum Analyzer and explains the composition of this manual, the
configuration of the MS2661N with the standard accessories, the options, the optional accessories, and peripherals for expanding
the MS2661N capabilities, and the MS2661N specifications.
TABLE OF CONTENTS
Product Outline ...................................................................................................................................
1-3
Composition of Operation Manual .......................................................................................................
1-4
Equipment Configuration .....................................................................................................................
1-5
Standard configuration ................................................................................................................
1-5
Optional Accessories and Peripherals ................................................................................................
1-6
Specifications ......................................................................................................................................
1-7
1-1
SECTION 1 GENERAL
(Blank)
1-2
SECTION 1 GENERAL
SECTION 1
GENERAL
Product Outline
The MS2661N (henceforth called "this unit") is a portable type color LCD spectrum analyzer suited for signal
analysis of radio equipment where the efficiency of frequency usage is increased and equipment are increasingly
speeded and digitized.
Adopts the synthesizer local system and can cover a frequency range of 100 Hz to 3 GHz.
Excellent in basic performance such as C/N, distortion, frequency/level accuracy, and easily operable following
the display of the soft-key menu screen.
Equipped with high-accuracy calibration signals and an attenuator, it can accurately calibrate switching errors
of LOG/LIN scales, resolution bandwidth, reference level, etc. Since frequency response is corrected by builtin calibration data, it allows high-accuracy level measurement for a wide range.
As the switching of waveforms between frequency domain and time domain can be done by a touch and two
waveforms are simultaneously displayed, signal analysis of both domains can be done efficiently. Moreover,
our original zone marker function and multi-marker function (up to 10 markers) are also special mention.
This unit provides the MEASURE function that can perform measurement of various applications without
requiring the intervention of external controllers. Therefore, the performance evaluation of radio equipment
can be easily done in terms of frequency, noise, occupied frequency bandwidth, adjacent channel leakage
power, etc.
In addition, as the template measurement of burst mean power and burst waveform are also available, it is
suited for evaluating the performance of digital radio equipment.
Applications
The MS2661N Spectrum Analyzer can be used for wide range of applications such as development, adjustment,
inspection, and maintenance of electronic parts and equipment in the following fields:
•
•
•
•
AM / FM radio equipment
Digital cellular telephone / cordless telephone
Satellite broadcasting and TV equipment
Small-capacity microwave equipment
1-3
SECTION 1 GENERAL
Composition of Operation Manual
This Operation Manual is composed of 7 sections and appendixes A and B. The profile of each section is
shown below.
Section conposition
Explanation
SECTION 1
GENERAL
Product outline, standard configuration, options, applicable parts, peripheral
devices, and specifications
SECTION 2
PREPARATIONS
BEFORE USE
Operations to be done before applying power
SECTION 3
PANEL
DESCRIPTION
Description about the front and rear panels
SECTION 4
SOFT-KEY MENU
SECTION 5
BASIC OPERATION
PROCEDURE
Description using a soft-key menu
SECTION 6
PERFORMANCE
TESTS
Tests used for checking performance
SECTION 7
Cautions on storage and transportation
Basic operation procedures for operation guide
STORAGE AND
TRANSPORTATION
1-4
APPENDIX A
MS2661N FRONT AND REAR PANEL LAYOUT
APPENDIX B
BLOCK DIAGRAM
SECTION 1 GENERAL
Equipment Configuration
This paragraph describes the configuration of the MS2661N Spectrum Analyzer with standard accessories and
the various options to expand the functions.
Standard configuration
The table below shows the configuration of the MS2661N with the standard accessories.
Standard Composition
Item
Main instrument
Accessories
Model / Order NO.
Name
Qty.
Rmarks
MS2661N
Spectrum Analyzer
1
J0071
Power cord
1
Approx. 2.5 m
F0013
Fuse
2
T5 A 250 V
W1813AE
Operation manual
1
Vol-1, 2, 3
W1813BE
Service manual
1
1-5
SECTION 1 GENERAL
Optional Accessories and Peripherals
The following table shows the optional accessories and peripherals for MS2661N which are all sold separately.
Optional Accesories
Model † - Order No. †
J0561
J0104A
JS256G3-C-13
JS512G3-C-13
JS1024G3-C-13
JS2048G3-C-13
B0329G
B0395B
B0391A
B0391B
MP612A
MP613A
MA8601A
MA1621A
MP614A
J0063
J0395
MP640A
MP654A
MP520C
MP520D
MP526A
MP526B
MP526C
MP526D
MP526G
J0007
J0008
J0743A
J0742A
Name
Coaxial cord, 1 m
Coaxial cord, 1 m
256 kB memory card
512 kB memory card
1024 kB memory card
2048 kB memory card
Protective cover
Rack mount kit (IEC)
Carring case (hard type)
Carring case (hard type)
RF Fuse Holder
Fuse Element
DC Block Adaptor
50 Ω → 75 Ω Impedance
Transformer
50 Ω ←→ 75 Ω Impedance
Transformer
Fixed attenuator for high power
Fixed attenuator for high power
Branch
Branch
CM Directional Coupler
CM Directional Coupler
High Pass Filter
High Pass Filter
High Pass Filter
High Pass Filter
High Pass Filter
GPIB cable, 1 m
GPIB cable, 2 m
RS-232C cable, 1 m
RS-232C cable, 1 m
Remarks
N-P-5W•5D-2W•N-P-5W
BNC-P•RG-55 / U•N-P-5W
Meets PCMCIA Ver. 2.0 Type I
Meets PCMCIA Ver. 2.0 Type I
Meets PCMCIA Ver. 2.0 Type I
Meets PCMCIA Ver. 2.0 Type I
3 / 4 MW4U
With casters
Without casters
DC to 1000 MHz, 50 Ω (N)
For MP612A
50 Ω
9 kHz to 3 GHz, with DC block capacitor
(allowable voltage: 100 V)
10 to 1200 MHz (transformer type)
30 dB (10 W, DC to 12.4 GHz)
30 dB (10 W, DC to 9 GHz)
40 dB, DC to 1700 MHz
30 dB, 0.8 to 3 GHz
25 to 500 MHz, 50 Ω (N)
25 to 1000 MHz, 50 Ω (N)
60-MHz band
150-MHz band
250-MHz band
400-MHz band
27-MHz band
408JE-101
408JE-102
For IBM PC / AT or compatible, D-sub 9 pins
For Printer, D-sub 25 pins
† Please specify the model / order number, name, and quantity when ordering.
1-6
SECTION 1 GENERAL
Specifications
MS2661N specifications are listed in the following table.
Frequency range
Indicated frequency
Frequency
accuracy
Marker frequency
Frequency measurement†
Span
Frequency
Resolution
bandwidth
(3 dB BW)
Reference
oscillator
Resolution: A digit in 5 hundredths of span (1 Hz min.), but fractions are
rounded
Accuracy: ± ( (Indicated frequency × reference frequncy accuracy) +
resolution band width × 15% + span × 5% + 50 Hz)
Resolution: 0.2% of span, fractions are rounded
Accuracy: Normal marker is identical to the indicated frequency accuracy.
Delta marker is identical to the span accuracy.
Resolution: 1 Hz, 10 Hz, 100 Hz, and 1 kHz
Accuracy: Indicated frequency × reference frequency accuracy ± 1 count
(at S/N of > 20 dB)
Setting range
0 Hz, and 100 Hz to 3.0 GHz
Accuracy
±5%
Setting range
10 Hz to 3 MHz, 1/3 sequence
Can be set manually or automatically coupled with span
Accuracy
±20% (RBW 30 Hz to 300 kHz)
±30% (RBW 10 Hz)
±25% (RBW 1 MHz)
Video bandwidth (VBW)
Signal
Purity and
stability
100 Hz to 3.0 GHz
1 Hz to 3 MHz, 1/3 sequence and through
Can be set manually or automatically coupled with resolution bandwidth
Noise sidebands
≤ –100 dBc/Hz (30 kHz offset, RBW 1 kHz)
Frequency drift
At constant ambient temperature one hour after power-on
≤ 50 Hz/min. (at 100 kHz ≤ span, sweep time ≤ 100 s)
Frequency
10 MHz
Starting characteristics
≤ 5 × 10⁻⁸
(10 minutes after power-on, referred to the frequency after 24-hour warm-up)
Aging rate
≤ 1 × 10⁻⁷/year
(referred to the frequency 24-hour warm-up after power-on)
≤ 2 × 10⁻⁸/day
Temperature characteristic
± 5 × 10⁻⁸
(referred to the frequency at 25˚C, in the range of 0˚ to 50˚C)
† Counts the frequency at the peak point in the zone
1-7
SECTION 1 GENERAL
(Continued)
Level
measurement
Reference
level
Amplitude
Measurement range
Average noise level to +30 dBm
Residual response
≤ –90 dBm (at 200 kHz to 3.0 GHz, 0 dB input attenuator)
≤ –65 dBm (at 100 Hz to 500 Hz, 0 dB input attenuator)
≤ –85 dBm (at 500 Hz to 200 kHz, 0 dB input attenuator)
Setting range
LOG: –100 to +30 dBm (or equivalent level)
LIN: 224 µV to 7.07V
Unit
LOG: dBm, dBµV, dBmV, V, dBµV (emf), W
LIN: V
Input attenuator setting range
0 to 70 dB, 10 dB step
Can be set manually or automatically coupled with reference level
Input attenuator
switching deviation
±2.0 dB (10 to 60 dB referred to the attenuator of 10 dB)
Frequency response
Screen
display
Spurious
response
±1.5 dB
At 10 to 60dB input attenuator,
Graticule
10 div (during single scale)
LOG (/div): 10 dB, 5 dB, 2 dB, 1 dB
LIN (/div): 10%, 5%, 2%, 1%
Linearity
After calibration
LOG: ±0.5 dB (0 to –20 dB, resolution bandwidth ≤ 1 MHz)
±1 dB (0 to –70 dB, resolution bandwidth ≤ 100 kHz)
±1.5 dB (0 to –85 dB, resolution bandwidth ≤ 10 kHz)
Marker level resolution
LOG: 0.1 dB
LIN: 0.2% (compared to reference level)
Second harmonic
distortion
≤ –60 dBc (at 100 Hz to 900 MHz input frequencies, mixer input level
–40 dBm †1)
Two-signal
third-intermodulation
distortion
At two signal frequency difference of ≥ 50 kHz and mixer input level of
–30 dBm
≤ –64 dBc (at 100 Hz to 10 MHz input frequency)
≤ –70 dBc (at 10 MHz to 3.0 GHz input frequency)
1 dB gain compression
At input level to mixer, ≥ –5 dBm
Frequency range
9 kHz to 3.0 GHz
Output range
0 to –60 dBm
resolution : 0.1 dB
Tracking
Flatness
±2.25 dB (referenced to the output of 100MHz, 0 dBm setting)
Generator
Residual FM
≤ 50 Hzp-p
Output impedance
50 ohm nominal
Type N
VSWR ≤ 2:1
Spurious outputs
≤ –20dB
†1 Mixer input level = input level (dBm) – input attenuator (dB)
1-8
SECTION 1 GENERAL
(Continued)
Sweep time
Frequency
domain
Setting range: 20 msec to 1000 sec
Can be set manually or automatically coupled with span,
resolution bandwidth, and video bandwidth
Accuracy: ±15% (20 msec to 100 sec)
Time domain
Setting range: 12.5 µsec to 1000 sec
Accuracy: ±1% (100 µsec to 100 sec)
Sweep mode
CONTINUOUS, SINGLE
Trigger Switch
FREE RUN, TRIGGERED
Sweep
Trigger level
External
Trigger Source
Trigger slope
Connector
Impedance
Trigger level
Video
Trigger slope
General
electrical
specifications
Wide IF Video
High/Mid/Low
Line
47 to 63 Hz
±10 V (0.1 V resolution)
TTL
Rise/Fall
BNC
1 kΩ ±5%
–100 dB to 0 dB (log scale, 1 dB resolution)
0 to 100% (lin scale, 1% resolution)
Rise/Fall
Detection mode
POS PEAK, SAMPLE, NEG PEAK, NORMAL (POS-NEG)
Display
5.7 inch Color TFT-LCD
Display items: Graticule, Waveform, Setting parameters,
Operation menus, Title
Display function
Trace A: Displays frequency spectrum
Trace B: Displays frequency spectrum
Trace Time: Displays the time axis waveform at center frequency
Trace A/B: Displays Trace A and B simultaneously, simultaneous sweep of
same frequency, alternate sweep of independent frequencies
Trace A/BG: Displays simultaneously both the band to be observed
(background) and the signal band (foreground) chosen by the
Zone marker out of the BG band
Trace A/Time: Displays simultaneously both the frequency spectrum and the
time axis waveform at the center frequency of the frequency
spectrum
Trace Move/Calculate: A→B, B→A, A↔B, A+B→A, A–B→A,
A–B+DL→A
Storage function
NORMAL
VIEW
MAX HOLD (displays the maximum envelope)
MIN HOLD (displays the minimum envelope)
AVERAGE (displays average value)
CUMULATIVE (displays cumulative waveform)
OVER WRITE (displays waveform overwritten)
Input connector
N–J, 50 Ω
VSWR ≤ 1.5 (input attenuator ≥ 10 dB)
Auxiliary input/output
terminal
REF INPUT
10 MHz ±10 Hz, –10 dBm to +2 dBm, 50 Ω (BNC connector)
BUFFERED OUTPUT 10 MHz, 0 dBm, 50 Ω (BNC connector)
1-9
SECTION 1 GENERAL
(Continued)
Signal search
AUTO TUNE, PEAK→CF, PEAK→REF, SCROLL
Zone marker
NORMAL, DELTA
Marker→
MARKER →CF, MARKER→REF
MARKER→CF STEP SIZE, ∆ MARKER→SPAN
ZONE→SPAN
Peak search
PEAK, NEXT PEAK, MIN DIP, NEXT DIP
Multi marker
HIGHEST 10, HARMONICS, MANUAL SET
Measure (calculation)
Noise level measurement (dBm/Hz, dBm/ch)
C/N measurement (dBc/Hz, dBc/ch)
Occupied frequency bandwidth measurement
Adjacent-channel leakage power measurement
Burst-in average power measurement
Template (limit lines) comparison measurement
Mask (limit lines) comparison measurement
Memoty card interface
PCM CIA Ver 2.0, 2 slots
Saves/recalls setting conditions and waveform data.
Uploads/downloads PTA programs.
Accesses SRAM, EPROM and flash EEPROM (writes to SRAM only).
Supports cards up to 2 Mbytes.
Save/recall
Can save and recall setting conditions and waveform data to and from
internal registers (max. 12) and external memory cards (max. 99).
Direct plotting
Can hard-copy screen data via RS232C or GPIB (compatible models only).
Function
GPIB
Environmental
EMC
1-10
Functions
Meets IEEE488.2. Can be controlled as device from extemal computer
(excluding power switch). Or can control extemal equipment as controller.
Interface
SH1, AH1, T6, L4, SR1, RL1, PP0, DC1, DT1, C1, C2, C3, C4, C28
Temperature
0˚ to 50˚C (operating), –40˚ to +71˚C (not operating)
Humidity
MIL-PRF-28800F, Class 3
Vibration
MIL-PRF-28800F, Class 3
Pulse shock
MIL-PRF-28800F, Class 3
Drop test
MIL-PRF-28800F, Class 3
Dripproof
MIL-PRF-28800F, Class 3
Conducted interference
CISPR11 Class A, 150 kHz to 30 MHz
Radiated interference
CISPR11 Class A, 30 MHz to 1000 MHz
Radiated susceptibility
IEC1000-4-3
(test condition: 3 v/m, 80 MHz to 1000 MHz, 80%, 1 kHz, AM
SECTION 1 GENERAL
(Continued)
Dimension
Weight
Power
requirements
177 (H), 320 (W), 351 (D) mm
≤ 15 kg
115 Vac operation
85 to 132 V, 3.0 A rms max, 47.5 to 63Hz, 380Hz to 420Hz
230 Vac operation
170 to 250 V, 1.5 A rms max, 47.5 to 63 Hz
Maximum power consumption
≤ 250 W
The specifications above are applicable to system settings and auto-sweep time of high level accuracy mode.
1-11
SECTION 1 GENERAL
(Blank)
1-12 .
SECTION 2 PREPARATIONS BEFORE USE
SECTION 2
PREPARATIONS BEFORE USE
This section explains the preparations and safety procedures that should be performed before using the MS2661N Spectrum
Analyzer. The safety procedures are to prevent the risk of injury to the operator and damage to the equipment. Insure that
you understand the contents of the pre-operation preparations before using the MS2661N.
For connecting the GPIB cable and setting the GPIB address, see the Remote Control part of the separate Operation Manual
Vol.3.
TABLE OF CONTENTS
Unpacking ...........................................................................................................................................
2-3
Installation ...........................................................................................................................................
2-4
Locations to be avoided ..............................................................................................................
2-4
Positioning ..................................................................................................................................
2-4
Rack mounting ............................................................................................................................
2-6
Preparations before Power-on ............................................................................................................
2-7
Protective grounding ...................................................................................................................
2-8
Connecting power supply ............................................................................................................
2-9
Power On ............................................................................................................................................
2-10
Stand by ......................................................................................................................................
2-10
Power on .....................................................................................................................................
2-11
Connecting to Device Under Test .......................................................................................................
2-13
Internal Calibration ..............................................................................................................................
2-14
Using the Memory Card ......................................................................................................................
2-15
Using the RS-232C Interface ..............................................................................................................
2-16
Using the GPIB Interface ....................................................................................................................
2-16
Reprogramming ..................................................................................................................................
2-16
Power Off ............................................................................................................................................
2-17
Replacing Fuse ...................................................................................................................................
2-18
2-1
SECTION 2 PREPARATIONS BEFORE USE
(Blank)
2-2
SECTION 2 PREPARATIONS BEFORE USE
SECTION 2
PREPARATIONS BEFORE USE
Unpacking
Remove the MS2661N and accessories after undoing the packing case. Save the packing case and spacers, etc.
if it might be reshipped again sometime. The standard MS2661N consists of the following items. If any part
is missing or if the MS2661N has been damaged in transport, contact your sales representative immediately.
Table 2-1 List of Parts and Accessories
Item
Main instrument
Accessories
Model/Order No.
Name
Qty.
Remarks
MS2661N
Spectrum Analyzer
1
J0017
Power cord
1
Approx. 2.5 m
F0013
Fuse
2
T5A250V
W1813AE
Operation manual
1
Vol-1, 2, 3
W1813BE
Service manual
1
Note: Refer to the factory packing lists for the parts and accessories when there are special specifications.
2-3
SECTION 2 PREPARATIONS BEFORE USE
Installation
Locations to be avoided
The MS2661N operates normally at temperatures from 0 to 50 ˚C. However, for the best performance, the
following locations should be avoided.
•
•
•
•
Where there is servere vibration
Where the humidity is high
Where the equipment will be exposed direct sunlight
Where the equipment will be exposed active gases
In addition to meeting the above conditions, to insure long-term trouble-free operation, the equipment should
be used at room temperature and in a location where the power supply voltage does not fluctuate greatly.
CAUTION
If the MS2661N is used at normal temperatures after it has been used or stored for a long time
at low temperatures, there is a risk of short-circuiting caused by condensation. To prevent this
risk, do not turn the MS2661N on until it has been allowed to dry out sufficiently.
Positioning
Position the MS2661N horizontally on a flat surface such as a table.
2-4
SECTION 2 PREPARATIONS BEFORE USE
If necessary, use the tilt handle as shown below to improve the viewing angle.
Push the pivots of the handle inward and rotate it until it clicks into the new position.
CAUTION
To suppress any internal temperature increase, the MS2661N has a fan on the rear panel as
shown in the diagram below. Leave a gap of at least 10 cm between the rear panel and the
wall, nearby equipment or obstructions so that fan ventilation is not blocked.
10 cm min
Internal fan
2-5
SECTION 2 PREPARATIONS BEFORE USE
Rack mounting
The B0395B Rack Mount Kit (sold separately) is required to mount the MS2661N in a rack. The installation
method is included in the rack mount kit diagram.
2-6
SECTION 2 PREPARATIONS BEFORE USE
Preparation Before Power-on
The MS2661N operates normally when it is connected to an 85 to 132 Vac/47.5 to 63Hz, 380 to 420 Hz, or 170
to 250 Vac (automatic voltage change) 47.5 to 63 Hz AC power supply. To prevent the following problems,
take the necessary procedures described on the following pages before power is supplied.
•
•
•
Accidental electric shock
Damage caused by abnormal voltage
Ground current problems
Note:
•
•
The voltage and current rating are indicated on the rear panel when the instrument is shipped
from the factory.
In this manual, the power supply voltage and current ratings are represented by ** Vac and ***
A,respectively.
To protect the operator, the following WARNING and CAUTION notices are attached to the rear panel of the
MS2661N.
WARNING
Disassembly, adjustment, maintenance, or other access inside this instrument by unqualified
personal should be avoided. Maintenance of this instrument should be performed only by
Anritsu trained service personnel who are familliar with the risk involved of fire and electric
shock. Potentially lethal voltages existing inside this instrument, if contacted accidentally,
may result in personal injury or death, or in the possibility of damage to precision components.
Always follow the instructions on the following pages.
2-7
SECTION 2 PREPARATIONS BEFORE USE
Protective grounding
(1) Grounding with 3-pole power outlet
When connecting to a 3-pole (grounded, 2-pole type) AC power-supply outlet, the frame of the MS2661N is
connected to ground potential. As a result, it is not necessary to connect the FG terminal to ground.
(2) Grounding with frame ground (FG) terminal
When there is no 3-pole AC power-supply outlet, the protective frame-ground (FG) terminal on the rear panel
must be connected directly to ground potential.
Off
On
WARNING
Freq Adj.
WARNING
Line Input 300VA Max
47.5 – 63Hz
85–132V
T 5A
170–250V T 5A
CAUTION
Fuse holders
2-8
Label indicating protective
ground terminal
If power is supplied without protective
grounding, there is a risk of accidental electric shock. When available, the protective
frameground (FG) terminal on the rear panel,
or the ground pin of the supplied power cord
must be connected to ground potential before
power is supplied to the MS2661N.
Frame ground terminal:
To prevent accidental electric shock,
connect this terminal to ground potential
SECTION 2 PREPARATIONS BEFORE USE
Connecting the power supply
• Make sure that the power switch on the upper-right corner of the rear panel is in the Off position before
connecting the power cord to the AC outlet.
If not Off, push the power switch on the rear panel to Off.
Off
On
• Connect the attached power cord to the AC power inlet at the rear of the MS2661N, and connect the other
end to the AC outlet.
2-9
SECTION 2 PREPARATIONS BEFORE USE
Power On
Standby
• After connecting the MS2661N to the AC outlet, press the power switch on the upper-right corner of the
rear panel to turn on the MS2661N.
Off
On
The MS2661N enters standby mode, and the “stby” indicator (green) on the left side of the front panel
comes on.
Stby
On
In standby mode the MS2661N supplies power only to the internal reference oscillator.
The frequency of the reference crystal oscillator is unstable immediately after the power is on. This instability
will adversely affect the accuracy of the frequency or narrow-span measurements.
In standby mode after the power is on, power is applied only to the reference crystal oscillator so that the
frequency of the reference crystal oscillator stabilizes.
2-10
SECTION 2 PREPARATIONS BEFORE USE
Power-on
Press the power switch on the left side of the front panel for one second or more in standby mode to turn on the
power of the MS2661N.
Stby
On
The “stby” indicator goes off, the “On” indicator (orange)
comes on, then power is supplied to the MS2661N.
MS2661N
Spetctrum Analyzer
Selfcheck
The power-on screen is displayed
for about 40 seconds.
A waveform screen is displayed.
For parameter settings at the factory shipment, see Appendix-A in the Operation Manual Vol.3 “Programming
(Remote Control)”.
Normally, the parameters immediately after the power-on depend on the state immediately before the last
power-off. To turn on the power with other parameter settings, see para. 9.5 “Condition Setting at Power-on”
in the Operation Manual Vol.2.
2-11
SECTION 2 PREPARATIONS BEFORE USE
WARNING
• During power-on
2-12
To maintain the MS2661N, sometimes it is necessary to make internal checks and adjustments with the covers removed while
power is supplied. Very-high, dangerous voltages are used in the
MS2661N, if insufficient care is taken, there is a risk of a
accidential electric shock being received or of damage to the
equipment. To maintain the MS2661N, request service by a service personnel who has received the required training.
SECTION 2 PREPARATIONS BEFORE USE
Connecting to Device Under Test
Connect the signals to be measured to the RF connector using a coaxial cable (J0561, N-P-5W•5D2W•N-P5W).
RF Input 50Ω
Fully insert the cable jack into the RF Input
connector.
Frequency range: 100 Hz to 3 GHz
Measurement level: Apply the measured signal with average
noise level of up to +30 dBm to the N-type connector RF
Input of 50 Ω input impedance.
CAUTION
The RF input circuit is not protected against excessive power. If a signal exceeding +30 dBm
and 0V DC between measured terminal and ground is applied, the input attenuator and input
mixer may be burned.
is a warning mark to prevent such damage.
2-13
SECTION 2 PREPARATIONS BEFORE USE
Internal Calibration
Perform internal calibration to maintain the measurement accuracy of the MS2661N within the specifications.
Immediately after the power-on, the performance is unstable due to internal temperature variations. Wait for
about 20 minutes or more after the power-on, then perform “All Cal”.
Cal
Shift
→
0
→
All Cal
Cal
All Cal
Now Calibrating ......
Level Cal
Level Cal
Freq Cal
The Cal screen is displayed during
calibration.
FM Cal
*
*
1
Internal calibration takes about four minutes.
If the MS2661N is used in a thermally stable environment such as an office, after the first internal calibration;
there is no need to perform internal calibration, repeatedly. If there is a big change in the temperature, perform
an internal calibration.
2-14
SECTION 2 PREPARATIONS BEFORE USE
Using the Memory Card
The save/recall functions can be used to save/recall parameter and waveform data to/from the memory card.
See para. 1.3 for the memory card to be used.
When a new memory card used to save any file, format it beforehand to MS-DOS.
When saving data to a memory card; confirm that the write-protect switch of the card is set at the NOTPROTECTED side, and then install it to the MS2661N. (For the setting method, see the operation manual of
the card.)
• Installing Memory Card
Install the memory card to the MS2661N, with the cutout of the card at the position as shown below. Two
card can be installed at the upper and lower sides.
Memory Card
Cutout
MC
• Removing Memory Card
Push the left eject button to remove the memory card at the upper side.
Push the right eject button to remove the memory card at the lower side.
• Replacing Battery of Memory Card
Memory card has a battery. When the battery life ends, the saved data is erased. Replace the battery before
the life end. (For the battery life and replacing method, see the operation manual of the card.)
2-15
SECTION 2 PREPARATIONS BEFORE USE
Using the RS-232C Interface
See Section 2 in the Operation Manual Vol.3 “Programming (Remote Control)”.
Using the GPIB Interface
See Section 2 in the Operation Manual Vol.3 “Programming (Remote Control)”.
Reprogramming
The software of the MS2661N is stored in a ROM (read only memory) installed when the MS2661N is shipped
from the factory. Therefore, it is unnecessary to load the software in the MS2661N.
Also, the frequency response of each the MS2661N is checked when the equipment is shipped from the factory,
and the correction values are written into the ROM. Therefore, it is unnecessary to load the correction values.
The data and program shown below can be set to correct the measured values and perform the automated
measurement. For details, refer to the following sections:
• To set the frequency-response correction factor : See Sections 2/3/4 in the Operation Manual Vol.2.
2-16
• To set the template/mask limitation line
: See Section 13 in the Operation Manual Vol.2.
• To register data in the user defined menu
: See Section 12 in the Operation Manual Vol.2.
• To load and execute the PTA
(personal test automation) program
: See the PTA control part in the Operation Manual
Vol.3.
SECTION 2 PREPARATIONS BEFORE USE
Power-off
Press the power switch on the front panel for one second or more while the power is on to set the MS2661N in
standby mode.
The “ON” indicator goes off, the “stby” indicator comes on,
and the screen becomes blank.
Stby
On
When the MS2661N will be reused in the same environment, leave the MS2661N in the standby mode. If the
MS2661N is not used for a long time or is moved/stored, press the power switch on the rear panel to off.
Off
On
2-17
SECTION 2 PREPARATIONS BEFORE USE
Replacing Fuse
The MS2661N with standard accessories has two spare 5 A fuses. The fuses are mounted in the fuse holder
and must be replaced if they blow. If the fuses must be replaced, locate and remedy the cause before replacing
the blown fuses.
WARNING
• If the fuses are replaced while power is supplied, there is a serious risk of electric shock.
Before replacing the fuses, set the power switch to OFF and remove the power cord from
the power outlet.
• If power is supplied without protective grounding, there is a risk of accidental electric shock.
In addition, if the AC power supply voltage is unsuitable, there is a risk of the internal circuits
of the MS2661N being damaged by the abnormal voltage. Before supplying power again
after changing the fuses, check that the protective grounding described previously is still
connected, and check that the AC power supply voltage is suitable. Then, set the power
switch to ON.
CAUTION
When there are no supplied spare fuses, the replacement fuses must have the same rated voltage and
current as the fuses in the fuse holders.
• If the replacement fuses are not of the same type, they may not fit correctly, there may be a
faulty connection, or the time taken to for the fuses to blow may be too long.
• When an abnormality occurs again, if the voltage and current rating of the fuses is incorrect,
the fuses may not blow with a consequent risk of damage to the equipment by fire.
2-18
SECTION 2 PREPARATIONS BEFORE USE
After performing the safety procedures described on the preceding page, replace the fuses according to the
following procedure.
Step
Procedure
1
Set the front-panel [Power] switch to Stby and the rear-panel [Line] switch to OFF. Then,
remove the power cord from the power-supply outlet.
2
Use a flat-bladed screwdriver to turn the fuse-holder cap counterclockwise. The cap and fuse
are removed as a unit from the fuse holder.
Remove the fuse from the fuse cap and replace it with a spare fuse.
(The direction does not matter.)
Return the fuse cap with fuse to the fuse holder and fasten it by turning it clockwise with the
flat-bladed screwdriver.
3
4
Off
Freq Adj.
WARNING
On
Line Input 300VA Max
47.5 – 63Hz
85–132V
T 5A
170–250V T 5A
CAUTION
Fuse holders
2-19
SECTION 2 PREPARATIONS BEFORE USE
(Blank)
2-20 .
SECTION 3 PANEL DESCRIPTION
SECTION 3
PANEL DESCRIPTION
In thi s section, the front and rear panels are described about the case in which all the options are attached to.
TABLE OF CONTENTS
Table of Front Panel Features ............................................................................................................
3-3
Description of Screen Display .............................................................................................................
3-9
3-1
SECTION 3 PANEL DESCRIPTION
(Blank)
3-2
SECTION 3 PANEL DESCRIPTION
SECTION 3
PANEL DESCRIPTION
In this section, the front and rear panels (Figs. 3-1 and 3-2) are described about the case in which all the options
are attached to.
Table of Front Panel Features
No.
Panel Making
Explanation of Function
1
(LCD)
This is a 5.7 ” color TFT liquid crystal display (LCD). It displays the
trace waveforms, the parameter settings, the values of marker, and the
soft menu keys, etc.
2
Menu On / Off
This toggles the soft-key menu display On / Off.
3
F1-F6
These are the soft keys for selecting the soft-key menus linked to the
panel key operation.
4
More
This displays the next page of soft-key menus.
5
Freq / Ampl
This is the frequency and level parameter data input section.
[Frequency]
Sets frequency.
[Span]
Sets frequency span.
[Amplitude]
Sets reference level.
[– > CF]
Sets peak level signal frequency on screen to center
frequency.
[– > Ref]
Sets peak level on screen to reference level.
6
Marker
This section is related to operation of marker functions.
[Marker]
Sets marker.
[Multi Mkr]
Sets multimarkers.
Press this key after pressing the [Shift] key.
[Peak Search] Moves marker to currently-displayed peak level.
[Marker – >]
Sets paramater according to marker value.
Press this key after pressing the [Shift] key.
7
User
This is a user-dedicated key which users can specify.
3-3
SECTION 3 PANEL DESCRIPTION
3-4
No.
Panel Making
Explanation of Function
8
Single
This sets the sweep mode.
[Single]
Executes single sweep.
[Continuous]
Executes continuous sweeping.
Press this key after pressing the [Shift] key.
The initial default is continuous sweeping.
9
Recall
This executes recall / save.
[Recall]
Reads measurement parameters and waveform data
from internal memory or memory card.
[Save]
Saves measurement parameters and waveform data to
internal memory or memory card.
10
Measure
This menu is for performing the various application measurements
including frequency measurement, noise measurement, adjacent-channel
leakage power measurement, etc.
11
TG
This sets the tracking generator function.)
12
Display
This section is for selecting the trace waveform. Normally, in the
frequency domain, up to two trace waveforms can be displayed.
The zero-span (Time Domain) mode is selected simply by pressing the
[Time] key.
[A, B]
Displays trace A or B waveform in frequency domain.
[A/B, A/BG]
Displays trace A and B waveforms simultaneously, or
displays trace A and BG (background frequency
spectrum including trace A) simultaneously.
[Time]
Switches to zero span (Time domain) mode to display
time domain waveforms.
[A/Time]
Displays trace A and the time domain waveform
simultaneously.
13
Trig / Gate
This sets the trigger/gate and TV-image monitoring functions.
[Trig/Gate]
Sets the sweep-start trigger and gate(to control waveform-data write timing) functions.
[TV Monitor]
Don't use in MS2661N.
14
Coupled Function
This sets the RBW, VBW, sweep time and input attenuator.
15
Entry
These keys set the numeric data, units and special functions.
SECTION 3 PANEL DESCRIPTION
No.
Panel Making
Explanation of Function
[Rotary knob]
[∨, ]
[Shift]
Used for moving marker and inputting data.
Increments and decrements input data.
To execute panel functions indicated by blue letters,
press this key and then press the blue-lettered key.
[BS]
Backspace key for correcting input mistakes.
[0-9, . , +/–]
Numeric-data setting keys.
[GHz, MHz, kHz, Hz]
Units keys for frequency, level, time, etc.
∨
16
Preset
This sets the measurement parameters to the default values.
17
Local
This changes the remote status to the local status.
18
Copy
This outputs a hard copy of the screen to a printer or plotter.
19
Stby / On
This is the power switch. It can be used when the back-panel power
switch is on. The power-on condition is fetched from the Stby condition
when the key is pressed for about 1 second. The equipment is returned
to the Stby condition from the power-on condition when the key is
pressed again for about 1 second.
20
Memory Card
This is the slot to set memory cards which save/load the waveform data
and measurement parameters etc. Up to two plug-in memory card can be
used.
21
RF Inout
This is the RF input connector.
22
TG Output
This is the tracking generator output connector.
3-5
3-6
19
18
17
16
Stby On
Copy
Copy Cont
Local
Remote
Preset
20
Memory Card
Spectrum Analyzer
MS2661N 100Hz–3GHz
1
22
TG Output 50Ω
300kHz–3GHz
More
F6
F5
F4
F3
F2
F1
Menu On/Off
2
Fig. 3-1 Front Panel
4
12
9
10
11
3
Measure
RLV
Time
Trig/Gate
TV Monitor
TG
Single
Continuous
User
Marker
Peak
Search
Marker
Multi Mkr
Marker
6
Coupled Finction
VBW Sweep Time Atten
14
RVS PWR
+20dBm
0V DC Max
RBW
A,B
Display
A/B,A/BG
A/Time
Recall
Save
CF
Peak
Amplitude
Span
Frequency
Freq/Ampl
5
13
Cal
0
1
Sound
4
7
PTA
7
3
Title
6
9
Entry
15
.
Hz
Enter
kHz
MHz
GHz
Hold
BS
CE
21
RF Input 50Ω
+30dBm
0V DC Max
–/+
Interface Mem Card
2
System
5
8
Define
8
µV
µsec
mV
msec
V
sec
dBm
dB
Shift
SECTION 3 PANEL DESCRIPTION
SECTION 3 PANEL DESCRIPTION
(Blank)
3-7
SECTION 3 PANEL DESCRIPTION
3-8
No.
Panel Making
Explanation of Function
50
(Fan)
This is the cooling fan for ventilating internally-generated heat. Leave a
clearance of at least 10 cm around the fan.
51
10 MHz STD
This is the input connector for an external reference crystal oscillator.
When an external reference signal is input, the equipment switches
automatically from the internal signal to the external signal.
55
Off / On
This is the AC line power switch.
56
(Inlet)
This is the fused AC power inlet to which the supplied power cord is
connected. It contains two time-lag fuses.
57
(Ground Terminal) Connect this frame ground terminal to ground to prevent risk of an
accidental electric shock.
58
RS-232C
This is the RS-232C connector. Connect it to an external system controller or printer, etc.
59
GPIB
This connector is for use with a GPIB interface. It is connected to an
external system controller, or a printer etc.
60
Trig/Gate In (±10 V)This is a input connector for external trigger/gate signal.
50
Fig. 3-2 Rear Panel
60
Trig/Gate In(± 10V)
–10 To +2dBm
SH1 DC1
AJ1 DT1
T6
C1
L4
C2
SR1 C3
RL1 C4
PP0 C28
E2
59
CAUTION
WARNING
GPIB
Refer To Manual For Adress
0dBm
On
58
RS–232C
Line Input 300VA Max
47.5 – 63Hz
85–132V
T 5A
170–250V T 5A
Off
10MHz STD
Ref In
Buff Out
Freq Adj.
55
51
57
56
SECTION 3 PANEL DESCRIPTION
3-9
SECTION 3 PANEL DESCRIPTION
Description of Screen Display
Display items on the screen are explained in the 4 types.
1. Common display item
--- commonly displayed items
2. Frequency-domain display item --- displayed items in frequency domain trace
3. Time-domain display item
--- displayed items in time domain trace (zero span mode)
4. Menu display items
--- displayed items at soft-key menus
• Common display item
1. Marker value
2. Reference level
When the reference level offset is on, # is appended.
3. Resolution band width (RBW)
When the RBW is Manual, # is appended.
When the Couple mode is Independent, t is appended in time domain mode.
4. Video band width (VBW)
When the VBW is Manual, # is appended.
When the Couple mode is Independent, t is appended in time domain mode.
5. Attenuator
When the Attenuator is Manual, # is appended.
6. Sweep time
When the Sweep time is Manual, # is appended.
7. Time or title
Time is updated in 1-sec period.
8. Trace name
9. Input impedance
When the input impedance is 75Ω, 75Ohm is displayed.
When the input impedance is 50Ω, nothing are displayed.
10. Trace
11. Y-scale range
Displays the setting contents of the Y-axis scale range.
12. UNCAL indicator
When the relation among Span/RBW/VBW/Sweep-time is UNCAL(the measurement error of the
level and frequency is large because of too short sweep time), UNCAL is displayed.
When it is not UNCAL state, nothing are displayed.
13. Average/hold count
Displays the current sweep time when Storage mode is Averaging and Max-hold/Min-hold.
When the Storage mode is others, nothing are displayed.
3-10
SECTION 3 PANEL DESCRIPTION
14. Current marker
Displays at maximum or minimum point within the Marker zone. The frequency in frequency
domain (time in time domain) and level are displayed at the item of the 1 Marker, above.
15. Marker zone
Displays the Marker zone with a dotted rectangular. When the Zone width is spot, it becomes a
dotted line.
16. Reference marker
In the Delta marker mode, the Reference marker is displayed with .
17. Sweep marker
Real-time-displays the point where the sweep completed.
• Frequency-domain display item
21. Center frequency
In Start/Stop frequency mode, Start frequency is displayed.
22. Frequency span
In Start/Stop frequency mode, Stop frequency is displayed.
• Time-domain display item
31. Trigger level indicator
When the Trigger source is Video, the set Trigger level is displayed on screen.
32. Trigger point indicator
When the Delay time is minus value, the Trigger-signal input point(0) is displayed on screen.
33. Delay time
When the Trigger function is not used, 0 is displayed.
34. Time span
35. Tuned frequency
• Menu display items
41. Menu set (or group of menus) title
42. Menu title
43. Menu page number
When a few Menus exist on the same layer, the Menu page is displayed with a tag.
44. Lower menu mark
The current Menu is not the top; this mark(vertical line along the side of the Menu display) is
displayed, and F6 soft-key menu becomes “return”.
45. Lower-menu existing mark
When the lower menu exists below the current menu, * is appended at the top right of the current
menu label.
3-11
SECTION 3 PANEL DESCRIPTION
3-12
SECTION 3 PANEL DESCRIPTION
3-13
SECTION 3 PANEL DESCRIPTION
(Blank)
3-14.
SECTION 4 SOFT-KEY MENU
SECTION 4
SOFT-KEY MENU
In this section, soft-key menu functions and its hierarchical system are described using a tree.
TABLE OF CONTENTS
Soft-key Menu List ..............................................................................................................................
4-4
Menu Tree ...........................................................................................................................................
4-6
4-1
SECTION 4 SOFT-KEY MENU
(Blank)
4-2
SECTION 4 SOFT-KEY MENU
SECTION 4
SOFT-KEY MENU
In this section, soft-key menu functions and its hierarchical system are described using a tree.
Matters to be noted about the tree are shown below.
(1) Panel Key indicates a hard key on the front panel.
(2) Top menus are the menus at the top level which are displayed on the screen when the panel key is pressed.
Lower menus indicates other menus below the top menus.
(3) When a soft key with an appended asterisk (*) is pressed in these menus, the menu moves to the lower
menu indicated by the arrow symbol (→). However, if any not-supported-function soft key in an Option is
pressed, an error message is displayed.
(4) When the Return key is pressed at a lower menu, the next-higher menu is returned.
(5) Menus with more than six items are split into several pages.
(6) The menu page construction and currently-displayed page are indicated in the lower part of the menu. To
move to the next page, press the [More] key.
(7) Panel keys and soft keys prefixed by a sharp symbol (#) at the left of the menu frame, give an outline
explanation of the function.
(8) The menu with ! mark cannot be used on the MS2661N.
4-3
SECTION 4 SOFT-KEY MENU
Soft-key Menu List
Menu
Menu Tree(page/28)
A) A/B,A/BG
A/Time
ACP Setup1
ACP Setup2
Ajd ch Pwr
Amplitude
Attenuator
Avg Count
16
17
8
8
8
2
2
15
B) Burst Pwr
11
C) C/N Meas
Cal
Change Clr
Check File
Copy Cont
Copy from
Correction
CountSetup
7
22
21
26
20
21
2
7
D) Def Files
Def Menues
Define
Define Clr
Detection
Dip
Directory
Disp Line
Display
27
27
27
21
15
5
25
2
21
E) Edit Menue
Expand
27
17
F) File Ope
FM Monitor
Format
Freq Count
Frequency
25
17
25
7
1
G) Gate
Gate Setup
18
18
4-4
,
3
, 17
,
4
Menu
Menu Tree(page/28)
H) Hold Count
15
I)
Impedance
Initialize
Interface
Item
L) Lib Exec
Lib File
Lib Memory
Lib Prgm
Lib Remove
Lin Scale
Line
Load/Save
Location
Log Scale
Lvl Offset
2
27
24
12
26
26
26
27
26
2
9
9
20
2
2
M) Manual Set
Marker
Marker->
Mask Meas
Measure
Media
Media
Mem Card
Mkr List
Move Mask
Move Temp
Multi Marker
4
4
4
9
7
25
2
25
4
9
10
4
N) Noise Meas
Normalize
7
14
O) OBW Setup
Occ BW
8
8
, 20
, 10
, 10
,
5
, 27
, 9
, 10
SECTION 4 SOFT-KEY MENU
Menu
Menu Tree(page/28)
Menu
Menu Tree(page/28)
P) Paper Size
Peak
Plotter
Pon State
Pre Ampl
Preset
Printer
PTA
PTA Lib
20
5
20
21
2
28
20
25
26
T) Temp Meas
10
TG
Threshold
Title
Trace A,B
Trace Calc
Trace Move
Trace Time
TrackingAd
14
5
24
14
15
15
17
14
R) RBW
Recal Media
Recall
Ref Line
Ref Step
RS232C
3
12
12
15
2
24
Trnsformer
Trig Ext
Trig TV
Trig Video
Trigger
TV Monitor
2
18
18
18
18
19
S) Save
13
, 20
U) Units
User1
User2
User3
Save Media
ScrollStep
Select
13
1
2
Set Date
21
V) VBW
Set Time
Setup
Setup Mask
Setup Temp
Souce
Sound
Span
Storage
Sweep Time
Swp Contl
System
21
2
9
10
17
21
1
15
3
16
21
W) Wide IF
Z) Zone Width
,
9
, 10
, 15
, 18
2
6
6
6
3
18
4
, 18
, 17
, 17
4-5
SECTION 4 SOFT-KEY MENU
Menu Tree (
/27)
Menu
Panel Key Tree
Top menu
Lower menues
Top menu
Lower menues
Menu Tree ( 1 /27)
Panel Key
Frequency
Frequency
Center
Freq
• Set items related to frequency, including the center frequency, start/stop
frequency, peak->CF, auto synchronization, frequency step size and scroll
step size, etc.
Start
Freq
Stop
Freq
Peak ->CF
#1
Auto Tune
#1 Detects peak point in pre-specified (in BG range) span and automatically
tunes the peak signal to the specified span.
#2 Sets frequency step size for changing center frequency.
#2
CF
Step Size
|1| | | |
Frequency
Scroll->
<-Scroll
*
Scroll
Step Size
| |2| | |
ScrollStep
1div
2div
Span
Span
Span
Full Span
5div
10div
Zero Span
Scroll->
return
<-Scroll
• Set frequency span items, including frequency span, full span, zero span,
frequency span scroll, etc.
4-6
SECTION 4 SOFT-KEY MENU
Menu Tree ( 2 /27)
Panel Key
Top menu
Amplitude
Amplitude
Reference
Level
Peak-> RLV
Lower menues
Lvl Offset
Ref Level
Offset
On
Off
Ref Level
Offset
-10.05dB
*
Ref Level
Offset
*
Unit
Units
dBm
V
Log Scale
10dB/div
dBuV
Lin Scale
W
10%/div
dBmV
5dB/div
dBuV(emf)
2dB/div
*
Input
Impedance
1dB/div
5%/div
*
Log
Scale
*
Linear
Scale
|1| | | |
Units
return
return
2%/div
1%/div
return
|1| | | |
| |2| | |
return
return
Ref Step
Amplitude
*
Ref Level
Step Size
*
Display
Line
*
Attenuator
1Div
2Div
!
#1
*
Impedance
Trnsformer
*
Correction
Attenuator
Manual
Impedance
Auto
50 Ohm
5Div
10Div
*
Pre Ampl
Disp Line
Display
Line
On
Off
Disp Line
Level
-50.00dBm
75 Ohm
Marker
Level
Abs Rel
Manual
return
return
return
| |2| | |
Trnsformer
Trnsformer
(MA1621A)
On Off
#1 Sets correction (frequency-response
characteristics correction) function.
#2 The menu with ! mark cannot be used
on the MS2661N.
• Set items along the vertical axis of the screen,
including reference level, Peak->RLV, reference
level offset, measurement level unit, Log/Lin scale
switching, reference level step size, display line,
attenuator, pre-amplifier On/Off, 75 Ω impedance,
transformer, frequency-response correction, etc.
return
Correction
Correction
On
Off
*
Select
Corr
Select
Corr-1
Corr-2
Corr-3
return
Corr-4
*
Setup
Corr
return
Corr-5
return
Setup
Load
Corr Set
Display
Directory
/Next
Dir Disp
Detail
Outline
Save
Corr Set
Media
Mem Card-1
(Upper
Slot)
Mem Card-2
(Lower
Slot)
*
Load/Save
Media
return
return
4-7
SECTION 4 SOFT-KEY MENU
Menu Tree ( 3 /27)
Panel Key
Top menu
Lower menues
RBW
RBW
• Set the manual/auto of resolution bandwidth, and auto (RBW, VBW and
SWP only) or all auto.
Manual
Auto
RB,VB,SWT
Auto
#1
#1 Sets RBW, VBW, Sweep Time, Atten all to Auto.
All Auto
VBW
Manual
• Set the manual/auto of video bandwidth, and auto(RBW, VBW and SWP
only) or all auto.
#2 Sets ratio of VBW to RBW when VBW is Auto.
VBW
Auto
#2
Filter
Off
VB/RB
Ratio
1.0
Sweep Time
Sweep
Time
Manual
RB,VB,SWT
Auto
All Auto
Auto
• Set the manual/auto of sweep time, and auto (RBW, VBW and SWP only)
or all auto.
RB,VB,SWT
Auto
All Auto
Attenuator
Atten
Manual
• Set the manual/auto of the input attenuator, On/Off of the pre-amplifier and
all auto.
Auto
!
Pre Ampl
On
Off
All Auto
4-8
• The menu with ! mark cannot be used on the MS2661N.
SECTION 4 SOFT-KEY MENU
Menu Tree ( 4 /27)
Panel Key
Top menu
Lower menues
• Set the selection of normal/delta/no marker, zone marker width, marker->,
marker search mode, display line, marker tracking On/Off, zone sweep On/
Off, etc.
Marker
Marker
Normal
Marker
#1 Selects whether to search for maximum (Peak) or minimum (Dip)
value in zone marker.
Delta
Marker
#2 Toggles zone sweep On/Off. Usually, the zone sweep is Off. At On,
the sweep time is reduced by sweeping only the zone specified by the
zone marker.
Marker
Off
*
Zone Width
Zone Width
Spot
Marker ->
*
Marker ->
1Div
Mkr-> CF
2Div
Mkr->RLV
5Div
Mkr
-> CF
Step Size
|1| | | |
#1
Mkr Func
Marker
Search
Peak Dip
10Div
*
Display
Line
return
Delta Mkr
-> Span
Disp Line
Display
Line
On
Off
Disp Line
Level
-50.00dBm
Zone
-> Span
return
Marker
Tracking
On
Off
#2
Zone Sweep
On
Off
| |2| | |
#6
Marker
Level
Abs Rel
Multi Marker
Multi Mkr
Multi
Marker
On
Off
Marker
#3
Highest 10
#4
Harmonics
return
Mkr List
Marker
List
On
Off
*
Marker
List
*
#5
Manual
Set
• Set multi-marker On/Off, 10 multi-marker,
harmonic multi-marker, listing of multi-marker
values, selection of necessary markers, etc.
Freq/Time
Abs Rel
Level
Abs Rel
Manual Set
Change
Active
Marker No
Select
Marker No
4
On with
Auto
Select
Off with
Auto
Select
#3 Allocates up to 10 multi-markers
sequentially from the peak level of
the signal displayed on screen.
#4 Allocates multi-markers to the harmonic signals of frequency indicated by current marker.
#5 Function allowing user to select
only multi-markers necessary for
measurement.
Clear All
return
return
#6 Select "absolute value" or "relative
value (display line)" to display
marker level.
4-9
SECTION 4 SOFT-KEY MENU
Menu Tree ( 5 /27)
Panel Key
Top menu
Peak
Search
Lower menues
• Set maximum level search, next peak, next right peak, next left peak, Marker>, minimum level search, next minimum level, search level resolution,
threshold level On/Off, etc.
Peak
Peak
Search
Next Peak
Next Right
Peak
Next Left
Peak
Normal
Marker
Threshold
Delta
Marker
|1| |
Threshold
On
Off
Search
Above
Below
Dip
#1
Dip
Search
#1 Searches for minimum (Dip) level.
Next Dip
#2 Resolution
Display
Line
On
Off
Disp Line
Level
-50.00dBm
return
#2 Sets peak-search level resolution.
1.23 dB
*
Threshold
*
Marker ->
Marker ->
Mkr-> CF
| |2|
Mkr->RLV
Makrer ->
Peak
Search
Marker ->
Mkr-> CF
Mkr->RLV
Mkr
-> CF
Step Size
Mkr
-> CF
Step Size
Delta Mkr
-> Span
Zone
-> Span
return
Delta Mkr
-> Span
Zone
-> Span
• Set marker value -> center frequency, marker value -> reference level, marker
value -> CF step size, delta marker-> span, zone marker -> span, etc.
4-10
SECTION 4 SOFT-KEY MENU
Menu Tree ( 6 /27)
Panel Key
Top menu
Lower menues
Peak
→CF
Peak
→RLV
Single
Continuous
Single
User
User1
User2
User3
|1| | |
| |2| |
| | |3|
• The soft-key menu defined by the user is displayed. (See "User Define".)
4-11
SECTION 4 SOFT-KEY MENU
Menu Tree ( 7/27)
Panel Key
Top menu
Measure
Measure
#1
#2
#3
*
Frequency
Count
*
Noise
Measure
*
C/N Ratio
Measure
Lower menues
Freq Count
Count On
Count Off
*
Setup
Off
CountSetup
Resolution
1kHz
return
100Hz
|1| | |
Noise Meas
10Hz
Meas On
1Hz
return
Off
return
C/N Meas
Meas On
• Perform measurement according to various
applications:
#1 Frequency Count: Measure marker frequency with
Off
a high resolution.
Select resolution from 1 kHz, 100 Hz, 10 Hz and
1 Hz.
return
#2 Noise Measure: Measure the noise power within
zone marker.
#3 C/N Ratio Measure: Measure the ratio of carrier signal and noise power. Reference marker of the delta marker shall be
set to the carrier, and marker's zone width specifies the power measured.
4-12
SECTION 4 SOFT-KEY MENU
Menu Tree ( 8/27)
Panel Key
Top menu
Measure
Lower menues
Occ BW
*
#4
#5
#6
Occ BW
Measure
Execute
*
Adj ch pwr
Measure
*
Mask
*
Setup
Off
OBW Setup
Method
N% of Pwr
xdB Down
return
N% Ratio
99 %
| |2| |
xdB Value
10.0 dB
(Next
Page)
(Next Page)
Adj ch Pwr
return
Execute
Ch Sepa-1
12.5 kHz
Ch Sepa-2
25.0 kHz
Ch BW
8.5 kHz
*
Setup
return
#4 Occ BW Measure: Measure the occupied bandwidth.
Select the XdB DOWN or N% of POWER mode.
#5 Adj ch pwr Measure: Measure leak power from adjacent channels.
Select Channel Separate, Channel Bandwidth and Measurement
Mode (Method), On/Off of ACP Graph, On/Off of Channel Center
Line and On/Off of Channel BW Line, Upper Channel, Lower
Channel or Both Channel, etc.
ACP Setup1
Method
ACP Setup2
R:TotalPwr
R:RefLevel
Both
Channel
ACP Graph
On
Off
Upper
Ch Center Channel
Line
On
Off
Lower
Ch BW
Channel
Line
On
Off
Off
return
return
#6 Mask: Set Standard Line of the frequency domain and judge Good/
NG in relation to the standard line. Select Mask Table, Mask
Movement, Measurement Mode, Mask Table Preparation, Load/
Save of Mask Table, etc.
|1| |
| |2|
4-13
SECTION 4 SOFT-KEY MENU
Menu Tree ( 9 /27)
Panel Key
Top menu
(Previous Page)
Page)
(Previous
Lower menues
Mask Meas
Select
*
Check
Pass/Fail
Mask-1
*
Mask-2
*
Select
Mask Table
*
Move Mask
*
Mask-3
*
Mask-4
*
Setup
Mask Table
Mask-5
*
return
return
Line
Limit 1
Upper
On
Off
Limit 1
Lower
On
Off
Limit 2
Upper
On
Off
Limit 2
Lower
On
Off
return
Move Mask
Move x
12.34 kHz
Move y
5.12 dB
Select
Mask-1
Update
Mask Table
Mask-2
Cancel
Mask-3
return
Mask-4
Setup Mask
*
Select
Mask Table
Level
Absolute
Relative
*
Make Up
Mask Table
Mask-5
return
<Mask Edit
Edit
screen>
<Mask
Screen>
Load/Save
*
Load/Save
Mask Table
return
Load
Mask Table
Display
Directory
/Next
Dir Disp
Detail
Outline
Media
Mem Card-1
(Upper
Slot)
Mem Card-2
(Lower
Slot)
Save
Mask Table
*
Load/Save
Media
return
4-14
return
SECTION 4 SOFT-KEY MENU
Menu Tree (10 /27)
Panel Key
Top menu
Measure
Lower menues
Temp Meas
Select
*
#7
#8
Time
Template
*
Check
Pass/Fail
*
Burst
Avg Power
*
Temp-2
*
Select
Temp Table
*
Move
Template
*
Setup
Temp Tbl
Off
Temp-1
return
*
Temp-3
*
Temp-4
*
Line
Limit 1
Upper
On
Off
Limit 1
Lower
On
Off
Limit 2
Upper
On
Off
Limit 2
Lower
On
Off
Temp-5
return
return
| | |3| |
Move Temp
(Next Page)
(Next
Page)
Move x
0.00 msec
Move y
-1.24 dB
Select
Temp-1
Update
Temp Table
Cancel
return
Setup Temp
*
Select
Temp Table
Level
Absolute
Relative
*
Make Up
Temp Table
Temp-2
Temp-3
Temp-4
Temp-5
return
<Template
Screen>
<Template EditEdit
Screen>
Load/Save
*
Load/Save
Temp Table
return
#7 Time Template: Set Standard Line of the time domain and judge Good/
NG in relation to the standard line. Select Template Table, Template
Movement, Measurement Mode, Template Table Preparation, Load/Save
of Mask Table, etc.
#8 Burst Avg Power: Measure the mean power of burst signals in the time
domain. Select the start/end points.
Load
Temp Table
Display
Directory
/Next
Dir Disp
Detail
Outline
Media
Mem Card-1
(Upper
Slot)
Mem Card-2
(Lower
Slot)
Save
Temp Table
*
Load/Save
Media
return
return
4-15
SECTION 4 SOFT-KEY MENU
Menu Tree (11 /27)
Panel Key
Top menu
(PreviousPage)
Page)
(Previous
Lower menues
Burst Pwr
Execute
Start
Point
100
Stop
Point
100
return
4-16
SECTION 4 SOFT-KEY MENU
Menu Tree (12 /27)
Panel Key
Recall
Top menu
Recall
Recall-1
ABCDEFG
Recall-2
Recall-3
Lower menues
Recall
Recall-7
ABCDEFG
Recall
Recall
from
Recall-8
Int.Regstr
Display
#1 Directory
Recall-9
/Next
Recall-4
Recall-10
Recall
Recall
from
Mem Card
Display
Directory
/Next
Dir Disp
Detail
Outline
Recall-5
Recall-11
Recall-6
*
Recall-12
|1| | | |
#2
| |2| | |
*
Recall
Items
| | |3| |
Recall
Media
*
Recall
Items
| | | |4|
Item
All
Trace &
Parameter
Recl Media
Mem Card-1
(Upper
Slot)
Mem Card-2
(Lower
Slot)
All T & P
->View
Parameter
Parameter
except
Ref Level
return
return
• Read out trace waveform/parameters from the internal memory or memory card.
Select recall addresses and media/items, and display file directories.
#1 Displays list of internal-register directories.
#2 Specifies items to be recalled
(trace waveform, parameter, etc.).
4-17
SECTION 4 SOFT-KEY MENU
Menu Tree (13 /27)
Panel Key
Save
Recall
Top menu
Save
Save
to
Int.Regstr
Display
Directory
/Next
Lower menues
• Save trace waveform/parameters to the internal memory or memory card.
Select saved media, and display file directories.
|1| |
Save
Save
to
Mem Card
Display
Directory
/Next
Dir Disp
Detail
Outline
Select *
Save
Media
| |2|
Save
Save
BMP file
to MemCard
Display
Directory
/Next
Dir Disp
Detail
Outline
*
Save
Media
| | |3|
4-18
Save Media
Mem Card-1
(Upper
Slot)
Mem Card-2
(Lower
Slot)
return
SECTION 4 SOFT-KEY MENU
Menu Tree (14 /27)
Panel Key
TG
Top menu
Lower menues
TG
Trace A,B
TG Out
On
Off
Output
Level
0 dBm
Attenuator
Hold
On
Off
*
Trace
A,B
*
Normalize
Trace A
• Set ON/OFF and output level of tracking generator.
#1 Normalize trace-A waveform data, and display it.
Trace B
A->B
B->A
A<->B
return
Normalize
#1
Instant
Normalize
Normalize
(A-B+DL)
On
Off
Display
Line
On
Off
Disp Line
Level
-50.00dBm
Marker
Level
Abs Rel
return
4-19
SECTION 4 SOFT-KEY MENU
Menu Tree (15 /27)
Panel Key
Top menu
Trace A,B
A,B
Lower menues
Trace Move
Trace A
A->B
Trace B
B->A
Trace Calc
Normalize
(A-B+DL)
On
Off
Ref Line
Top
*
#1
A<->B
Trace
Move
*
#2
A+B->A
Trace
Calc
A-B
On
Off
*
Ref Line
Moddle
Bottom
*
Storage
*
Detection
return
return
|1| |
return
Storage
Normal
Storage
*
Max Hold
Cumulative
*
Min Hold
Overwrite
*
Average
Stop
Continue
Hold Count
Sweep
Count
256
Endless
Sweep
Stop
Avg Count
Averaging
Count
256
Avg Mode
Stop
Non-Stop
Stop
Continue
Continue
Restart
View
Restart
Restart
return
return
|1| |
return
return
| |2|
Detection
Trace A,B
Normal
Trace AonB
Active
Trace
A
B
Pos Peak
Sample
Neg Peak
*
#3
Storage
#4
*
Detection
return
#1 Trace Move: Conduct movements A->B and B->A,
switching between A and B, and A+B operation.
#2 Trace Calc: Select A-B+DL corrective operation, A-B
operation and Ref Line.
#3 Storage: Select a storage mode from Normal/Max Hold/
Min Hold/Average. Set Sweep Count, Rewrite/
Overwrite, Stop Continue, Restart, etc.
#4 Detection: Select a detection mode from Normal/Pos
Peak/Neg Peak/Sample.
| |2|
• Select Trace A/B, movement between Trace A/B, sum/difference operation between Trace A/B and Ref Line,
and designate the storage and detection modes and Active Trace.
4-20
SECTION 4 SOFT-KEY MENU
Menu Tree (16 /27)
Panel Key
Top menu
A/B,A/BG
A,B
#1
Lower menues
• Simultaneously display two waveforms, namely Trace A and Trace B or
Trace A and Trace BG (peripheral spectrum containing Trace A). The large
display is Main Trace and the small one is Sub Trace; select which to display
as Main Trace (or Sub Trace).
Sweep Control: Set Stop/Continuous/Restart for sweep and Stop/Write for
Sub Trace.
A/B,A/BG
A/B
(A<B)
A/B
(A>B)
A/BG
(A<BG)
A/BG
(A>BG)
*
Sweep
Control
Swp Contl
Sub Trace
Write
Sub Trace
View
Stop
Continuous
Restart
return
#1 Displays two traces A and B simultaneously at top and bottom of screen. The trace-B display
is the larger at this time.
4-21
SECTION 4 SOFT-KEY MENU
Menu Tree (17 /27)
Panel Key
Top menu
Trace Time
Time
Delay Time
10.0 ms
Time Span
200 us
Trigger
Freerun
Triggered
*
Trigger
Source
*
Storage
*
Detection
Lower menues
• Set to the zero-span time domain display. Set Time Span, Trigger, Trigger
Source, Storage, Detection and FM Monitor On/Off, and select Expand
(waveform).
Source
(Same as as
"Trigger
Source" menu
in Trig/Gate
key) in Trig/Gate key)
(Same
”Trigger
Source”
menu
Storage
(Same as as
"Storage
Mode" menu
in A,B
key) in A,B key)
(Same
”Strage
Mode”
menu
Detection
(Same
as "Det
in A,B
key) in A,B key)
(Same
as Mode"
”Det menu
Mode”
menu
|1| |
!
Trace Time
*
FM Monitor
#1
Expand
*
Expand
Zone Start
Point
100
Zone Span
Point
50
Expand
Zone
On
Off
| |2|
#1 Zooms in time-domain waveform display.
Expand
On
Off
A/Time
Time
#2
A/Time
A/Time
(A<Time)
A/Time
(A>Time)
return
Swp Contl
Sub Trace
Write
Sub Trace
View
#2 Displays trace-A waveforms in frequency domain and time domain simultaneously at top and bottom of
screen. The time-domain display is
the larger at this time.
Stop
Continuous
*
Sweep
Control
Restart
return
• Simultaneously display waveforms of Trace a and Time Domain.
Which to display as Main Trace (or Sub Trace) can be selected.
4-22
SECTION 4 SOFT-KEY MENU
Menu Tree (18 /27)
Panel Key
Top menu
Trigger
/Gate
#1
Lower menues
Trig Video
Trigger
Trigger
Freerun
Triggered
*
Trigger
Source
Trig Level
-50dB
Source
Trig Level
High
*
High, Middle, Low
Wide IF
Video
Trig Ext
-10 to 10V
*
TTL
Wide IF
Video
Trace Time
*
External
Delay Time
10.0 ms
Time Span
200 us
|1| |
*
!
TV
Trig Slope
Rise Fall
reteun
Trig Slope
Rise Fall
Line
reteun
Trig Level
-5.0V
Trig Slope
Rise Fall
reteun
return
Gate
#2
Gate Sweep
On
Off
*
Gate Setup
Stop
Restart
*
Trace Time
Trace A
| |2|
Gate Setup
Gate Delay
0 us
Gate
Length
10 ms
Gate End
Int Ext
*
Gate Trig
Source
#1 Trigger Source: Select a trigger source from Video, Wide
IF Video, External and Line.
#2 Gete Setup : Set gate conditions including Gate Delay, Gate
Length, Gate End and Gate Trig Source.
Wide IF
Source
Trig Level
High
return
*
Trig Ext
-10 to 10V
Wide IF
Video
*
TTL
External
Trace Time
Delay Time
10.0 ms
Time Span
200 us
Trig Slope
Rise Fall
return
Trig Slope
Rise Fall
Trig Level
-5.0V
reteun
Trig Slope
Rise Fall
reteun
Trigger
Freerun
Triggered
*
Gate Trig
Source
return
• Set gate functions for controlling the sweep start trigger and the writing of waveform
data. Set the trigger mode, trigger source, trace time, delay time and time span. Select
On/Off, Stop and Restart of Gate Sweep.
4-23
SECTION 4 SOFT-KEY MENU
Menu Tree (19 /27)
Panel Key
!
TV Monitor
Trig/Gate
4-24
Top menu
Lower menues
SECTION 4 SOFT-KEY MENU
Menu Tree (20 /27)
Panel Key
Top menu
Lower menues
Copy
Paper Size
Copy Cont
Copy
Copy Cont
A4
A3
Printer
Full Size
Printer
*
Plotter
Quarter
Size
HP2225
#1
Plotter
*
BMP file
To MemCard
VP-600
(ESC/P)
HP-GL
GP-GL
*
Paper Feed
Paper
Size
*
Stop Print
Magnify
1x2
Printer
Address
18
Plot
Rocation
Reset
|1| |
return
Copy Cont
*
Printer
Setup
return
Location
*
Item
Plotter
Address
18
Location
Auto
[] []
[] []
[]
return
*
[]
Plotter
Setup
*
BMP file
Save Media
• Set Printer/Plotter to hard-copy the screen. Set Printer/
Plotter, Printer (model)/Plotter (model), Paper Feed,
Stop Printer, Plot Location Reset, etc.
[]
[]
return
Item
| |2|
Save Media
MemCard-1
(Upper
slot)
MemCard-2
(Lower
slot)
All
Trace
Scale
#1 Save the screen image data in memory card
by BMP format(MS-DOS bit-map data
format).
return
return
4-25
SECTION 4 SOFT-KEY MENU
Menu Tree (21/27)
Panel Key
!
Top menu
Lower menues
• The menu with ! mark cannot be used on the MS2661N.
Sound
#1 Sets whether the coupled settings for RBW, VBW, etc., in frequency
and time domain, independent or common.
#2 Changes screen color pattern.
System
#1
#2
System
Couple
Common
Independnt
*
Display
*
Change
Color
Auto SWT
Hi-Lvl-Acc
Fast
*
Power On
State
Display
Parameter
Display
Type-1
Color
Pattern 1
Clock Disp
y/m/d
Color
Pattern 2
Color
Pattern 3
|1| |
return
System
Change Clr
Color
Pattern 4
*
Define
User Color
Define Clr
*
Copy Color
Ptn from
Select
Item
BackGround
Set Date
return
*
Set Time
Pon State
Red
15
Set Date
Before
Power Off
Recall
Memory
Green
15
Year
Set Time
Month
Hour
Fixed
State
Copy from
Color
Pattern 1
Color
Pattern 2
Color
Pattern 3
Color
Pattern 4
Blue
15
return
Day
Minute
return
| |2|
Recall
Memory No
1
Second
return
return
return
4-26
• Set various modes of systems of this
device.
Set Couple , Display, Color Pattern,
Define User Color, Power On State,
etc.
SECTION 4 SOFT-KEY MENU
Menu Tree (22/27)
Panel Key
Cal
Top menu
Lower menues
• Execute calibration. Select an item from All Cal, Level Cal and Freq Cal.
Cal
All Cal
Level Cal
Freq Cal
FM Cal
*
Preslctr
Tuning
Cal
Freq Cal
On
Off
*
Cal Status
<Calibration status screen>
*
Maintenance
4-27
SECTION 4 SOFT-KEY MENU
Menu Tree (23/27)
Panel Key
Top menu
Lower menues
• Set interfaces for external devices to connect. Select RS232C, or GPIB, and set the RS232C interface, GPIB address,
etc.
Interface
Interface
*
RS232C
Setup
GPIB
My Address
1
Connect to
Controller
RS232C
Connect to
Prt/Plt
None
Connect to
Peripheral
GPIB
RS232C
Baud Rate
4800
Parity
Even
Data Bits
8bits
Stop bit
1bit
return
• Input a title to display on the screen.
Title
Title
Comment
Title
*
Edit Title
4-28
<Edit
Screen>
<Edit Screen>
SECTION 4 SOFT-KEY MENU
Menu Tree (24/27)
Panel Key
Top menu
Mem Card
Lower menues
Mem Card
*
Directory
Directory
File Ope
Display
Directory
/Next
Dir Disp
Detail
Outline
*
Trace
*
#1
Format
*
Correction
*
Mask
*
Template
Delete
*
Define
Menus
*
Select
Media
File
Protection
return
return
Format
|1| |
Apply
Directory
Media
Mem Card-1
(Upper
Slot)
Mem Card-2
(Lower
Slot)
*
#1 Formats memory card.
• Set Directory, Format and Media of the
memory card.
Directory: Select a directory to display
from Trace, Correction, Mask, Template
and Define Menus.
File Ope: Select an item from Display
Directory, Dir Disp, Delete and File
Protection.
BMP file
return
return
return
| |2|
PTA
PTA *
PTA
Program
PTA
PTA
Run
*
PTA
Library
PTA
Prog List
PTA
F1
Stop
Cursor
Up
Cont
Cursor
Down
Reset
Yes
F2
No
F3
Load
F4
Off
Run
F5
etc.
etc.
|1| | | |
etc.
| |2| | |
(Next page)
(Next
page)
etc.
| | |3| |
| | | |4|
• Set PTA (personal test automation) that can build an auto measurement system without requiring external controllers.
PTA Program: Select one from Run, Stop, Cont Reset, Prog List, Load, etc.
PTA Library: Select one from Display/Run for the library program and Load/Check for the library file.
4-29
SECTION 4 SOFT-KEY MENU
Menu Tree (25 /27)
Panel Key
Top menu
(Previouspage)
page)
(Previous
Lower menues
PTA Lib
*
Library
Memory
*
Library
File
Lib Memory
Cursor
Up
Lib Exec
Run
Cursor
Down
Stop
*
Execute
Cont
Library
/Page
Reset
*
Remove
return
return
etc.
Lib Remove
Yes
Lib File
Cursor
Up
No
Cursor
Down
Load
File
/Page
*
Check File
Check File
Library
/Page
return
return
4-30
SECTION 4 SOFT-KEY MENU
Menu Tree (26 /27)
Panel Key
Top menu
Define
Lower menues
Define
*
#1
Define
Menus
#2
Edit
Menu
*
*
Initialize
Menus *
Load/Save
Def Files
Def Menus
Select *
Source
Lib Prgm
Select
Source
Menu
Select
Dest
Menu
Lib Prgm
Up
Down
Next Page
Set source
into Dest
Delete
Dest
return
return
Edit Menu
Select
Source
*
Edit
F-key Menu
*
Edit
Menu Title
<Title
edit screen>
<Title
edit screen>
<Title
edit screen>
<Title
edit screen>
Initialize
return
Yes
• Set Define, Edit, Initialize and Load/Save.
#1 Define Menus: Select one from Source Menu,
Source Library, Destination Menu, etc., and set
Definition/Delete for the user menu.
#2 Edit Menu: Select a source and edit Menu Title.
Def Files
Load
Def Menu
File
Display
Directory
/Next
Dir Disp
Detail
Outline
Save
Def Menu
File
Select *
Load/Save
Media
No
Media
Mem Card-1
(Upper
Slot)
Mem Card-2
(Lower
Slot)
return
return
4-31
SECTION 4 SOFT-KEY MENU
Menu Tree (27 /27)
Panel Key
Preset
Top menu
Preset
Preset
All
Preset
Sweep
controll
Preset
Trace
Parameters
Preset
Level
Parameters
Preset
Freq/Time
Parameters
Hold
Local
4-32 .
Lower menues
• Initialize measurement parameters. Select one from All, Sweep, Trace, Level
and Frequ/Time.
SECTION 5 BASIC OPERATION PROCEDURE
SECTION 5
BASIC OPERATION PROCEDURE
TABLE OF CONTENTS
Signal Display .....................................................................................................................................
5-3
Turn the power on .......................................................................................................................
5-3
Set the signal to the center of the screen ...................................................................................
5-4
Enlarge and display the signal ....................................................................................................
5-5
Marker Operation ................................................................................................................................
5-6
Check of the zone marker function .............................................................................................
The "marker → CF" function check .............................................................................................
"Measure" Function Check ..................................................................................................................
5-8
Screen Hard Copy ...............................................................................................................................
5-9
5-1
SECTION 5 BASIC OPERATION PROCEDURE
(Blank)
5-2
SECTION 5 BASIC OPERATION PROCEDURE
SECTION 5
BASIC OPERATION PROCEDURE
The basic operation procedure of this equipment are
explained here. The operations are listed on the right.
Also, the explanation willl advance assuming that a
500 MHz signal is applied to the input connector.
Please read this manual while operating this
equipment.
(
: Panel key,
: Soft key)
<Actual operations>
(1) Signal display
1) Turn the power on,
2) set the signal to the center of the screen, and
3) enlarge and display the signal.
(2) Marker operation
Check of the zone marker function.
The "marker → CF" function check.
(3) "Measure" function check
(4) Screen hard copy
Signal Display
Turn the power on
Press the AC line power switch on the rear panel,
then press the power switch (0) on the front panel.
In this case, continue pressing the power switch
for one second or more.
Press Preset key.
Press Preset All Parameters key in the menu.
The power is turned on/off only when the power
switch is pressed for one second or more. This
prevents the power from being turned on/off easily
by mistake.
When panel key (hard key) is pressed, the related
soft key menu is displayed.
Fig. 5-1
Partial resettings are enabled. This resetting
includes only the display-related resetting or the
resetting of special modes such as zone sweep.
5-3
SECTION 5 BASIC OPERATION PROCEDURE
Set the signal to the center of the screen
Press Frequency key.
Fig. 5-2
When pressing Frequency, Span, Amplitude or
Coupled Function key(s) which is used frequently,
Center Frequency, Span, Reference Level, RBW
or VBW function is selected and numeric value
for the function can be entered into Entry area.
This reduce key operation times.
This display section is called Entry area. Selecting
the menu displays the current set value of the
parameter. The set value can be changed by
entering data in Entry area.
Press Menu On/Off key
The display of the soft key menu can be switched
on/off using Menu On/Off key. When the menu
disappears, the scale is enlarged. Also, when the
menu is displayed, the scale is reduced.
Fig. 5-3
Press Menu On/Off key to return to previous screen.
Use the ten-key pad (numeric keys) to enter 500 MHz.
The following three methods to input numeric
values to parameters are provided: direct input by
the ten-key pad (numeric keys), up/down keys,
and rotary knob.
Fig. 5-4
5-4
SECTION 5 BASIC OPERATION PROCEDURE
Enlarge and display the signal
Press Span key , then press the V down key several times to enlarge the signal display.
Fig. 5-5
5-5
SECTION 5 BASIC OPERATION PROCEDURE
Marker Operation
Here, checks that the signal frequency and level are displayed in a marker display area. The zone marker
automatically fetches the highest level signal within the zone and displays the frequency and level.
Fig. 5-6
To check Marker → CF function, shift the signal from the center intentionally.
Press Frequency key and More key in order, and then Scroll → key two times.
The soft key menu marked by an asterisk(*) on
the upper right indicates that the menu can further
be opened by pressing the key. Adversely, the soft
key menu not marked indicates that the menu
cannot be opened any more, so to speak, the end
of menu opening.
The following items can easily be checked by the
soft key menu tab: How many pages of the soft
Fig. 5-7
key menu being displayed currently are there?,
and what page is displayed now?
To turn over the page, press More key.
5-6
SECTION 5 BASIC OPERATION PROCEDURE
Press Peak Search key.
*Advanced operation memo: It is convenient that
the page can also be turned over by repeatedly
pressing the panel key. This method is used when
key(s), such as Measure key, has a number of
pages. Besides, the Freq/Ampl and Marker-related
keys do not turn over the page by repeatedly
pressing the panel key. For these keys, because
the first page is important specially, it should
always be displayed when the panel key is pressed.
Fig. 5-8
The marker fetches the signal.
Press More key.
Press Marker → key.
When the soft key menu with * is pressed, the
lower menu of function related to the menu is
further displayed.
In this case, as shown in the figure on the left, the
thick line is displayed at the left of the soft key
menu. This indicates that the lower menu is
displayed.
Fig. 5-9
Press marker → CF key.
The page opened by pressing the soft key can
return to the preceding page by the return key.
Besides, it can be checked that which soft key
menu was pressed previously to open the current
menu, as the menu title is displayed on the upper
row of the soft key.
Fig. 5-10
Here, return to the screen of Fig. 5-7 and ensure that the screen changes to that of Fig. 5-10 only by pressing
the → CF key.
5-7
SECTION 5 BASIC OPERATION PROCEDURE
"Measure" Function Check
Press Preset key and Preset All Parameters key in order.
Press Peak Search key.
If the zero beat signal level (local feed though) is larger than the signal level and the marker fetches the zero
beat level, press "Next peak" key and put the marker on the signal.
Fig. 5-11
Press the Measure key and Frequency Count key to set the function of high accuracy frequency measurement
of the marker points.
Then, press the Count On key and start measurement.
The soft-key menu display can be switched On/
Off by the Menu On/Off key.
However, keys that condition setting is not
possible unless a menu is On unconditionally
make the soft-key menu display On when pressing
a panel key.
Fig. 5-12
From the screen after executing measurement, press
another panel key and change parameters, and then,
pressing again the Measure key will automatically
return to the menu of this screen and not to page 1
of the menu (page learning function).
It is a useful function when repeating measurement.
The frequency of marker points is displayed at the top left of the screen.
Incidentally, the internal counter correctly operates even at the full span condition, so an operation to reduce
frequency span otherwise required is not necessary in this model.
5-8
SECTION 5 BASIC OPERATION PROCEDURE
Screen Hard Copy
The screen can be hard-copied with the VP-600 printer (Epson) via an RS-232C interface, and the procedures
are described below:
1)
As illustrated below, connect the RS-232C connector and printer with an attached RS-232C cable.
2)
Press the Copy key, and the currently displayed screen is hard-copied.
If the printed copy is improper, check if the RS-232C interface is correctly set in the following sequence.
3)
Press the Shift key and then the Interface key.
4)
Press the Connect to Controller key several times to get None on the display, and press the Connect to
Prt/Plt key several times and get RS-232C on the display.
Now the printer can be operated with RS-232C.
5)
Press the RS-232C Setup key and set so that (or check if) the the setting of RS-232C interface is the same
between the main body and printer.
(For the setting/checking of the RS-232C interface on the printer side, refer to the instruction manual of
the printer.)
6)
Press the Shift key and then the Copy Cont key.
7)
Press the Printer/Plotter key and select Printer.
8)
Press the Printer Setup key, and then press the VP-600 key.
9)
Press the Magnify key several times and make the display 1 × 1.
10) Press the Copy key, and the currently displayed screen is hard-copied.
Rear panel
10MHz STD
Ref In
Buff Out
Off
Freq Adj.
–10 To +2dBm
0dBm
WARNING
On
Line Input 300VA Max
47.5 – 63Hz
85–132V
T 5A
170–250V T 5A
Printer
CAUTION
Trig/Gate In(± 10V)
RS-232C Cable
RS–232C
GPIB
Refer To Manual For Adress
SH1 DC1
AJ1 DT1
T6
C1
L4
C2
SR1 C3
RL1 C4
PP0 C28
E2
Fig. 5-13
5-9
SECTION 5 BASIC OPERATION PROCEDURE
(Blank)
5-10 .
SECTION 6 PERFORMANCE TESTS
SECTION 6
PERFORMANCE TESTS
In this chapter, measuring instruments, setup and operations necessary for conducting performance tests of MS2661N are
described.
TABLE OF CONTENTS
Requirement for Performance Tests ...................................................................................................
6-3
Instruments Required for Performance Test .......................................................................................
6-4
Performance Test ................................................................................................................................
6-6
Reference oscillator frequency stability ......................................................................................
6-6
Center frequency readout accuracy ............................................................................................
6-9
Frequency span readout accuracy ..............................................................................................
6-12
Resolution bandwidth (RBW) ......................................................................................................
6-15
Sideband noise ...........................................................................................................................
6-19
Frequency measurement accuracy .............................................................................................
6-21
Amplitude display linearity ..........................................................................................................
6-23
Frequency response ...................................................................................................................
6-27
Second harmonic distortion ........................................................................................................
6-30
Input attenuator switching error ..................................................................................................
6-33
Sweep time and time span accuracy ..........................................................................................
6-36
Tracking generator output level flatness .....................................................................................
6-40
Service ................................................................................................................................................
6-43
6-1
SECTION 6 PERFORMANCE TESTS
(Blank)
6-2
SECTION 6 PERFORMANCE TESTS
SECTION 6
PERFORMANCE TESTS
Requirement for Performance Tests
Performance tests are used as preventive maintenance to prevent degradation of the MS2661N performance
before it occurs.
Use the performance tests whenever necessary such as at acceptance and periodic inspection of the MS2661N
and to verify performance after repair. Execute the performance tests listed below to verify the MS2661N
performance at acceptance inspection, periodic inspection and after repair.
•
•
•
•
•
•
•
•
•
•
•
•
Reference oscillator frequency stability
Center frequency display accuracy
Frequency span display accuracy
Resolution bandwidth and selectivity
Sideband noise level
Frequency measurement accuracy
Amplitude display linearity
Frequency response
Second harmonic distortion
Input attenuator switching error
Sweep time and time span accuracy
TG output level
Execute the performance tests at regular intervals as preventive maintenance for important evaluation items.
We recommend that the performance be inspected regularly once or twice a year.
If the specifications are not met at the performance tests, please contact Anritsu Corporation.
6-3
SECTION 6 PERFORMANCE TESTS
Instruments Required for Performance Test
A list of instruments required for performance test is shown below.
Instruments Required for Performance Test ( 1/2 )
Recommended instrument
name ( Model name )
Synthesized signal
generator
( MG3633A )
Attenuator
( MN510C )
Required Performance †
Test item
• Frequency range 10 MHz to
3 GHz Resolution of 1 Hz
possible
• Output level range –20 to 0
dBm
Resolution of 0.1 dB possible
• SSB phase noise
≤130 dBc / Hz
( at 10 kHz offset )
• Second harmonic
≤30 dBc
• Amplitude modulation
( 0% to 100%, 0.1 to 400 Hz )
possible
• External reference input
( 10 MHz ) possible
Frequency-span display accuracy
Resolution bandwidth, selectivity
Sideband noise
Amplitude display linearity
Second-harmonic distortion
• Frequency
100 MHz
• Maximum attenuation
70 dB ( resolution 0.1 dB )
possible with calibrated data
Amplitude display linearity
Input-attenuator switching error
Input-attenuator switching error
Sweep-time and time-span accuracy
† Extracts part of performance which can cover the measurement range of the test item.
6-4
SECTION 6 PERFORMANCE TESTS
Instruments Required for Performance Test ( 2/2 )
Recommended instrument
name ( Model name )
Power meter ( ML4803A )
Required Performance †
Test item
• Main instrument accuracy
±0.02 dB
• Frequency range
100 kHz to 3 GHz
( depending on the power
sensor type )
• Frequency range
100 kHz to 3 GHz
• Measurement power range
–30 to +10 dBm
• Input connector
N type
Frequency response
Input-attenuator switching error
TG output level
Low-pass filter
(M-238C)
(SAGE L20CA072)
• Attenuation
≥70 dB ( at frequency: 2 ×
( 10 MHz and 1 GHz ) )
Second-harmonic distortion
Frequency counter
( MF1601A )
10 MHz measurement possible
Number of display digits: 10
• External reference input
( 10 MHz ) possible
Reference-oscillator frequency
stability
Frequency standard
• Frequency
10 MHz
• Stability
≤1 × 10 –9 /day
Reference-oscillator frequency
stability
Power sensor ( MA4601A )
Frequency response
Input-attenuator switching error
TG output level
† Extracts part of performance which can cover the measurement range of the test item.
6-5
SECTION 6 PERFORMANCE TESTS
Performance Test
The warm-up time depends on the test item. For test item other than oscillator frequency, warm-up the equipment
for at least for thirty minutes and test the performance after the MS2661N stabilizes completely. Also, begin
measurement after taking the warm-up time of the calibration instrument into full consideration. In addition,
the test must be conducted at room temperature; there must be little AC power supply voltage fluctuation, and
no noise, vibration, dust, humidity, etc.
Reference oscillator frequency stability
The 10 MHz reference oscillator is tested for frequency stability.
Stability is determined by measuring frequency variation after 24 hours and after 48 hours of power on at
ambient temperatures of 0°C and 50°C.
(1) Specifications
Reference oscillator
•
Frequency:
10 MHz
•
Aging rate:
≤ ±2 × 10⁻⁸ / day
After 24 hour warm-up at 25˚C ± 5˚C
•
Temperature stability:
≤ ±5 × 10⁻⁸ at 0 and 50˚C referred to frequency at 25˚C
(2) Test instruments
•
•
6-6
Frequency counter:
Frequency standard:
MF1601A
with stability of ≤ ±1 ×10⁻⁹ / day
SECTION 6 PERFORMANCE TESTS
(3) Setup
10MHz STD
Ref In
Buff Out
Off
Freq Adj.
–10 To +2dBm
0dBm
WARNING
On
Line Input 300VA Max
47.5 – 63Hz
85–132V
T 5A
170–250V T 5A
Frequency standard
CAUTION
Trig/Gate In(± 10V)
OUTPUT
RS–232C
GPIB
Refer To Manual For Adress
SH1 DC1
AJ1 DT1
T6
C1
L4
C2
SR1 C3
RL1 C4
PP0 C28
E2
Frequency counter
MF1601A
10 MHz STD
Buff Out
INPUT
FREQ STD
10 MHz IN
Reference Oscillator Frequency Stability Test
(4) Procedure
Aging rate / day: Test this at the ambient temperature ±2 °C in a vibration-free place.
Step
Procedure
1
Set the changeover switch ( FREQ STD: INT / EXT ) on the MF1601A counter rear panel to
EXT.
2
Set the AC line power supply switch on the MS2661N rear panel to On and then the Power
switch on the MS2661N front panel to On.
3
Measure the frequency using the counter with 0.1 Hz resolution after 24 hours have passed
after turning the power ON.
4
Measure the frequency using the counter after 24 more hours have passed from the step 3
measurement.
5
Calculate the stability by using the following equation.
Frequency stability =
(2nd reading of the counter) – (1st reading of the counter)
(1st reading of the counter )
6-7
SECTION 6 PERFORMANCE TESTS
Temperature stability: Test this performance in a vibration-free constant-temperature chamber.
Step
Procedure
1
Set up the MS2661N in a constant-temperature chamber at 25˚C in the same setup.
2
Set the LINE and Power switches on the MS2661N to On and wait until the MS2661N
internal temperature stabilizes ( approx. 1.5 hours after the chamber temperature stabilizes ).
3
When the internal temperature stabilizes, measure the frequency by using the counter with 0.1
Hz resolution.
4
Change the chamber temperature to 50˚C.
5
When the chamber temperature and the MS2661N internal temperature re-stabilize, measure
the frequency by using the counter.
6
Calculate the stability by using the following equation.
Frequency stability =
7
6-8
(counter reading at 50°C) – (counter reading at 25°C)
(counter reading at 25°C)
Change the chamber temperature to 0˚C and repeat steps 5 and 6.
SECTION 6 PERFORMANCE TESTS
Center frequency readout accuracy
Add the known frequency which serves as the center frequency reference to the MS2661N as shown in the
figure below and set CF ( same value as the known reference frequency ) and SPAN. At this time, check that
the difference between the reading of the marker readout frequency ( thick arrow in the figure ) of the center
frequency peak point, and the CF set value is ≤ ± (Center frequency accuracy).
As shown in the figure, the Synthesized Signal Generator uses the signal source phase-locked with the same
accuracy as the 10 MHz reference oscillator of the MS2661N.
(1) Specifications
•
Center frequency accuracy:
± ( Indicated frequency × reference frequency accuracy + resolution band
width × 15% + span × 5% +15 kHz ) ; * Span ≥2 MHz
± ( Indicated frequency × reference frequency accuracy + resolution band
width × 15% + span × 5% +25 Hz ) ; * Span <2 MHz
6-9
SECTION 6 PERFORMANCE TESTS
(2) Test instruments
•
Synthesized signal generator: MG3633A
(3) Setup
MKR : 500.0010MHz
Marker display frequency
Analyzer
MS2661N Spectrum
100Hz–1.8GHz
Freq/Ampl
Marker
Remote
Entry
Shift
Multi Mkr
Menu On/Off
Preset
Frequency
Marker
Span
Marker
Peak
Search
F1
Local
F2
Amplitude
User
Peak
F3
Copy Cont
CF
F4
Single
Measure
TG
Save
Recall
F5
Stby On
Display
A/B,A/BG
A/Time
A,B
Time
TV Monitor
Trig/Gate
F6
More
CE
Continuous
RLV
Copy
BS
PTA
Define
7
8
9
GHz
dBm
dB
4
5
6
MHz
V
sec
Sound
System
Title
2
3
kHz
mV
msec
1
RBW
Coupled Finction
VBW Sweep Time Atten
Memory Card
Cal
0
Hold
Interface Mem Card
.
–/+
Enter
Hz
µV
µsec
RF Input 50Ω
+30dBm
0V DC Max
TG Output 50Ω
300kHz–1.8GHz
RVS PWR
+20dBm
0V DC Max
RF Input
10 MHz STD
Buff Out
CF : 500MHz
Coaxial adaptor
( N-P ⋅ SMA-J )
Span : 200kHz
Synthesized signal
generator
Known reference frequency
( used as center frequency reference )
MG3633A
RF OUTPUT
10 MHz REF INPUT
Coaxial cable
( SMA-type connector )
Center-Frequency Readout-Accuracy Test
6-10
SECTION 6 PERFORMANCE TESTS
(4) Precautions
Set the signal generator output level to approx –10 to –20 dBm.
(5) Procedure
Step
Procedure
1
Press the MS2661N [ Preset ] key, and then Preset All key.
2
Operate Freq Cal.
3
Set the signal generator output frequency equal to the center frequency (500 MHz) in the
following table.
4
Set the MS2661N to the center frequency in the following table.
5
Set the span (10 kHz) that corresponds to the center frequency (500 MHz) in the table by
using the numeric/unit keys.
6
Read the marker frequency (indicated by thick arrow in the figure on the previous page) and
check that the value is within the range between the maximum and minimum values shown in
the following table.
7
Repeat steps 3 to 6 for other combination of the center frequency and span according to the
combinations shown in the following table.
Center frequency display accuracy test
Signal
generator
500 MHz
Center
frequency
500 MHz
Span
frequency
Center frequency
Minimum value Maker value Maximam value
10 kHz
499.999 46
(RBW:100 Hz)
200 kHz
499.989 525
(RBW:3 kHz)
100 MHz
494.940 00
(RBW:300 kHz)
500.000 54
500.010 475
505.060 00
6-11
SECTION 6 PERFORMANCE TESTS
Frequency span readout accuracy
Using the setup shown in the figure below, set the frequencies corresponding the 1st and 9th division from the
left side of the screen scale with the SG. The frequency difference between the peak levels at the 1st and 9th
divisions is equal to the frequency span × 0.8.
(1) Specifications
•
Frequency span accuracy: ±5%
(2) Test instrument
•
Synthesized signal generator: MG3633A
(3) Setup
Spectrum Analyzer
MS2661N 100Hz–1.8GHz
Measure frequency
difference with SG
Freq/Ampl
Marker
Entry
Shift
Multi Mkr
Menu On/Off
Preset
Remote
Frequency
Marker
Span
Marker
Peak
Search
F1
Local
F2
Amplitude
User
Peak
F3
Copy Cont
CF
CE
Continuous
RLV
Single
Measure
TG
BS
Copy
F4
Save
Recall
F5
Stby On
Display
A/B,A/BG
A/Time
A,B
Time
RBW
8
Hold
Coupled Finction
VBW Sweep Time Atten
Cal
0
Interface Mem Card
.
–/+
Enter
Hz
RF Input 50Ω
+30dBm
0V DC Max
Coaxial adaptor
(N-P ◊ SMA-J :
Only when 6769A is
used )
Span : 1kHz
Synthesized signal
generator
MG3633A
RF OUTPUT
Coaxial adaptor
( N-type connector )
6-12
mV
msec
3
RF Input
Frequency Readout Accuracy Test
V
sec
kHz
6
Title
2
RVS PWR
+20dBm
0V DC Max
REF IN
dBm
dB
MHz
5
System
TG Output 50Ω
300kHz–1.8GHz
CF : 1.000 000GHz
GHz
4
Memory Card
10 MHzSTD
Buff Out
9
1
F6
More
Define
7
Sound
TV Monitor
Trig/Gate
PTA
µV
µsec
SECTION 6 PERFORMANCE TESTS
(4) Precautions
Set the signal generator output level to approx. 0 to –10 dBm.
(5) Procedure
Step
Procedure
1
Press the [ Preset ] key, and then Preset All key.
2
Operate Freq Cal.
3
Connect the MG3633A output to the MS2661N RF Input.
4
Set the MS2661N as shown below:
Span ............................................................ 2 kHz
Center Freq .......................................... 1000 MHz
5
Set the MG3633A output frequency to the f1 frequency ( 999.9992 MHz ) shown in the table
on the next page.
6
Adjust the MG3633A output frequency to set the spectrum peak at the 1st division from the
left end of the screen scale.
Remember the frequency as f1' .
7
After setting the MG3633A output frequency to the f2 frequency ( 1000.0008 MHz ), adjust it
to set the spectrum peak at the 9th division.
Remember the frequency as f2'.
8
Calculate ( f2' –f1' ) / 0.8 and check that the value is within the specified range ( minimum to
maximum values ) shown in the table on the next page.
9
Repeat steps 4 through 8 for each frequency span with 1 GHz center frequency shown in the
table on the next page.
6-13
SECTION 6 PERFORMANCE TESTS
Frequency-Span Readout-Accuracy Test
MS2661N
Center
frequency
1 GHz
6-14
Span
2 kHz
20 kHz
200 kHz
2 MHz
10 MHz
100 MHz
1.8 GHz
Signal generator
f1
999.9992 MHz
999.992 MHz
999.92 MHz
999.2 MHz
996 MHz
960 MHz
280 MHz
Span
f2
1000.0008 MHz
1000.008 MHz
1000.08 MHz
1000.8 MHz
1004 MHz
1040 MHz
1.72 GHz
Minimum
value
1.9 kHz
19 kHz
190 kHz
1.9 MHz
9.5 MHz
95 MHz
1.71 GHz
f2 ' - f1 '
8
Maximum
value
2.1 kHz
21 kHz
210 kHz
2.1 MHz
10.5 MHz
105 MHz
1.89 GHz
SECTION 6 PERFORMANCE TESTS
Resolution bandwidth ( RBW )
If there are two input signals with the frequency difference corresponding to 3 dB bandwidth ( of IF final
stage ), these signals can be resolved as two spectrum waveforms.
This is called the resolution bandwidth.
Amplitude
3 dB
3 dB
bandwidth
60 dB
60 dB
bandwidth
Center frequency
Frequency
(1) Specifications
•
Resolution bandwidth accuracy:
±20% ( RBW = 30 Hz to 300 kHz )
±30% ( RBW = 10 Hz )
±25% ( RBW = 1 MHz )
(2) Test instrument
•
Synthesized signal generator:
MG3633A
6-15
SECTION 6 PERFORMANCE TESTS
(3) Setup
Spectrum Analyzer
MS2661N 100Hz–1.8GHz
Freq/Ampl
Marker
Preset
Remote
Entry
Shift
Multi Mkr
Menu On/Off
Frequency
Marker
Span
Marker
Peak
Search
F1
OCCBW : 30.6kHz
CTR : 99.9996MHz
Local
F2
Amplitude
User
Peak
F3
Copy Cont
CF
F4
Single
Measure
TG
Save
Recall
F5
Display
A/B,A/BG
A/Time
Stby On
A,B
CE
Continuous
RLV
Copy
Time
TV Monitor
Trig/Gate
F6
BS
PTA
Define
7
8
9
GHz
dBm
dB
4
5
6
MHz
V
sec
Sound
System
Title
kHz
mV
msec
1
More
RBW
Memory Card
Coupled Finction
VBW Sweep Time Atten
Cal
0
2
Hold
3
Interface Mem Card
.
–/+
Enter
Hz
µV
µsec
RF Input 50Ω
+30dBm
0V DC Max
TG Output 50Ω
300kHz–1.8GHz
3 dB
bandwidth
RVS PWR
+20dBm
0V DC Max
10MHz STD
Buff Out
RF Input
Resolution bandwidth
Coaxial cable
(BNC connector)
Coaxial cable
(N-type connector)
REF-IN
MG3633A
OUTPUT 100 MHz
Resolution Bandwidth Test
6-16
SECTION 6 PERFORMANCE TESTS
(4) Procedure
Resolution bandwidth accuracy
Step
Procedure
1
Press the [ Preset ] key, and then Preset All key.
2
Perform all calibration ( ALL CAL: Refer to SECTION 8 in the Detailed Operating Instruction Part of the separate operation manual ).
3
Set the MS2661N as shown below:
Center Freq ............................................ 100 MHz
Span ........................................................... 5 MHz
RBW ( MANUAL ) .................................. 1 MHz
Scale ............................................ LOG 1 dB / div
4
Press the [ → RLV ] key and match the peak of the signal trace to the top line ( REF LEVEL )
on the screen.
5
Press the [ Signal ] key to execute a single
sweep, then check that the single sweep has
been completed.
6
After pressing the Measure key, operate Occ
BW Measure and Setup and display the setup
menu of occupied frequency bandwidth measurement.
7
Select XdB Down and set it to 3 dB.
8
Press Return to return to the Occ BW Measure
menu, and then press Execute.
9
The 3 dB resolution bandwidth value is displayed
in the upper left-hand corner of the screen.
Fill in this value in the table on the next page.
10
Repeat steps 3 to 9 for the frequencies other than
the resolution bandwidth 1 MHz and the frequency span 5 MHz according to the combinations of resolution bandwidth and frequency span
3 dB
bandwidth
Bandwidth Measurement
shown in the table on the next page.
6-17
SECTION 6 PERFORMANCE TESTS
Resolution Bandwidth ( 3 dB )
Resolution bandwidth
1 MHz
300 kHz
100 kHz
30 kHz
10 kHz
3 kHz
1 kHz
300 Hz
100 Hz
30 Hz
10 Hz
6-18
Frequency span
5 MHz
500 kHz
200 kHz
50 kHz
20 kHz
5 kHz
2 kHz
500 Hz
200 Hz
100 Hz
100 Hz
3 dB bandwidth
SECTION 6 PERFORMANCE TESTS
Sideband noise
When the resolution bandwidth is set to a fixed value and a signal that has far less sideband-noise level than the
equipment to be tested (MS2661N) is input, check the level of the noise as compared to the peak signal (dBc)
at the specified frequency away from the peak.
Since the average value is measured for noise level, use a
video filter for measurement.
Sideband
noise
This sideband noise is a spectrum response which is
modulated by the internal noise of the MS2661N. If this
response is large, the actual filter envelope is masked by the
noise as shown, which makes measurement impossible.
Actual filter envelop
(1) Specifications
≤ – 100 dBc / Hz ( Frequency: 1 GHz, 30 kHz offset, RBW: 1 kHz )
• Sideband noise:
(2) Test instruments
• Signal generator:
MG3633A Synthesized Signal Generator
(3) Setup
Analyzer
MS2661N Spectrum
100Hz–1.8GHz
Freq/Ampl
Marker
Entry
Shift
Multi Mkr
Menu On/Off
Preset
Remote
Frequency
Marker
Span
Marker
Peak
Search
F1
Local
F2
Coaxial cable
( BNC connector )
Amplitude
User
Peak
F3
Copy Cont
CF
F4
Single
Measure
TG
Save
Recall
F5
Stby On
Display
A/B,A/BG
A/Time
A,B
Time
TV Monitor
Trig/Gate
F6
More
Synthesized signal
generator
MG3633A
RBW
Memory Card
CE
Continuous
RLV
Copy
Coupled Finction
VBW Sweep Time Atten
BS
PTA
Define
7
8
Hold
9
GHz
dBm
dB
MHz
V
sec
kHz
mV
msec
4
5
6
Sound
System
Title
1
2
3
Cal
0
Interface Mem Card
.
–/+
Enter
Hz
µV
µsec
RF Input 50Ω
+30dBm
0V DC Max
TG Output 50Ω
300kHz–1.8GHz
RVS PWR
+20dBm
0V DC Max
REF IN
10MHz STD
Buff Out
SG
RF Input
RF OUTPUT
Coaxial cable
( N -type connector )
Sideband Noise Test
6-19
SECTION 6 PERFORMANCE TESTS
(4) Procedure
Step
Procedure
1
Press the [ Preset ] key, and then Preset All key.
2
Operate All Cal.
3
Set the MG3633A output to 1000 MHz and 0 dBm.
4
Set the MS2651A/MS2661A as shown below:
Center Freq .................................. 1.000 030 GHz
Span .......................................................... 75 kHz
Reference Level ........................................ 0 dBm
Attenuator ................................................... 10 dB
RBW ........................................................... 1 kHz
VBW .......................................................... 10 Hz
DET MODE ......................................... SAMPLE
6-20
5
Press the [ Peak Search ] key to search for a peak
point so that the peak point on the signal trace is
included in the zone marker.
6
Press the [ → RLV ] key to match the peak of the
signal trace to the top line ( REF LEVEL ) on the
screen.
7
After pressing the Measure key, select C/N Ratio
Measure.
8
Press the Meas On key to start C/N measurement.
9
Set Zone Width of Marker to Spot.
10
Press the [ Marker ] key, then turn the rotary knob
to move the zone marker to the right so that the
zone center frequency is 30.0 kHz.
11
Make sure that the C/N value is –100 dBc/Hz or less.
CF : 1.000 030GHz
Span : 75kHz
Sideband Noise Measurement
SECTION 6 PERFORMANCE TESTS
Frequency measurement accuracy
Set the marker point to the position at least 20 dB higher than the noise ( or adjacent interference signal ) to
operate the built-in counter (Option 03) with the higher-S/N signal, and test the frequency measurement accuracy
using Count On mode. (This test cannot be performed without Option 03.)
(1) Specifications
•
•
≤ ( Readout frequency × reference oscillator accuracy ± ( 1 count ) )
1 Hz, 10 Hz, 100 Hz, 1 kHz
Accuracy:
Resolution:
(2) Test instrument
•
Signal generator:
MG3633A
(3) Setup
Analyzer
MS2661N Spectrum
100Hz–1.8GHz
Freq/Ampl
Marker
Entry
Shift
Multi Mkr
Menu On/Off
Preset
Remote
Frequency
Marker
Span
Marker
Peak
Search
F1
Local
F2
Amplitude
MG3633A
MG3633A
User
Peak
F3
10MHz Reference
Buffered out
Copy Cont
CF
F4
Single
Measure
TG
Save
Recall
F5
Stby On
Display
A/B,A/BG
A/Time
A,B
Time
TV Monitor
Trig/Gate
F6
More
CE
Continuous
RLV
Copy
BS
PTA
Define
7
8
9
GHz
dBm
dB
4
5
6
MHz
V
sec
Sound
System
Title
kHz
mV
msec
1
RBW
Coupled Finction
VBW Sweep Time Atten
Cal
0
2
Hold
3
Interface Mem Card
.
Memory Card
–/+
Enter
Hz
µV
µsec
RF Input 50Ω
+30dBm
0V DC Max
TG Output 50Ω
300kHz–1.8GHz
RVS PWR
+20dBm
0V DC Max
Coaxial sdaptor
(SAM connector)
RF Input
OUTPUT 500 MHz
Coaxial sdaptor
(SAM connector)
Coaxial sdaptor
(N-P ⋅ SMA-J)
Frequency Measurement Accuracy Test
6-21
SECTION 6 PERFORMANCE TESTS
(4) Procedure
Step
Procedure
1
Press the [ Preset ] key, and then Pseset All key.
2
Set the MG3633A to 500 MHz and –10 dBm.
3
Set the MS2661N as shown below:
Center Freq ............................................ 500 MHz
Span ............................................................ 5 kHz
4
Press the [Measure] key and set to Frequency Count. Press Setup and set Resolution to 1 Hz.
Then, press the Return key and set to Count On.
5
Confirm that the FREQ reading at the upper-left of
the screen is the RF INPUT frequency 500 MHz ±
1 Hz or less.
6
Change the counter resolution to 10 Hz and confirm
that the Freq reading is 500 MHz ± 10 Hz or less.
7
• Change the counter resolution to 100 Hz and
confirm that the Freq reading is 500 MHz ± 100
Hz or less.
• Change the counter resolution to 1 kHz and
confirm that the Freq reading is 500 MHz ± 1
kHz or less.
CF : 500MHz
Span : 5kHz
Frequency Measurement
6-22
SECTION 6 PERFORMANCE TESTS
Amplitude display linearity
Test the error per vertical graduation for the LOG display. For the LOG display linearity, test that the graduation
is equal to the logarithm ( dB ) of the input signal level.
Input the correct level signal to the RF Input via an external attenuator and calculate the error from the attenuation
of the attenuator and the ∆ marker reading at the trace waveform peak.
(1) Specifications
•
Amplitude display linearity:
After automatic calibration
LOG: ± 1.5 dB for 0 to – 85 dB ( RBW ≤ 10 kHz )
± 1 dB for 0 to – 70 dB ( RBW ≤ 100 kHz )
± 0.5 dB for 0 to – 20 ( RBW ≤ 1 MHz )
(2) Test instruments
•
•
Signal generator:
Attenuator:
MG3633A
MN510C
(3) Setup
Analyzer
MS2661N Spectrum
100Hz–1.8GHz
Freq/Ampl
Marker
Remote
Entry
Shift
Multi Mkr
Menu On/Off
Preset
Frequency
Marker
Span
Marker
Peak
Search
F1
Local
F2
Amplitude
User
Peak
F3
Copy Cont
CF
F4
Single
Measure
TG
Save
Recall
F5
Stby On
Display
A/B,A/BG
A/Time
A,B
Time
TV Monitor
Trig/Gate
F6
More
Signal generator
Attenuator
MN510C
SG
ATT
BS
PTA
Define
7
8
9
GHz
dBm
dB
4
5
6
MHz
V
sec
Sound
System
Title
2
3
kHz
mV
msec
1
RBW
Memory Card
Coupled Finction
VBW Sweep Time Atten
Cal
0
Hold
Interface Mem Card
.
–/+
Enter
Hz
µV
µsec
RF Input 50Ω
+30dBm
0V DC Max
TG Output 50Ω
300kHz–1.8GHz
MG3633A
CE
Continuous
RLV
Copy
RVS PWR
+20dBm
0V DC Max
RF Input
RF OUTPUT
INPUT
OUTPUT
Coaxial cable ( N - type connector )
Amplitude Display Linearity Test
6-23
SECTION 6 PERFORMANCE TESTS
(4) Procedure
LOG display linearity
Step
Procedure
1
Press the [ Preset ] key.
2
Operate All Cal.
3
Set the MG3633A to 100 MHz and 0 dBm.
4
Set the MN510C to 0 dB.
5
Set the MS2661N as shown below:
Center Freq ............................................ 100 MHz
Span .......................................................... 10 kHz
Reference Level ........................................ 0 dBm
Attenuator ................................................... 10 dB
RBW ........................................................... 3 kHz
VBW ........................................................ 300 Hz
6-24
6
Press the [ → CF ] key to set the spectrum waveform peak to the center of the screen.
7
Adjust the MG3633A output level so that the marker level reading is 0.0 dBm.
8
Press the [ Marker ] key sequentially to set the marker to ∆ marker after the sweep is completed.
SECTION 6 PERFORMANCE TESTS
Step
Procedure
9
As shown on Fig. (b), read the level of the current marker when the MN510C is set at 5dB.
An error is determined as calibrated ATT 5 dB value + ∆ marker level.
10
Add a marker level corresponding to the calibrated ATT value when the MN510C is set as 10
to 90 DB (with 5 dB steps) and determine the error.
∆ MKR : 0.000kHz
0.0dB
ATT 0dB reference
( a ) Reference Point Setting
∆ MKR : 0.000kHz
– 5.04dB
( 5 dB corrected value ) + ( Marker level )
( b ) ∆ Marker Level when ATT is 5
6-25
SECTION 6 PERFORMANCE TESTS
Log Display Linearity ( 10 dB / div )
A
MN510C
setting
(dB)
0
5
10
15
20
25
30
35
40
45
50
55
60
65
70
75
80
85
6-26
MN510C
calibration
value ( dB )
0 ( reference )
B
∆ marker level Error ( dB )=A+B
( dB )
0 ( reference )
0 ( reference )
SECTION 6 PERFORMANCE TESTS
Frequency response
Generally, when one or more signals with a different frequency but the same amplitude are input, the spectrum
analyzer displays the same amplitude for each spectrum on the screen.
(1) Specifications
•
Frequency response:
At 100 MHz, input ATT 10 dB to 60 dB
± 1.5 dB ( 100 Hz to 1.8 GHz )
(2) Test instruments
•
•
•
Signal generator:
Power meter:
Power sensor:
MG3633A
ML4803A
MA4601A
(3) Setup
Analyzer
MS2661N Spectrum
100Hz–1.8GHz
Freq/Ampl
Marker
Entry
Shift
Multi Mkr
Menu On/Off
Preset
Remote
Frequency
Marker
Span
Marker
Peak
Search
F1
Local
F2
Amplitude
User
Peak
F3
Coaxial cable
( BNC connector )
Copy Cont
F4
Single
Measure
TG
Save
Recall
F5
Display
A/B,A/BG
A/Time
Stby On
A,B
Time
TV Monitor
Trig/Gate
F6
BS
PTA
Define
7
8
9
GHz
dBm
dB
4
5
6
MHz
V
sec
Sound
System
Title
kHz
mV
msec
1
More
RBW
Coupled Finction
VBW Sweep Time Atten
Memory Card
Cal
0
2
Hold
3
Interface Mem Card
.
–/+
Enter
Hz
µV
µsec
RF Input 50Ω
+30dBm
0V DC Max
TG Output 50Ω
300kHz–1.8GHz
REF
IN
CE
Continuous
RLV
CF
Copy
Power meter
RVS PWR
+20dBm
0V DC Max
10MHz STD
Buff Out
MG3633A
ML4803A
RF Input
INPUT
OUTPUT
MA4601A
Coaxial adaptor
( N - P ⋅ SMA-J )
Coaxial adaptor
Power sensor
(N⋅J-N⋅J)
Coaxial cable
( SMA connector )
Frequency Response Test
(4) Precautions
This test should be performed after allowing the instrument to warm up for 60 minutes or more.
(5) Procedure
6-27
SECTION 6 PERFORMANCE TESTS
(a) Calibration of signal-generator MG3633A
Step
1
Procedure
Set the MG3633A as shown below:
OUTPUT FREQ .................................... 100 MHz
OUTPUT LEVEL ................................. –10 dBm
2
Connect the MG3633A output to the power sensor input with a coaxial cable.
3
Read the power meter display.
4
Change the MG3633A output frequency as shown in the tables on the next page and read the
power meter display with level at 100 MHz as reference. This data is the calibration data.
(b) Readout of measured amplitude deviation ( frequency response )
Step
Procedure
1
Connect the MG3633A OUTPUT to MS2661N RF Input with a coaxial cable.
2
Press the MS2661N [ Preset ] key, and then Preset All key.
3
Perform all calibration.
4
Set the MS2661N as shown below:
Center Freq ............................................ 100 MHz
Span ........................................................ 200 kHz
Reference Level .................................... –10 dBm
5
Press the [ → CF ] key.
6
Set the marker mode to delta marker.
7
Set the MS2661N center frequency as shown in the tables on the next page, then obtain the
deviation from the formula below by reading the delta marker level at each frequency.
Deviation = Delta marker level reading – Measurement frequency calibration value
6-28
SECTION 6 PERFORMANCE TESTS
Frequency Response
Frequency
Calibration value ( dBm )
Marker level ( dB )
100 MHz
0 dB (reference)
0 dB (reference)
Deviation ( dB )
0 dB (reference)
200 MHz
500 MHz
1 GHz
1.5 GHz
6-29
SECTION 6 PERFORMANCE TESTS
Second harmonic distortion
Even if a signal without harmonic distortion is input to a spectrum analyzer, the higher harmonics are generated
by the analyzer input-mixer non-linearity and are displayed on the screen.
The second harmonic level is the highest harmonic displayed on the MS2661N. The main point of the test is to
apply a signal (with a distortion that is lower than the MS2661N internal harmonic distortion [ at least 20 dB
below ] ) to the MS2661N and measure the level difference between the fundamental wave and the second
harmonic. If a low-distortion signal source cannot be obtained, apply a low-distortion signal to the MS2661N
after passing the signal through a low-pass filter ( LPF ).
(1) Specifications
•
Second harmonic distortion:
At mixer input level – 40 dBm:
≤ – 60 dBc (input frequency 100 Hz to 900 MHz)
(2) Test instruments
•
Signal generator:
MG3633A
•
LPF:
With attenuation of 70 dB or more at twice the fundamental frequencies
(3) Setup
Spectrum Analyzer
MS2661N 100Hz–1.8GHz
Freq/Ampl
Marker
Entry
Shift
Multi Mkr
Menu On/Off
Preset
Remote
Frequency
Marker
Span
Marker
Peak
Search
F1
Local
F2
Amplitude
User
Peak
F3
Copy Cont
CF
F4
Single
Measure
TG
Save
Recall
F5
Stby On
Display
A/B,A/BG
A/Time
A,B
Time
TV Monitor
Trig/Gate
F6
More
RBW
CE
Continuous
RLV
Copy
Coupled Finction
VBW Sweep Time Atten
BS
PTA
Define
7
8
9
GHz
dBm
dB
4
5
6
MHz
V
sec
Sound
System
Title
1
2
3
kHz
mV
msec
Cal
0
Interface Mem Card
.
Memory Card
Low-pass filter
MG3633A
SG
LPF
RF OUTPUT
INPUT
RVS PWR
+20dBm
0V DC Max
RF Input
OUTPUT
Coaxial cable
( N connector )
Second Harmonic Distortion Test
6-30
–/+
Enter
Hz
RF Input 50Ω
+30dBm
0V DC Max
TG Output 50Ω
300kHz–1.8GHz
Signal generator
Hold
µV
µsec
SECTION 6 PERFORMANCE TESTS
(4) Procedure
Step
Procedure
1
Press the [ Preset ] key, and then Preset All key.
2
Operate All Cal.
3
Set the LPF cut-off frequency to approx. 12.8 MHz.
4
Set the SG output frequency to 10 MHz and the output level to – 40 dBm.
5
Set the MS2661N as shown below:
Center Freq .............................................. 10 MHz
Span .......................................................... 10 kHz
Reference Level ................................... – 40 dBm
Attenator ....................................................... 0 dB
6
Adjust the SG output level so that peak of the spectrum waveform is at the REF LEVEL ( the
top horizontal line of the screen ).
7
Move the marker to the peak of the spectrum
waveform and make the marker the delta marker.
8
Set the center frequency to twice the fundamental
wave frequency to display the second harmonic on
the screen.
The delta marker reading indicates the level
difference betweeen the fundamental wave and the
second harmonic.
If the level difference is 80 dB or more,set the REF
LEVEL to – 60 dBm. Confirm that the ATT set
value is 0 dB.
6-31
SECTION 6 PERFORMANCE TESTS
Step
Procedure
9
Set the LPF cut-off frequency to approx. 1.2 GHz.
10
Set the SG as follows:
OUTPUT FREQ .................................... 900 MHz
OUTPUT LEVEL ................................ – 40 dBm
11
Set the MS2661N as follows:
Center Freq ............................................ 900 MHz
Span .......................................................... 10 kHz
Reference Level ................................... – 40 dBm
Attenutor ...................................................... 0 dB
12
6-32
Repeats steps 6 to 8.
SECTION 6 PERFORMANCE TESTS
Input attenuator switching error
At this point, measure the switching error when the amount of attenuation in the RF input section is switched.
When the input attenuator is switched, IF-section step-amplifier gain is switched. To keep this step-amplifier
gain constant, the reference level is switched according to the amount of input attenuator attenuation.
(1) Specifications
•
± 2.0 dB (at 0 to 60 dB, frequency 100 MHz and input ATT 10 dB)
Input attenuator switching error:
(2) Test instruments
•
•
•
•
Signal generator:
Attenuator:
Power meter:
Power sensor:
MG3633A
MN510C
ML4803A
MA4601A
(3) Setup
Analyzer
MS2661N Spectrum
100Hz–1.8GHz
Freq/Ampl
Marker
Coaxial connector
( BNC connector )
Signal generator
Frequency
Marker
Span
Marker
Peak
Search
F1
Shift
Local
F2
Amplitude
User
Peak
F3
Copy Cont
CF
F4
Single
Measure
TG
Save
Recall
Stby On
Display
A/B,A/BG
A/Time
A,B
Time
TV Monitor
Trig/Gate
F6
More
CE
Continuous
RLV
Copy
F5
MG3633A
Entry
Multi Mkr
Menu On/Off
Preset
Remote
BS
PTA
Define
7
8
9
GHz
dBm
dB
4
5
6
MHz
V
sec
Sound
System
Title
kHz
mV
msec
1
RBW
Coupled Finction
VBW Sweep Time Atten
Cal
0
2
.
RF OUTPUT
–/+
Enter
Hz
µV
µsec
RF Input 50Ω
+30dBm
0V DC Max
TG Output 50Ω
300kHz–1.8GHz
10MHz STD
Buff Out
3
Interface Mem Card
Memory Card
REF
IN
Hold
RVS PWR
+20dBm
0V DC Max
Attenuator
RF Input
MN510C
INPUT
OUTPUT
Coaxial cable
( N connector )
Power meter
Power Sensor
ML4803A
MA4601A
Input Attenuator Switching Error Test
Coaxial adaptor
( N-J ⋅ N--J )
6-33
SECTION 6 PERFORMANCE TESTS
(4) Procedure
Step
Procedure
1
Press the MS2661N [ Preset ] key, and then Preset All key.
2
Operate All Cal.
3
Set the MS2661N as shown below:
Center Freq ............................................ 100 MHz
Span ........................................................ 200 kHz
4
Set the signal generator MG3633A as shown below:
OUTPUT FREQ .................................... 100 MHz
OUTPUT LEVEL ................................ – 10 dBm
5
Set the amount of attenuation of the attenuator MN510C to 0 dB.
6
Connect the output of the attenuator MN510C to the power meter via coaxial cable.
7
Adjust the signal-generator output level so that the indicated value of the power meter is
– 10.0 dBm.
8
Connect the coaxial cable of the attenuator output to the MS2661N RF Input.
9
Press the MS2661N [ → CF ] key.
10
Set the MS2661N reference level to –10 dBm and attenuation to 60 dB.
11
Read the marker level.
12
Set Reference Level, ATT of this device and the external ATT as shown in the table on the
next page, and read the level of each marker.
13
Find the error by the formula below:
Error = marker level value – Reference Level – attenuator calibration value
14
Find the deviation by the formula below:
Deviation = Error – error when ATT at 10 dB
Confirm that the deviation is within ≤ 2.0 dB.
6-34
SECTION 6 PERFORMANCE TESTS
MS2661N setting
REF LEVEL
ATT
MN510C
setting
Calibration Marker level
value of
value
attenuator
Error
Deviation
– 10 dBm
60 dB
0 dB
dB
dBm
dB
dB
– 20 dBm
50 dB
10 dB
dB
dBm
dB
dB
– 30 dBm
40 dB
20 dB
dB
dBm
dB
dB
– 40 dBm
30 dB
30 dB
dB
dBm
dB
dB
– 50 dBm
20 dB
40 dB
dB
dBm
dB
dB
– 60 dBm
10 dB
50 dB
dB
dBm
dB
0 dB (reference)
– 70 dBm
0 dB
60 dB
dB
dBm
dB
dB
6-35
SECTION 6 PERFORMANCE TESTS
Sweep time and time span accuracy
(1) Specifications
•
Sweep time accuracy:
± 15% ( 20 msec to 100 sec )
•
Time span accuracy:
± 1% ( 100µsec to 100sec )
(2) Test instruments
•
Signal generator:
MG3633A
Wiltron 6769A
(3) Setup
Spectrum Analyzer
MS2661N 100Hz–1.8GHz
Freq/Ampl
Marker
Entry
Shift
Multi Mkr
Menu On/Off
Preset
Remote
Frequency
Marker
Span
Marker
Peak
Search
F1
Local
F2
Amplitude
User
Peak
F3
Copy Cont
CF
F4
Signal generator
Single
Measure
TG
Save
Recall
F5
Stby On
Display
A/B,A/BG
A/Time
A,B
Time
TV Monitor
Trig/Gate
F6
More
RBW
Coupled Finction
VBW Sweep Time Atten
Memory Card
MG3633A
RF OUTPUT
6769A
CE
Continuous
RLV
Copy
BS
PTA
Define
7
8
Hold
9
GHz
dBm
dB
MHz
V
sec
kHz
mV
msec
4
5
6
Sound
System
Title
1
2
3
Cal
0
Interface Mem Card
.
–/+
Enter
Hz
µV
µsec
RF Input 50Ω
+30dBm
0V DC Max
TG Output 50Ω
300kHz–1.8GHz
RVS PWR
+20dBm
0V DC Max
RF OUTPUT
RF Input
Coaxial cable
(N-type connector: When MG3633A is used )
(SMA connector: When 6769A is used )
Coaxial adaptor
( N-P • SMA-J : Only when 6769A is used )
Sweep Time and Time Span Accuracy
6-36
SECTION 6 PERFORMANCE TESTS
(4) Procedure
(a) Sweep Time
Step
Procedure
1
Press the MS2661N [ Preset ] key, and then Preset All key.
2
Operate All Cal.
3
Connect the MG3633A signal generator with the MS2661N as shown in the setup diagram.
4
Set the MS2661N as shown below:
CENTER FREQ .................................... 100 MHz
SPAN ........................................................ 100 Hz
SWP TIME .............................................. 20 msec
RBW .......................................................... 1 MHz
VBW ......................................................... 1 MHz
5
Set the MG3633A as shown below:
OUTPUT FREQ .................................... 100 MHz
OUTPUT LEVEL ................................ – 16 dBm
MODULATION .......................... AM (INT) 90%
MODULATION FREQ ............................. 1 kHz
6
Press the [ → RLV ] key.
7
Set the MS2661N scale to Linear.
8
Press the [ Single ] key, then wait until a single sweep execution is completed.
9
Set the MS2661N marker zone width to 5 Hz ( Zone Width = 5 Hz ).
10
Move the MS2661N marker to the left of the screen using the knob and set the zone marker
on the leftmost peak of the sine wave.
11
Setting the MS2661N marker mode to delta marker, move the current marker to the right
using the knob. Then set the zone marker to the 18th peak from the leftmost sine wave peak
on the screen.
12
Read the time display of the delta marker, which corresponds to 90% of the Sweep Time.
Obtain the SWP TIME by the following equation.
SWP TIME = Setting SWP TIME ×
delta maker reading
1000 (Hz)
6-37
SECTION 6 PERFORMANCE TESTS
Step
13
Procedure
Measure at each setting shown in the table below according to steps 8 to 12.
MS2670A
Setting SWP TIME
MG3633A AM
modulation frequency
20 msec
1 kHz
15.3 msec / 20.7 msec
200 msec
100 Hz
153 msec / 207 msec
2 sec
10 Hz
1.53 sec / 2.07 sec
20 sec
1 Hz
15.3 sec / 20.7 sec
Leftmost peak
6-38
MS2670A
SWP TIME
90% of specification
min / max
The 18th peak numbered from the leftmost peak
SECTION 6 PERFORMANCE TESTS
(b) Time span
Step
Procedure
1
Perform test procedure steps 1 to 8 on the preceding paragraph ( a ).
However, set MODULATION FREQ of the MG3633A to 100 Hz.
2
Set the MS2661N display mode to Time.
3
Set Time Span to 20 msec.
4
Perform steps 8 to 13 of the test procedure on the preceding paragraph ( a ).
MS2670A
time span
MS2670A
MG3633A AM
modulation frequency delta marker reading
90% of specification
min / max
20 msec
1 kHz
17.82 msec / 18.18 msec
200 msec
100 Hz
178.2 msec / 181.8 msec
2 sec
10 Hz
1.782 sec / 1.818 sec
20 sec
1 Hz
17.82 sec / 18.18 sec
6-39
SECTION 6 PERFORMANCE TESTS
Tracking generator(TG) output level flatness
The output level of the Tracking Generator can be easily tested by inputting the TG output signal to the RF
Input connector of the MS2661N.
Here, an accurate method to test the TG output level by using a power meter, is described below.
(1) Specifications
≤ ±2.25 dB(at output level 0 dBm, referenced to 100 MHz)
Output level flatness:
(2) Test instrument
•
•
Power meter:
Power sensor:
........................................................................................................................... ML4803A
........................................................................................................................... MA4601A
(3) Setup
MS2661N with Option 20
Analyzer
MS2661N Spectrum
100Hz–1.8GHz
Freq/Ampl
Marker
Remote
Entry
Shift
Multi Mkr
Menu On/Off
Preset
Frequency
Marker
Span
Marker
Peak
Search
F1
Local
F2
Amplitude
CF
Single
Measure
TG
Save
Recall
F5
Stby On
Display
A/B,A/BG
A/Time
A,B
Time
TV Monitor
Trig/Gate
F6
More
CE
Continuous
RLV
Copy
F4
BS
PTA
Define
7
8
4
Sound
1
RBW
Memory Card
Power meter
User
Peak
F3
Copy Cont
Coupled Finction
VBW Sweep Time Atten
Cal
0
5
System
2
Hold
9
6
dBm
dB
MHz
V
sec
kHz
mV
msec
Title
3
Interface Mem Card
.
GHz
–/+
Enter
Hz
TG Output 50Ω
300kHz–1.8GHz
RVS PWR
+20dBm
0V DC Max
TG Output
PM
Input
Power sensor
TG Output Level flatness Test
6-40
ML4803A
µV
µsec
RF Input 50Ω
+30dBm
0V DC Max
SECTION 6 PERFORMANCE TESTS
(4) Procedure
(a) Calibrating ML4803A Power Meter
Step
Procedure
1
Warm-up the ML4803A, then zero-adjust the ML4803A.
(Note: Don't connect anything to the power sensor.)
2
Connect the power sensor to the CAL OUTPUT of the ML4803A.
Press the [ON] key.
After conforming the measured value to be stabilized, press the [ADJ] key for calibration.
(b) Measuring TG output level accuracy
Step
Procedure
1
Press the [Preset] key, and then Preset All key.
2
Connect the power sensor to the TG Output.
3
Set the MS2661N as shown below:
Center Freq ------------------ 100 MHz
Span ------------------------- 10 MHz
4
Set the TG output level to 0 dBm, and ON.
5
Measure the TG output level with the power meter.
6
Changing the Center Freq of the MS2661N as shown in the table on the next page, repeat the
steps 3 to 5 above.
6-41
SECTION 6 PERFORMANCE TESTS
TG Output Level Flatness Test
Output level
(dBm)
Frequency(Hz)
100k
1M
10M
50M
100M
0
Error
6-42
0dB
(reference)
1G
1.8G
SECTION 6 PERFORMANCE TESTS
Service
If the MS2661N is damaged or does not operate as specified, contact your nearest Anritsu dealer or business
office for repair. When you request repair, provide the following information.
(a) Model name and serial number on rear panel
(b) Fault description
(c) Name of a personnel-in-charge and address for contact when fault confirmed or at a completion of repair
6-43
SECTION 6 PERFORMANCE TESTS
6-44 .
SECTION 7 STORAGE AND TRANSPORTATION
SECTION 7
STORAGE AND TRANSPORTATION
This section describes the long-term storage, repacking and transportation of the MS2661N as well as the regular care
procedures and the timing.
TABLE OF CONTENTS
Cleaning Cabinet .................................................................................................................................
7-3
Storage Precautions ............................................................................................................................
7-4
Precautions before storage .........................................................................................................
7-4
Recommended storage precautions ...........................................................................................
7-4
Repacking and Transportation ............................................................................................................
7-5
Repacking ...................................................................................................................................
7-5
Transportation .............................................................................................................................
7-5
7-1
SECTION 7 STORAGE AND TRANSPORTATION
(Blank)
7-2
SECTION 7 STORAGE AND TRANSPORTATION
SECTION 7
STORAGE AND TRANSPORTATION
Cleaning Cabinet
Always turn the MS2661N POWER switch OFF and disconnect the power plug from the ac power inlet before
cleaning the cabinet. To clean the external cabinet:
• Use a soft, dry cloth for wiping off.
• Use a cloth moistened with diluted neutral cleaning liquid if the instrument is very dirty or before long-term
storage.
After insuring that the cabinet has been thoroughly dried, use a soft, dry cloth for wiping off.
• If loose screws are found, tighten them with the appropriate tools.
CAUTION
Never use benzene, thinner, or alcohol to clean the external cabinet; it may damage the
coationg, or cause deformation or discoloration.
7-3
SECTION 7 STORAGE AND TRANSPORTATION
Storage Precautions
This paragraph describes the precautions to take for long-term storage of the MS2661N SPECTRUM
ANALYZER.
Precautions before storage
(1) Before storage, wipe dust, finger-marks, and other dirt off the MS2661N.
(2) Avoid storing the MS2661N where:
1) It may be exposed to direct sunlight or high dust levels.
2) It may be exposed to high humidity.
3) It may be exposed to active gases.
4) It may be exposed to extreme temperatures ( < – 40°C or > 71°C ) or high humidity ( ≥ 85% ).
(3) Remove the memory card from the slot, and store it separately from the main body.
Recommended storage precautions
The recommended storage conditions are as follows:
•
•
•
Temperature ................. 0 to 30˚C
Humidity ...................... 40% to 80%
Stable temperature and humidity over 24-hour period
Saving the setting parameter and data before storage
The MS2661N back-ups the internal data such as setting parameters with a built-in battery.
The battery life is about 7 years after shipment. If it is feared that the data may be lost because of the batterylife over; save the setting parameter to the memory card, or record them to re-use them after storage.
Early battery replacement is recommended.
7-4
SECTION 7 STORAGE AND TRANSPORTATION
Repacking and Transportation
The following precautions should be taken if the MS2661N must be returned to Anritsu Corporation for servicing.
Repacking
Use the original packing materials. If the MS2661N is packed in other materials, observe the following packing
procedure:
(1) When repacking, remove all the cables, and unplug the memory card from the slot.
(2) Wrap the MS2661N in a plastic sheet or similar material.
(3) Use a cardboard, wooden box, or aluminum case which allows shock-absorbent material to be inserted on
all sides of the equipment.
(4) Use enough shock-absorbent material to protect the MS2661N from shock during transportation and to
prevent it from moving in the container.
(5) Secure the container with packing straps, adhesive tape or bands.
Transportation
Do not subject the MS2661N to severe vibration during transport. It should be transported under the storage
conditions recommended in the previous page.
7-5
SECTION 7 STORAGE AND TRANSPORTATION
(Blank)
7-6.
APPENDIXES
APPENDIXES
TABLE OF CONTENTS
APPENDIX A FRONT AND REAR PANEL LAYOUT .........................................................................
A-1
APPENDIX B BLOCK DIAGRAM ........................................................................................................
B-1
App-i
APPENDIXES
(Blank)
App-ii .
APPENDIX A
APPENDIX A
FRONT AND REAR PANEL LAYOUT
This appendix shows the front and rear panel layouts.
A-1
APPENDIX A
(Blank)
A-2
A-3
A-4
(Blank)
A-5
A-6.
(Blank)
APPENDIX B
APPENDIX B
BLOCK DIAGRAM
This appendix shows the Block Diagram of the MS2661N.
B-1
APPENDIX B
(Blank)
B-2
B-3
B-4
(Blank)
B-5
B-6
(Blank)
B-7
B-8
(Blank)
B-9
B-10 .
(Blank)