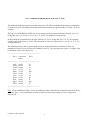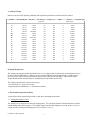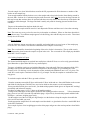
1
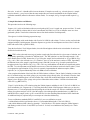
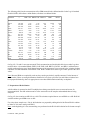
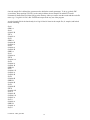
Chemistry Lab Cookbook
ICP Hard Rock Analysis v 210.0
Instrument:
Jobin Yvon Ultra-Ace 2000
ODP #: 05669
Model #: TX-TF722
Website:
http://www.jyemission.com/
Software:
Jobin Yvon Proprietary, V 5.10
Documentation Available:
Document Name/Title/Number
ICP Installation/Setup Binder
Source
Type
Associated
Instrument(s)
Associated
Measurement(s)
Jobin
Yvon
Jobin
Yvon
hardware
ICP
elemental analysis
hardware,
software
ICP
elemental analysis
scientific
journals
Jobin
Yvon
data
ICP
elemental analysis
software
ICP
elemental analysis
ICP Standards Cert./MSDS Binder
misc.
data
ICP
elemental analysis
ICP Technotes, Software Notes, Concepts,
Spreadsheets, Etc. Binder
in-house
hardware,
software,
data, reprints
ICP
elemental analysis
JY Service Manual
Jobin
Yvon
hardware
ICP
elemental analysis
ICP Instrument Manuals Binder (Final Control
Report; User Manual; Image NavigatorUser
Manual; Sampler AS421 User's Manual;
Schematics)
ICP Reprints Binder
ICP Software V5.1 Binder (User Manual)
Cookbook –Chem_ICP HR
1
ICP COOKBOOK FOR HARD ROCK ANALYSIS (V. 210.0)
This cookbook details the analytical procedure used on the ICP-AES to determine the geochemical composition
of basalt on Leg 192. All software instructions listed in this cookbook are applicable only to Version 4 of the JY
software.
The Leg 192 method (BAS192. MTD) was used to analyze the following major and trace elements: Al, Ca, Fe,
K, Mg, Mn, Na, P, Si, Ti, Ba, Cr, Ni, Sc, Sr, V, Y, and Zr (Cu and Zn were not analyzed).
In this method, the concentrations of the major elements (Al, Ca, Fe, K, Mg, Mn, Na, P, Si, Ti ) are reported in
weight % units of the oxide (e.g., SiO2). The concentrations of the trace elements (Ba, Cr, Ni, Sc, Sr, V, Y, Zr)
are reported in ppm.
The following table provides conversion factors between oxide and elemental concentrations (These are
multiplicative factors; to convert SiO2 to Si, multiply by 0.4675). The conversion from "ppm" to "weight % (part
per hundred)" involves division by 104.
________________________________________
Wt.%
Conversion
Wt.%
Factor
________________________________________
SiO2 0.4675
Si
Al2O3 0.5293
Al
Fe2O3 0.6994
Fe
FeO
0.7773
Fe
MnO 0.7745
Mn
TiO2 0.5995
Ti
CaO 0.7143
Ca
Na2O 0.7419
Na
K2O 0.8301
K
MgO 0.6030
Mg
P2O5 0.4365
P
________________________________________
Note: All units and dilution factors of rocks and sediments (that is, materials that are initially solid) are given on a
"per mass" basis. Acid concentrations in analyte solutions are given in percentage (%) units, as opposed to
molarity (M).
Cookbook –Chem_ICP HR
2
A. Analytical Setup
Below are the ICP-AES operating conditions and acquisition parameters used in the BAS192 method.
Standard:
Al
Ca
Fe
K
Mg
Mn
Na
P
Si
Ti
Ba
Cr
Ni
Sc
Sr
V
Y
Zr
Wavelength (nm)
396.15
393.37
259.94
766.49
285.213
257.61
589.592
178.229
251.611
334.941
455.40
267.716
231.604
361.384
407.771
292.402
371.03
343.823
Slit (nm)
20/16
20/16
20/16
20/16Alk
20/16
20/16
20/16 Alk
20/16
20/51
20/16
20/16
20/16
20/16
20/16
20/16
20/16
20/16
20/16
Int. Time (s)
per point
0.5
0.5
4.0
0.5
4.0
4.0
0.5
0.5
0.5
0.5
4.0
4.0
0.5
4.0
0.5
4.0
4.0
0.5
Voltage (V)
Mode
731
351
732
993
553
643
632
933
612
651
622
993
990
753
572
993
693
673
Inc. Bet.
Points (nm)
2
2
5
2
5
5
2
2
2
2
5
5
2
5
2
5
5
2
Calculation (pts)
0.027
0.018
0.002
0.0022
0.0022
0.002
0.0021
0.0018
0.002
0.0018
0.025
0.019
0.0021
0.0018
0.0026
0.0021
0.0027
0.0018
B. Sample Preparation
The sample preparation procedure described below is very similar to that used previously on-board the Resolution
for major-element XRF analysis. Whereas in major-element XRF fused glass beads served as a solid target for
the X-ray beam, in the ICP-ES preparation the glass beads are dissolved in 10% HNO3. This solution is then
further diluted and the resultant analyte is subsequently introduced into the ICP-AES.
The sample preparation thus consists of two steps:
rock flux-fusion (i.e., from rock to bead);
sample dissolution and dilution (i.e., from bead to solution)
1. Flux-Fusion Preparation of Rocks
A typical flux-fusion preparation procedure is quite time consuming and includes:
1. 1. Cutting the Samples to Size
The samples are cut using the saw near the sampling table. The saw blade should be cleaned with the hose before
starting cutting and between samples. The original sample size should be adequate to provide at least 10-15 g of
sample after the cleaning and crushing process (see sections 1.2 to 1.6).
Cookbook –Chem_ICP HR
3
5
5
1
5
1
1
5
5
5
5
1
1
1
1
5
1
1
5
The sample size is chosen in function of its ability to fit in the X-press and its hardness. Rock pieces have to be
cut to a size that can be crushed in the X-Press, generally less than 1 cm thick. If the pieces are cut too small, it
will take longer to clean and sample material will be lost unnecessarily. If the pieces are cut too big, they can
explode in the X-Press and the sample will be ruined. Also, the sample should not be cut in too irregular a shape;
when being crushed the sample needs to fit nicely in-between the two Delron disks of the X-press (see section
1.5).
Hard material must be cut in relatively small pieces. Soft (weathered) basalt or sediment can be cut in larger
pieces. It is better to initially cut the first samples on the small side until one gets a feel for the relative hardness
from having crushed a few.
The objective of the hard rock analysis is to get at whole rock geochemistry of the basalt. Therefore, veins,
infilled vugs and the like are usually not desirable in the sample. If cutting the sample reveals features that the
scientists are not aware of, the petrologist(s) responsible for selecting the samples needs to be contacted to decide
whether to remove this material, keep the sample, or select a better sample.
1. 2. Cleaning Samples on Diamond Wheel
After the samples have been cut, their surfaces are cleaned by grinding them on a high-speed, diamondimpregnated disk (≈70 µm grit) to remove saw marks, coring bit marks, or any other unwanted material such as
surface alteration.
This step is done on the lapping wheel in the Thin Section Lab. The thin section grinding wheel is removed and a
8" grinding wheel is put in place. A spare 8" grinding wheel and discs are stored in the ICP Preparation Lab.
For most samples, it is best to start with the sandpaper and finish with the diamond-impregnated disk. The
diamond disk is put on the wheel with the sandpaper on top of it .The aluminum ring will have to be to used to
hold the sandpaper in place.
To clean the samples on the wheel, proceed as follows:
Turn the water on with enough flow to clean the wheel, but not full force;
Start the wheel on low speed until you get the hang of it and then increase the speed to the higher setting;
Take off all the corners and edges of the sample first. Gloves are not necessary for this step;
Hold the sample against the wheel and take off any and all surfaces that could have come in contact with a saw
blade, the bit or the core barrel, or any altered surface; and
Clean all the pieces with the sandpaper, then take the sandpaper and the aluminum ring off for the final cleaning
with the diamond disk. Move the sample back and forth across the wheel. Do not just hold it in one place and
wear out a single groove of the diamond disk.
The samples are taken back down to the Foc’sle deck for the next step of preparation.
1. 3. Cleaning Samples in Methanol/DI
After the sample surfaces have been cleaned, the rock chips are washed in alcohol (methanol) or acetone to
remove contaminants such as oils from the skin and residue from the previous cleaning step. After this step,
gloves will have to be worn for all the following steps.
To clean the samples in Methanol/DI, proceed as follows:
Cookbook –Chem_ICP HR
4
Put each sample in a clean 200 ml beakers stored in the ICP preparation lab. Write the name or number of the
beaker on each sample bag;
Pour enough methanol into the beakers to cover the samples and to keep it (the beaker) from floating around in
the sonic bath. Sonicate for 15 minutes using the small clean sonic bath; Note: Do not use the large sonicator for
this step because that sonicator has to be operated with the water only about 1 inch from the top of the bath or the
transducers will be damaged. The large sonic bath is usually only used for cleaning glassware and the Pt/Au
crucibles.
Dispose of the methanol into the fume hood sink; and
Rinse/sonicate the sample with DI water for 10mn. Repeat the DI rinse until the water is clear after sonicating.
Note: The water may never go clear for some clay-rich samples or sediments. If three or four times doesn't do it,
go to the next step. If a sediment sample appears to be dissolving, rinse with DI only once or twice. Three times
usually does it for basalts.
1. 4. Drying Samples
After the final rinse, decant as much water as possible, and put the beakers on a tray in one of the sample prep
ovens at 110°C for 12 hours. Note the time at which that set of samples went in to dry.
Note: The oven should be cleaned at the beginning of the cruise, before it is turned on. The top of the oven in
particular must be clean because the samples are open in the oven. The oven used for ICP sample prep should be
used ONLY for ICP samples.
1.5. Crushing Samples in X-press
The cleaned and dried samples are crushed into small pieces with the X-Press so as to be easily ground with the
Spex Shatterbox (or Spex Mixer Mill for very small samples).
Two types of grinding vessels are used with the Shatterbox: large and small. If the large tungsten carbide (WC)
grinding vessel is used, the minimum amount of sample has to exceed roughly 30 g or cracking the vessel
becomes a risk. For the large vessel, the samples are thus crushed in the Shatterbox into 1/4 to 3/8" pieces. The
small WC vessels require a minimum of about 10-15 g of sample. For this, the samples are crushed into 3mm
long pieces.
To crush the samples with the X-Press, proceed as follows:
Clean the countertop around the X-Press and clean the X-Press inside and out. Start with Windex on the counter
and finish all with propanol. DO NOT have any food or drinks on the counter to avoid contamination;
Put on powderless nitrile gloves and "wash" your hands with propanol with the gloves on. Repeat this "washing"
periodically and in-between samples;
Put sheets of white paper (11.5 x 17) down on all working surfaces;
Arrange on the white paper all the supplies needed for the crushing procedure: tweezers,
X-Press aluminum
plug, pieces of core liner, clear end caps and Delrin plugs-- all previously cleaned with propanol and dried with
Kimwipes--, and some weighing paper (6x6);
Get the samples out of the oven and put a big Kimwipe over the beakers to keep the samples clean while the
rocks cool off and while you work;
Put the appropriate sample labels for each sample on acid-washed 1-oz glass bottles. Put also a small ODP label
on the lid of each bottle.
Put a couple of pieces of 6x6 weighing paper on the white paper and get one clean end cap and two clean Delrin
plugs;
Cookbook –Chem_ICP HR
5
Put one of the Delron plug in the end cap and arrange one or more pieces of the sample on the plug. Balance the
other plug on the sample pieces. Carefully slip the piece of core liner into the end cap. It need not go all the way
in. Leave it as loose as possible so you won't have trouble removing it. Then put the aluminum plug carefully
into the core liner on top of the Delron plugs;
Pick up the whole thing, being careful to support the end cap from the bottom so the sample cannot fall out; Open
the X-Press door and put the sample in the center round plate of the X-Press. Keeping the aluminum shaft as
vertical as possible, tighten the knob on top until the aluminum shaft is secure. This does not have to be tight, just
snug;
Close the plastic door and the valve on the right side of the X-Press;
Note: The X-Press has a safety interlock and it will not operate unless the door is closed. Always stand off to the
side of the X-Press, so your body is not in line with the hydraulic gauge, the most likely place for the Shatterbox
to give.
Push the switch down to raise the piston. A "growling" sound will be heard;
Bring the pressure around 5 or 6 tons. Sometimes it may take a few minutes for a sample to crack. Leave it on 5
or 6 for a while, maybe even 5 minutes;
Watch the gauge attentively as the Delron plugs will break above 6 tons, sometimes in an explosive way.
Around 10+ tons, an explosion in the X-Press is likely. The sample will be blown out of the core liner and spread
around inside the press.Take your time and go slowly.
If the sample does not crack, take the assembly apart and rearrange the sample pieces. If the sample still does not
crack, try letting off the pressure suddenly and then running it back up. The crack sometimes comes on the
decompression.
Many times, the assembly has to be taken apart and the pieces that are small enough removed;
Dump the small pieces and powder onto one of the 6x6 sheets of weighing paper and pour the material into the
correctly labeled bottle. Then rearrange the remaining large pieces on the Delron plug and reassemble the whole
business to crush everything again.
Note: This will have to be done half a dozen times or so for an "average" sample. If the material is relatively soft,
one or two crushes will be enough. A large, very hard sample may take many more tries. If the end caps or
Delron plug crack, get new ones. It will break under very little pressure the next time first place.
When all the samples have been crushed, wash and scrub the beakers with a test tube brush and rinse them
thoroughly with DI water. Put them in the oven to dry. The beakers are presently stored in boxes in the cabinet
under the bead sampler at present.
1. 6. Grinding Sample in Shatterbox
After the samples have been crushed, they are ground into a very fine powder and homogenized. The grinding is
done with the Shatterbox equipped with tungsten carbide (WC) grinding vessels. If possible, the entire sample
should be ground together, in a single grinding vessel to achieve complete homogenization.
Note: Use the tungsten carbide vessels only, the steel ones will provide numerous contaminating elements that the
scientists will not like. Grinding should not be done in rough seas, particularly if underway. The small grinding
vessels in particular are subject to chipping or cracking if the ship’s movement is excessive. If it is a rough
weather cruise, take a larger sample than usual so that the large grinding vessel can be used, though it still cannot
be used in very rough seas. The small vessels are easier to handle, so use them whenever possible.
To grind the samples using the Shatterbox, proceed as follows:
Transfer the sample pieces to the grinding vessel by pouring in enough sample to make a small talus slope, 1/2 to
Cookbook –Chem_ICP HR
6
2/3 of the way up the side of the vessel. Do this on both sides of the ring in the large vessel. Don not spread the
sample around. If any pieces are on top of the puck or ring, use plastic gloves, tongs, or clean paper to move the
sample into the cavity;
Replace the lid to the vessel and carefully place the whole assembly in the Shatterbox. The large vessel sits
directly in the shatterbox. The small vessels sit on a plate with pins in it. If only one vessel is used, place it on
the center pin of the mounting plate. If two vessels are to be used, add the third vessel with no puck in it. You
cannot run either one or two vessels on the outer pins or the Shatterbox will be out of balance and this can cause
much damage;
Put the rubber pad and the top plate on top of the grinding vessel(s);
Bring the safety arm over the top of the vessel (centering the plate beneath the arm's centering bracket) and fasten
it securely by tightening the knob almost as hard as can be by hand. Use the special tool to finish tightening the
nut;
Set the timer to 5 minutes (this timer is approximate) and turn the switch on;
Adjust the speed knob (on the left) slowly up until the Shatterbox shakes smoothly. If it makes any bad noises
(metal-to-metal sounds), shut it off and find out what is wrong;
When the proper speed is achieved, set a timer to 60-90 seconds for the large grinding vessel and about 3mn for
the small vessel;
When the time is up, flip the switch off and dial the speed back down to zero;
Wait for the Shatterbox to quit rocking, open the lid, and use the tool to loosen the knob on the safety arm while
holding the spring catch down;
Flip the arm back and remove the grinding vessel(s) and put them on a Kimtowel or a piece of white paper;
Open the grinding vessel. If the resulting powder feels like talcum powder on the skin (apply some on the
forearm with tweezers), it is fine enough. If the powder feels "gritty", the sample needs to be to ground a little
longer;
Use a clean piece of weighing paper or the teflon spatula to clean off the powder from the top surface of the puck
and ring. Using plastic gloves or clean paper towels, carefully disassemble the vessel, putting the puck, ring, and
O-ring on the inverted lid.
Carefully pour the powder from the vessel onto clean paper. If any powder remains behind (in the bottom
corner), use a clean plastic spatula to dislodge it.
Transfer the powder to the correct pre-labeled sample bottle. If multiple batches of the same sample are ground
(i.e., coarse-grained rocks or inter-laboratory standards), transfer the powder to a labeled Ziploc bag and
homogenize it as needed.
The grinding vessels need to be clean from sample to sample. Wearing acetone-resistant gloves, the individual
pieces of the grinding vessel(s) are washed with DI water and a small piece of a scouring pad (no soap) and rinsed
several times with acetone. Let the pieces dry on a Kimwipe. The O-ring on the large grinding vessel is washed
with water and dried with a paper towel (no acetone).
Note: Do not blow dry with compressed air as ship’s air is dirty. The lid is particularly vulnerable to surface rust
if it is not dried quickly and thoroughly. Parts of the small grinding vessels are a set and the lids and pucks should
not be intermixed.
1. 7. Determining Loss on Ignition (LOI)
For igneous rock analysis on the ICP, it is most common to use ignited samples as the final analysis includes a
determination of LOI. The petrologists use the LOI as an indication of how fresh the basalt is. Low LOI values
suggest relatively fresh, unaltered basalt. High LOI numbers suggest a lot of clay in the sample which is an
alteration product.
The LOI of a sample is determined by weighing a small amount of the sample (about 1 gram) before and after
ignition at 1025°C for 4 hours. Usually the sample loses weight as water is driven off, though an iron-rich, water-
Cookbook –Chem_ICP HR
7
poor sample may gain weight.
Determination of the LOI of a sample comprises three steps: pre-ignition weighing, ignition, post-ignition
weighing.
All the LOI calculations are saved on a LOI form (saved in the LOI folder on MC 5259
(ChemTechOnly/Cookbooks/ICP/ICP Hard Rock (in House)).
• Pre-ignition weighing is performed as follows:
Load the appropriate calibration file for LOI weighing on the Scientech balance and make sure the filter function
is selected;
Put a 15 g weigh (using the weighing tongs) on both the known and unknown pads and click on the tare function.
Wait for 50-75 counts for the filter to act and then hit the trim function;
Halt the tare process when the curve flattens out. Use weighing "by counts" and set it at 1000 or so. Click on
Weigh and if the weight comes out pretty close to zero (0.00025mg in smooth seas or 0.00050 mg in rough seas),
the tare is good. If not start over;
Take a small, clean, fused-quartz crucible out of the desiccator and place it on the unknown pan of the balance.
Use tongs or gloved fingers only. Record the number of the crucible on a blank LOI form;
Note: The large crucibles are too heavy for the balance. Use them only as "holders" for the small ones so they do
not fall over in the desiccator rack.
Put a 10 g weight on the known pan and click on Weigh. Wait 50-75 counts and hit trim;
When the weighing is done, add the resulting weight to 10 g to get an approximate weight of the crucible. Round
that value to use it as the counter weight for that crucible (record as Counter Weight on the LOI sheet). For
example, if you get a crucible weight of 4.765 with a 10 g on the known pad, it means that the crucible actually
weighs 14.765 g. Record 14.500 g as Counter Weight on the LOI sheet;
Once the counter weight is selected, put this amount of weight on the known pad (14.5 g) and reweigh the
crucible. Record the sum of the counter weight and this new weight as Crucible Weight on the LOI sheet. The
difference between the counter weight and the crucible weight is called the delta weight and is also recorded in
the LOI sheet. For example, if you used a counter weight of 14.5 g, and then weighed the crucible and got a
weight of .265 g, this .265 weight is recorded directly in the LOI sheet as the Delta Weight;
If the amount of sample you want to weigh is 1 g, add 1 g to your counter weight on the known pan (your new
counter weight is now 15.500 grams in the above example);
Leave the crucible on the unknown pan and carefully transfer about a gram of powder into the crucible (use a
spatula to do this). Weigh the sample until the weight is approximately equal to the delta weight (the weight
shown will be about .265 grams for the above example). When it is done, you will have 1 g of powder in the
crucible. Weigh a few times and record the final weight of the crucible with the sample on the LOI sheet and
calculate the actual sample weight;
Put the small crucible in one of the big ones, put a lid on it and leave it on a rack in the desiccator until you are
ready to ignite a set of samples.
Note: It is not critical that the weight be exactly 1 grams or whatever your target weight is. It is only important to
know with some precision what it does weigh. 1.050 g is fine, 1.500 g is not.
• Ignition of the sample in done in the Chem Lab ashing furnace. Basalts are ignited for 4 or 5 hrs at 1025°C.
To ignite the samples, proceed as follows:
Set up the furnace temperature programming;
Put the samples in the furnace before the program starts;
Cookbook –Chem_ICP HR
8
Press Run twice to start the program.
Copies of various programs are listed on a bulldog clip near the furnace (in the Chem Lab) or the Ashing Furnace
folder in the file drawer next to the XRD in the Microbiology Lab. The Fisher furnace cannot keep up with ramp
rate of 25°C per minute.When the program calculates that it is at the desired soak temperature, it does not check
to see if it made it, and begins the countdown regardless of whether or not the temperature is as it should be. A
rate of 3°C per minute to go to 1000°C avoids this problem. This temperature is held for one hour before being
ramped up to 1025°C to be held again for four hours. This whole program takes about 12 hours.
Remove the crucibles when they are cool enough, ideally between about 50°C to 200°C. Use the special handle
to pick up the rack. Store the rack in the desiccator until you are ready to weigh for LOI and make the beads.
This should be done as soon as practical so the sample does not rehydrate.
Note: For sediments (or Si-rich material), the samples are ignited around 900°C. If the samples contain muscovite,
biotite, amphibole, or carbonates, ignite the samples for 6 hours or more.
• Post-ignition weighing
This is a quick, simple step that should be done as soon as possible after the samples come out of the furnace.
The idea is to re-weigh the crucible with the ignited sample in it to determine how much weight the sample has
gained or lost. The procedure is the same as in the pre-ignition LOI weighing step.
In summary, tare the balance with 15 g on each pan and then put the appropriate counter weight on the unknown.
Use the second counterweight (the higher of the two) that you used when the sample was in the crucible before
ignition. Put the crucible with the sample in it on the unknown pan. Weight it and finish filling out the LOI sheet
for the particular sample. Again, the weight should come out to be less than 500 mg if you have the correct
counter weight. Occasionally the sample may lose so much weight that you have to reduce the counter weight by
500 mg to avoid coming up with a negative number, but it does not happen that often with basalts.
The formula used to calculate the LOI is:
%LOI = 100*(weight change during ignition) / (fresh sample weight)
LOI calculations can either be made using the LOI forms, or the weights can be entered in the "LOI Short Calc"
worksheet and the percent LOI will be automatically calculated. The original of this spreadsheet is saved in the
LOI folder on MC 5259 (ChemTechOnly/Cookbooks/ICP/ICP Hard Rock (in House).
Note: By convention, weight lost during ignition is typically recorded as a positive LOI value, whereas weight
gained is recorded as a negative LOI value. The result are given to two decimal places.
• Cleaning the Crucibles
The crucibles are cleaned by washing them first with DI water and a small piece of a scouring pad (no soap) and
rinsing them several times with DI water. The crucibles are then acid-washed in a 10% HNO3 bath overnight.
After a final rinse with DI water (rinse three times), the crucibles are dried in the oven at a max of 60°C.
1. 8. Making Sample Beads
In this step, 100mg of the ignited sample powder is weighed and is added to a vial containing lithium metaborate
flux that is pre-weighed on shore to 400mg. This is then fused to make a glass bead that is dissolved in nitric acid
and the resulting fluid analyzed. This is a fairly critical step. The weight should be as close to 100mg as possible.
Cookbook –Chem_ICP HR
9
Inaccuracies in the weight will show up in the analytical results.
Making a sample bead includes two steps: weighing the samples to make the beads and fusing the beads.
To weigh the sample for bead making, proceed as follows:
Clean the countertop around the balance and the balance pans. Put sheets of white paper on all the working
surfaces;
Arrange on the white paper all the supplies needed for the weighing procedure: tweezers, weighing paper (2x2)
and mg calibration weighing set. For each sample, have ready one bottle of pre-weighed flux and one new, empty,
acid-washed vial to put the extra ignited powder in. Pre-label the bottles ahead of time (one each on the cap and
the bottle);
Load the appropriate calibration file for bead weighing on the Scientech balance and make sure the filter function
is selected;
Put the 100 and 200 mg weights from the calibration set on the known pan;
Fold a small (2x2) weighing paper into four quadrants and smooth it out again to make a nice little "cup." Put it
on the unknown pan in a stable position and put a 100 mg weight on the paper;
Close the door of the balance and tare (remembering to trim the date after 50-75 counts).
While taring, clean the small agate mortar and pestle with propanol and a Kimwipe;
Remove a crucible of ignited powder from the desiccator. Find the LOI sheet for that to see which sample you
are working on.Transfer the ignited sample from the crucible to the clean agate mortar by dumping the powder
out gently and grind the sample to a fine powder;
When the taring and grinding is done, remove the 100 mg weight from the paper on the unknown pan;
Transfer a bit of the ground ignited powder onto the weighing paper with a clean spatula (rinse with propanol.
The idea is to replace the 100 mg weight with 100 mg of sample, so the ideal final weight will be zero;
Weigh it a few times putting more sample on or taking it off until you get it close, say within a few mg;
At this point, close the door and weigh until you have a reproducible weight that is at least within 0.00050 of
zero (half a milligram);
- When the sample weight is as close to 100 mg as you can get it (i.e. 0.0995-0.1005 g is OK), open the prelabeled bottle with the pre-weighed flux in it and, ever-so-carefully, pick up the paper with the sample powder on
it and transfer the powder into the bottle containing the flux. Snap the paper a few times with a flick of your
index finger to make sure everything goes in;
Homogenize the sample/flux mixture by holding the vial slightly off of vertical and rotating it. Tap it from time
to time on the bench top as you rotate it to clear any powder from the sides of the vial. Avoid getting the
sample/flux powder stuck around the cap.
To make a sample bead, proceed as follows:
Once the sample is weighed and homogenized, pour the powder mix into a Pt-Au crucible;
Pipet 10 µl of 0.172 mM LiBr wetting agent (0.15 mg of ultrapure LiBr into 10 ml of DI) into the sample
powder;
Fuse at 1050ºC for 10-12 min. The Sample Bead Maker should have Fuse 1 set at 120 seconds, Fuse 2 set at 90
seconds, and Agit set at 120 seconds. The sample is heated in two stages - Stage 1 at 700ºC for two minutes, then
at 1050ºC for one and a half minutes, followed by agitation at 1050ºC for two minutes;
Remove the platinum crucible as soon as the monitor shows no current (a setting of <20). With the platinumtipped tongs, lift out the crucible and swirl the contents around to get all the sample in one bead. Place the
crucible on its cooling seat for at least three minutes.
Let bead cool and solidify in the bottom of the crucible;
When cool, pop the bead off the crucible. A sharp "whack" squarely on the hard desktop facilitates release.
Note: The most critical aspect of this step of the sample preparation is the need to maintain a constant sample-to-
Cookbook –Chem_ICP HR
10
flux ratio. A ratio of 1:4 should suffice in most situations. If samples are small (e.g., volcanic glasses), a sample
mass less then 0.1 g may be used, but the same sample:flux ratio must be maintained for the samples and the
calibration standards (otherwise the matrix will not match). For example, 0.05 g of sample would require 0.2 g
flux.
2. Sample Dissolution and Dilution
This procedure involves the following steps:
Prepare a 10% nitric acid solution with trace metal grade acid. For an 11 sample run, prepare two liters. To make
a liter of 10% HNO3 solution, add 143 ml of concentrated 70% HNO3 to 857 ml of nanopure water in a clean
graduated cylinder. Transfer the solution into the one liter bottle with the 25ml dispensette;
Wear gloves for all the following preparation steps;
Fill 125ml Nalgene wide mouth bottles with 50 ml of 10% HNO3 acid solution. To do so, use the one liter bottle
equipped with the 25ml dispensette. Prime the dispenser to get rid of air and dispense two times 25ml. Label the
bottle with suffix .DIS (e.g BHVO2.DIS);
Drop the bead in the 125 ml Nalgene bottles, close the lid and agitate with the wrist-action shaker for an hour to
dissolve the bead in the acid;
Note: “TDS" refers to the total mass (mg) of powder (sample plus flux) dissolved in a given mass of solution, and
is commonly quantified as a function of "dilution factor". The .DIS solution is at what is broadly termed a "100fold" dilution factor for TDS, because the 0.5 g of "flux plus sample" has been dissolved in ~50 g of HNO3 (50g /
0.5g = 100). This is also referred to as a "1% solution", since 1% of the total mass consists of TDS. Importantly,
the dilution factor of the sample is significantly greater (500-fold), because 0.1 g of sample powder has been
brought up in the 50 g of HNO3 (50g / 0.1g = 500). The very small addition of LiBr does not significantly add to
the TDS. It is also important to note that the exact masses of the acid solutions need not be known (that is, 50 ml
is an appropriate approximation of 50 g), but it is extremely important that the unknown samples, blanks,
replicates, etc., be prepared identically to the rock SRMs used for calibration.
After complete dissolution of the bead, filter all .DIS solutions as follows. Extract 20ml of solution at a time from
the 125 ml bottle using a new 20ml syringe (you can put the syringe directly in the 125 ml bottle). Filter the 20ml
of solution extracted through an 0.45 mm Acrodisc into a clean acid washed 60ml Nalgene wide mouth bottle.
Repeat 2 times. Dispose of the syringe after you have filtered the entire solution. Label the 60 ml bottle with
suffix .FIL (e.g BHVO2.FIL);
Pipet 2.5 ml of the above .FIL solution (using the 2500ml pipetter) and dilute it with 17.5 ml of 10% HNO3 in a
20 ml scintillation vial. Dispense the 17.5 ml using the bottle with the 25ml Dipensette. Make sure you have the
dispenser set to 17.5 ml and primed before dispensing the acid in the sample vial. Fill two scintillation vials in this
manner for replicate analysis on ICP. Label the samples vials with appropriate standard name ((e.g BHVO2-A
and BHVO2-B) or sample code (e.g. 1R3-A and 1R3-B). Save the remaining filtered solution in the 60ml bottle
for additional analysis, replicate analysis or transport to a shorebased laboratory;
For two calibrations standards (BHVO-2 and BCR-2), two sets of dilution are used:
• a 4000x dilution which is performed as above (2.5 ml standard diluted with 17.5ml 10% HNO3);
• and a 6000x dilution which is done by pipetting 1.7 ml of the above .FIL solution (using the 2500ml pipetter)
and diluting it with 18.50 ml of 10% HNO3 (to a total of 20.2 ml) in a scintillation vial (actually it is a 5942x
dilution);
Cookbook –Chem_ICP HR
11
Make sure you also make an analytical blank that is prepared identically to the samples, with the exception that
only 0.4 g of flux is fused and dissolved. An additional 0.1 g of flux is not added to mimic the TDS of the 0.5 g
mix of "sample plus flux" because to do so would provide an inaccurate quantification of the impurities of the
amount of flux used in preparation of the unknowns.
Note: After a period of time, flux-fusion solutions become unstable with the result that the major and trace
elements precipitate out of solution or a gel forms. The gel is not immediately visible (since it is clear), so
solutions must be visually inspected prior to being analyzed. When a solution becomes unstable, it must be
discarded because the gel will strip dissolved trace metals from the analyte. The stability of a solution is
proportional to the dilution factor and acid content, and is inversely proportional to the SiO2 content. That is, a
dilute solution is more stable than a concentrated one. A solution with a 10% HNO3 matrix is also more stable
than one prepared at 1% HNO3. Finally, a flux-fusion solution resulting from the dissolution of a diatomaceous
ooze or rhyolite (both enriched in SiO2), is likely to be more unstable than a basalt or shale solution.
B. Calibration Standards
ICP-AES is a comparative analytical technique, in that the machine’s response (measured in "counts") needs to be
calibrated against standards in which the concentrations of the various elements are known. For rock analysis,
calibration is best achieved through comparison to internationally recognized and approved Standard Reference
Materials (SRMs).
For basalts, robust and linear calibrations can be achieved with a blank (CALIB0) and five SRMs (DNC-1, BIR-1,
BHVO-2, W-2, and BCR-2). Additional well-characterized rocks (although not formal SRMs) that can be used to
check the results include K1919 and BAS140. See table below for the recommended values for these 7 SRMs.
Standard:
Reference:
DNC-1
1
BCR-2
3
BIR-1
1
W-2
1
BHVO-2
3
K1919
2
BAS140
4
(Wt%)
SiO2
TiO2
Al2O3
Fe2O3
MnO
MgO
CaO
Na2O
K2O
P 2O5
Total
47.04
0.48
18.30
9.93
0.149
10.05
11.27
1.87
0.229
0.085
99.40
54.10
2.26
13.50
13.80
0.24
3.59
7.12
3.16
1.79
0.350
99.91
47.77
0.96
15.35
11.26
0.171
9.68
13.24
1.75
0.027
0.046
100.25
52.68
1.06
15.45
10.83
0.167
6.37
10.86
2.2
0.627
0.140
100.38
49.85
2.73
13.53
12.34
0.2
7.23
11.43
2.22
0.52
0.270
100.32
49.70
2.81
13.85
12.16
0.167
6.93
11.18
2.34
0.59
0.270
100.01
50.50
0.98
14.60
11.10
0.19
8.15
12.4
1.84
0.01
0.080
99.85
(ppm)
Ba
Sr
Ni
Cr
Sc
Y
Zn
V
Cu
Zr
114
145
247
285
35
18
66
148
96
41
683
346
20
18
33
37
127
416
19
188
7
108
166
382
44
16
71
313
126
16
170
190
70
92
37
23
80
260
110
100
130
389
119
280
32
26
103
317
127
172
139
392
102
244
33
28
102
0.8
45
84
175
40
26
76
331
83
45
Cookbook –Chem_ICP HR
12
181
The following table lists the concentrations of the SRMs entered in the calibration table for the Leg 192 method
(BAS192.MTD). 6K indicate a 6000 dilution, all others were diluted 4000x:
Standards:
P2O5
Zn
Ni
SiO2
MnO
Fe2O3
Cr
MgO
V
Cu
TiO2
Zr
Sc
Y
CaO
Al2O3
Sr
Ba
Na2O
K2O
l
178.229
213.856
231.604
251.611
257.61
259.94
267.716
285.213
292.402
324.754
334.941
343.823
361.384
371.03
393.37
396.15
407.771
455.40
589.592
766.49
BCR-2 6K BHVO-2 6K BHVO-2
0.12
46.58
53.82
22.54
0.09
5.58
126.63
3.27
143.36
57.44
1.23
77.79
14.47
11.76
5.17
6.12
175.93
58.79
1.00
0.24
0.18
69.27
80.03
33.52
0.13
8.30
188.30
4.86
213.18
85.41
1.84
115.67
21.52
17.48
7.69
9.10
261.60
87.42
1.49
0.35
0.27
103
119
49.85
0.2
12.34
280
7.23
317
127
2.73
172
32
26
11.43
13.53
389
130
2.22
0.52
BIR-1
0.046
71
166
47.77
0.171
11.26
382
9.68
313
126
0.96
16
44
16
13.24
15.35
108
7
1.75
0.027
BCR-2
0.35
127
20
54.1
0.24
13.8
18
3.59
416
19
2.26
188
33
37
7.12
13.5
346
683
3.16
1.79
On Leg 192, Zn and Cu were not measured. Their concentrations are listed in this table in case other Legs have
need for them. A six standard (Blank, BHVO-2-6K, BCR-2-6K, BHVO-2, BCR-2, and BIR-1) calibration was
usually performed every run to check the performance of the instrument. It was not used by the scientists for data
reduction. The 6000X dilution of the BHVO-2 and BCR-2 standards was done to get a better spread of the silica
values.
Note: Because SRMs are required for each run, they tend to get relatively rapidly consumed. In the interest of
conservation, if there are enough calibration solutions left over from a previous run, and if these solutions have
been prepared identically, then it is appropriate to reuse those SRM solutions until they are depleted.
C. Preparation of Drift Solution
A drift solution is measured on the ICP multiple times during an analytical run to account and correct for
instrumental drift. The drift solution must be of the same matrix as the samples and standards that are being
analyzed.
On Leg 192, the scientists used K1919 as a drift. The scientists required that we use an SRMs as a drift. BAS140
would be another good SRM to use as drift.
For a forty-three sample run, a 320 ml drift solution was prepared by adding 40ml of the filtered K1919 solution
to 280ml of 10% trace metal grade HNO3.
Note: At the beginning of a run, autosearching was performed on the K1919 drift solution for all element except P
Cookbook –Chem_ICP HR
13
which was autosearched in a single element P solution. A profile was done on K1919 at the beginning and the end
of the run (see section G.1 and G.3).
D. Preparation of Rinse Solution (Rinse Time)
It is necessary between each standard and each sample to rinse out the sample uptake tubing and torch glassware
from any carryover from the previous standard or sample. Rinsing also helps combat clogging of the nebulizer.
For the LiBO2 matrix, a 10% HNO3 solution works very well. To make a liter of 10% HNO3
rinse solution, add 143 ml of concentrated trace metal grade 70% HNO3 to 857 ml of nanopure water.
Rinse time should be set at a minimum of 1.5 mn (90 seconds).
E. Preparing the ICP Unit for a Run.
Before lighting the plasma , proceed as follows: (1) make sure that the all the ICP components (sample
introduction system and torch assembly) are set up for flux analysis and clean, and (2) set up the sample file, load
the autosampler rack, and position the rinse and drift solution on top of the autosampler.
1. Checking Sample Introduction System and Torch Assembly
The sample introduction system for hard rock analysis includes the autosampler, peristaltic pump, Teflon tubing,
concentric nebulizer and spray chamber. The torch assembly consists of the torch body, inner and outer tube,
alumina injector, and aerosol gas attachment. Prior to lighting the plasma:
Make sure that the sample intake (black) and waste (grey) tubing are not flattened and replace if necessary;
Check if nebulizer and spray chamber are clean and hooked up to appropriate tubing;
Check if outer and inner tubes have staining or built-up precipitation on their surfaces. Replace with clean tubes
if necessary;
Check torch alignment.
2. Set Up Sample File
Sample files are specific to the method open when created. Be sure to have the correct method open before
creating the sample file. To prepare the sample file, proceed as follows:
In the Main Menu of the JY software, select Analysis;
From the Analysis Menu, choose Sample File. Enter a file name, and choose YES when asked if you want to
create a new sample file. A Sample File window will open.
On top of the window, verify you have the appropriate method loaded and the correct sample file name;
Enter the ID of the samples in the first field of the Sample Name Field;
After entering a sample name press ENTER, then F3 to record it;
Continue until all drifts, blanks (as "ZIPX"), and samples have been entered;
Once all samples have been entered, choose F9 to view a list of the samples;
Use the arrow keys to move from sample to sample to input the correct sample position and press ENTER to save
the position;
Press F9 to print the list of samples with their positions (select SAM);
When done, press ESC to save the changes and to return to the Sample File input page.
Cookbook –Chem_ICP HR
14
Once the sample file is defined, the operator needs to define the transfer parameters. To do so, go back (ESC
several times, Reset position-YES, ESC) to the Analysis Menu, choose Sample File and hit F5 Transfer
Parameters.In the Results File Name field, type the directory where you want to sent the results and the result file
name (e.g. C:\leg192\1183.F03). Hit ENTER and escape all the way out of the program.
A typical sample file for the basalt analysis on Leg 192 had 43 items in the sample file (11 samples) and looked
like the following:
Drift 1
SRM1-A
Drift 2
Sample7-B
ZIP-A
Sample3-A
Drift 3
SRM2-A
Sample4-B
Sample8-A
Drift 4
Sample9-A
Sample5-B
SRM3-A
Drift 5
Sample4-A
ZIP-B
Sample10-A
Drift 6
Sample6-A
Sample1-B
SRM1-B
Drift 7
Sample11-B
Sample5-A
Sample2-B
Drift 8
Sample9-B
SRM2-B
Sample6-B
Drift 9
Sample8-B
ZIP-B
Sample10-B
Drift 10
Sample3-B
Sample11-B
Sample7-A
Drift 11
Sample2-A
SRM3-B
Sample1-A
Drift12
Cookbook –Chem_ICP HR
15
The sample file template for an eleven sample run is saved in the ICP Hard Rock (in House) folder on MC5259
(ChemTechOnly/Cookbook/ICP).
3. Load Autosampler and Position Rinse and Drift Solutions
The user, through the sample file, controls which sample is located in what particular position on the autosampler
and where the rinse and drift solutions are located. In the hard rock analysis, the autosampler is used not only for a
sample run but also for calibration. Racks code 24 are used for both calibration and sample runs with place for 14
scintillations vials per rack.
During a calibration, a rack code 24 will be used with the six rock standard vials in position 1 (upper left corner of
rack) to 6. The rack is placed in the notch closest to the autosampler. The rinse is usually beside the standard rack
in a Teflon beaker elevated by three plastic disks.
During a sample run, up to 4 racks code 24 can be placed next to each other. For example, in the 43 items run
described in section E.2., 3 racks are used for samples (22), SRMs (6) and blanks (3). Rack 1 includes position 1
to 14, rack 2 includes position 15 to 28, rack 3 includes position 29 to 42. The rinse and drift solutions are placed
beside rack 3 in Teflon beakers labelled appropriately. The position of the drift solution is specified in the sample
file prepared in advance of the run. For example, with a 3 rack run, the drift solution can be placed in position 51
(rack 4). The rinse position is specified just before the sample analysis is started. In a 43 item run, the rinse
solution, for example, can be placed in rack 4, position 13. Notice that the rack position is numbered differently
for the rinse solution then for the drift solution. The rinse solution requires a rack number and position from 1 to
14 while the drift just requires a number to indicate what would be its position in the next rack.
Note: For a 43 item run that includes a calibration, the operator will need 37 scintillation vials, 22 for samples
(11x2), 4 for blanks (1 for Calib0, 3 for the unknown zips), 11 for standards (5 for the calibration and 6 for the
three standards run as unknowns).
The autosampler probe has to be positioned carefully so as to be high enough (when in the up position) to clear
the tops of the autosampler vials but low enough to get as much sample out of the vials as possible. Commonly,
the probe will not be able to reach the bottom 1-2 ml of sample.
Once the sample file is set up, the instrument plasma needs to be lit as described below.
F. Starting the ICP
The start-up procedure consists of the following step:
Check sample introduction system (pump tubing) and torch glassware and alignment;
Turn on water recirculator and make sure the exhaust fan is ON
Turn on Argon gas, check the bottle pressure and Plasma and Sheath gas flows;
Check Nitrogen flow and bottle pressure (when measuring P, increase the flow to 3L/mn three hours before
lighting up the flame, otherwise it should be set at 1L/mn);
Open the Automatism window (double click on Plasma Controls) in JY main window;
Turn Controls ON;
Check pump speed (20), plasma flow (12-14 l/mn), nebulizer flow (around 0.8) and pressure (around 3 bar), and
reflected power. Record them in the ICP blue Notebook;
Pump nanopure water for at least 5 minutes prior to lighting plasma;
Light plasma by clicking on Start button, check plasma;
Turn Argon humidifier ON;
Cookbook –Chem_ICP HR
16
Wait 30 minutes for stabilization before analysis.
On Leg 192, the pre and end of run conditions were scrupulously recorded in the ICP notebook every day the ICP
was run (as was the Zero Order value). In general, the nebulizer flow was around 0.70 (P=3.06 bars) with the
argon humidifier off and around 0.55 with the argon humidifier on. Plasma flow was set at 14 L/mn and Sheath
gas flow at 0.15 L/mn. The reflected power varied depending on the nebulizer.
Values usually fluctuated around 25 on a good day.
G. Preparing for Analysis
Four procedures need to be performed before calibrating and running samples: zero order check, autosearch,
autoattenuate, and profile.The latter three procedures are performed using the Preparation Menu accessed by
selecting Preparation in the Main Menu of the JY software.
1. Performing a "Zero Order" check
A zero order check is performed from time to time just after the warm-up. Performing a zero order check
physically moves the diffraction grating to its "zero" position, where all light is reflected back. Zero Order is the
term used to define when the grating within the spectrometer behaves as a mirror and does not separate the
incoming light into several wavelengths, but rather reflects it (like a mirror). The software will check as to
whether "Zero Order" is ‘okay’ or not whenever you turn on the machine, however, this internal check is not a
true mechanical test. Rather, it is in fact a test of whether the electronics have been compromised (i.e., turned on
or off, been subjected to a surge, etc.) since the ICP was last used. Therefore, it is advisable to perform a Zero
Order test (Shift-F2; Center Control) from time to time (no need to do it every day) and record in the logbook at
what position (step number) Zero Order was found as this parameter is useful for diagnostics should the need
arise.
Note: After the Leg 192 service call, the zero order changed significantly and was reading on average 7300.
2. Performing an Autosearch
When performing an autosearch, the spectrometer searches for a "reference peak" (the carbon line at 193.031 nm)
and subsequently, when analyzing for an element (for example, Fe at 238.204 nm), moves to the desired
wavelength as a function of its distance (in "motor steps", which corresponds to nm) from the reference peak.
Prior to each analysis (of a sample, standard, blank, or any item) the ICP searches for the reference peak and
locates it. The "autosearch" function tells the machine exactly where each peak is located with respect to the
reference, so during the analysis it can locate the peak precisely. The ICP also quantifies an "offset", which is the
distance (in nm) that it found the peak from where it was expected. Typical offsets are on the order of 0.005 nm
or less. Offsets significantly and consistently greater than 0.005 (approximately) may indicate something is amiss.
To perform an Autosearch procedure, proceed as follows:
Aspirate the drift solution and select Autosearch from the Preparation Menu;
Select Small for the Search Window Size;
Select the elements you want to autosearch. Use F10 to search for all elements. To search for only one element,
press F5 to indicate YES for the element of choice and F9 to indicate NO to the others; then press F10.
Check whether the ICP located the reference peak of the element(s) of interest, the shape of the peak, and the
offset;
If the machine is not sure it located the right peak and you are, accept with F10;
Perform an autosearch repeatedly until the peaks are visually centered each time.
Cookbook –Chem_ICP HR
17
Note: The first time an element is autosearched, or whenever a method has been changed significantly, be sure to
use a single element solution to ensure that the peak found during an autosearch is in fact a peak for the element
of interest. If using a multiple element solution, use first the large then the small window option on the JY
software to ensure that the peak found is the one of interest.
On Leg 192, during the initial setup of the BAS192 method, autosearching was done on the BU single elements
solutions: Si and P were never found. Ti, V, Cr, Fe had to be autosearched many times to find peaks. Silica was
found by autosearching on BCR-2. P was later found by autosearching numerous times on a P single element
solution made from the phosphate standard stock solution used for pore water. On a routine basis, autosearching
was done on K1919 for all elements with the exception of P which was autosearched using the P single element
standard
3. Performing an Autoattenuate
An important component of the Method is the voltage applied to photomultiplier (PMT) during the acquisition of
each element. This voltage needs to be optimized using the "Autoattenuate" command from the Preparation
menu, and is performed after a Method is developed. Generally, Autoattenuate is done once when the method is
created or whenever the peak shape are flat on top as seen in the Autosearch procedure (often for Sr). It does not
have to be done every day.
To perform an Autoattenuate procedure, proceed as follows:
Be sure to have autosearched, so the software is indeed adjusting the voltage to the correct peak;
Aspirate the highest concentration standards for each element;
Select Autoattenuate from the Preparation Menu;
Select Small for the Set Voltage Window size and search all, or only some, of the elements contained in the
method (same as in Autosearch).
The software will perform the optimization, and the selected voltages and gains will be saved in the measurement
section of the method (H.V. Field). When completed, the software will return you to the Preparation Menu.
Note: The last number in the H.V. Field represents the gain. If the HV number finishes with 1, the gain is 1. If the
HV number finishes with 2, the gain is 2. For all other numbers, the gain is 3. For example, 625 V corresponds to
620 volts at gain 3.
On Leg 192, autoattenuation was done as follows:
Autoattenuate on BCR2 for Mn, Na, K, Ba, Y, Zn, V and Zr (because this SRM has highest concentrations for
these elements);
Auttoattenuate on BHVO-2 for Si, Fe and Cu;
Autoattenuate on DNC1 for Al, Mg, Ni, Cr;
Autoattenuate on K1919 for Ti, Sr, and;
Autoattenuate on BIR1 for Ca and Sc.
4. Profiling
A Profile is essentially a picture of the spectrum at, and around, the wavelengths specified in the Method. Profiles
are especially useful because they allow the user to see potential interferences or changes in background levels.
The Profile is the only command by which the user can actually see the intensity vary as a function of wavelength.
While viewing a Profile, the user can select the position of the background measurement (“carrot”). This is the
preferred approach to select this position (rather than directly in the Method) because adjacent peaks can be
Cookbook –Chem_ICP HR
18
observed and the background selection thus made more informatively.To acquire a Profile, proceed as follows:
Aspirate the drift solution and select Profile from the Preparation Menu;
Type a Profile Name (limited to 8 characters, use date for example) and press ENTER twice;
To start acquisition, press F10. The software will then ask if you want to acquire a profile for all the elements in
the Method, choose YES or NO, then select or de-select elements as needed (using F5-YES or F9-NO function
keys);
Once the profile is completed, view the profile by pressing F3 - Go to Graphics;
A list of all Profiles acquired with the current method will then be displayed. To select a profile use the arrows up
and down to get to the profile of interest(s) and press ENTER. Up to four profiles may be viewed at once. It is a
good idea to load the previous day(s) profile(s) to check for changes since the instrument was last run;
While viewing, the function keys can be used to perform various tasks such as: setting and clearing background
points (use the arrow keys to move the cursor), expanding the axes (F3), etc. (see list of options on the left side of
the Profile display screen). Check that every element (F10) is centered on the line, check signal/noise ratio (counts
at peak apex/background counts--big is better!);
Press ESC when you are ready to return to the Preparation Menu.
Note: Profile names are universal, regardless of the Method being used (i.e. the same Profile name cannot be
used for different Profiles acquired with different Methods).
On Leg 192, profiling was done on K1919 at the beginning and end of each run and compared daily with the
previous’ day run to monitor the instrument performance.
H. Calibrating
With the calibration rack in place in the left-most position on the autosampler and the rinse bottle in the proper
position, one is ready to calibrate. Proceed as follows:
From the Preparation Menu, choose Calibration, then Calibrate;
Choose the type of sample racks being used (24);
Specify the Rinse Rack Number and Rinse Position on this Rack;
Attach the autosampler probe tubing to the pump;
Press F10 Calibrate;
Press any key to start.
The autosampler probe will move first to the rinse bottle then it will move to the first standard in position 1, and
so on between the other standards and the rinse bottle. When the measurements for the standards are finished, the
autosampler will try to measure the recalibration standards STDLOW and STDHIGH (even if the user does not
want to use recalibration standards). To stop the autosampler, press ESC several times until the probe returns to
the rinse and the message on the bottom of the monitor asks "Reset Rinse Position?”. Select NO to leave the probe
in the rinse bottle.
The next step before running samples is to check the linearity of the calibration curves and make any needed
adjustments. To do so:
From the Preparation Menu, choose Calibration, then View Curves;
Press F3 Display Results. A Calibration Coefficients window appears for the first element in the calibration table.
In this window, the regression coefficient and equation, and a table of the calibration data will be displayed.
For each standard level in the calibration table, check the relative errors and compare the measured
concentrations (Ms Conc.) to the theoretical concentrations (Th Conc); Check that the calibration is linear for that
Cookbook –Chem_ICP HR
19
particular element by looking at its calibration curve (press F3 to view the calibration curve and F3 again to go
back to the calibration table;
Eliminate the standards you do not like (high errors) from the regression, either (1) directly from the curve by
using the up and down arrow keys and selecting S for Suppress, or (2) by editing the calibration table itself.
Choose F5 Modify to edit the calibration table. Using the right arrow key, go to the validity column (VAL) and
eliminate the standards from the regression by entering a 0 (a 1 indicates the standard is used in the regression, a 0
means it is not used).
When finished making modifications, press ESC to get out of the edit mode and press F9 to print the calibration
data;
Proceed to check the calibration data for the next element by using the right arrow keys. Be sure to save any
changes made when moving on to the next element;
Repeat as above for all the other elements;
When you finished, escape several times till you get back to the Main Menu.
Note: If performing a manual calibration, choose Calibrate and begin aspirating the lowest concentration standard
(calibrations are done from low concentration to high). The next screen will then be essentially blank, with the
method name in the upper left corner and the standard name in the upper right corner. At the bottom of the screen
the user will be asked if this is the standard you wish to measure (standard names will correspond to those names
entered in the method file), choose YES. After completing the measurement of the standard, you will be
prompted to continue with the other standards. Follow the prompts on the screen, and aspirate the corresponding
standards in order from low to high concentration. As with the autosampler, the instrument will always want to
measure the recalibration standards (STDLOW and STDHIGH), but if they are not being used, choose NO when
prompted to analyze these standards.
On Leg 192, a six standard (Blank, BHVO-2-6K, BCR-2-6K, BHVO-2, BCR-2, and BIR-1) calibration was
performed every run to check the performance of the instrument. It was not used by the scientists for data
reduction. The 6000X dilution of the BHVO-2 and BCR-2 standards was done to get a better spread of the silica
values.
I. Analyzing Samples
If the operator is satisfied with the calibration, the analysis of the samples can start as soon as the sample racks,
rinse and drift bottles are properly positioned on the autosampler tray. Starting the analytical run must occur as
soon as possible after the calibration is completed. This is of vital importance because the first item in the Sample
File is a drift solution, which is used as the master drift to correct the entire run.
To perform a sample run, proceed as follows:
From the Main Menu of the JY software, select Analysis;
Select Sample File and type the name of the file you prepared earlier;
Press F10 Analyze. You will then be prompted to “Select Racks?", choose YES, and make sure that the proper
number of racks and rack types are specified;
Then choose F10 Analyze again. You will then arrive at the Analysis Page, and be prompted to "Prepare the
Autosampler" and to "Press any Key" to begin. Do so. As with the calibration, the autosampler will then move the
probe between the samples, the drift, and the rinse bottle until all the samples and drifts have been analyzed;
When the run is finished, the message “Reset Rinse Position” will appear. Select YES and then proceed with the
shut down procedure.
Note: During the run, you need to constantly monitor the ICP. Keep on eye on the level of solution in the rinse
and drift bottles. Keep an eye on the sample intake tubing as it easily slips out of the pump tubing. Also monitor
Cookbook –Chem_ICP HR
20
the Argon supply, the ICP sucks 100 psi in 30 mn or less. Make sure you always have plenty of paper in the
printer as the software will crash the run if itcannot print to a printer. If the message “Reset Rinse Position”
flashes in the middle of your run, go back in the run immediately (select Analysis, Sample File, F10 etc.). The
software keeps in memory what samples it ran up to the crash (an “m” next to sample name in the sample file
indicate that the sample was measured) and will restart at the appropriate sample number. However, if the run
crashes again, all is lost and you will have to start from scratch.
On Leg 192, a forty-three sample run lasted from 12-14 hours. It included a half hour warm-up, autosearching on
K1919 and for P, profiling K1919 at the beginning and end of run, two hours six standards calibration, ten hours
for a 43 sample run, and a half hour for shut down.
J. Shut Down Procedure.
To shut down the ICP, proceed as follows:
Pump rinse solution for at least 5 minutes;
Pump DI H2O for at least 3 minutes;
Open the Automatism window in JY main window;
Turn Argon humidifier OFF;
Record nebulizer flow (and pressure) and reflected power in the ICP blue Notebook;
Press STOP to shut off the plasma;
Maintain gas flow and pump H2O for another 3 minutes;
Remove input tubing from H2O and continue pumping until nebulizer and spray chamber are dry;
Turn Controls OFF to shut peristaltic pump off, and release tubing clamps. Roll tubing around with fingers;
Turn off recirculating water;
Shut off the Argon gas bottle (if P was analyzed, reduce Nitrogen flow back to 1L/mn);
Empty waste bottle, if needed.
K. Post Analysis Data Reduction
The data generated by the ICP can be reduced using either the calibration software or offline without the use of
the calibration software. The latter method was used on Leg 192.
In summary, the raw intensities from the F03 raw data file are pasted in an Excel spreadsheet and then the
intensities for all samples are corrected for the full procedural blank. Drift correction is then accomplished by
linear interpolation between each consecutively run drift-correcting solution and correcting the intensities of the
samples run between those drift-correcting solutions. The interpolation is calculated using the lever rule.
Following blank subtraction and drift correction, concentrations for each sample is calculated from the average
intensity per unit concentration for standard K1919 or BHVO-2.
Four Excel spreadsheets were developed on Leg 192 to perform the data reduction. The Excel spreadsheets can be
found on the Chem Lab Mac 5259 hard drive, in the ICP Hard Rock (In House) folder
(ChemTechOnly/Cookbook/ICP).
Two Excel spreadsheets were designed to work with 20 elements (one for data reduction based one K1919 and
one for BHVO-2) and two were designed to work with 18 elements. All major element concentration data in the
Cookbook –Chem_ICP HR
21
spreadsheets is given in weight percent oxide; all trace element data is given in ppm.
There are 3 different pages in each spreadsheet:
Raw Data;
Reduction; and
Final Data.
Once the raw data generated by the ICP software is pasted into the "Raw Data" page of one of the Excel
templates, a transposition macro is run and the data will be automatically reduced and transferred to the "Final
Data" sheet. Please realize that the transposition macro will not work if the number of elements run is changed, or
if the raw data is offset on the data reduction page. The reduction page is sensitive to the location of the zips
(blanks), drifts, and the K1919 or BHVO standard. If changes are made, the spreadsheet will need to be modified
to fit the new output of the ICP. Comments have been made in each templates (and each sheet in the templates) to
assist the user.
To perform data reduction on the raw data collected from the ICP, proceed as follows:
Copy the ICP *.F03 raw data file (eg. 1183.F03), saved into the directory specified in the Transfer Parameter, to
a floppy disk. The file is a comma delimited, ASCII text file;
Import the file into Excel for further off-line data reduction;
Open the file from within Excel and choose in sequence: Delimited, next, Comma, next, and finish. The output
file will then be opened with all the columns and rows correctly delimited;
Open the data reduction Excel template you wish to use (e.g.BHVO18.Reduction.Template) and save it under a
new name (e.g. 1183BHVO.reduction). Do not just make a duplicate because the macro in the original template
will not be saved in the duplicated file;
Copy and paste all the rows and columns from the *.F03 file to the “Raw Data” sheet (in cell A3). Failure to do
so properly will cause the raw “intensities macro” to transpose and paste erroneous data in the “Reduction” sheet;
Run the macro "Transpose_raw_intensities" . To do so, go under the Tools menu, select Macro, then Macros, and
click on Run. This will automatically transpose the raw intensity data from the “Raw Data” sheet into the
“Reduction” sheet. NOTE! If elements are added or subtracted, the transpose macro will not function properly.
Create a new macro or paste the values by hand;
Once the macro has run, proceed directly to the “Final Data” sheet. After the macro is run, the final
concentrations of the samples have been automatically transferred from the “Reduction” page to the “Final Data”
page. Drift samples and zips (blanks) have been removed, while the standards are highlighted in blue and
extracted to the section entitled "Standard Concentrations". Major element weight percent totals are located to the
right of the final concentrations;
To the right of the totals there is a section called "Rearranged Final Concentrations". As the sample pairs are not
guaranteed to be in the same place in the run each time, one needs to paste these concentrations by hand. To do
so, follow the next instructions;
Go back to the left of the sheet and highlight all of the data in the "Final Concentrations" section, i.e. highlight
sample names, concentrations, and totals but NOT the element names. Select the “Copy” function in the Edit
Menu;
Highlight cell Z3 and then "Paste Special", making sure to select values only. Immediately go to "Paste Special"
again, and paste the formats. You should now have an exact replica of the "Final Concentrations" section, without
the cell references;
Highlight all of the data in the "Rearranged Final Concentrations" section (it should be already highlighted),
including sample names, concentrations, and totals. Then "Sort" the data in ascending order according to column
Z. This will pair the samples (each sample is run twice in any given run) and put them in order;
Copy each sample pair including names, concentrations and totals, one by one, into the "Extracted Sample
Concentrations" section (look left and down of the spreadsheet.
A few tips for looking for checking the quality of the data:
Cookbook –Chem_ICP HR
22
Check the major element wt.% totals. Reasonable data typically has totals of 98.5-101.5% if ignited powders
have been used;
Check the zips (blanks) for high background intensities. High background can be due to contamination or memory
effects;
Compare K1919 (drifts) and BHVO-2 intensities; they should be very similar. If they aren't, the data may be
skewed towards high or low totals;
Check the drift intensities over the length of the run. They shouldn't change much more than 10% in a typical run;
the instrument is usually very stable. The drift correction in this spreadsheet is based on the assumption of linear
drift (over short periods of time), so rapid or high amplitude variations in intensity will cause high variability in
the run and implies something has gone wrong with the instrument.
L. Basic Maintenance and Clean Up
1. Unclogging a Nebulizer
A steady decrease in the Ar flow rate and a rise in the back pressure are symptomatic of a clogged nebulizer.
Additionally, the stability of the instrument will greatly decrease. Because of the importance of the nebulizer to
the analytical process, great care needs to be taken to be prevent clogging.
To unclog a nebulizer, never use an ultrasonic bath. The vibrations in such a bath will harm the delicate glass
channel of the nebulizer. Because the channel of a concentric nebulizer gets successively more narrow towards
the tip, never try to clean a nebulizer by forcing gas or water in the forward direction.
Soaking a nebulizer in 70% HNO3 or in aqua regia greatly assists loosening up clogs. Otherwise use the
following procedure:
First, inject concentrated HNO3 acid (wearing safety glasses and gloves) into the front tip of the nebulizer, i.e use
the 70% HNO3 squeeze bottle equipped with a rubber tube that is stored in the acid hood, attach the tube to the tip
of the nebulizer and squeeze acid through the tip;
Then inject some acid up from the Argon channel and through the other end of the nebulizer. This will ensure
that the clogged tip will be inundated from all directions;
Rinse the nebulizer with nanopure water by pushing the water through all three orifices of the nebulizer (use the
DI bottle fitted with a rubber tube located in the acid hood).
Additionally, provided that the nebulizer has been rinsed with deionized water (and thus there is no loose acid
present), the nebulizer can be unclogged sometimes by unhooking one of the gas flows from the ICP torch
assembly, placing the end of the tube over the tip of the nebulizer, and using the high Argon pressure to blow
back through the nebulizer. Be sure to hold on to the nebulizer tightly to prevent it from launching across the
room.
2. Cleaning the Quartz Glassware and Alumina Injector Tip
The glassware (inner and outer tubes, spray chamber, nebulizer) and the alumina injector tip need to be cleaned on
a regular basis. Frequency of cleaning depends on the number of samples run.
The outer tube, inner tube, and alumina injector will build up precipitation on their surfaces. This is detrimental
to the analysis because it affects plasma shape, plasma stability, and inhibits ionization of the analyte. Depending
on the concentration of acid and the dilution factor of the LiBO2 fusions, the quartz tubes will chip and abrade
their surfaces. For the fused samples, it is recommended to clean the glassware frequently (after 1-2 analytical
Cookbook –Chem_ICP HR
23
runs) to help maintain instrument stability and minimize the corrosion of the glassware.
There is a difference between precipitation build-up and staining. Staining will occur, and can be tolerated.
Precipitation on the surfaces of the glassware, however, is more serious and must be monitored. The key issue is
that the glassware must be smooth, with the edges unchipped and with their edges high quality. The outer quartz
tube must be very clean and with minimal stains.
The best way to clean the tubes is by leaving them for a long time in a concentrated HNO3 (70%) wash bottle (12
to 24h minimum). Avoid use of an ultrasonic bath. Rinse them in DI and use Kimwipes or other clean cloths to
rub off the outside of the tube, or pass the Kimwipe through the inside of the cylinder and pass back and forth.
For the inner quartz tube, it can be inverted (reversed) so the stained end is at the bottom of the torch assembly,
but if this is done be sure that the edges of the tube are smooth and sharp, so the bottom of the tube is seated
properly.
For the alumina tip, soaking the upper end even in relatively weak HNO3 helps clean away precipitation easily.
3. Cleaning the Plasticware
The bottles and vials used for rock analyses are acid washed in 10% reagent grade HNO3. A double bath was
used on leg 192 (plasticware was soaked minimum twelve hours in each bath). The bottles/vials are then triple
rinsed in DI and oven dried at 40°C.
Document Information:
Author, Original: Rick Murray
Version Number, Original: 192
Revision History:
210: Chris Bennight
Signature (Department Supervisor)
Cookbook –Chem_ICP HR
24