
1
AD5000 OTDR
Manual
1
Foreword
Thank you for purchasing AD5000 OTDR (Optical Time Domain
Reflectometer).This user’s manual contains useful information about the
instrument’s functions and operating procedures and the handling precautions
of AD5000 OTDR.To ensure correct use, please read this manual thoroughly
before beginning operation.After reading the manual, keep it in a convenient
location for quick reference whenever a question arises during operation.
Note
• The contents of this manual are subject to change without prior notice as a
result of continuing improvements to the instrument’s performance and
functions. The figures given in this manual may differ from those that actually
appear on your screen.
• Every effort has been made in the preparation of this manual to ensure the
accuracy of its contents. However, should you have any questions or find any
errors, please contact your nearest AD INSTRUMENTS dealer.
• Copying or reproducing all or any part of the contents of this manual without
AD INSTRUMENTS’s permission is strictly prohibited.
2
Trademark
• Microsoft, Windows, and Windows XP are either registered trademarks or
trademarks
of Microsoft Corporation in the United States and/or other countries.
• Adobe and Acrobat are trademarks of Adobe Systems Incorporated.
• For purposes of this manual, the TM and ® symbols do not accompany their
respective trademark names or registered trademark names.
• Other company and product names are trademarks or registered trademarks
of their respective holders
Version
Version 1.0 2012
3
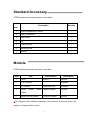
Standard Accessary
OTDR standard accessary showed in next table.
Description
Num.
Quantity
1
Power Adapter(220V 50Hz)
1
2
Power Patchcord
1
3
Data Cable
1
4
CD
1
5
Carrying Case
1
6
Securing Strip
1
7
Manual
1
Module
OTDR optional accessary showed in next table.
Num
Item
1
U disk
2
OTDR module
3
VFL module
4
Optical
Specification
USB 2.0
power
Description
Optional
Standard
1mw/5mw7mw
meter +5dBm~50dBm
Standard
Optional
module
5
Optical source module
1310nm/1550nm
Optional
※ All changes with standard accessary and optional accessary prices are
subject to change without notice..
4
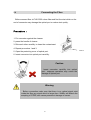
Safety Precautions
To use the instrument safely and effectively, be sure to observe the
precautions given in the user’s manual. Not complying might
result in injury or death.
Warning
Use the Correct Power Supply
Before connecting the power cord, ensure that the source voltage matches the
rated supply voltage of the AC adapter and that it is within the maximum rated
voltage of the provided power cord.
Use the Correct Power Cord
Use only the power cord that comes with the instrument. Do not use it for other
devices.
Use the Correct AC Adapter
Use only the AC adapter specified for the instrument. Do not use it for other
devices.
Use Only the Designated Battery pack
Use only the battery pack specified for the instrument. Do not use it for other
devices.
Use only this instrument or a charger specified by Gradway to charge the
battery pack. If the fast charge does not finish after three hours or more, stop
charging the battery pack immediately.
To prevent the possibility of electric shock and accidents, always turn OFF the
power switch and remove the AC adapter power supply from the instrument
when replacing the battery pack.
Do not throw the battery pack into fire or apply heat to it. This can cause
dangerous explosions or spraying of the electrolytes.
Do Not Look at the Laser Light
Do not look at the laser’s direct ray, reflected ray from a mirror, or indirect ray
without the proper protective eyewear. In addition, avoid being exposed to the
laser light. It can cause blindness or damage to the eye.
Do Not Operate in an Explosive Atmosphere
Do not use the thermocouple in a location where any flammable or explosive
gas/vapor is present. Operation in such an environment constitutes a safety
hazard.
Do Not Remove Covers
The covers should be removed by AD INSTRUMENTS’s qualified personnel
5
only.
Opening the cover is dangerous, because some areas inside the instrument
have high voltages.
Carrying and Moving the Instrument
Remove all power cords and connection cables from the main unit before
moving the instrument. When carrying the instrument, hold it firmly by the
handle.Also, if storage media is inserted into the instrument, always remove
the storage media before carrying or moving the instrument. Never leave the
media inserted when carrying or moving. The storage media can become
damaged.
Apply Correct Signals to the Optical Connectors
Do not apply light that is —10dBm or greater to the FHO 5000 optical
Connectors.
Doing so may damage the AD5000
6
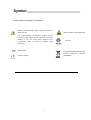
Symbol
Icons on the main body or in manual
Warning: handle with care. Refer to the user’s manual or
Hazard, radiation of laser apparatus
service manual.
This symbol appears on dangerous locations on the
instrument which require special instructions for proper
handling or use. The same symbol appears in the
corresponding
place
in
manual
to
identify
those
Recycle
instructions
Direct current
Comply WEEE(Waste Electrical and
Electronic Equipment )
(2002/96/EC)
Stand-by (power)
7
Directive
Content
0.0Names and Functions of Parts......................................................11
0.1 Front Panel............................................................................................11
0.2 Top Panel...............................................................................................13
0.3 Back Panel............................................................................................15
0.4 Side Panel..............................................................................................16
0.5 Main Menu Interface.................................................................................17
0.6 OTDR Module Interface............................................................................19
0.7 VFL Module Interface...............................................................................20
1.0Preparation.......................................................................................21
1.1 Attaching the Belt.....................................................................................21
1.2 Connect the Power supply..........................................................................22
1.3 Turnning on.............................................................................................24
1.4 Connecting the Fiber................................................................................25
2.0 Introduction of OTDR........................... ........................................26
2.1 Purpose of Measurement................................................................................26
2.2 Content of Measurement................................................................................26
2.3 Analyze of Curve........................................................................................26
2.4 Fundamental of OTDR..................................................................................30
2.5 Event Type...............................................................................................32
3.0 Setting Measurement Conditions....................................................34
3.1Setting to Auto Mode....................................................................................35
3.2Setting to Manual Mode.................................................................................36
4.0Making Measurements.....................................................................38
4.1 Averaging test mode....................................................................................38
4.2 Realtime test mode.....................................................................................39
4.2.1 Setting wavelength..................................................................................40
4.2.2 Setting test range and pulse width..................................................................40
4.3 Event List................................................................................................41
4.4 Distance Measurement.................................................................................43
4.5 OTDR Optimizing Tool.................................................................................44
4.6 Setting proper parameters..............................................................................45
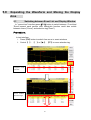
5.0 Expanding the Waveform and Moving the Display Area............48
5.1 Switching between Event list and display window.................................................48
5.2 Cursor Operation........................................................................................50
8
5.2.1 Activating Cursor.....................................................................................50
5.2.2 Moving Cursor.......................................................................................50
5.3Curve Operation...........................................................................................51
5.3.1Horizontal Zoom.......................................................................................51
5.3.2Vertical Zoom........................................................................................52
5.3.3Horizontal Shift......................................................................................53
5.3.4Vertical Shift...........................................................................................54
5.4Elaborating Event.........................................................................................55
5.5 Switching between curves.............................................................................56
5.5.1 Removing Curve(s)..................................................................................57
5.6 Removing an event.....................................................................................58
5.7Adding an event.........................................................................................59
6.0File Operation.................................................................................60
6.1Saving Curve...........................................................................................60
6.2Loading Curve(s).......................................................................................61
6.3Deleting Curve(s).........................................................................................61
6.4Copying/Moving Curve(s).............................................................................61
6.5File Setting..............................................................................................62
6.6Print screen.............................................................................................64
7.0Entering Characters.......................................................................65
7.1 Renaming...............................................................................................65
7.2 Creating Directory.....................................................................................65
8.0 VFL(Visual Fault Locator) Module..............................................66
9.0Optical Power Meter Module(Optional).......................................67
10.0 1310nm/1550nm Laser Source Module(Optional).....................67
11.0 OTDR2Module(Optional).......................................................67
12.0 Software Update............................................................................68
13.0 Background Information on Measurements..............................69
13.1 Viewing the Optical Pulse Measurement Waveform............................................69
13.2 Terminology...........................................................................................70
14.0 Maintenance..................................................................................71
14.1Notice...................................................................................................71
14.2Cleaning Tools.........................................................................................71
9
14.3Cleaning of Optical Port.............................................................................71
14.4Calibration.............................................................................................72
15.0 Diagnosis Center...........................................................................73
15.1 FAQ ....................................................................................................73
15.2 Help information......................................................................................75
16.0 Specification...................................................................................76
16.1 Physical Parameter...................................................................................76
16.2 Test Index..............................................................................................76
16.3 Dimension.............................................................................................77
17.0 Warranty.......................................................................................78
17.1 Terms of Warranty....................................................................................78
17.2 Exclusions.............................................................................................78
17.3 Transportation........................................................................................78
17.4 Customer Service and Support.....................................................................79
10
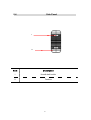
0.0
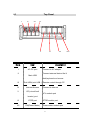
Names and Functions of Parts
Front Panel
0.1
X
VII
XI
IX
VIII
II
III
IV
V
I
Num.
VI
Item
Function
Tag select
I
button(F1-F
Enter relevant menu
5)
II
Direction
Move cursor and confirm
key
III
FILE
Open Database
IV
SETUP
Proceed quick set
V
ON/OFF
Turn on/off OTDR
11
VI
ESC
Cancel current menu
VII
MENU
Back to menu
VIII
REAL TIME
Realtime test mode
IX
TEST
Averaging test mode
X
Test State
Indicate test state (green-averaging mode,red-realtime mode
Indicator
XI
Power
Indicate working state and charging state (Green-working state
Indicator
or fully charged,Red-charging)
12
Top Panel
0.2
I
II
III
IV
V
Num.
Item
I
AC-DC port
II
III
Main USB
VI
VII
description
Connect to AC adapter
Connect external device like U
disk,keyboard and mouse
Sub USB(mini USB) Remote control through PC
IV
Internet Access
V
VFL(visual fault
locator) port
VI
OTDR port
VII
PM(Power Meter)
VIII
Connect to internet
VFL module port
OTDR module port
Power meter module port
13
port(optional)
VIII
OTDR2 port
(optional)
Reserved port
14
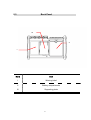
0.3
Back Panel
III
II
I
Num
Item
I
Warning label
II
Battery compartments
III
Supporting plate
15
0.4
Side Panel
I
II
Num
Description
I
Handle belt buckle
II
Fenders
16
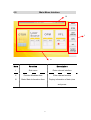
0.5
Main Menu Interface
III
I
II
Num
Function
Description
I
Side menu
Enter relevant interface
II
Function Modules Area
Enter relevant module
III
Basic State Information Area
Display information of date ,time
and power
17
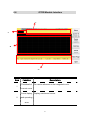
0.6
OTDR Module Interface
IV
I
II
III
Num
I
Function
Thumbnail of
For user's reference to the integrated curve.
current curve
Curve display
II
Description
Display events and curves.
and operating
area
18
Display
III
event
information
Event list area including:"Type","distance(Km)","Loss(dB)","T.Loss(
dB)","Slope(dB/km)" and "Reflection(dB)".
Display
condition
information
of
Test condition including"PW"(Pulse
IV
information
area
"WL"(wavelength),resolution
test
width),
of
X
axis
and
Y
axis(dB/div),distance,averaging and total loss from
cursor A to cursor B.
19
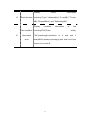
VFL Module Interface
0.7
I
II
Num.
Function
I
VFL mode indicator
II
Launching state indicator
20
Preparation
1.0
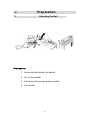
1.1
Attaching the Belt
Procedure:
1.Introduce belt through the buckle.
2.Put on the sheath.
3.Introduce belt through another buckle.
4.Fix the belt.
21
Connecting the Power Supply
1.2
Using AC adapter
AC adapter
Connect
to
after shut down
Patchcord
Once connect to AC adapter , power indicator turns red(if it is not
fully charged), adapter is charging the battery , after fully charged
power indicator turns green.
22
adapter
Installing Battery
1.Rotate buckle anticlockwise to open.
2.Install battery.
3.Close the cover, rotate buckle clockwise to close.
Caution
Ø Proper charging temperature is: -10~50 ,high charging temperature may
shorten battery life.
Ø Charging time is about 5 hours with power on, about 3 hours with power off.
Ø
Don't charge battery more than 8 hours.
23
1.3
Turnning on
Press power button(>2s) to turn on OTDR, power state indicator turns
green .when power is low some warning information will display on the screen.
Power state indicator
Launching state indicator
Green light:Working state or fully charged
Green light:Proceed realtime test
Red light:Charging state
Red light:Proceed averaging test
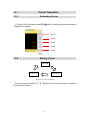
Power Indicator
Full
80% Power
60% Power
40% Power
20% Power
Less than 20%
Caution
Ø In case of low power, special icon will appear, and after that for a while AD5000
will turn off automatically.
Ø If it has not been used for an extended period of time,AD5000 will turn of
immediately after turned on to protect the internal battery ,please connect the AC
adapter adapter.
24
Connecting the Fiber
1.4
Before connect fiber to FHO 5000,clean fiber end first ,the dust which on the
end of connector may damage the optical port or reduce test quality.
Procedure:
1. Put connector against the cleaner.
2. press the handle of cleaner.
3. Rub each other carefully to clean the contaminant.
4. Repeat procedure 1 and 3.
Cleaner
5. Open the protecting cover of optical port.
6. Insect connector into optical port carefully.
Caution
Insect connector carefully into optical
port , unproper operation may cause the
damage of optical port.
Warning
Before connection make sure that there is no optical signal exist
inside the fiber,any signal which is larger than -30dBm will disturb the
sampling of OTDR,even cause permanent damage of sensor.
25
2.0
2.1
Introduction of OTDR
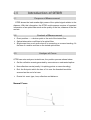
Purpose of Measurement
OTDR shows the back-scatter light power of the optical signal relative to the
distance. With this information, the OTDR could measure a series of important
information of an optical fiber such as the quality of the line, distance of the line
and etc.
2.2
Content of Measurement
Ø Event position----- a broken point or the end of the tested fiber
Ø Optical attenuation coefficient of a optical fiber
Ø Single event loss, such as the loss of a connection or a macro bending. Or
the loss of a end-to-end line on the tested optical fiber
2.3
Analyze of Curve
OTDR can auto analyze a tested trace, the position process shows below:
Ø Get the reflection events generated by connectors or mechanical splicer.
Ø Non-reflection events(usually it is splicing points or macro bending).
Ø End: the first point which the loss of it is over the threshold would be
scanned as the end of a trace.
Ø
Events list: event type, loss, reflection and distance.
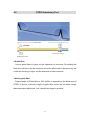
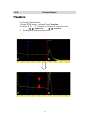
Normal Curve
26
A normal trace shows as above, the A mark is a start-peak and the B
mark is a end-reflection-peak. The tested trace is oblique, the total loss
will become bigger with the increasing of the fiber length. The total
loss(dB) divides total length is the average loss(dB/km) of a fiber.
Curve with Jumper Connected
If there is additional reflection peak in a tested trace, this may be
caused by a connection point or some other reasons. Anyway,
appearance of the reflection peak shows that the two connecting
surfaces of the connection are smooth. The smoother the connection
surfaces are, the higher the reflection peak is.
For an instance, if a broken optical line is under test, the OTDR
trace will show a broken point. After a maintenance of this line, use the
OTDR test it again, we may see a reflection peak replacing the broken
point on the OTDR trace, this shows the maintenance is done.
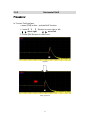
Curve with Broken Point
27
If the tested trace is just like the figure shows above, this might be
caused by several reasons like: a bad connection between the connector
and the lunching port, the optical pulse cannot be launched into the optical
fiber or a short distance broken point of the tested fiber from the initial
connection and the preset testing distance and pulse width is larger.
To fix this problem, we should:
1. Check the connection of the connector and the launching point
2. Reset the test parameters, decrease the preset distance and the
pulse width.
If the problem still exists, we could estimate:
1. The connector of the test fiber is broken or polluted.
2. The launching port on the OTDR is broken or polluted.
3. The distance of the broken point of the from the initial connection is
too close.
Curve with Non-reflective Event
There is a common phenomenon that an obvious step is on the middle of a
tested trace, it often caused by a fiber bending, fiber knot, being pressed by
something heavy or a fuse splicing point. The step means a bigger loss of a
fiber, it is also called event point. If the direction of it is downward, it could be
called non-reflection event. If the direction is upward, we can call it reflection
event.
Sometimes, the loss value could be a negative value, it does not means the
loss does not exist. It is common phenomenon called pseudo gain, it is by a
connection of two fibers with different back scatter coefficient, the scatter
coefficient of the back fiber is large than the front one's. In addition, the
different refract ratio also can cause the phenomenon. To avoid it, we could
test a fiber bi-directionally.
28
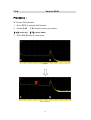
Abnormal Condition
The situation that there is no reflection peak at the end of a trace shows
above should be paid attention on. If the distance of the tested fiber is
available and the distance shown on OTDR is not equal to the original distance,
this shows that the fiber might be broken down or twisted and the bending
radius of it is over limited. The distance shown on OTDR is the position of the
fault point.
This phenomenon is often used in maintenance. If a fiber is uncertain, we
can bend a fiber and make sure the bending radius is over limited, then use
real time testing function of the OTDR to confirm the fiber.
Distance is Too long
This situation often happened in a long distance testing, caused by
under-range dynamic range of the OTDR that the energy of it can not support
a long distance transmission or caused by a under-range preset testing range
of distance or pulse width corresponding to the actual fiber length.
To avoid this situation, adjust the testing distance and the pulse bigger and
extend the sampling time.
29
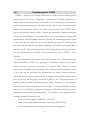
2.4
Fundamental of OTDR
OTDR——Optical Time Domain Reflector is a high precision optical testing
meter that use the theory of Rayleigh
scattering and Fresnel reflection. It is
widely used in the maintenance, construction and monitoring of an optical line.
All the important parameters like fiber length, optical loss, connection loss,
broken or twisted point and etc. of a fiber can be shown on the OTDR. When
the a light transmits along a fiber, it would be scattered to various directions
caused by the difference of come properties of the transmission medium, this
phenomenon called Rayleigh scattering. During the scattering process, some
of the light will be scattered along the absolutely converse direction, this
phenomenon is called Rayleigh back-scattering. It provides some details about
the fiber length. The parameters about fiber length can be got by calculation
with the parameter of time(This is the derivation of TD in OTDR——Time
Domain).
These back-scattering signals shows the loss level of a fiber and through
these information, OTDR can generates a backward oblique trace which
reflects several important attributes of a optical fiber. When the light,
transmitting downward along the fiber, meet a different density medium, a part
of the light will be reflected, this phenomenon is called Fresnel reflection.
There are many reasons can cause the changing of the medium density like a
little slot at the splicing point, a broken of fiber or etc. This phenomenon is
usually used to locate the discontinuous point. Compare to the Rayleigh
scattering, the consuming amount of the light in Fresnel reflection is much
more then it is in Rayleigh scattering. The power of Fresnel reflection is tens of
thousands times to the back-scattering's. The reflection level depends on the
changing grade of refraction ratio.
Formula of the distance: distance = (c/n)×(t/2).
Here: c is the light speed traveled in vacuum(2.998×10⁸m/s).
t is the delay between launching pulse and receiving pulse.
30
n is the refraction ratio of the testing fiber(specified by manufacturer).
When display the whole trace, each point of the trace represents the average
value of several sampling points. By zoom in and zoom out function, the value
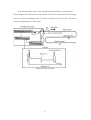
of each sampling point can be got.
Working Principle of OTDR
31
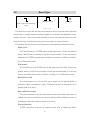
2.5
Event Type
E
Reflection event
End event
Start event or non reflection
event
Types of event
The events on trace are all the points that the value of power loss fluctuates
abnormally. It usually contains various types of connection and bending, crack,
broken and etc. The event points marked on trace with special marks are the
abnormal points in a fiber that cause the excursion of a normal trace.
The events can be divided into Reflection-event and Non-reflection-event
Start event
The Start-Event on a OTDR trace is the initial point. Under the default
setup, Start-Event is located on the first event(usually it is an connection
between the OTDR launching port and the connector of a fiber) of a fiber.
It is a Reflection-event.
End event\
The End-Event on a OTDR trace is the end point of a fiber. Under the
default setup, End-Event is located on the last event(usually it is an end
face or a broken down point of a fiber). Usually, it is a Reflection-event.
Reflection-event
The phenomenon on a trace that some power of the optical pulse is
reflected called a reflection event. Reflection-event is displayed as a
peak signal on a trace.
Non-reflection-event
The phenomenon on a trace that there exists some abnormal loss in a
optical line, but no reflection occurred is called a Non-reflection-event. It
is displayed as a drop with no peak on a trace.
Event detection
OTDR launches a bunch of optical pulse into a under-test fiber,
32
receives the returned optical signal and starts calculating the distance
from a event. The more the distance from the event is, the longer the
returning time is cost. According to the receiving time,distance can be
calculated. By detecting the trace generated by the returned optical
signal, the attributes of the fiber itself, the connector of the fiber, adaptor
in the fiber and splicing point in the fiber can be confirmed.
33
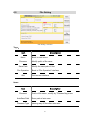
3.0
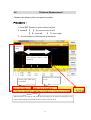
Setting Measurement Conditions
Press【SETUP】button on the panel to enter test setting interface
The meaning of items indicated in the following table:
Test Wave
Test Mode
Test Time
Test Range
Test Wavelength of
OTDR, including 1310nm,1550nm and
1310nm&1550nm 3 kinds of mode.
Auto Mode: AD5000 will set best parameters for current test
Manual Mode: set parameters manually.
Under averaging test mode(TEST),longer test time has better SNR
(Signal Noise Ratio) but takes more time.
Test distance of OTDR .adjust only in manual mode,in auto mode this
item
set as "Auto".
Wider pulse has stronger backward signal, OTDR has longer detecting
distance but wide pulse width will cause the saturation of backward
Pulse Width
signal, make blind area bigger.so the selection of pulse width has close
relationship with the length of fiber. Long fiber has wide pulse width..
pulse width could only modified in "Manual"mode.
Resolution
Unit
Sampling resolution of test, High resolution has more sample point and
high precision,but take more memory space.
Unit of test result,including km/kfeet/miles.
34
3.1
Setting to Auto Mode
In Auto mode,you could just proceed test by setting proper wavelength.
Procedure:
SETUP
1.Press 【 SETUP 】 button to enter "Test
Setting" interface
2. Set "Auto" mode
3.Set test wave
Caution
Auto test mode is not suitable to proceed Blind area test,user should
enter "Manual" mode and choose "Blind area test" to proceed blind area
test.
35
3.2
Setting to Manual Mode
In manual mode,user could set proper range and pulse width manually.
Procedure:
1.Press【SETUP】button to enter "Test Setting"
interface
SETUP
3.Set test wave
2.Set "Manual" mode
4.Set range and pulse width
36
Caution
Ø When "Pulse width" set to "Auto", test will choose proper pulse width
automatically
Ø When "Test Range" set to "Auto", test will choose proper range
automatically
Ø Once you set the “Test range”,“Pulse width”item will adjust automatically
you could also adjust manually
Proper relationship between Range and pulse width(PW)(For user's reference
only.):
Range
500m
2km
5km
10km
20km
40km
80km
120km
160km
3ns
√
×
×
×
×
×
×
×
×
5ns
√
√
×
×
×
×
×
×
×
10ns
√
√
√
×
×
×
×
×
×
20ns
√
√
√
√
×
×
×
×
×
50ns
×
√
√
√
√
×
×
×
×
100ns
×
×
√
√
√
×
×
×
×
200ns
×
×
×
×
√
√
×
×
×
500ns
×
×
×
×
×
√
√
×
×
1000ns
×
×
×
×
×
√
√
√
×
2000ns
×
×
×
×
×
×
√
√
√
5000ns
×
×
×
×
×
×
√
√
√
10000ns
×
×
×
×
×
×
×
√
√
PW
37
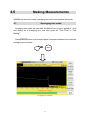
4.0
Making Measurements
AD5000 has two test modes: averaging test mode and realtime test mode.
4.1
Averaging test mode
Averaging test mode can calculate the data of curve over a period of time
and display as a averaging one ,test time could set "Test Time" in "Test
Setting".
Press【TEST】button on the control panel, test state indicator turns red,enter
averaging test interface.
TEST
Averaging test interface
38
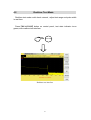
4.2
Realtime Test Mode
Realtime test mode could check network , adjust test range and pulse width
in real-time.
Press【REALTIME】button on control panel, test state indicator turns
green,enter realtime test interface.
REALTIME
Realtime test interface
39
4.2.1
Setting Wavelength
Procedure:
1. Select wavelength (WL) tag to set wavelength(1310nm or 1550nm).
2. Confirm by【OK】button.
4.4.2
Setting Test Range and Pulse Width
Procedure:
1. Select tag "Params"to set Test range(range) and Pulse width(PW).
3. Confirm by 【OK】button.
40
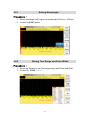
4.3
Event List
After test,event list will appear immediately at the bottom of the
window,user could get detail information about this test from the list.
Event 1
Reference point
Event 2
Event List
Description of items showed in chart below:
Num
Item
Description
I
Type
Type of event(Attenuation events,Reflection events and
End event)
II
Distance
Distance from start point to event
III
Section
Distance from this event to last event.
IV
Loss
V
T. Loss
Loss of this event(dB)
Total loss from start event to this event(dB)
41
VI
Slope
Ratio of event loss value(dB)(from this event to last
dB/km
event)to distance(km)(distance from this event to last
event)
VII
Reflect.dB Return loss of this event(dB)
42
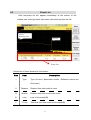
4.4
Distance Measurement
Measure the distance from one point to another.
Procedure:
1. Press【F1】button to active cursor function.
2. control【 】﹑【 】to move cursor A or B.
【
】:move left
【
】:move right
3. Get information by following the guide below:
Reference
point
Loss between Cursor A and
Cursor B
current pulse width and
Resolution of X axis and
Y axis
wavelength
Indicate distance of cursor A and cursor B which relative to the reference point(start event),
relative distance(km) and loss(dB) between cursor A and cursor B.
43
4.5
OTDR Optimizing Tool
Guide Fiber
Connecting Flange
Reflection Event
1.Guide fiber
Use an guide fiber to figure out the character of connector. By adding this
fiber we could move the fist connector out of the blind area.In the same way we
could use this way to figure out the character of last connector.
2.About guide fiber
Proper length of Guide fiber is 100~1000m, it depends on the blind area of
OTDR. In theory, minimum length of guide fiber should be two times longer
than attenuation blind area , but it should be longer in practice.
44
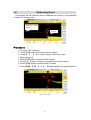
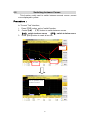
4.6
Setting Proper Parameters
At the fist time using OTDR, if user choose some testing parameter which is
not suitable to the real condition may cause the bad result. User should take
Testing range,pulse width and wavelength into consideration.
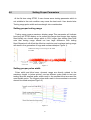
Setting proper testing range
Testing range means maximum display range.This parameter will indicate
how long will OTDR display on its screen.this range must longer than testing
fiber,Usually we choose range which is 20% longer than testing fiber.Take
note that testing range should not has large difference with testing
fiber,Otherwise it will affect the effective resolution and overlarge testing range
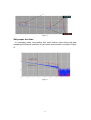
will result in the generation of huge and useless data(see Figure 1).
164km test range is too long to the fiber
of 7.6km
Figure 1
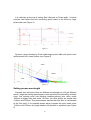
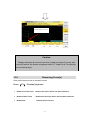
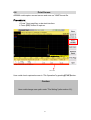
Setting proper pulse width
Pulse width and blind area, dynamic range are directly related to the
maximum length ,in below picture, use ten different pulse width to test one
testing fiber.the smallest pulse width result in the smallest blind area and the
most terrible noise. The longest pulse width result in the smoothest curve and
almost 1km blind area(see Figure 2).
Figure 2
45
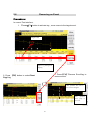
It is obviously at the top of testing fiber influence on Pulse width , in below
chart,we cant detect the first connecting point locate in the 540m by large
pulse width.(see Figure 3)
Figure 3
Dynamic range decided by Pulse width,larger pulse width will spend more
optical power,but it reach further.(see Figure 4)
500ns
5000ns
50ns
Figure 4
Setting proper wavelength
Proceed test with same fiber but different wavelength we will get different
result. Longer the testing wavelength is,more sensitive of the bending, in below
chart ,first splicing point has bending problem,splicing loss value under
1550nm is bigger than that under 1310nm. the other points are similar with
1310nm and 1550nm.This phenomenon indicate that this fiber is just bended
at the first point. If it's possible please alway compare the point state under
1310nm and 1550nm and judge whether it's bended or squashed.(see Figure
5)
46
Figure 5
Set proper test time
In averaging mode, long testing time could reduce noise during the data
sampling and Improve precision to get better and smoother curve(see Figure
6).
Figure 6
47
5.0
Expanding the Waveform and Moving the Display
Area
5.1
Switching between Event List and Display Window
In "current test" interface,press【F4】button to switch between “Curve”and
“Event”,expend each section after switch,this function could also switch
between cursor("Curve") and selection tag("Event").
Procedure:
In test interface,
1. Press【F4】button to switch from curve to event windows
2. Control【 】﹑【 】or【▲】﹑【▼】to move selection tag.
Original event
window
Event window
became larger
48
Switch to "Event",
move selection tag to
choose event.
Every time move selection bar to an event in event list,cursor will move
synchronously to relevant event on curve. User could use
"Zoom","Move","Switch"function to adjust curve to a better position, for more
information please read next sections.
The chart below describe the items in event list:
Num.
Item
Description
I
Type
Type of event(attenuation event, Reflection event or end
event)
II
Distance
The distance from start event to this event(Km)..
III
Segment
The distance from this event to last event(Km).
IV
Loss
Loss of this event(dB)
V
T.Loss
The loss from start point to this event(dB).
VI
Slope
Ratio of loss(from last event to this event)to distance(from
last event to this event)
VII
Reflect
Return loss of this event
49
Cursor Operation
5.2
5.2.1
Activating Cursor
In"Current Test" interface, press【F1】button,"cursor"tag turns yellow,means
it has been activated.
【F1】
【F2】
【F3】
【F4】
【F5】
5.2.2
Moving Cursor
Cursor B
Cursor A
Cursor AB
Sequence of cursor switching
Set proper cursor,press 【 】﹑【 】button to move current cursor, long press
to move cursor faster.
50
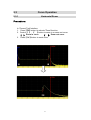
5.3
Curve Operation
5.3.1
Horizontal Zoom
Procedure:
In "Current Test"interface,
1. Press【F2】button to activate "Zoom"function.
2. Control【 】﹑【 】button to zoom in or zoom out curve.
【 】:Zoom in curve
【 】:Zoom out curve
3. Press【OK】button to reset curve
缩放_水平原始
Original
After operation
51
5.3.2
Vertical Zoom
Procedure:
In "Current Test"interface,
1.Press【F2】button,activate"Zoom"function.
2.Control【 】﹑【 】button to zoom in or zoom out curve.
【 】:zoom out
【 】:zoom in
2. Press【OK】button to reset curve.
Original
After operation
52
5.3.3
Horizontal Shift
Procedure:
In "Current Test"interface,
1.press【F3】button,activate"shift" function.
2.Control【 】﹑【 】button to move right or left.
【 】:move right
【 】:move left
3. Press【OK】button to reset curve.
original
After operation
53
5.3.4
Vertical Shift
Procedure:
In "Current Test"interface,
1. Press【F3】to activate“shift"function.
2. Control【▲】﹑【▼】button to move up or down.
【▲】:move up﹑【▼】:move down
3. Press【OK】button to reset curve.
Original
After operation
54
5.4
Elaborating Event
This section we will introduce how to elaborate an event on curve,example
as event 2 in below curve.
Reference point
Event 1
Event 2
:
Procedure :
In "Current Test" interface,
1. Press【F1】button to activate cursor function.
2. control【 】﹑【 】to move cursor(A or B) left or right.
3. Move to event 2.
4. Press【F2】button to active Zoom function.
5. Control【 】button to zoom out event(cursor as the center).
6. Press【F3】button to activate"shift" function.
7. Control【▲】﹑【▼】﹑【 】﹑【 】button to adjust to a proper position.
事件 4 放大后波形
55
5.5
Switching between Curves
This function could used to switch between several curves ,current
curve displayed in yellow.
Procedure:
In "Current Test" interface,
1. Press【F2】button ,active "switch"function.
2. Control【▲】﹑【▼】button to switch between curves.
【▲】:switch to above curve
【▼】:switch to below curve
3. Press【OK】button to reset all curves.
A Curve
B Curve
C Curve
After on operation, curve
A switch to curve B
56
After another operation
curve B switch to curve C
Caution
Display maximum 8 curves at one time, if load more than 8 curves, last
curve will recover the former one,please refer 6.2 "Load Curve" for learning
how to load curve(s).
5.5.1
Removing Curve(s)
User could remove one or several curves.
Press 【F3】 "Overlay"tag menu:
Ø
Remove Current Trace
Remove the Curve which has been selected.
Ø
Remove Other Trace
Remove the Curve(s) which has not been selected.
Ø
Remove All
Remove all the Curves.
57
5.6
Removing an Event
Procedure:
In current Test interface,
1.
Press【F1】button to activate tag,move cursor to the target event.
Target event
Appear by pushing"Next
page"tag
3. Press【F4】"Remove Event"tag to
remove event.
2. Press 【F5】button to select"Next
Page"tag
After operation this event in
the event list disappear
After
operation
cursor
jump
next event
58
to
5.7
Adding an Event
Procedures:
In current Test interface,
1.Press【F1】 to activate cursor function move to target event.
Target event
2.Press【F5】button to select"Next Page"tag( Please refer last section5.6
"Remove an Event").
3. Press【F3】 to add event.
After operation ,this event will
appear in the event
will be rearranged.
Caution
Event addition may not operate successfully for too close to another event,user
could move cursor a bit away from near event and have another try.
59
list sequence
6.0
File Operation
In "Current Test" interface Save the current curve ,press 【FILE】button on
the board ,open "File Operation"interface,showed as follow:
FILE
"File Operation" interface
File Setting
F5
6.1
Saving Curve
Procedure:
In"Device Directory"window,
1. press 【▲】﹑【▼】 to choose file and subfile then press【OK】.
2. Press 【F5】button to enter "File Operation"interface ,user can change way
of saving,decide way of naming and check memory state.
3. Press 【F2】"Save" tag to save current curve as default name(set in
"Filename Type"under "File Setting"interface).
4. If user want to change a name before saving , press【F3】"Save As"tag to
input your ideal name(refer section7.0"Entering Characters" to learn how to
60
input characters) and confirm by 【OK】button.
6.2
Loading Curve(s)
Procedure:
In"Device Directory"window,
1.Press 【▲】﹑【▼】to choose relative file and subfile press 【OK】.
2. Press【 】 switch to "File list" window.
3.Control【▲】﹑【▼】 button to to select relevant file curve file(s),press 【OK】
button to select the relevant file(s).
4.Press【F4】"Load" tag to load curve(s).
6.3
Deleting Curve(s)
Procedure:
In "File Operation"interface,
1.Select the curve file(s) which you want to remove.
2.press 【F1】"file operation" select "delete"sub menu to delete curve file(s).
6.4
Copying/Moving Curve(s)
Procedure:
In "File Operation"interface,
1.Select the curve file which you want to remove.
2.Press【F1】 "File operation" select "Cut" or "Copy".to move or copy curve
file(s).
3.Choose the target folder, press 【F1】"File Operation".
4.Select "Paste"tag to finish this operation.
61
6.5
File Setting
"File Setting " interface
Tags:
Item
Menu
Description
Back to main menu
Filename
Modify prefix of file name
Save Path
Modify the save path of files
File Operation
Quit
Back to "File Operation" interface
Quit current interface
Items:
Item
Filename
Description
Prefix of file name , modify by "Filename"tag menu
AutoSave Path
Save path of auto save
Filename Type
Naming way of files after auto save
62
SEQNO
Create folder by
date
Split char
Auto save
Sequence number of next test,and auto increment after
each test
Set create folder by today's date and save files separately
into them
Set the type of separator
Set Auto save
63
6.6
Print Screen
AD5000 could capture current screen and save as ".BMP"format file.
Procedure:
1. Press "Next page"tag ,under test interface.
2. Press【F2】button to capture.
Save Path
User could check captured screen in "File Operation"by pushing【FILE】button.
Caution
User could change save path under "File Setting"(refer section 6.5).
64
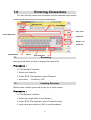
7.0
Entering Characters
You can enter file names and comments from the character input screen
shown below when saving the measured waveforms.
Storage Path
Text Editing
Caps Lock
Virtual Keyboard
Delete All
Delete one
character
Input Method
Space
7.1
Save and Quit
Renaming
Next guide will teach you how to change the name of file:
Procedure:
In "File Operation" interface
1. Select your target file
2. Press【F1】"File Operation",select "Rename"
3. Input name
4.confirm by “OK”
7.2
Creating Directory
Before create a folder system will inquire you to input a name:
Procedure:
In "File Operation" interface
4. Select your target folder or root directory
5. Press【F1】"File Operation",select "Create Directory"
6. Input name and confirm by "OK" on visual keyboard
65
8.0
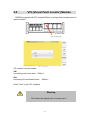
VFL(Visual Fault Locator) Module
AD5000 equipped with VFL module(650nm) to simply detect broken point of
optical network
VFL launching port
VFL
interface
VFL module has two modes:
CW
Launching continuous wave(650nm)
2Hz
Launching 2Hz modulated wave (650nm)
Press "Quit" to quit VFL interface
Warning
Don't direct the optical port to human eyes !
66
9.0 Optical Power Meter Module(Optional)
10.0 1310nm/1550nm Laser Source Module(Optional)
11.0 1625 nm OTDR2 Module( Optional)
67
12.0
Software Update
AD5000 could proceed update by one U disk(with patch storage in root
directory).
Procedure:
1.Download patch from PC and storage into U disk(※must storage in
root directory).
2. Insert U disk into USB port.
3.Turn on AD5000, press【F5】to enter system setting,press【F2】 to
proceed upgrades.
Upgrades interface1
Upgrades interface2
68
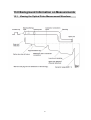
13.0 Background Information on Measurements
13.1
Viewing the Optical Pulse Measurement Waveform
69
13.2
Terminology
Near-end reflection
A reflection occurs in the gap between the AQ7270 and the connector for the
optical fiber cable. Losses and reflections of the connection points cannot be
detected in the section in which this reflection is detected. This section is called
a dead zone.
Backs cattering light
When light propagates through the optical fiber cable, a phenomenon called
Rayleigh Scattering occurs due to the nonuniformity of the density or
constituents of materials smaller than the wavelength unit. The scattered light
that is transmitted opposite to the direction of propagation is called
backscattering light.
Splice loss due to fusion
A splice loss occurs at the fused section mainly due to axis offset and angle
offset.
Reflection due to connector connection
Unlike the fused section, a slight gap occurs in the connection section of
connectors. Because the group refraction index changes in this gap, a
reflection occurs causing a loss.
Fresnel reflection at the far end of the optical fiber cable
Fresnel reflection occurs at the location where the optical fiber cable is broken
or a location where the group refraction index changes such as the far end of
the cable (glass and air) when light enters the cable. If the end face of the
optical fiber cable is vertical, approximately 3.4 % (–14.7 dB) of the incident
light power is reflected.
Dynamic range
Dynamic range refers to the difference between the backscattering light level
at the near end and the noise (RMS = 1).
Dead zone
The locations where measurements cannot be made due to the effects of
Fresnel reflection, connection point of connectors, etc.
70
14.0
Maintenance
14.1
Notice
AD5000 OTDR Use rechargeable Li-ion battery.
Pay attention to the following :
Ø
Keep OTDR dry and clean store at room temperature(15℃~30℃).
Ø
Charge it monthly if you don't use it for a long time(more than one month ).
Ø
keep Optical port clean by alcohol soaked cotton
Ø
Clean optical port and connector at fixed period .
and recover dust cap after use..
Follow the principles below before cleaning:
Ø
Shut off before cleaning.
Ø
Any operations contrary to the instructions may result in dangerous laser
injuries.
Ø
Disable laser launching before cleaning.
Ø
When the instrument is in operation, please always avoid looking directly into optic
output. Although laser radiation is invisible, it may do serious injury to eyesight,
Ø
Be cautious of electric shock and make sure AC power is disconnected from the
instrument before cleaning. Always use dry or moist soft cloth to clean the outside of
the instrument, and never touch inside.
Ø
Don't proceed any modification on OTDR.
Ø
For maintenance, please always operated by qualified worker.
14.2
Cleaning Tools
1.
Optic fiber cleaner (for cleaning of optic connectors)
2.
Optic fiber cleaning rod (for cleaning of optic outputs)
3.
Optic fiber cleaning tissue (for cleaning optic interfaces)
4.
Isopropyl alcohol
5.
Cotton ball
6.
Paper tissue
7.
Cleaning brush
8.
Compressed
71
14.3
Cleaning of Optical Port
Procedure :
1.
2.
3.
4.
5.
Screw down the cap
Pull out ceramic core by fingers
Clean port carefully
Recover ceramic core
Screw on the cap
Structure of optical port
Caution
Be careful, don't use tools like plier, it may cause permanent damage to
optical port
14.4
Calibration
We suggest to calibrate AD5000 OTDR twice a year,for more information
please contact us(check section 18.4 "Customer Service and Support" to find
our contact information ).
72
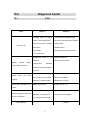
15.0
Diagnosis Center
15.1
FAQ
Fault
Reason
Solution
1.Holding time on power
1. Long press on ON/OFF key.
button is not enough(>2s).
2.Connect external power/ Replace
2.Run out of power / battery
a new battery.
has broken.
3.Install battery.
3.No battery.
4.Change another environment.
Can't turn on
4.Too cold there.
Display
shows
nearly
1.Brightness need to be
1.Adjust brightness.
adjusted.
2.Open and reconnect.
2.Connection
between
nothing after turned on
display and motherboard is
not good.
Battery
does
not
work
properly
Power state indicator turns
1.Temperature is too high.
1.Try to decrease temperature.
2.Connection is not proper.
2.Reconnect battery.
3.Battery is nearly broken.
3.Replace a new one.
Battery has broken
Replace a new one
1.Connector loose,polluted,
1.Clean and reconnect.
damaged or unmatched.
2.Change a new adapter.
yellow
Measuring graphic only has
front end reflection
2.Locating pin has broken.
No response
Restart
73
1. Often happened in large
1.Use proper measuring range and
plus width,long range and
pulse width setting.
short link condition.
2.Reconnect
2.Common ghost caused
Reflection event, reduce reflection
by
strength.
fault
point
of
Find Ghost
continuous reflection of
connector.
74
15.2
Help Information
AD5000 has an build-in manual with essential information
Procedure:
Turn on OTDR
1.Press【F5】enter system setting,press【F4】to read manual
Control 【▲】【▼】button to flip over
2.Press 【Esc】 to quit
75
Specification
16.0
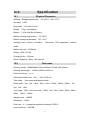
16.1
Physical Parameter
Working / Storage temperature:-10~+50°C / -20~+75°C
Humidity:<90%
Dimension:253X168X73.6mm
Weight:1.5kg(with battery)
Battery:7.4V/4.4Ah lithium battery
Battery working temperature:-10~+50°C
Battery storage temperature:-20~+70°C
Working hours:6hours(Condition: Full power,70% brightness,realtime
mode)
Battery life time:>500times
Power:DC9~12V 4A
Charging time:4-5hours
Shock resistance:Bear 1.2m free fall
16.2
Test Index
Dynamic range:40dB/38dB(1310nm/1550nm), 38 dB 1625 filtered
Working wavelength:1310nm/1550nm/1625 nm
Event blind zone:< 1 m
Attenuation blind zone:<4m
( <5m 1625 nm)
Test mode: Auto mode and Manual mode
Pulse width:3ns、5ns、10ns、20ns、50ns、100ns、200ns、500ns、1us、
2us、5us、10us
Test range:100m(blind zone test)、500m、2km、5km、10km、20km、40km、
80km、120km、160km
Sample point:128000
Resolution:>25cm
Precision:±(1+sampling resolution+distance*0.003%)
Loss resolution:0.001dB
76
77
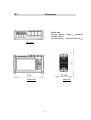
16.3
Dimension
Units: mm
Except where noted , tolerance
default as:±3%
(if size<10mm,tolerance:±0.3mm)
Top view
Front view
Side view
78
17.0
Warranty
17.1
Terms of Warranty
All AD INSTRUMENTS products are warranted against defective material
and workmanship for a period of time from the date of shipment to the original
customer. Any product found to be defective within the warranty period would
be repaired or replaced by AD INSTRUMENTS free of charge. In no case will
AD INSTRUMENTS liabilities exceed the original purchase price of the
product.
17.2
Exclusions
The warranty on your equipment shall not apply to defects resulting from the
following:
Ø Unauthorized repair or modification
Ø Misuse, negligence, or accident
AD INSTRUMENTS reserves the right to make changes to any of its products
at any time
without having to replace or change previously purchased units.
17.3
Transportation
To return instrument for reasons of yearly calibration or other, please contact
us. to obtain additional information and RMA#code(Return Materials
Authorization number). And describe briefly reasons for the return of the
equipment, to allow us offer you more efficient service.
To return the instrument in the case of repair, calibration or other maintenance,
please note the following:
Ø Pack the instrument with soft cushion like Polyethylene, so as to protect
the shell of the instrument.
Ø Please use the original hard packing box. If use other packing material,
please ensure at least 3 cm soft material cover around the instrument.
Ø Be sure to correctly fill out and return the warranty registration card, which
should including following information: company name, postal address,
contact, phone number, email address and problem description.
Ø Seal the packing box with exclusive tape.
Ø Ship to your representative or the agent of the Company in a reliable way.
79
17.4
Customer Service and Support
ADVANCED DIGITAL INSTRUMENTS SL
Address: Cardeña 9, Local 2
28053 Madrid, Spain
Tele: +34 916613037
Fax: +34 916614917
Email: [email protected]
Web: www.adinstruments.es
------------------------------------------------------END LINE--------------------------------------------------
80


![CS4 - Intelligent Monitoring System [sp].indd](http://vs1.manualzilla.com/store/data/006224417_1-374e5606c4af92a845940d0315671aa2-150x150.png)