1
Evaluation Program PCA
B 95.5099
Operating Instructions
6.00/00371594
Contents
1
Introduction
3
1.1
Preface .......................................................................................................... 3
1.2
1.2.1
1.2.2
1.2.3
Typographical conventions .........................................................................
Warning signs .................................................................................................
Note signs .....................................................................................................
Presentation ..................................................................................................
1.3
Hardware and software requirements ........................................................ 4
2
Guide
2.1
Introduction .................................................................................................. 5
2.2
Store measurement data ............................................................................. 6
3
3
3
4
5
2.3 Visualise measurement data ....................................................................... 8
2.3.1 Prepare evaluation ....................................................................................... 10
2.3.2 Open Evaluation ........................................................................................... 12
2.4
Store measurement data on any path ...................................................... 14
3
Evaluation
3.1
Introduction ................................................................................................ 17
3.2
Prepare evaluation ..................................................................................... 18
4
Open evaluation
4.1
Introduction ................................................................................................ 21
4.2
Selected time period .................................................................................. 22
4.3
Evaluation ................................................................................................... 23
4.4
Graphics area ............................................................................................. 24
4.5
4.5.1
4.5.2
4.5.3
4.5.4
4.5.5
4.5.6
4.5.7
4.5.8
Table area ....................................................................................................
Channels ......................................................................................................
Report ..........................................................................................................
Batches ........................................................................................................
Events ...........................................................................................................
Analogue: Groups... .....................................................................................
Digital: Groups... ..........................................................................................
Print ..............................................................................................................
Data export into Excel 97 .............................................................................
17
21
29
30
33
35
37
39
41
42
44
Contents
5
Communications server
47
6
Appendix
49
6.1
PC keyboard ............................................................................................... 49
6.2
Tips and Tricks ........................................................................................... 50
7
Index
51
1 Introduction
1.1 Preface
B
Keep these Operating Instructions in a place that is accessible to all users at
all times.
Please assist us to improve these Operating Instructions, where necessary.
Your suggestions will be most welcome.
Phone in Germany
from abroad
Fax
in Germany
from abroad
(0661) 6003-725
(+49) 661 6003-0
(0661) 6003-681
(+49) 661 6003-607
1.2 Typographical conventions
1.2.1 Warning signs
The signs for Danger and Caution are used in this manual under the following
conditions:
V
A
E
Danger
This symbol is used where there may be danger to personnel if the
instructions are disregarded or not followed accurately!
Caution
This symbol is used where there may be damage to equipment or data if the
instructions are disregarded or not followed accurately!
Caution
This symbol is used where special precautions must be taken when handling
electrostatically sensitive components.
1.2.2 Note signs
H
v
Note
This sign is used to draw your special attention to a remark.
Reference
This sign refers to additional information in other manuals, chapters or
sections.
Footnote
abc1
Footnotes are comments that refer to specific parts of the text. Footnotes
consist of two parts:
A marking in the text, and the footnote text.
3
1 Introduction
The marking in the text, arranged as continuous superscript numbers. The
footnote text, at the bottom of the page, in a smaller typeface, and preceded
by a number and a stop.
Handling instructions
h
This symbol marks the description of a required action.
The individual steps are indicated by the asterisk, e.g.
h Press the h key
h Confirm with E
1.2.3 Presentation
Keys
h+E
Keys are shown in a box. Both symbols and texts are possible. If a key has
multiple functions, then the text shown is the one that corresponds to the
function that is active at the moment.
Screen texts
Program
Manager
Edit!
Instrument data
Texts that are displayed in the program are indicated by italic script.
Menu items
The menu items in the program are shown in italics. Menu name, menu item,
and sub-menu item are separated from one another by “!”.
1.3 Hardware and software requirements
The following hardware and software conditions must be fulfilled for the
installation and operation of the evaluation program:
- IBM-PC or compatible PC, with Pentium and above
- 16 MB main memory
- 3.5" diskette drive
- CD-ROM drive
(for installation, and to create a set of diskettes)
- Mouse
- VGA graphics
- Windows 95/98/NT4.0
recommended
minimum
configuration
- Pentium 200
- 32MB main memory
- 200MB free space on the hard disk
4
2 Guide
2.1 Introduction
On the following pages is a guide which should clarify the principles of the
PCA evaluation program.
For a better understanding, the concept is explained by analogy with the
present chart recorder and the paper rolls with the process data.
5
2 Guide
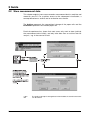
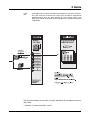
2.2 Store measurement data
This chapter explains how screen recorder measurement data is read into and
stored on your PC. For a quicker access to the subsequent visualisation, a
concept based on an archive and an evaluation was chosen.
The Archive represents the conventional storage of the paper rolls and the
Evaluation represents the unrolled paper roll.
Practical experience has shown that most users only want to store (archive)
the measurement data initially, and only take data from an archive later for
analysis, e.g. in the event of a fault.
H
6
The archive concept is arranged such that the data of several instruments
can be stored.
2 Guide
H
Evaluation of the measurement data (unpacking) can take up several minutes with extensive measurements. At this time, the data is unpacked to
approximately 8-times the data quantity. To save memory space, only
data which will be analysed in the foreseeable future should be evaluated
(unpacked).
The communications server offers a further possibility for storage of measurement data.
v Section 5 “Communications server”
7
2 Guide
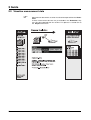
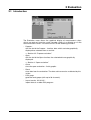
2.3 Visualise measurement data
H
8
Measurement data which are to be visualised are opened from the Evaluation.
If these measurement data are not yet available in the Evaluation, they
must first be unpacked from the archive. This process is carried out via
the Prepare menu item.
2 Guide
9
2 Guide
2.3.1 Prepare evaluation
H
10
Measurement data which are to be visualised can only be opened from
the Evaluation.
If these measurement data are not yet available in the Evaluation, they
can be unpacked from the archive into the evaluation via the Prepare
Evaluation menu item. This process corresponds to unrolling the conventional paper roll.
2 Guide
H
The time periods are copied into the evaluation by clicking on OK, i.e. no
time periods are erased from the archive through “Prepare evaluation”.
11
2 Guide
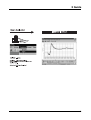
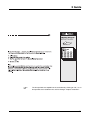
2.3.2 Open Evaluation
Evaluation
Open
12
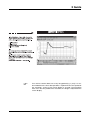
Measurement data are opened and visualised from the evaluation via Evaluation Open.
2 Guide
H
If an archive contains data over a very long period (e.g. 1 year), it is recommended that the least data possible is copied into the time period of
the evaluation, so that a fast screen display is ensured. The more data
there are in the time period of the evaluation, the longer is required for the
screen display.
13
2 Guide
2.4 Store measurement data on any path
You have the possibility of storing your measurement data in various directories. That offers the advantage that your data can be filed e.g. sorted by year
or by places of measurement (see example), or are accessible by other people
on a network (Windows NT or Novell).
Change the
standard
setting
14
2 Guide
h Call up the Defaults item in the Extras menu bar.
h In the Defaults form, change to Directories.
h You can search for the desired path by activating the
button. A new
target directory can be set up by using the right mouse button or
in the Windows Explorer.
h Click on
H
to accept the setting.
Only one path can be selected for archive/evaluation!
15
2 Guide
16
3 Evaluation
3.1 Introduction
The Evaluation menu allows the graphical display of measurement values
which are read out from the screen recorder, either via a diskette or via the
communications server. The menu consists of the following functions:
- Prepare...
with the aid of the Prepare... function, data which are to be graphically
displayed are selected from an archive.
v Section 3.2 “Prepare evaluation”
- Open
with the aid of the Open function, the selected data are graphically
displayed.
v Section 4 “Open evaluation”
- Close
close the open evaluation - finish graphic.
- Reset
clear data from the evaluation. The data archive remains unaffected by this
action.
- PCA group
generate local groups (with up to 36 channels).
- Import version 108.01.XX...
import data of an older PCA program.
17
3 Evaluation
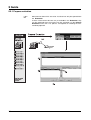
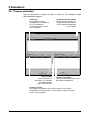
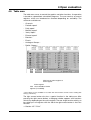
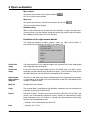
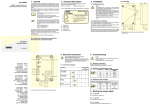
3.2 Prepare evaluation
After the Evaluation ➔ Prepare function is called up, the dialogue window
described below appears.
Instrument
All available instrument
configurations are displayed
here. A configuration
is selected using the mouse
or the keyboard.
Select periods
with the aid of these
two buttons, time periods
are copied between
archive and evaluation
Supplementary description
with the aid of this button, the
“Supplementary description”
of the selected configuration
can be edited
Periods in evaluation
all time periods indicated here can
be graphically displayed
Periods in archive
all available time periods (measurement data) of an instrument
configuration are indicated here. A time period is selected using the
mouse or the keyboard.
18
3 Evaluation
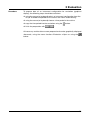
Procedure
To prepare data of an instrument configuration for evaluation (graphical
display), the following steps should be carried out:
h using the mouse (or keyboard) select an instrument configuration from the
list (all available time periods of the archive are shown automatically).
h using the mouse (or keyboard) choose a time period in the archive.
h copy the time period into the evaluation using the
h finish the preparation with
button.
.
All necessary archive data are now prepared and can be graphically displayed
afterwards, using the menu functions Evaluation ➔ Open or using the
button.
19
3 Evaluation
20
4 Open evaluation
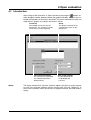
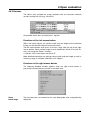
4.1 Introduction
After calling up the Evaluation ➔ Open function or pressing the
button, another dialogue window appears before the graphical display, by which the selected time period can be further restricted. The fewer measurement data are
used within a graphic, the clearer and faster it will be.
Instrument
All available instruments are displayed here. The selection is made
via the mouse or the keyboard.
Time period (maximum)
The maximum time period of
the selected evaluation is
displayed here.
Group
Group
The groups contained in the
selected instrument are displayed here.
Time period (current)
The time period which
is to be displayed
is set here.
The Group window only contains selection options for data of screen recorders with an instrument software version starting with 100 (e.g. 100.02.01). In
the case of recorders which do not have a group distinction, the field remains
empty.
21
4 Open evaluation
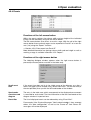
4.2 Selected time period
There are two ways to limit the time period:
- by direct input using the cursor keys and numeric keypad
- via a dialogue, which is opened by clicking the left mouse button on the
field
Year
The desired year is
selected here by a
mouse-click
Month
The desired month is
selected here by a
mouse-click
Month
Select
previous month
Month
Select
next month
Day
Select the desired day using
the mouse or the cursor keys
H
Only dates within the selected time period can be selected.
When the desired time period has been selected, the measurement data can
be graphically displayed by calling up the
22
button.
4 Open evaluation
4.3 Evaluation
This display is accessed via Evaluation ➔ Open or the
button. Before the
graphical display, a dialogue window appears, which can be used for further
limiting of the selected time period. The fewer measurement data used within
a graphic, the clearer and faster it will be.
More detailed information on time period selection is provided in Section 4.1
“Introduction” and Section 4.2 “Selected time period”.
open evaluation
close evaluation
print current window (e.g. channels or periodic report)
use left mouse button to zoom in X-direction
use left mouse button to zoom in Y-direction
use left mouse button to zoom in X- and Y-direction
use left mouse button to set guidelines
reset zoom
zoom forwards (zoom in)
zoom backwards (zoom out)
The display is divided as follows:
- a graphics area, in which the measurements are displayed, and
- a table area, which serves to control the graphic and other functions.
23
4 Open evaluation
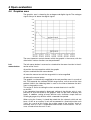
4.4 Graphics area
The graphics area is shared by the analogue and digital signals.The analogue
signals always lie above the digital signals.
The most important control element within the graphic is the mouse, with the
aid of which various functions can be performed.
Left
mouse button
The left mouse button is reserved as standard for the zoom function in the direction of the X-axis.
h position the mouse pointer within the graphic
h press and hold the left mouse button
h move the mouse to mark the range which is to be magnified
h release the mouse button
The graphic is automatically magnified to the next possible area. As a result of
this, PCA expands the selected ZOOM range further, so that one of the time
periods listed in the following table is used as the interval between the divisions in the graphics area.
This action is similar to setting the chart recorder feed rate in sec/DIV
or min/DIV.
If the complete time period is displayed, setting of the division units is suppressed, so that the whole of the graphics area can be used to display the
graph. In addition, setting of exact division units facilitates simple and fast
scrolling by page or by division within a zoomed time period.
When using the Y-zoom, it should be noted that the channels which do not
have a Y-axis or an auxiliary Y-axis will be zoomed in a fixed ratio to the main
Y-axis. As a result of this action, the scaling range of the auxiliary Y-axis or
channels with no Y-axis is expanded under certain circumstances. This ensures a fixed ratio to the main Y-axis.
24
4 Open evaluation
Thanks to this, diagram graphs appear after the Y-zoom in the same ratio to
one another as before the ZOOM.
Possible time periods per division on the x-axis:
1, 2, 3, 4, 5, 6, 7, 8, 9, 10, 15, 20, 30, 40, 45 seconds
1, 2, 3, 4, 5, 6, 7, 8, 9, 10, 15, 20, 30, 40, 45 minutes
1, 2, 3, 4, 5, 6, 7, 8, 9, 10, 12, 15, 20 hours
1, 7, 14, 60, 180, 365, 730, 1825, 3650 days
Possible range per division on the y-axis:
1, 2, 5, 10 in the corresponding resolution of the power of 10
Right
mouse button
If the right mouse button is pressed when the mouse pointer is within the
graphic, a dialogue window appears in which various functions can be selected.
Batch search
After calling up the function, a list of the available batch records appears (only
if the batch records were activated when the screen recorder was configured).
Select a batch and press
. The associated batch data will be automatically displayed over the entire width of the x-axis.
Additional functions:
-
Reduce list of available batches
-
Display batch text of selected batch
Batch info
The function shows the batch text of the displayed batch. It is only available if
the data of a specific batch has been brought into the display using the Batch
search function
Zoom forwards
Using Zoom forwards, the next zoom display can be produced again. This
function is only available if a Zoom backwards has been performed. As an alternative to the mouse, Zoom forwards can also be performed from the PC
keyboard (Page Up).
Zoom backwards
Using Zoom backwards, the previous zoom display can be produced again.
The function is only available if a zoom has been carried out. As an alternative
to the mouse, Zoom backwards can also be performed from the PC keyboard
(Page Down).
25
4 Open evaluation
Reset
zoom
Reset zoom displays the entire time period of the selected evaluation again.
As an alternative to the mouse, Reset zoom can also be performed from the
PC keyboard (Home).
H
Print
To be able to zoom using the PC keyboard, the graphics area must
be the active window. If the table area is the active window, the
mouse must first be clicked in the graphic.
After calling up the Print function, a sub-menu with additional functions appears:
- Print preview
- Print
- Printer setup
Print !
Print preview
The printout of the graphic can be previewed on screen.
Print !
Print
This function starts the printer output.
Print !
Printer setup
Using this function, various printer properties (e.g. paper size and paper orientation) can be taken into account.
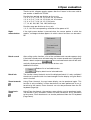
Characteristics
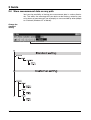
After calling up the Characteristics function, a dialogue window appears. Using the adjustable parameters, the graphical display and the function of the left
mouse button can be influenced.
26
4 Open evaluation
Characteristics !
Display ratio
No change to the settings is posible here. The data display is created automatically, depending on the X-axis zoom.
Characteristics !
Actions of left
mouse button
This feature fixes the function of the left mouse button within the graphic. With
the standard setting, the left mouse button effects a zoom in the X-axis direction.
If the “Guideline” setting is chosen, a vertical and a horizontal line appear
when the left mouse button is pressed (incl. the current values of amplitude
and time). The associated measurements are displayed in the table area (Table
Channels must be active).
H
The positioning of the guideline occurs with reference to the “actual measured value”, i.e. it can deviate from the visual course of the
graph if there are more measured values than are actually displayed.
The guideline can also be moved from the PC keyboard using the key combinations Shift-Cursor left or Shift-Cursor right.
H
The functions of the left mouse button can also be operated via the
toolbar of the software.
Guideline
Zoom X+Y-axis
Zoom Y-axis
Zoom X-axis
Characteristics !
Font size
This setting allows the size of the scaling of the X- and the Y-axis to be
changed .
Characteristics !
Zoom
This setting can be used to influence the marking of a range to be expanded.
Either continuous marking (any) or marking at fixed intervals (divisions) can be
selected.
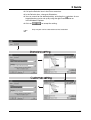
Characteristics !
Increase speed
The “Do not display measurements” and “Do not draw in background” functions are not checked with a
as standard, i.e., they are active. The number
of measurements which can be displayed on the screen is limited to 200 per
channel.
27
4 Open evaluation
Do not display measurements
If the mouse pointer is placed on a measurement within a graphic and not
moved any more, a window appears with the current values of amplitude and
time.
After a few seconds the window disappears again. By turning off the ( ) function, the evaluation program has fewer arithmetic tasks to perform and is
therefore slightly faster.
Do not draw in background
With the standard set up, the picture for the user is not visibly prepared and
then suddenly introduced (drawn in background). By selecting “Do not draw in
background” the graphic is displayed on line on the screen. The line of the
graph can be followed as it is “drawn”. This form of display is slightly faster
than a display in the background.
The difference between the two display forms is only significant with very large
quantities of data.
Maximum number of displayed measurements per channel
The figure selected here (10 — 10 000) sets the number of measurements to
be displayed per channel. The higher the figure is, the more measurements are
displayed in the graphic. The lower the figure is, the fewer measurements are
displayed.
H
Characteristics !
Display all measurements
28
Caution: If too small a number of measurements is selected, the
graphic may well be faster, but the line of the graph can only be
partly made out with reference to the actual measurements.
Only every nth measurement will be displayed as standard (according to the
zoom factor). This also applies to the print preview and the printout. By checking the the “Printout” und “Print preview” tick boxes you can force all measurements to be printed or displayed.
4 Open evaluation
4.5 Table area
The table area serves to control the graphic and other functions. Its operation
is based on spreadsheet calculation programs. The area consists of several
registers, which are introduced or removed depending on availability. The
maximum available are:
- Channels
- Periodic report*
- Daily report*
- Monthly report*
- Yearly report*
- External report*
- Batches*
- Events
- Analogue: Groups...
- Digital: Groups...
Click here to select register as
active register
Active register
Click here to introduce further
registers (if available)
* These tables are only available for recorders with an instrument software version starting with
100 (e.g. 100.02.01).
The right mouse button also has a special function in the table area. After
pressing the right mouse button, a dialogue window appears with functions
which vary depending on the active register. The one single function which can
be called up in all registers with the aid of the right mouse button is the Print
function.
v Section 4.5.7 “Print”
29
4 Open evaluation
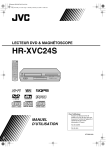
4.5.1 Channels
Display channel
Channel colour
Line type
Line thickness
Y-axis type
Ratio of displayed measurement
to actual measurement
Display of
channel unit
Channel name
Group name
Start of scale
End of scale
Channel description
Peak value
display
Minimum values as a separate curve
Maximum values as a separate curve
On screen recorders with an instrument software version that does not start
with 100, two measurement curves are always available. The LOW curve includes the data for the acquisition types average value, momentary value,
minimum value, maximum value, and the minimum value for peak value measurement. The HIGH curve only contains the maximum values for peak value
measurement.
30
4 Open evaluation
Functions of the left mouse button
Display
channel
Each channel can be introduced or removed. Only channels which are marked
by a
are displayed in the graphics area.
Channel colour
The colour in which the measurements and channel-related data are displayed
is selected here. The selection affects both the graphic and the table area.
Line type
The type of display (specific to each channel) is selected here.
Point+Line
Line
Stepped line
Line thickness
The line thickness for the representation of the curve can be selected here.
Y-axis type
The type of axis for a channel can be selected here. The choices available are:
- Main Y-axis
It should be noted here that there can only ever be one channel with a main
Y-axis. The Y-axis is located on the left-hand edge of the screen.
- Auxiliary Y-axis
The auxiliary Y-axis is located to the right of the main Y-axis. The scaling is
adapted to the main Y-axis.
- No Y-axis
No Y-axis is displayed for the selected channel.
Displays (not directly changeable)
Ratio of
displayed
measurements ...
The current display factor is displayed here. The factor changes when measurements are zoomed.
Display of
channel units
The channel units configured on the instrument appear here.
Channel name
The channel name configured on the instrument appears here.
Group name
The group name configured on the instrument appears here.
Start of scale
The start of scale configured on the instrument appears here.
31
4 Open evaluation
End of scale
The end of scale configured on the instrument appears here.
Channel
description
The channel description configured on the instrument appears here.
Functions of the right mouse button
In the channels register, the function of the right mouse button is simply to
print out the graph of the displayed measurement.
More detailed information on the Print function is given in Section 4.5.7 “Print”.
32
4 Open evaluation
4.5.2 Report
The table is only available for screen recorders with an instrument software
version starting with 100 (e.g. 100.02.01).
The report register (statistics) differentiates between:
- Periodic report
- Daily report
- Monthly report
- Yearly report
- External report
The individual registered reports for all channels are shown, including period,
minimum, maximum and average value.
Functions of the left mouse button
With the aid of the left mouse button, the column width and row height can be
altered within the report register.
Alter column width:
h Position the mouse between two columns
h With the left mouse button pressed, alter the column width by dragging the
mouse
h Release the mouse button
Alter row height:
h Position the mouse between two rows
h With the left mouse button pressed, alter the row height by dragging the
mouse
h Release the mouse button
The left mouse button also serves to mark a range. With the aid of the right
mouse button these marked ranges can be exported in Excel 97 or text format
using the “Export” function.
Mark range:
h Position the mouse in an entry
h With the left mouse button pressed, select a range by dragging the mouse
h Release the mouse button
33
4 Open evaluation
Mark column:
h Position the mouse in the column heading (
)
h Press the left mouse button
Mark row:
h Position the mouse in the left-hand column of the row (
)
h Press the left mouse button
Additional keys:
With the aid of the shift key and the left mouse button, a range covering several rows/columns can be marked. Using the control key and the left mouse button, additional rows/columns can be marked.
Functions of the right mouse button
The following dialogue window appears when the right mouse button is
pressed (the mouse pointer must be in the table area).
Zoom time
range
The measurements of the selected report are zoomed to the next displayable
area and graphically displayed.
Scroll time
range
If the start time of the report does not lie in the visible area, e.g. after a zoom,
the graph can be shifted using “Scroll time range”, so that the start time (or the
next possible) lines up with the left hand border of the window.
Synchronize
time range to
diagram
The entry in the table area which corresponds to the displayed measurement
is searched for and started. The time information at the left hand border of the
window is important here.
Mark all
All table data are marked.
Copy
The marked data is copied onto the Windows clipboard and can therefore be
imported, e.g. directly into Excel 97.
Export
Using the “Export” function, data can be stored in either Excel 97 or Text (*.txt)
format, and subsequently processed further. Export of measurements takes
place oriented by row. If a column is marked, the measurements of the other
columns will be exported as well.
v Section 4.5.8 “Data export into Excel 97”
Print
34
v Section 4.5.7 “Print”
4 Open evaluation
4.5.3 Batches
The table is only available for screen recorders with an instrument software
version starting with 100 (e.g. 100.02.01).
All recorded batch files are listed in this register.
Functions of the left mouse button
Within the batch register, the column width and row height of the individual
listings can be altered using the left mouse button.
The left mouse button also serves to mark a range. With the aid of the right
mouse button, these marked ranges can be exported in Excel 97 or text format (*.txt) using the “Export” function.
v Section 4.5.8 “Data export into Excel 97”
More detailed information on altering column width and row height as well as
marking a range is available in Section 4.5.2 “Report”.
Functions of the right mouse button
The following dialogue window appears when the right mouse button is
pressed (the mouse pointer must be in the table area).
Zoom
batch range
The measurements are zoomed to the next displayable area and graphically
displayed.
35
4 Open evaluation
Scroll
batch range
If the start time of the batch data does not lie in the visible range, e.g. after a
zoom, the graph can be shifted using “Scroll batch range”, so that the start
time (or the next possible) lines up with the left hand border of the window.
Synchronize
batch range
and diagram
The entry in the table area which corresponds to the displayed measurement
is searched for and started. The time information at the left hand border of the
window is important here.
Search batch
The “Search batch” function allows specific batch files to be found. The
search can be made easier by selecting various criteria. If no criteria are given,
all batch files will be searched.
Before a search criterion can be fed in, it must be activated. Active search criteria are recognizable by the check .
Continue batch
search
The “Continue batch search” function, which is only available after a “Search
batch” function has been carried out, repeats a defined search for specific
batch files.
Batch options
The list of available batches can be reduced by using “Batch options”.
Before an option can be fed in, it must be activated ( ).
Batch info
Using “Batch info”, the batch information of the selected batch is displayed.
Using the ENTER, ESC keys, or by clicking on the
button, the information
window is closed again.
Mark all
All table data are marked.
Copy
The marked data is copied onto the Windows clipboard and can therefore be
imported, e.g. directly in Excel 97.
Export
With the aid of the “Export” function, data can be stored in either Excel 97 or
Text (*.txt) format, and subsequently processed further.
Export of measurements takes place oriented by row. If a column is marked,
the measurements of the other columns will be exported as well.
v Section 4.5.8 “Data export into Excel 97”
Print
36
More detailed information on the Print function is available in Section 4.5.7
“Print”.
4 Open evaluation
4.5.4 Events
Functions of the left mouse button
Within the events register, the column width and row height of the individual
listings can be altered by using the left mouse button.
The left mouse button also serves to mark a range. With the aid of the right
mouse button these marked ranges can be exported in Excel 97 or in text format (*.txt) using the “Export” function.
v Section 4.5.8 “Data export into Excel 97”
More detailed information on altering column width and row height as well as
marking a range is available in Section 4.5.2 “Report”.
Functions of the right mouse button
The following dialogue window appears when the right mouse button is
pressed (the mouse pointer must be in the table area).
Scroll event
time
If the event time does not lie in the visible range of the diagram, e.g. after a
zoom, the graph can be shifted using “Scroll event time”, so that the time (or
the next possible) lines up with the left hand border of the window.
Synchronize
event time and
diagram
The entry in the table area which corresponds to the displayed measurement
is searched for and started. The time information at the left hand border of the
diagram window is important here.
Event filter
The list of displayed events can be reduced by using “Event filter”.
For example, if the “System Messages” field is deactivated ( ), then, amongst
others, the “New configuration” as well as the “Power on” and “Power off”
messages will not be displayed.
37
4 Open evaluation
Mark all
All table data are marked.
Copy
The marked data is copied onto the Windows clipboard and can therefore be
imported, e.g. directly into Excel 97.
Export
With the aid of the “Export” function, data can be stored in either Excel 97 or
Text (*.txt) format, and subsequently processed further.
Export of measurements takes place oriented by row. If a column is marked,
the measurements of the other columns will be exported as well.
v Section 4.5.8 “Data export into Excel 97”
Print
38
More detailed information on the Print function is available in
Section 4.5.7 “Print”.
4 Open evaluation
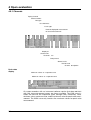
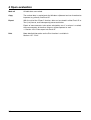
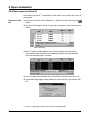
4.5.5 Analogue: Groups...
The measurements of the analogue inputs are listed in this register.
<<<< = below measurement range
>>>> = above measurement range
Functions of the left mouse button
Within the analogue data register, the column width and row height of the individual listings can be altered by using the left mouse button.
The left mouse button also serves to mark a range. With the aid of the right
mouse button these marked ranges can be exported in Excel 97 or text format
(*.txt) using the “Export” function.
v Section 4.5.8 “Data export into Excel 97”
More detailed information on altering column width and row height as well as
marking a range is available in Section 4.5.2 “Report”.
Functions of the right mouse button
The following dialogue window appears when the right mouse button is
pressed (the mouse pointer must be in the table area).
Scroll time
If the measurement for a date/time does not lie in the visible area, e.g. after a
zoom, the graph can be shifted using “Scroll time”, so that the time (or the
next possible) lines up with the left hand border of the window.
Synchronize
time with
diagram
The entry in the table area which corresponds to the displayed measurement
is searched for and started. The time information at the left hand border of the
window is important here.
39
4 Open evaluation
Mark all
All table data are marked.
Copy
The marked data are copied onto the Windows clipboard and can therefore be
imported, e.g. directly into Excel 97.
Export
With the aid of the “Export” function, data can be stored in either Excel 97 or
Text (*.txt) format, and subsequently processed further.
Export of measurements takes place oriented by row. If a column is marked,
the measurements of the other columns will be exported as well.
v Section 4.5.8 “Data export into Excel 97”
Print
40
More detailed information on the Print function is available in Section 4.5.7
“Print”.
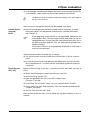
4 Open evaluation
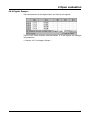
4.5.6 Digital: Groups...
The measurements of the digital inputs are listed in this register.
There are the same functions and possibilities as in the register for analogue
measurements.
v Section 4.5.5 “Analogue: Groups...”
41
4 Open evaluation
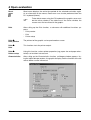
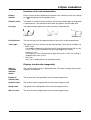
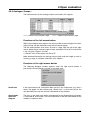
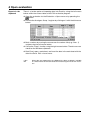
4.5.7 Print
When the “Print” function is called up, the following dialogue window appears
initially.
Print preview
The “Print preview” function permits a document to be previewed on screen
before it is printed. Depending on the active register, further selection possibilities appear before the print preview, e.g. which data should be displayed.
Print
Starts the print process. Please note that when the display is zoomed, several
pages may be printed out.
Header /
Footer
Headers and footers can be defined here. Any character strings and instrument-specific variables are available.
Select font name and size
Set cells for text and
control elements
Set first page
number
Set paper margins
Switch over to header
area
Instrument-specific variables are introduced by a “$”- or by a “#”-sign.
42
4 Open evaluation
The following variables are available:
$P
Current page number
$N
Number of pages
$D
Current print date
(time and date)
$D{%d.%m.%y}
Current print date
(date only)
$F
Evaluation name
$A
Program name
$R
Register name
#DEVICE
Device name
#DESCRIPTION
Additional description
#GROUP
Group name
#TIME
Current time
#DATE
Curent date
#START_TIME
Start time of the evaluation
#START_DATE
Start date of the evaluation
#STOP_TIME
End time of the evaluation
#STOP_DATE
End date of the valuation
Within the “Batch” register appear:
#CHARGE_LEFT0 …
#CHARGE_LEFT9
Batch data name
#CHARGE_RIGHT0 …
#CHARGE_RIGHT9
Batch data
Page setup
The “Page setup” function offers additional control of the visual appearance of
the print out.
Printer setup
The “Printer setup” function calls up a dialogue window from Windows, in
which, amongst others, the paper format and the paper orientation (portrait,
landscape) can be selected.
43
4 Open evaluation
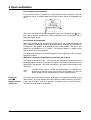
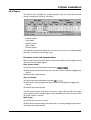
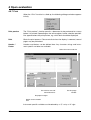
4.5.8 Data export into Excel 97
Data export into Excel1 is explained in more detail in this section by means of
an example.
Export as a data
file
h Open the evaluation via the Evaluation ➔ Open menu or by pressing the
button.
h Activate the Analogue: Group 1 register by clicking on it with the left mouse
button.
Row numbering
h Mark a range by holding down the left mouse button and moving the
mouse downwards over the row numbering. Release the mouse button
when the desired range is marked.
h Press the right mouse button and call up Export and then Excel 97 (*.xls).
h In the following dialogue choose Selected measurements and confirm with
OK.
1. Excel is a registered trademark of the Microsoft Corporation
44
4 Open evaluation
h In the dialogue window which follows, the path can be selected and the file
name entered, under which the data will be stored in Excel format.
A
The data file cannot be stored if the data file already exists and is open at
the same time in Excel.
After successful storage the data file can be opened using Excel.
Further processing with
Excel
h Start Excel and open the previously stored data file. Normally, an empty
worksheet (table 1) will be opened. Change to the required worksheet
(e.g. Group1_1).
H
At the beginning of the data file is a 8-digit header followed by the
measurement data. The total length (header and data) can not exceed 65536 rows. If there are more measurement data than this in
the PCA evaluation program, they are automatically divided into a
number of tables.
If the data in Excel is to be graphically displayed or calculated, it
must first be converted.
h Mark the data to be converted (e.g. a column).
h The Text Assistant must be started via the Excel Data ➔ Text in columns...
menu.
h By selecting Fixed width and operating the END button, transfer the data
into a number format. The data are now available for graphical display or
calculation.
Export by text
file (*.txt)
Export to Excel using a text file is particularly useful with older versions of
Excel.
h Within the PCA program, export the data into a text file.
h Start Excel (e.g. Version 5.0).
h Open the generated text file via the File ➔ Open menu
(File type = Text file).
h In the Excel Text Assistant, steps 1 to 3 are confirmed with “Further”.
h During steps 2 to 3 the field-separator “Tab” must be deactivated and the
“Comma” activated.
h Quit the Text Assistant with “End”.
Now the data of the text file is also available for a graphical display or for calculation.
45
4 Open evaluation
Export via the
clipboard
There is a further option of importing data into Excel by using the left mouse
button within the various tables of the PCA evaluation program.
h Open the evaluation via the Evaluation ➔ Open menu or by operating the
button.
h Activate the Analogue: Group 1 register by clicking on it with the left mouse
button.
h Mark a column by moving the mouse over the column title (e.g. Chan. 1)
and pressing the left mouse button.
h Call up the “Copy” function using the right mouse button. The data are now
stored on the Windows clipboard.
h Start Excel, open a worksheet, and insert the data in the worksheet with the
aid of the Excel Edit ➔ Insert menu.
H
46
When data are exported via the clipboard, the data are directly available
in number format and need not be converted using the Excel Text Assistant.
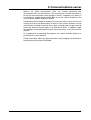
5 Communications server
Section 2.2 “Store measurement data” has already described how
measurement data can be read into a PC and archived. A further possibility is
to use the communications server program, which is supplied as an option. It
is available for reading measurement data out of the screen recorder via the
serial interface (RS232, RS422 or RS485).
Compared to data storage on diskette, the communications server has the advantage that the measurement data of one or more screen recorders can be
automatically archived at specific times. So it is conceivable that data backup
could take place during the night or at other break times. In addition, larger
time periods can be generated using the communications server than with the
diskette.
As a prerequisite for operating the program, the screen recorder used has to
be fitted with a serial interface.
Further information about the communications server program can be found in
the Operating Instructions B 95.5098.
47
5 Communications server
48
6 Appendix
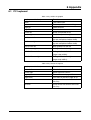
6.1 PC keyboard
Table 1: Keys within the graphic
Key (key combination)
Function
Home
Take zoom back
End
Restore previous zoom setting
Page Up
Zoom forward
Page Down
Zoom backwards
Cursor left
Scroll time period to left
Cursor right
Scroll time period to right
Ctrl-Cursor left
Scroll time period to left
(by one complete window width)
Ctrl-Cursor right
Scroll time period to right
(by one complete window width)
Shift-Cursor left
Shift guideline to the left
Shift-Cursor right
Shift guideline to the right
Shift-Ctrl-Cursor left
Shift guideline to the left
(larger step widths)
Shift-Ctrl-Cursor right
Shift guideline to the right
(larger step widths)
Table 2: Keys within the register
Key (key combination)
Function
Cursor left
Move left one column
Cursor right
Move right one column
Page Up
Turn over to next page of list
Page Down
Turn back to previous page of list
Ctrl-Home 1
Jump to the first column of the first
list entry
Ctrl-End
Jump to the last column of the last
list entry
49
6 Appendix
6.2 Tips and Tricks
- If a number of users share an archive directory, and if the archive directory
is accessed by a number of PCs simultaneously, all the PCs should have
been set to the same time. If there are significant differences between time
settings ( > 6 minutes), problems can arise with the management of user
interlocks.
- A time adjustment (e.g. summer time/winter time) should only be made
when PCA and the communications server are not running.
If the clock is put back by 1hr, all instruments with a short cycle time
(e.g. hourly or shorter) should be read in once manually (using the
button in the unit list), as otherwise the next read event moves
back by 1hr. After the read-in, the communications server accepts the
current time again.
- The automatic adjustment facility from summer time to winter time should
not be used, as under certain circumstances the data for the additional
“changeover hour” cannot be evaluated by PCA.
- Before accessing the hard disk, PCA and the communications server check
that at least 10MB of free disk space is available. However, this check
cannot safeguard all possible system configurations and PCA applications.
For this reason, when working with PCA or Windows, it is recommended
that approx. 100 MB of free hard disk memory is available in the program
directory.
- If data are recorded on a CD and copied back to the hard disk at a later
time, the “write protected” file attribute must be reset again. This can be
done under Windows 95 with the help of Explorer.
50
7 Index
A
alter
column width33
row height33
archive6
B
batches2535
C
channel30
channel colour31
channel, displaying31
D
data export44
display ratio27
E
evaluation68101718
evaluation ... open122123
export44
F
font size27
G
graphics area2324
graphics characteristics26
K
keys4
L
line thickness31
line type31
M
mark
51
7 Index
column34
range33
measurement data, archiving647
measurement data, saving647
measurement data, visualising8
minimum configuration4
N
note signs3
O
open evaluation12
P
peak value display30
prepare8
presentation4
print2642
S
screen texts4
speed27
T
table
analogue data39
batches35
channels30
digital data41
events37
report33
table area2329
time period22
Y
Y-axis type31
Z
zoom2325
52
M. K. JUCHHEIM GmbH & Co
JUMO Instrument Co. Ltd.
Street address:
Moltkestraße 13 - 31
36039 Fulda, Germany
Delivery address:
Mackenrodtstraße 14
36039 Fulda, Germany
Postal address:
36035 Fulda, Germany
Phone: +49 (0) 661 60 03-0
Fax:
+49 (0) 661 60 03-5 00
E-Mail: [email protected]
Internet: www.jumo.de
JUMO House
Temple Bank, Riverway
Harlow, Essex CM20 2TT, UK
JUMO PROCESS CONTROL INC.
735 Fox Chase,
Coatesville, PA 19320, USA
Phone: 610-380-8002
1-800-554-JUMO
Fax:
610-380-8009
Phone: +44 (0) 1279 63 55 33
E-Mail: [email protected]
Fax:
+44 (0) 1279 63 52 62
E-Mail: [email protected] Internet: www.JumoUSA.com