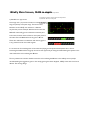
1
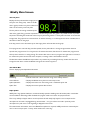
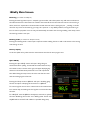
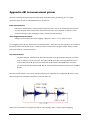
10EaZy User Guide
Version 2.2
Table of Contents
10EaZy – A word from the inventor .............................................................................................. 3
System requirements and installation ............................................................................................. 4
The Setup Screen ................................................................................................................................ 6
The Setup Screen - Running order ................................................................................................. 9
10EaZy Main Screen ......................................................................................................................... 10
10EaZy Main Screen, MAM in depth ............................................................................................ 13
10EaZy Main Screen, The warning dialogs .................................................................................. 15
10EaZy WebViewer and MobileViewer....................................................................................... 17
The 10EaZy LogFile ......................................................................................................................... 20
Installing the 10EaZy sound card driver....................................................................................... 21
Calibrating 10EaZy ............................................................................................................................ 22
Appendix: dB! A measurement primer ........................................................................................ 23
10EaZy – A word from the inventor
We realize that you made a choice to buy 10EaZy over many other qualified solutions.
We wish to thank you for doing so, and hope that 10EaZy will provide you with years of simple and reliable
measurements.
10EaZy was created as a response to my experiences as a touring sound engineer, meeting a lot of different dB limits
and an equal amount of more or less user-friendly dB measurement device and situations.
A lot of the dB limits are based around “Leq” measurements, typically with periods of 15 to 60 minutes.
To put it very simple, Leq values are just an average over time, meaning that it indicates the average sound level for a
given period of time. A typical way of writing this could be LAeq 15min = 96 dB.
What this really means is that in the last 15 minutes the average sound pressure level has been 96 dBA.
Leq limits are great for mixing music, as they provide an option for variations in the level in accordance with the
dynamic of the music.
However Leq limits also introduce a problem. When the dB value is based on an average of say 15 minutes, there is a
sudden amount of inertia before changes in the instantaneous level is reflected in the Leq value.
If the sound level is increased, the average doesn’t jump to this new value, but gradually grows towards it.
In the same way reducing the volume results in a gradual reduction of the Leq value.
The typical device measuring the average level at a concert does not provide any information to counter this fact and
leaves the engineer guessing where he will end up - not because they are poorly made, but simply because they are
designed to measure and document the noise emitted from factories, machines etc, and here it doesn't really matter
what the value is as long as it is measured correctly. A sound engineer mixing at a stage with dB limits on the other
hand do care about where the value will end as we need to ensure that artist we're mixing is presented with a sound
level and fidelity that serves the genre right.
The way 10EaZy approaches this problem is to think of the Leq as a bank account.
The dB limit equals the zero on the bank account, which is never to be exceeded.
Every second an amount of “dB money” is put into the account. The rate at which the money is inserted equals the
average sound level defined by the dB limit. When playing, an amount is withdrawn by the sound engineer / DJ at a
rate equal to the average level he is playing at. Now there is nothing wrong in withdrawing faster than the insertion
rate, i.e. play louder than the stated average, if it is only done for a limited amount of time. But to avoid exceeding the
limit, the rate of withdrawal will then have to lowered at some other point to compensate for this “dB money”
overspending.
Using the “bank account” approach, 10EaZy presents a user interface to the person controlling the overall volume of
an event with an instant overview of the current withdrawal rate plus a number of other useful informations, ensuring
that everyone involved, from the engineer who has the hand on the fader to the local environmental officer, are in
agreement of how loud this show is, and whether that is too loud or within the given limits. Peace of mind to
everyone involved and focus on mixing a good sounding show, instead of discussing sound levels in the middle of the
guitar solo!
Jacob Navne, Inventor of 10EaZy and C.E.O of SGAudio Aps
System requirements and installation
Minimum system requirements:
A PC running either XP or Windows 7 – the better the PC is performing the smoother 10EaZy will operate.
For hardware sold prior to October 2010 we cannot guarantee the measurement accuracy on windows 7 and Vista.
Please follow the steps described in the installer closely to ensure a proper setting of the windows control panel
sliders. For hardware sold after oct 2010 (shipped with version 2.0 software) both XP and Win7 are fully supported.
One available USB2.0 socketA screen resolution of at least 1024*600 pixels.
Installing is as simple as double clicking the setup.exe file on the CD-rom
Please note! To ensure a reliable performance it is highly recommended to use 10EaZy on a standalone PC
dedicated to this task, and to not run other applications at the same time.If 10Eazy is having trouble getting samples
fast enough from the sound card a warning dialog will appear.If the dialog keeps appearing please reduce the amount
of non-10EaZy tasks.
Setting up 10EaZy
10EaZy is tied to the dedicated 10EaZy hardware and will only start if this sound card is properly connected.
10EaZy will locate the sound card automatically at program start.
If 10EaZy cannot find the sound card an error dialog will be displayed.
Please make sure that the sound card is connected to an USB2.0 port.
Please check that the system time of the computer matches the actual time, as this information is passed to the
10EaZy file log for reference.
Connect the supplied microphone to the sound card input with a lit LED and allow for a settle time of at least 30
seconds after power up before starting the program.
Mounting the microphone
To ensure precise measurements it is important that the supplied microphone is mounted in a free field, i.e. as far
away from reflecting surfaces as possible, and that the microphone is pointing towards the source that is providing the
“noise” to be measured. A practical solution might be hanging it from the ceiling. Please consider using a windscreen if
dust and smoke is heavily present in the environment surrounding the microphone.
The user interface
The Setup Screen
After program load has completed the first screen is the setup screen.
User information
Filling out these fields are highly recommended as this
information is used in the 10EaZy log file.
Creating a log file is mandatory or 10EaZy won’t be
able to continue.
We recommend to not use removable drives, such as USB sticks, as path to a log file.
The user information is stored in a configuration file, so if the same person operates 10EaZy all the time, this
information only needs to be entered at the first program run.
If the path is too long to be displayed, it is possible to scroll in the text using the keyboard arrows.
Auto-start feature
Once the fields in the user information have been filled out, 10EaZy will skip the setup screen and start the
measurements right away on future program launches. This is very useful in a fixed installation, as putting the 10EaZy
shortcut in the Windows™ “start-up” folder will ensure that measurements starts automatically.
If you at a later point wish to change information entered in the setup screen, please click the 10EaZy logo at the
dialog that opens when 10EaZy is loading.
The Setup Screen
Leq limit setup (Not available with 10EaZy DIN)
Specify the actual dB limit and Leq period.
Minimum period is 3 minutes. If the Leq limit is disabled, the
program will run as a normal logging sound level meter.
If your system is purchased with the optional DIN feature (only applicable in Germany), the DIN15905-5 button will
be available, and if enabled the Leq limit setup will be locked to the required fixed 30 minute / 99 dBA average
specified by the DIN15905-5 standard.
Running order (not available with 10EaZy RT and SW)
Here you can enter the events that are scheduled during a measurement run. The entries are put in the log file
alongside the measurement values. This is a very useful feature because it makes post processing of the log file a whole
lot easier. Using the running order is described in details later in this manual.
Recalibrate
The “ReCalibrate” button opens a new dialog where it is possible to check the input signal and if required recalibrate
the 10EaZy system using a IEC60942 compliant calibrator providing a 1 kHz sine wave – please note that calibration
using 250 Hz is not supported.
Please check the chapter “Calibrating 10EaZy” for details on calibrating the system.
Note on calibration
How often the 10EaZy system needs calibration is a matter of local rules and standards. If measurements are to be
performed in strict compliance with IEC61672, the system needs to be calibrated with a class 1 calibrator prior to
every measurement. We recommend that a pattern evaluation test according to IEC61672 is performed at a certified
calibration laboratory once a year.
E-mail Setup
Enter E-mail addresses to automatically receive a copy of the 10EaZy measurement log file, whenever a user quit
10EaZy. 10EaZy uses a dedicated SMTP server for outgoing mail, so you will receive the log files no matter what
network provider 10EaZy connects to.
If no network is available 10EaZy will display an error dialog when trying to send the e-mail to warn of the problem.
Launch 10EaZy
Pressing the “Start Measurement” button will close the setup screen and launch the main 10EaZy application.
If a log file was not created an error dialog will appear requesting that a log file is created.
The Setup Screen
Auto-naming feature
For ease of use 10EaZy has an auto-naming feature of the log file. On the first run after the installation please create a
log file manually in a folder of your choice. From then on 10EaZy will remember the path to the folder you chose and
automatically generate a file name containing the date and time in that folder on every program launch.
If a different file name is desired please click the folder icon and define a different name.
This enables 10EaZy to run without any user interaction, if placed in the windows start up folder.
Doing so will automatically launch 10EaZy once the computer has booted, and we designed the software to “catch”
when windows is shutting down, so just press the power button to shut down windows, then 10EaZy will close as
well, and send the log file via e-mail if properly configured.
The Setup Screen - Running order
Pressing the “Running order” button opens a new dialog. (not available with 10EaZy RT)
This is a user defined list of acts or events to play within the expected measurement period.
The entries in the running order will be added to the 10EaZy log file and makes it very easy to distinguish different
elements of a show – for instance “support”, “head liner” or the likes.
Simply click the “Add Event” button to enable inputs for band name, start time and duration – once filled out press
the “Add” button, and you're good to go. Repeat this procedure for every entry needed.
If you wish to edit the running order click on of the existing entries in the list and either edit or delete the entry.
If you are using 10EaZy for continuous shows with the same schedule every day, you may press the “repeat” option in
the lower left corner – doing so tells 10EaZy to reuse the running order, and the next time you start the program, the
entries will have the same names and start time, but the date will be updated to “today”..
If you need to close 10EaZy in the middle of a measurement and the running order still contains entries that will
happen sometime in the future, they will be saved too, and when you restart the program they will still be there.
A dialog will inform about this at program start, and if you do not want to “recycle” your entries you will need to
erase them manually in the running order window.
It is possible to add / edit and delete entries at the setup screen, and also at the main 10EaZy window.
10EaZy Main Screen
From top to bottom of the screen the following pages will describe the features of the 10EaZy user interface.
We kindly refer to the appendix of this manual describing dB & Leq measurements in case any of the terms used in
this chapter should be unfamiliar.
The main display
Pressing the
button selects the display mode. Here it is possible to select which measurement results
should be displayed on screen. A selection of the most common measurement methods are available.
Changing this display does not affect the results logged to file.
The MAM
One of the main features of 10EaZy.
This display will constantly update during
the measurement indicating in clear green
and red, how the average level over a few
seconds compares to an “ideal” average
based on the dB limit
The MAM is described in details later in this manual.
10EaZy Main Screen
The Leq area
Displays the Leq value with the average period
set by the user during setup. Next to the dB
value a graph provides a very clear indication of
what is in the memory of the Leq value.
The Leq value is the average calculated by the
dots on the graph. Every green dot represents a 1-minute average value. The graph is very useful, because it provides
the person controlling the sound level with an easy way of knowing if there is “money left in the bank” to increase the
average level. The graph will as a minimum show 15 minutes of history, i.e. if the Leq period is set to 3 minutes, there
will still be 15 dots on the graph.
If the Leq period is set to 30 minutes (as on this image), there will be 30 dots on the graph.
From program start until a full Leq period has passed, the Leq value will be a running average based on the time
expired since program start. For a Leq period of 15 minutes this means, that the first 15 minutes after program start
the Leq value is based on a running average. This ensures that even in case of a program start right before a concert, if
for instance the power has been lost to the computer, an average value is still available at all time.
The Red line indicates the dB limit and provides a very intuitive way of checking how many minutes the short term
average has been above / below the dB limit average in the current Leq period.
The Status Bar
This bar displays system dependent information.
UnderRange
– Indicates if the level is below the linear range of the 10EaZy hardware
Current dB Limit
– Displays the dB limit set by the user at the setup screen
System Information
– Displays band name from the running order + additional system info
System Time
– Displays the current system date and time
Input peaks:
10EaZy has a large dynamic headroom, and should be fully capable of handling even the loudest peaks, if used under
normal conditions. According to IEC standards the program needs to be reset if an input peak occurs.
This is very unlikely to happen and for normal operation this will usually only happen in case an object hits the
microphone or the cable is unplugged during measurements – or if pyro technics are used in proximity of the
microphone. If a peak occurs a warning dialog is displayed on the screen.
The measurement will continue, but if strict IEC61672 compliance is required, 10EaZy needs to be restarted by the
user. In case of an input peak – an entry will be made to the “event log”.
10EaZy Main Screen
Event log (not available with 10EaZy RT)
Pressing the event log button opens a “notepad” type of window, where the operator may add notes of relevance to
the measurement such as loud events not related to the measured show. If there has been entries in the event log it
will be stored as a separate file in the same folder and with the same name as the log file plus “_eventlog” in the file
name. For easy access to the event log, you may press “space bar” in any 10EaZy window, to bring the event log to
front. In case an input peaks occurs an entry will automatically be made to the event log including a time stamp, even if
the event log window is not open.
Running order (not available with 10EaZy RT and SW)
Pressing the “Running Order” button opens a separate window enabling the user to add or edit entries to the running
order during run-time.
History display
A real time update of key values from the measurements stored to file since program start
Quit 10EaZy
Pressing the “Quit 10EaZy” button will open a dialog asking for
confirmation before quitting. If confirmed the measurement will stop
and a status screen, as shown on the right, will appear displaying key
values from the measurement performed. If an e-mail recipient has
been added during the setup screen, this is the time that the e-mail
with the resulting log file will be sent.
Pressing the “Dump Screen to JPEG file” will open a file dialog giving
the user the option of dumping this screen shot as a JPEG file.
To some it might be nice to have a reference file of the measurements,
if for instance they are handing over the log files to someone else after
the event.
For 10EaZy RT users this JPEG has already been created as it replaces
the more detailed log file from the “real” 10EaZy system. For RT users
the JPEG will be send via E-mail if address is specified during setup.
MAM is in zero indicating that the average level matches the
average defined by the dB limit
10EaZy Main Screen, MAM in depth
Leq graph showing very little variation in the average level
(Values between 100 – 101 dB(A)
One of the main features of 10EaZy is the MAM, an abbreviation of maximum average manager.
The MAM takes a short term average, approx. 30 seconds, and compares it to the average stated in the dB limit.
If the short-term average is louder than the limit, the red lights will illuminate, if it is below the limit average, the green
light will illuminate, indicating how far the current average is from the limit average.
This display only makes sense during music, as the audience noise between songs is most likely to be below the dB
limit average. Please note that green lights are not an encouragement to turn up the overall volume during music!
The MAM introduces a whole new level of information to the user. A very common problem when dealing with Leq
limits is the start of a show, especially at festivals and other events where a sound check is not performed on the main
PA before actual show time. When the band starts to play the sound engineer has no way of knowing if he is too loud
or could be louder. With the MAM this is history. Right after show start, the sound engineer will get a clear indication
of his average level. He can then go on adjusting the level as appropriate. This completely eliminates the situation
known by many sound engineers where they have to make dramatic changes in the overall level half way thru the
show because values are turning red.
Two examples to demonstrate the usage of MAM:
1) Hip-Hop or DJ act with music featuring little variation in dynamic:
Highly compressed music genres like hip-hop or dance music, typically
aims at an “as loud as it gets” philosophy. This means that there will
be very little variation in the average level during an entire concert or
night of music. Using the MAM, the DJ or sound engineer now have
the possibility of adjusting the average level to a point, where the
MAM is in zero, indicating that the average level is exactly as loud as
the dB limit allows.
Using the MAM this way, removes the need to look at the Leq graph
since it will show pretty much the same level all the time, however,
it is necessary to keep an eye on the MAM as red lights are not really
allowed when maximizing the output this way.
10EaZy Main Screen, MAM in depth
Leq graph showing a very dynamic concert with 1 minute average
levels both above and below the average dB limit
2) Standard rock / pop concert:
A quiet part of the Concert. The level is below the average defined
by the dB limit. “dB money” is being saved
An average rock / pop concert consists of a mixture of loud
A loud part of the Concert. The level is above the average defined
by the dB limit. Over spending of “dB money”
songs and perhaps a few quiet songs. This kind of music
benefits from the 10EaZy user interface in a different
way than the previous example. With this kind of music the
MAM will occasionally go into red because of intense parts
in the music, however there will also be more quiet pieces in
the music where the MAM will be in the green +dB area.
These color indications in combination with the Leq graph is
a very powerful tool for the sound engineer.
It is common for the sound engineer to know the band playing and the dynamic development thru a concert.
Combining the MAM with the Leq graph he now has the opportunity of mixing the band following the dynamic in the
music without the risk of violating the dB limits.
The very intuitive user interface should remove the risk of violating the dB limit. In the unlikely event of people
misunderstanding the suggestions given or thru simply ignoring the values displayed, 10EaZy comes with a last line of
defense. The warning dialogs.
IfIf the
adequateisthe
will disappear
and bewill
replaced
the reduction
suggestedisreduction
notdialog
followed,
a limit violation
occur. by a
The
“REDUCTION
REQUIRED”
dialog
reacts
very quickly,
dialog,
warning
the
level
should
not
increased
while
on screen
Athe
“limit
violation”
dialogthat
will
be displayed
and
thebe
number
will occur.
turn red.
Ifsmaller
suggested
reduction
is
not
followed,
a limit
violation
will
so
changes
in
the
level
will
be
reflected
in
a
matter
of
seconds
reduce thedialog
overall
immediately
minimize
APlease
“limit violation”
willlevel
be displayed
andtothe
numberthe
willviolation
turn red.period.
Please reduce the overall level immediately to minimize the violation period.
10EaZy Main Screen, The warning dialogs
The warning dialogs are the “final frontier” provided by 10EaZy to avoid violations of the dB limit.
A prediction algorithm is constantly monitoring the recorded measurements and if the average level is approaching
the dB limit, a warning is issued. The warning dialog will ask the user to reduce the average level. If a warning is
triggered the level has been substantially above the level suggested by the MAM for a while, and it is thus necessary to
react swiftly to the suggested reduction to avoid a limit
violation.
The dialog will aid to ensure that the sound pressure is kept at
a secure level. The algorithm will guide the user to a final value
-0.2 dB below the dB limit. For concerts constantly playing
close to the limit, warnings may be triggered continuously.
The MAM will follow this warning making it easy to see the
required reduction just by looking at the red lights.
If the suggested reduction is not applied rather fast the required
reduction will continue to increase, until a point where it is no
longer realistic to expect such a reduction, for instance minus 6
dB or above – it will then no longer be possible to avoid the
limit violation!
Keeping the sound level below the average level during the
period of violation is the only way to get below the limit again,
and the period spend over the limit will be directly determined
by the sound level at which is played.
10EaZy Main Screen, Limitations
As 10EaZy is not connected directly to the sound system, using 10EaZy is not a guarantee that the dB limit is never
violated. However, the very intuitive user interface and ways of letting the sound engineer / DJ know how they are
doing, ensures that a violation only occurs if the system is ignored. By providing the person in charge of the sound
level with clear and visible information’s, the excuse of being too loud because “ we didn’t know” has been removed.
This gives the managers or organizers at clubs, venues and festivals a very powerful tool to demand compliance with
dB regulations from their DJ’s and sound engineers.
Unfortunately 10EaZy is not capable of seeing into the future. Because of this, the warning dialogs are not available
until the program has been running for at least the Leq period of time set by the user. I.e. if the Leq limit is based on a
15-minute average, the program should run at least 15 minutes before the show starts, to ensure that all features of
10EaZy are available to the user.
For longer Leq periods this may be a problem, if for instance the power to the computer is lost and the Leq period is
1 hour. In this case the show may start before a full hour has passed, leaving the engineer without the warning dialogs
if he is too loud until the program has been running a full hour.
It is however still be possible to comply with noise regulations, as the MAM provides reliable results 10 seconds after
program start and the Leq value will provide a running average until the full Leq period has passed.
10EaZy WebViewer and MobileViewer
As of 10EaZy version 1.8 we have implemented the possibility to remotely view a selection of the measurement
results in a normal web browser.
This feature enables tour managers or people at a production office, or even an environmental officer in a remote
location, to check a given measurement in real time.
As networks are very different from one another, due to different firewall settings, port forwarding etc, it is very
difficult for us to give a “one size fits all” description on how to access the webviewer, so we will just try to explain
the fundamentals of what needs to be done.
Please ask your system administrator or google if any of the topics below appears unclear to you..
Before anything will work you need to allow access to the internet to the 10EaZy program and related services.
Most likely the windows firewall or any other software firewall used will ask for permission to this the first time you
run 10EaZy – please allow access on both local and internet if required. (3 programs needs to gain access – 10EaZy,
10EaZy webserver and a program from National Instruments called Datasocket server – cwdss.exe)
Accessing the WebViewer on a local network (LAN)
The 10EaZy WebViewer function is accessed via any web browser at the address http://”local
IP”/10EaZy_webviewer.html and http://”local IP”/10EaZy_mobileviewer.html, where “local ip” is the address of the
computer running 10EaZy – for instance http://192.168.0.12/10EaZy_webviewer.html
The IP is listed in the windows title bar of the 10EaZy program, and at the start up screen when 10EaZy loads.
Changes to the computer IP will be reflected at the windows title bar with a delay of maximum 1 minute.
For any other computer or cell phone connected to the same LAN network, typing one of the above addresses with
the correct IP will open remote viewing interfaces. Values are updated every 5 seconds to save on bandwidth.
If you are not able to see the interfaces, there is most likely an additional firewall somewhere in your network or even
an anti virus program blocking the connection. Start by ping'ing (you don't know what that is? Time for google) the machine
from the remote computer to the local machine to make sure that they actually see each other. If this proves
successful, try and disable your firewall and anti virus for a limited period of time, to see if they are causing the
problem.
Accessing the WebViewer from an outside line
To access the webviewer from the internet somewhere outside the local network, there is most likely the need for a
forwarding of the port used by the webviewer. For ease of use this port is number 80 – the same port that normal
web traffic uses, so it may all ready be forwarded.. If you are unsure on how to forward the port we recommend
talking to a network expert, or consulting a page like www.portforward.com, which host a collection of “how to's” on
a lot of routers.
Furthermore to gain access from the outside of a local network, the IP address needs to be moved from the local
network address to the global IP of the outside line – if this IP is unknown to you, it may be obtained from a site like
http://whatismyipaddress.com/
10EaZy WebViewer and MobileViewer
Please make sure that the port is forwarded all the way thru the network – this means that if your computer running
10EaZy is first connected to a router, and that router is connected to an ADSL modem or the like, the port needs to
be forwarded first from the LAN side to the router, and then with the routers WAN side IP thru the modem to the
outside world.
WebViewer advanced notes
If network security prohibits the forwarding of port number 80 another port may be used. Inside the 10EaZy
program folder there is a file called niwebserver.conf – inside this file, which may be opened using notepad, the token
“listen 80” can be changed to any available port, for instance “listen 32700”.
For users with several systems on the same local network, each system needs to use a specific port, and then these
ports needs to be forwarded thru the routers and modems, as it is only possible for the NAT on the entry router to
forward one specific port to one specific IP on the LAN side.
So all systems need to have a unique port, and then have that unique port entered in the niwebserver.conf file for that
particularly system.
To access the webviewer from another port than 80, the link need to be updated to the syntax http://”local
ip”:portnumber/10EaZy_webviewer.html – for instance http://192.168.0.12:32700/10EaZy_webviewer.html
For most users simply clicking the windows firewall dialogs should be all that it takes to get online with 10EaZy and
once successful your web browser should look something like this:
10EaZy Features in depth
The 10EaZy LogFile
10EaZy log File (not available with 10EaZy RT & SW)
10EaZy requires a log file before measurements are started. The log file includes a very thorough documentation of
the measured results containing the user information given at the start-up screen, plus various measurement results.
It is possible to see the Leq values (both dB(A) and dB(C)) for 1 and 3 minute periods, the Leq value for the user
selected period, the maximum FAST dB(A) value and the maximum PEAK dB(C) value.
Data is stored to file once per minute.
The file is compatible with any major spreadsheet application, and it is therefore very easy to import one or more log
files to a template and then create report sheets to document the event.
Doing so, a complete database of measurements may be build, and provide useful documentation in case of neighbor
complaints or as a general documentation of the sound pressure level at any given day.
10EaZy RT & SW log file
10EaZy requires a path to a storage location before measurements are started. With the RT system the measurement
results are delivered as a jpeg file featuring a summary of the most relevant measurement results. The log file jpeg is
the same as the exit screen when you quit 10EaZy RT, and if configured at the setup screen will be shipped as an
attachment to an e-mail.
A note on ensuring valid measurement results (not available with 10EaZy RT and SW)
When a measurement is stopped, 10EaZy writes a checksum to the bottom of the log file When installing 10EaZy, an
additional application called LFV, short hand for “Log File Validator”, is installed. This little application may be used to
validate the checksum of the file, and thus confirm if the data in the file are the same as recorded by 10EaZy. In case
someone altered the data, maybe because they didn’t like the results showing they where too loud, the file will fail the
check. The checksum is only based on the content of the file, and it is fully allowed to move the file to a different
location or rename it. For 10EaZy RT users this is not relevant as the log file is automatically converted to a jpeg file,
so cheating would require a rather skilled image manipulator.
A note on decimal points
The 10EaZy log file uses the local decimal point as defined by the regional settings of Windows™.
In some countries this will be a ‘.’ - dot in others a ‘,’ - comma.
Transferring files between different computers may result in problems, when regional settings are not identical.
If data loaded to a spreadsheet file are converted wrongly it will be necessary to either search and replace with the
appropriate decimal character or change the setup of the spreadsheets to the correct decimal point.
Both solutions are very simple, and should be documented in the manual supplied with the spreadsheet program.
Installing the 10EaZy sound card driver
On most systems the driver to the 10EaZy HW should be installed automatically when the software is installed..
In case this does not work the driver needs to be installed manually.
If the procedure of installing 3rd party drivers is not familiar, please consult your windows user guide on this topic.
As the 10EaZy sound card is unknown to windows the installation will need to be manually done by pointing the
“found new hardware” dialog to the appropriate folder. The 10EaZy sound card driver is available in the 10EaZy
program folder upon completed install..
Calibrating 10EaZy
10EaZy is shipped calibrated and ready to use. However recalibration should be performed on a regular basis.
The interval of this recalibration is determined by local law or common practice, and may vary from once every
second year to once every day. In order to comply with some standards the system needs to be calibrated at every
program run. Additionally some standards require that the calibration needs to be checked again after a measurement.
Please use an IEC 60942 class 1 compliant calibrator providing a 1 kHz pure sine wave at 94 or 114 dB.
Pressing the “ReCalibrate” button at the setup screen
opens the recalibrate dialog. Mount the microphone in the
calibrator and turn on the calibrator. Please ensure that
the microphone has been inserted completely to ensure a
proper calibration. Check the level reading in the dialog.
If the level is outside the tolerances of the required
measurement, select the calibration level (94 / 114 dB)
then press the “ReCalibrate” button.
10EaZy will recalibrate and store the new calibration value
+ the date of calibration and use that for future
measurements.
A status dialog will indicate the status of the calibration.
Calibration will fail if input is not a 1 kHz tone or if the calibration value differs more than ± 1.5 dB from the factory
calibration. Pressing “CTRL + R” in this dialog will reset 10EaZy to the factory calibration.
NB: Allow a settle time of at least 30 seconds from connecting the microphone to the sound card, before calibrating
the system, to ensure that the measurement chain has settled.
Important info on setting the gain and calibrating 10EaZy SW
The 10EaZy SW is a software only version, and as such the system needs to be calibrated prior to use with the
hardware selected for measuring. Before calibrating it is important to check that the input range of the measurement
chain can handle the sound pressure level expected – in live sound this may be in excess of 130 dB.If the input gain is
too high, the signal will distort and create peak conditions and thus ruin the measurement.Once it is believed that the
input gain is low enough that the expected SPL can be handled, calibrate 10EaZy SW using the procedure explained
above. Upon completed calibration a very unscientific way of testing if the system is capable of handling high SPL’s is to
simple pull the plug on the microphone while running 10EaZy – this will create an input peak warning, and if the view
is shifted to “peak C hold” then the maximum value measured will be displayed. If this value is in the range of 140 –
145 dB, the system should be capable of handling SPL’s around 135 dB. If the value is much higher than this, please
consider turning the gain up a bit on the card AND recalibrate the system.The input range of any given sound card is
limited by the resolution of the sampling, and if the gain is too low, lower spl’s may not be measured correctly.
Appendix: dB! A measurement primer
This appendix is meant as a primer to those not familiar with measuring dB and hopefully will serve to remove some
of the most common misunderstandings about dB.
We encourage readers to educate themselves on these topics. This appendix only covers the very basic and is not
intended to be a scientific white paper explaining all topics in depth.
Very often dB values are used with very little insight. A classic example is the newspaper headline telling the
“horrifying tale” of an artist who played at 120 dB. As this appendix will show, dB values are of very little use if they
don’t come with a reference telling what was measured and how. With the increase in small dB measurement devices,
like cell phones, a lot of people are measuring dB values these days, but does these values provide any useful
information?
First off, dB as such has nothing to do with sound. dB is merely a way of measuring a ratio between to numbers.
The dB scale is logarithmic so normal addition and division is not allowed i.e. 100 db + 100 dB does not equal 200 dB.
The logarithmic rules of calculation are different from standard algebra, but non-the-less equally easy to remember.
A doubling in the sound pressure level equals 3 dB, so the 100 dB + 100 dB equation actually equals 103 dB.
An increment of ten times equals 10 dB, and an increment of a hundred times equals 20 dB.
The measurement unit of sound is “Pascal”. The human auditory system has a very large range at which it operates.
The threshold of hearing is defined at 0,0000020 Pa or 20uPa. The threshold of pain is at 20 Pa or a factor of 107
between the 2 values. The dB value was introduced, as it describes the difference in a more readable way. If the two
threshold values are expressed in dB the result will be 120 dB. This just tells that the threshold of pain is 120 dB
louder with reference to the threshold of hearing. The reference is important since anything can be expressed in dB. If
for instance a festival has 200 participants the first year, and 2000 participants the next year, the crowd has increased
10 times, and thus 10 dB. Again this value is based on a reference of 200 participants. So a dB value with no reference
is not really telling anything. For sound the reference is the threshold of hearing at 20uPa. A sound measurement
should therefore be expressed as “xx dB ref 20uPa”. But since “everybody” knows that, it always ends up in just being
dB.
So now we have established what dB is and what it relates to. But there is more to add to the confusion. dB can be
measured in a lot of ways, and depending on how it is done the same source of audio may yield very different results.
Three ways of measuring sound pressure levels are commonly used. All three of them yield useful information, but
again, with no reference to what was measured and how, they produce very little valuable information.
Appendix: dB! A measurement primer
The three commonly used measurement methods will be briefly described in the following. For an in depth
explanation please consult more detailed literature or the Internet.
Peak measurements
◦
Indicates the absolute peak in a measurement. The duration of the peak is not considered and as such tells
very little about the actual content of the measurement. However, very loud peaks are known to cause
permanent hearing loss (For example gun shots or fireworks at close distance).
Time weighted measurements
◦
Usually in sound measurements “time weighting” called F for “Fast” or “S” for “Slow” are used.
Time weighting means, that the measurement is treated with a filter, which does not react instantly to an increment in
the sound pressure level. Because of this, a sudden increase in sound pressure will yield a smaller value for a FAST
measurement than for a peak measurement.
Leq measurements
◦
Leq is shorthand for equivalent level. This value expresses an average sound level based on a period of
time, for instance 1 minute or 8 hours. So Leq 8h = 93 dB, means that on average the last 8 hours of
measurement was 93 dB. At some periods the level has been louder than 93 dB and at some other
periods the level has been below 93 dB. But the total measured level equals a constant noise of 93 dB in
8 hours.
Lets take a simple example, a snare drum. The figure below serves to illustrate the very different dB values one may
measure using the three different methods for at the same audio clip.
A final piece of information is missing in the puzzle of measuring audio, and it is called frequency weighting.
Appendix: dB! A measurement primer
The human auditory system is not linear with respect to frequency. Low frequency’s and high frequencies are
attenuated. The easiest way to describe this phenomenon is by the “loudness” button found on many hi-fi systems.
What this button does is to add low and high frequencies to compensate for this attenuation and provide a more
pleasing listening experience especially at lower levels.
As the ears sensitivity is reduced at low and high frequencies, this also means that frequencies in that area is less
harmful at a given level than for instance a 1kHz tone at the same level.
A frequency weighting is introduced in sound
measurements to counter this fact.
The figure illustrates this weighting called “Aweighting”.
Different types of weighting exist, but A-weighting
is the most commonly used.
This filter removes a lot of the low and high
frequencies from the measurement, to mimic the
sound perceived by the human ear, before calculating the dB value. Doing so gives a more qualitative estimation of
the “danger” posed to the ear for a different sound level. If an electric bass is measured with and without the Aweighting, the dB value will be very different, because the A-weight filter attenuates the low frequencies.
If dB values are A-weighted they are marked as “dB(A)” values.
A brief summary:
•
dB itself is not a unit like Volt or km, but only indicates a logarithmic ratio between two numbers. If the
reference of the dB value is not stated, the dB value provides very little information. For sound level
measurements in air the reference is always 20uPa.
“Everybody” knows that, so sound pressure levels are usually just marked with dB or dB(A)
•
3 methods of measuring sound levels are commonly used. Peak, Fast and Leq. As described, it is essential to
know which of these was used in a given case, since the values measured on the same signal may be very
different depending on the selected method.
•
Finally, to simulate the actual sound perceived by the human auditory system, a frequency weighting, usually
A-weighting, may be applied to the measurement.
So does the sentence “the concert was played at a 120 dB”, give any valuable information? No!
However the sentence “the concert was played at an Leq of 101 dB(A) over 1 hour, with a maximum peak of 120
dB(C)” yields all the information in the world, but of course does not provide a paper selling headline….
And NO!, measuring dB values at a concert using a cell phone do not provide any useful information either.
It is fairly as accurate as yelling to the person next to you to determine whether it is loud or not.