1
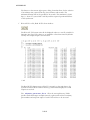
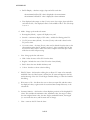
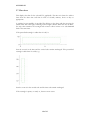
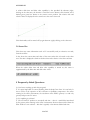
Australian Synchrotron Technical Note AS-CIT-200904-03
Strip Chart User Guide
Andrew Starritt
25 April 2009
Abstract
Live PV data and historical data from the EPICS Channel Archives can be
displayed by the Graphical User Interface (GUI) and the Stand Alone StripChart (SAS) tool. The later is a stand-alone version of the Strip Chart Form
available on the Operator Interface (OPI) GUI.
1 Introduction
This technical note provides a guide to using the Strip Chart, how to start the GUI and
Stand-Alone Strip Chart programs, together with some frequently asked questions.
2 Starting the GUI/SAS
A number of bat scripts have been provided on the K ( \\asad01\synchrotron ) drive
to enable users to run the GUI/SAS programs in the office environment. Additional
information is available at deploying OPI components on the Synchropedia.
2.1 Starting the Operator Interface GUI
Navigate to: K:\Engineering\Control_Systems\utilities
Drag and copy the short cut run_gui to your desktop. This is a short cut that links to
the file run_gui.bat file. Please do not copy the run_gui.bat file itself - this may change
without notice.
Double click on the run_gui short cut icon. This runs the bat script which copies the
relevant files to your C drive, and then executes the gui from your local drive. These files
are copied to the folder:
C:\asp\ics\opi\gui_process
To open the strip chart, go to the menu bar and select: Framework | Strip Chart.
Alternatively, open up the relevant form, right click on the PV of interest, and from the
pop-up menu select: Add to Strip Chart.
Note: the files are copied to your C drive rather than run from the K drive to overcome a
Windows "feature" which precludes the updating of these files while being executed.
AS-200904-03
2.2 Starting the Stand-Alone Strip Chart (SAS)
This is similar to starting the GUI. Navigate to:
K:\Engineering\Control_systems\utilities
Drag and copy the short cut run_sas short cut file to your desktop. Do not copy the
run_sas.bat file itself.
Double click on the run_sas short cut icon. This runs the bat script which copies the
relevant files to your C drive and then executes the SAS from your local drive. These files
are copied to the folder:
C:\asp\ics\opi\sas_process
3 User Guide
The following sub-sections describe the function and operation of the major parts of the
Strip Chart.
3.3 Menu Bar
The menu bar is located at the very top of the Strip Chart form.
Of interest is the Strip Chart which contains two items, View and Duration.
The View item has four sub-menu items: Header, Toolbar, PV Panel and Status. These
items allow the user to optimise screen real-estate by controlling the display/non-display
of various parts of the strip chart.
The Duration items have various sub-menu items that can be used to select the duration,
or relative time frame of the display chart. These menu items supplement selections
available on the tool bar.
3.4 Header
The header panel lets us know that this is the Strip Chart form. It also includes a number
of standard form controls at the extreme right hand side of the Header panel:
2 of 12
AS-200904-03
These are:
. The colour indicates the severity of the most
a. New error reported indicator
serious error report. Clicking on this button will open the Error Reports Form
and clear the error report indication.
b. The iconise button
. This will iconise the form. This control is not
applicable to the stand-alone strip chart – the form is the main application form.
c. The open previous form button
. This will re-open, if not already open, the
form from which the Strip Chart form was opened. This control is not applicable
to the stand-alone strip chart.
d. The lock current form button
. When locked (as shown) this will prevent the
current form being closed if/when another form is opened. It will also enable,
indeed force, a second instance of the Strip Chart Form to be opened if/when an
attempt is made to open the Strip Chart, or a PV is added to the Strip Chart. It is
not applicable to the stand-alone strip chart.
e. The help button
. This will launch firefox and open the file
if it exists in the current directory. This is for future
enhancement. No html help files (other than proof of concept) have been
developed.
tstrip_chart_form.htm
3.5 Tool Bar
The Tool Bar is located immediately below the title bar is the tool bar. It consists of a
number of buttons, with icons or text and associated status information.
The function of each of these controls is described below.
a. Backward/Forward Control
These buttons are used to go back to a previous strip chart state or forwards
again (the strip chart state is set by the other controls on the tool bar (described
below)). The paradigm mimics that of a browser going back to the previous page
or forwards again.
b. Normal Video / Reverse Video
These buttons are used to select either a white or a black background colour to
3 of 12
AS-200904-03
be used on the actual chart area. The former is better for printing and for
inclusion within a document.
c. Linear Display / Log Display
Selects whether the display is linear (default) or logarithmic. To avoid invalid
floating point operation exceptions, the log of a zero and negative number is
deemed to be -20.
d. Manual / Auto / Data /Normalised Scaling
These buttons allows the selection of one of the vertical scaling modes. From left
to right these buttons do:
Manual Scale: - launches a dialog box to allow the user to manually specify the
required lower and upper display bounds of the chart.
Auto Scale: - scales chart to encompass the lower to the upper display limits of all
the PVs currently being monitored, i.e. from the minimum of all the LOPR
values to the maximum of all the HOPR values. If a PV has not specified LOPR
and HOPR (essentially both set to 0) then the PV is excluded from the auto scale
calculation. If none of PVs have LOPR/HOPR specified the vertical scaling
remains unchanged.
Data Scale: - scales chart to encompass the lower to the upper actual values of all
the values of all the PVs currently displayed.
Normalised Scale: - each PV is drawn as if the strip chart is scaled to the
HOPR/LOPR bounds of the PV itself. The nominal Y-axis scale is 0 to 100.
Clicking on one of the coloured horizontal bars below the Tool Bar changes the
Y-axis scale to reflect the selected PV. The selected PV is indicated by a >
chevron preceding the PV Name.
‘Better’ icons are still under development.
e. Select Time Duration
These buttons allow the selection of the time scale duration of the strip chart
from a pre-determined number of durations from ranging 1 minute to 2 days.
Other duration are available from the strip chart menu.
4 of 12
AS-200904-03
The button on the extreme right opens a dialog form that allows for the selection
of an arbitrary time, expressed in days, hours minutes and seconds. The
minimum duration that can be specified is 30 seconds. The maximum is 99,999
days, i.e. about 273 years which is well beyond the expected operational lifetime
of the synchrotron.
f. Write All PVs to file, Read All PVs from Archiver
The Write All PVs button writes all the displayed values to a text file, suitable for
importing into Excel. The values are re-sampled to a fixed time interval (default 1
second). An example output is shown below:
The Read All PVs button causes all the PVs currently on the strip chart to be
(re)read from the EPICS Channel Archive(s), and that data displayed if a valid
response is received.
The adaptation_parameters_file.ini file in the start-up directory/folder
specifies the default output resample interval, together with archive hostnames,
port numbers and end point scripts of each of the archives to be accessed.
5 of 12
AS-200904-03
g. Control Time view
These buttons select the time view of the strip chart. From left to right these
buttons:
Open a start time and end time dialog. Start times are restricted to being no
earlier than 1 Aug 2005, while end times are no later than current time. The time
frame (start time to end time) is no less than 30 seconds.
Note: the times are interpreted as per the time zone selection described in
paragraph h below.
Select real time mode (this is the default mode). The end time of the strip chart
is always the current time, the start time is a fixed duration before that.
Pause the strip chart - no real time updates occur (although real time data is still
buffered for subsequent display).
Page back one frame. The frame size is the current chart time frame.
Page forward one frame. The frame size is the current chart time frame.
h. Time Zone selection.
These buttons select the time zone to be used by the strip chart. From left to
right these buttons are:
CT: use current time zone (the default), i.e. Australian Eastern Summer Time in
summer, and Australian Eastern Standard Time in winter.
EST : use Australian Eastern Standard Time.
EDT: use Australian Eastern Summer (i.e. Daylight savings) Time.
UTC: use Universal Coordinated Time, i.e. essentially Greenwich Mean Time
(GMT).
The time_zone.ini file in the start-up directory/folder specifies time zone
information together with time zone acronyms used to set the captions of the
two central buttons.
Note: both EPICS in general, and the Channel Archiver in particular use UTC.
6 of 12
AS-200904-03
i.
Load/Save configuration.
The ComboBox and buttons allow the user to load and save the current strip
chart configuration. For the ComboBox a predefined set of filenames are
extracted from a file specified in the adaptation_parameters_file.ini. For the
buttons, a file system browser dialog is launched to allow the user to select a file
to load from or save to.
This loaded/saved configuration includes the form geometry, normal/reverse
video, log/linier scale, manual/auto/normalised scale, real-time/ historical mode,
and Y axis scale. It also loads/saves the current PV names together with the
associated PV colours together with any PV adjustments.
Note: these files are ASCII files that can be 'hand-edited' with care. They are also
compatible with the Scratch Pad Form configuration files.
j.
PV Panel size control.
This widget allows the user to control the size of the PV Panel, i.e. increasing or
decreasing the number of rows of PV Names that are displayed.
3.6 Process Variable (PV) Panel
Below the tool bar is the PV Panel, which displays 14 coloured bars (seven rows by two
columns) plus associated value displays.
The coloured bars show the names of the PVs being monitored by the strip chart. The
colour of the line on the chart and the colour of the bar are the same. If the PV is
currently connected, i.e. we can get the live value directly from an IOC (perhaps via a
gateway) the current value and engineering units are displayed adjacent to the bar.
Right click on any one of these bars to launch a PV specific popup-menu.
For a blank bar, the available options are is:
a. Add PV - this launches a dialog box to allow a PV name to be manually entered.
Once the Okay button is clicked, the PV name will appear in the bar, and
monitoring of the PV will begin. Double clicking on a blank bar also launches
this dialog.
7 of 12
AS-200904-03
b. Select from a predefined list of up to ten PVs. These PV names are specified in
the adaptation_parameters_file.ini file located in the start-up directory /
folder.
For a non-empty bar, the options available are:
a. Read Archive - this causes the strip chart tool to request historical data from the
Channel Archiver for the selected PV only, and display that data if a valid
response is received.
b. Scale Chart To This PV - brings up the scale sub-menu:
•
Scale to HOPR/LOPR values - scales the strip chart to the HOPR and LOPR
values of the PV, providing the PV is connected and HOPR?LOPR are
defined;
•
Scale to displayed Min/Max values - scales the strip chart to the current
minimum and maximum displayed values of the selected PV;
•
Scale to buffered Min/Max values - scales the strip chart to the current
minimum and maximum buffered (i.e. includes off display) values of the
selected PV.
c. Adjust PV – this brings up the adjust PV sub-menu: In order to more easily
correlate two or more PVs, the Strip Chart enables the display of a PV is be
linearly adjusted using the formula:
YDisplayed
=
(YPV – origin) * slope + offset
The is a variation of the more usual y = m.x + c formula, but essentiall has a
scaled and unscaled offset constant (which makes it a bit easier for the human
user).
The sub-menu items are:
dialog box allows the user to manually enter origin, slope and offset values. It
also provides four automatic origin, slope and offset value selection buttons.
These are:
•
General … - allows the user to select arbitrary origin, slope and offset values.
•
Reset – sets slope to 1 and origin & offset to 0, i.e. YDisplayed = YPV
•
HOPR/LOPR – calculates origin, slope and offset such that:
the HOPR value is displayed at the current chart maximum
the LOPR value is displayed at the current chart minimum.
•
Display – calculates origin, slope and offset such that:
the maximum displayed PV value is displayed at chart maximum
the minimum displayed PV value is displayed at chart minimum.
8 of 12
AS-200904-03
•
Buffer Display – calculates origin, slope and offset such that:
the maximum buffered PV value is displayed at chart maximum
the minimum buffered PV value is displayed at chart minimum.
•
First displayed value maps to chart (Y-axis) centre. Sets origin, slope and offset
such that the left / first displayed value is at the middle of the Y-axis. The slope
is set to 1.
d. Mode - brings up the mode sub-menu:
•
Rectangular (default) - squares off display trace; and
•
Smooth - continuous display of PV values - suitable for floating point PVs.
•
Use PV process time (default) - the time (X-axis) value used is based on the
PV process time.
•
Use receive time - the time (X-axis) value used is derived from the time on the
client machine when the PV update is received – this is usesfull if an IOC has
the incorrect time, and for some of the more complex record that post values
while the record is still processing.
e. Line - brings up the line sub-menu:
•
Hide - hides the trace of this PV from the chart;
•
Regular - includes the trace of this PV on the chart (default);
•
Bold - draws the trace double thickness; and
•
Colour - launches a colour selection dialog.
f. Edit PV Name - this launches a dialog box to allow a PV name to be manually
modified. Once the Okay button is clicked, the PV name will appear in the bar,
and monitoring of the new PV will begin. Double clicking on a bar also launches
this dialog.
g. Write trace to file – this allows the user to select an output file, and then writes
the displayed values, together with the associated time stamp and status, to the
selected file.
h. Generate Statistics – this lunches a form displaying statistics of the displayed PV
values. This includes the minimum value, maximum value, the range of values,
the time weighted mean value, the time weight standard deviation, the integral
(i.e. area under the curve) and the mean rate of change.
i.
Clear - removes this PV from the chart.
9 of 12
AS-200904-03
3.7 Chart Area
This displays the data for the selected PVs graphically. The time axis shows the relative
time from the chart time end time in units of seconds, minutes, hours or days as
appropriate.
A graphical zoom capability is provided. By clicking on the chart, and then moving the
cursor down and to the right, a dashed green rectangle is drawn. When the user un-clicks,
the strip chart examines the rectangle and zooms in either in time or in scale but not
both at the same time.
If the prescribed rectangle is wider than it is tall, i.e.
then the zoom is in the time and the vertical scale remains unchanged. If the prescribed
rectangle is taller than it is wider, e.g.:
then the zoom is in the vertical scale and the time scale remain unchanged.
If the rectangle is square, or nearly so, then no zoom occurs.
10 of 12
AS-200904-03
A relative delta time and delta value capability is also provided. By alternate (right)
clicking on the chart area, the location is saved and a cross drawn at that location; and a
dashed green green line drawn to the current cursor position. The relative time and
relative values are displayed on the status bar as the cursor is moved.
This functionality cab be turned off by again alternate (right) clicking on the chart area.
3.8 Status Bar
This shows any status information such as PV successfully read (or otherwise not read)
from the archiver.
It also shows the current time and value of the cursor when this is located on the chart
area. The time is displayed as both an absolute time and a relative to the chart end time.
When the relative delta time and delta value capability is turned on, this status is
supplemented by the delta time and delta value values.
4 Frequently Asked Questions
Q. Can I mess anything up with this program?
A. It is quite impossible to control anything from the Strip Chart form. It is read only. It
has no effect of the operation of the accelerator or beamline components. Also when
running in the office environment, the accelerator-office EPICS gateway is a read only
gateway and prevents PV writes.
Q. Is it updating is real time?
A. The real time PV updates are essentially real time – there is a small delay introduced
by the gateway when running in the office environment. However data retrieval from the
Data Archiver is not real time – this data is typically a few minutes behind real time.
11 of 12
AS-200904-03
Q. Will it work at home?
A. Partially – data retrieval from the Data Archiver will work at home, and anywhere
with an internet connection. Direct real-time PV updates will not work from home.
Archive retrieval has been confirmed by several people. Performance is VERY
reasonable (except when using dial-up connection ;-). You may need to allow it through
your firewall.
Q. How do I remember all of these Process Variable (PV) names?
A. The current version supports a drop down list of all archived PVs and a regular
expression filter. This is way cool - play with it. The list will update dynamically – so as
new PVs get archived, they will appear.
Q. What are “Glob Pattern” and “regular expression”
A. These are ways of selecting a group of PVs – identified by names which are just
strings. Both accept exact matches between the pattern string and the given string, but
have some subtle differences and are useful in certain cases. “.*” is the default and in
regular expressions “.” means ‘any character’ and “*” means ‘zero or more occurrences
of the previous character’ - so “.*” means match to anything. Play with it, for example
“SR.*” gets all PVs starting the characters SR, and “SR08.*” only those in sector 8. Best
to consult a computer science text book, or your favourite search engine can provide
more details on pattern matching if you really need to know. We are anticipating very
large numbers of PVs, so this is really for the future.
Note the Glob option is deprecated and will be phased out.
Q. Can I read PVs in the as yet uncommissioned equipment, e.g.. the Accel PVs?
A. If you are in the control room (or anywhere on the accelerator LAN or office LAN)
you can read them directly, but cannot “backfill” historical or archived data. Only when
PVs are archived can the values be read from outside the office/accelerator network.
Q. There are some Process Variables that are already logarithmic e.g.
SR01CCG02:LOG_PRESSURE, what happens with the log option on the strip chart?
A If you the use the log option on the strip chart for these PVs, you will be displaying
the log of the log of the pressure – this doesn’t really mean very much.
Q. Also what happens to a negative number with the log option?
A. Because the log of a zero or negative number is undefined, the Strip Chart displays the
log of these values as -20.
Q. What if I get the PV wrong – and it doesn’t exist?
A. You will get a transient error message in the “status” area (grey area on the bottom of
the window).
Q. Why does it start up in a strange place on my screen – and why do some people get
scroll bars?
A. The Strip chart is primarily designed for use in the control room – it expects a certain
minimum display resolution – and places things best for a dual screen operator screen.
12 of 12