1
SciVal
User guide
Last updated on 25 March 2014
© 2014 Elsevier B.V. All rights reserved. SciVal ® is a registered trademark of Elsevier Properties S.A., used under license.
SciVal
Table of Contents
2
Table of Contents
Part I About SciVal
5
1 What is SciVal?
................................................................................................................................... 5
2 What Spotlight and Strata
...................................................................................................................................
users can expect
5
3 Browser requirements ................................................................................................................................... 6
Part II Get started
1
2
3
4
8
Logging in
................................................................................................................................... 8
Selecting a time period................................................................................................................................... 8
Filtering by subject area................................................................................................................................... 9
Selecting entities
................................................................................................................................... 9
Part III How you can use SciVal
13
1 How can my institution
...................................................................................................................................
demonstrate research excellence?
13
2 How can my institution evaluate the impact of our research
................................................................................................................................... 14
portfolio?
3 How can my institution
...................................................................................................................................
attract talented researchers?
16
4 How can my institution
...................................................................................................................................
find collaboration partners?
19
5 How can my institution
...................................................................................................................................
identify its research strengths?
23
6 What is the impact of adding
...................................................................................................................................
a new researcher to my team?
24
Part IV Data and metrics
1
2
3
4
5
28
What is the source of the
...................................................................................................................................
data in SciVal?
28
How current is the data?
................................................................................................................................... 28
What publication types...................................................................................................................................
can you use?
28
Which metrics are available
...................................................................................................................................
to use in SciVal?
28
What are Snowball Metrics?
................................................................................................................................... 30
Part V The Overview module
32
1 What is the Overview module?
................................................................................................................................... 32
2 Working with the Overview
...................................................................................................................................
module
32
Selecting..........................................................................................................................................................
an entity
32
Selecting..........................................................................................................................................................
a year range
32
Filtering by
..........................................................................................................................................................
journal category
33
3 How can you use the Overview
...................................................................................................................................
module?
33
Get an overview
..........................................................................................................................................................
of your institution's research performance
33
Explore the
..........................................................................................................................................................
publication output of your institution
34
Get an overview
..........................................................................................................................................................
of your institution's research strengths
35
Get an overview
..........................................................................................................................................................
of collaboration by your institution
37
2
SciVal
Table of Contents
3
Evaluate ..........................................................................................................................................................
the performance of a group of researchers
37
Investigate
..........................................................................................................................................................
other institutions
38
See your..........................................................................................................................................................
institution's national or global position
38
Identify potential
..........................................................................................................................................................
collaboration partners
39
See your..........................................................................................................................................................
institution's performance in a specific research area
39
Part VI The Benchmarking module
41
1 What is the Benchmarking
...................................................................................................................................
module?
41
2 Working with the Benchmarking
...................................................................................................................................
module
41
Selecting..........................................................................................................................................................
metrics
41
Selecting..........................................................................................................................................................
a year range
42
Filtering by
..........................................................................................................................................................
journal category
43
Working with
..........................................................................................................................................................
the chart
43
Working with
..........................................................................................................................................................
the table
44
3 How can you use the Benchmarking
...................................................................................................................................
module?
44
Compare..........................................................................................................................................................
your institution to others
44
Benchmark
..........................................................................................................................................................
your institution against the national average
45
Spot research
..........................................................................................................................................................
trends
46
Identify suitable
..........................................................................................................................................................
benchmark institutions
47
Compare..........................................................................................................................................................
your institution against collaborating institutions
48
Part VII The Collaboration module
50
1 What is the Collaboration
...................................................................................................................................
module?
50
2 Working with the Collaboration
...................................................................................................................................
module
50
Selecting..........................................................................................................................................................
an institution
50
Selecting..........................................................................................................................................................
a year range
50
Selecting..........................................................................................................................................................
a region, country or sector
51
Filtering by
..........................................................................................................................................................
journal category or research area
52
Working with
..........................................................................................................................................................
the map
53
Working with
..........................................................................................................................................................
the table
54
3 How can you use the Collaboration
...................................................................................................................................
module?
55
Identify the
..........................................................................................................................................................
collaboration partners of your institution
55
Evaluate ..........................................................................................................................................................
a collaboration partner in detail
58
Identify potential
..........................................................................................................................................................
new collaboration partners of your institution
60
Part VIII Defining your own research areas
1
2
3
4
63
About research areas in...................................................................................................................................
SciVal
63
Defining a research area
................................................................................................................................... 63
Search tips
................................................................................................................................... 65
Analyzing a research area
................................................................................................................................... 67
Research..........................................................................................................................................................
areas in the Overview module
67
Research..........................................................................................................................................................
areas in the Benchmarking module
69
Research..........................................................................................................................................................
areas in the Collaboration module
69
3
SciVal
Table of Contents
Index
4
72
4
SciVal
About SciVal
1
About SciVal
1.1
What is SciVal?
5
SciVal is a set of integrated modules that enables your institution to make evidence-based
strategic decisions. SciVal consists of three modules:
• Overview - Get an overview of the research performance of your institution and others based
on output, impact, and collaborations.
• Benchmarking – Determine your strengths and weaknesses. Compare your research
institution and teams to others based on performance metrics. Model different test scenarios.
• Collaboration – Identify and analyze existing and potential collaboration opportunities.
Identify suitable collaboration partners. See who others are collaborating with.
SciVal for chancellors and deans
To make the right strategic decisions, you need actionable data. SciVal gives you insights to make
evidence-based decisions. Track your research performance, identify your institution’s strengths
and compare your institution to peers around the world.
SciVal for senior researchers and department heads
With less funding and more competition, it’s not enough to do good research. SciVal gives you the
tools to evaluate and clearly demonstrate the value of your research to funding agencies and
others. Analyze your performance by team or department, compare to peers and identify new
collaboration partners.
SciVal for research administrators, development professionals and data experts
SciVal combines the power to perform massive calculations with the flexibility to respond to userdefined queries. You can apply 15 different metrics to any grouping of people or publications.
And you can filter the data by more than 330 journal categories.
1.2
What Spotlight and Strata users can expect
SciVal is the successor to SciVal Spotlight and SciVal Strata. SciVal has fully integrated the
analytical capabilities of Spotlight and Strata, and made them more comprehensive and intuitive,
with more metrics and more sophisticated ways to analyze performance.
5
SciVal
About SciVal
6
• For Strata users – In SciVal, there are more refined analysis capabilities. Instead of five
traditional metrics you can benchmark any institution, groups of researchers or publications
using 15 different metrics.
• For Spotlight users – In addition to the innovative competencies and collaboration analysis
introduced in Spotlight, SciVal offers more traditional indicators for research performance
evaluation.
Benefits of the new SciVal include:
• A single integrated platform
SciVal has three modules: Overview, Benchmarking and Collaboration. They form a single
integrated platform sharing the same data, entities and metrics. You can navigate from one
module to the other with ease.
• Tailored to your needs
In addition to extensive predefined entities, you can also define and analyze your own entities,
research teams and topics. This is helpful when tracking performance or planning strategy in a
very narrow field, which is not covered by existing entity definitions.
• More metrics and improved visualizations
SciVal goes beyond the basic metrics introduced in Strata. There are more metrics and more
flexible ways to analyze the metrics. In seconds, you can see an in-depth analysis.
1.3
Browser requirements
Supported browsers. We strive to fully support the latest full versions of Mozilla® Firefox® and
Google Chrome™ on Microsoft Windows. The following versions were tested for the current SciVal
release:
• Firefox version 25.x
• Chrome version 31.x
SciVal also fully supports the following browsers running on Microsoft® Windows operating
systems:
• Microsoft Internet Explorer version 8.x, and later
Note that:
• SciVal is only fully tested on these browsers running on Microsoft Windows operating systems.
Therefore, we can only guarantee full functionality to customers running these browsers on a
Microsoft Windows operating system.
• SciVal is not tested on the Apple Mac OS. However, the above versions of Firefox and Chrome,
as well as the most recent version of the Apple® Safari® browser, are supported for Mac.
• Other operating systems and browsers may also be able to access Elsevier products; however,
the Elsevier E-Helpdesk cannot provide expert advice or technical support to solve problems
6
SciVal
About SciVal
7
you may encounter when using these systems.
• Beta or test versions of browsers are not supported.
• Mobile browsers are not supported.
7
SciVal
Get started
2
Get started
2.1
Logging in
8
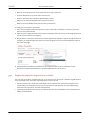
To log in to SciVal:
1. Go to www.scival.com
2. If you already have access to other Elsevier sites (such as ScienceDirect or Scopus), you can log
in with your current user name and password.
Registering as a new user. If you do not yet have an Elsevier username and password, you will
need to register as a new user.
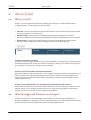
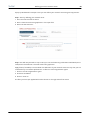
1. Go to www.scival.com and click the "Register" link.
3. Your username is your email address. It is not case-sensitive.
4. Create a password. Your password must be 5 -20 characters long, and it must contain at least:
• 1 uppercase character
• 1 lowercase character
• 1 number or special character:
0123456789* ~!@ #$% ^&*_+{}|:"<>? ` -=[]\;',./"
Remote access. If you are a registered user, there are two ways to access SciVal remotely.
1. You can activate it yourself when you are logged in.
2. Or you can use a registration link provided by Elsevier support staff.
Contact your system administrator for details.
2.2
Selecting a time period
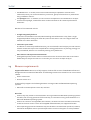
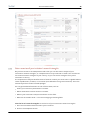
Use the year range selector at the top of the page to select the time period for your analysis. This
lets you choose the range of publication years for the publications that are included in your
analysis.
• In the Overview and Collaboration modules, you can analyze performance for a three- or fiveyear period.
• In the Benchmarking module, you can compare performance from 1996 until the present.
8
SciVal
Get started
9
Optionally, you can also include the current year as well as publications in future years. However,
you may want to exclude this because, by the end of the current year, Scopus has only received
and indexed a certain portion of the current year’s journals from other publishers.
2.3
Filtering by subject area
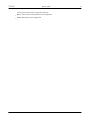
In SciVal all data can be filtered by subject area. You can choose from 27 main categories and 334
subcategories in the Scopus journal classification. Use any of these journal categories as a filter for
further analysis.
• The Scopus journal category filter is present in each of the three modules (Overview,
Benchmarking and Collaboration).
• Click the arrow next to each journal category to display the subcategories.
2.4
Selecting entities
An entity is anything that can be viewed in SciVal in terms of academic performance. An entity can
be an institution, country, researcher, publication set, or research area. It can also be groupings of
these, such as a group of researchers.
9
SciVal
Get started
10
Institutions and groups of institutions. An institution is any organization engaged in research
activity. It can be an academic, corporate or governmental institution, for example.
An Institution is a type of entity in SciVal. Technically, an institution is defined in SciVal as a
collection of one or more Scopus affiliations. Often an institution has multiple affiliations because
some of its parts, like hospitals or research institutes, can be assigned their own affiliation in
Scopus.
Multiple institutions can be combined into another type of selectable SciVal entity: a group of
institutions. A number of predefined groups of institutions are available in SciVal, including:
• institutional alliances such as LERU and Universitas 21
• constituent states and provinces of various countries. These include the U.S. states, each of
which is made up of all institutions in that state.
Researchers and groups of researchers. A researcher is someone who has authored one or more
publications. You can define researchers in SciVal. You can also create groups of researchers.
10
SciVal
Get started
11
You can use groups of researchers to model different “what-if” scenarios. For example, you can
determine what happens to your team’s performance if you add researchers X and Y.
A publication set is a subset of the publications of a particular researcher defined in SciVal. This is
useful when you want to create a selection of a researcher’s most cited publications or a set of
publications on a particular topic.
Researchers are updated weekly with any new publications, but a publication set is fixed and
never automatically updated with new publications. You can, however, manually add new
publications to a publication set. Citation counts will always be updated.
You can combine multiple publication sets into a new entity: a group of publication sets.
Countries and groups of countries. A country is a type of entity in SciVal representing a nation
state or semi-autonomous part of a state. Publications are assigned to countries by picking up the
country mentioned in the publication. If not present, we take the country from the Scopus
affiliation mentioned in the publication.
A special type of country is the World. This entity represents the total publication output
worldwide, in other words: all publications from Scopus between 1996 and now. It is particularly
useful as a benchmark.
Multiple countries can be combined a new entity: a group of countries. A number of predefined
groups of countries are available in SciVal. These include;
• world regions such as North America, Europe and Asia Pacific
• international organizations such as the European Union, ASEAN and the G20
• various groupings of emerging economies such as Developing-8, CIVETS and BRICS
How to use the entity selection panel. Use the entity selection panel to select the entities that
you want to analyze. It is on the left side of the screen in each of the three modules. Think of the
entity selection panel as a workspace. All your entities of interest are in one clear and organized
place.
Choose from the thousands of pre-defined entities in the SciVal database: institutions or
countries. Or define your own entities. Your self-defined entities can be researchers, research
teams, publication sets or even research areas.
To add additional items to the entity selection panel, click the “Add” link at the bottom of the
currently opened section:
11
SciVal
Get started
12
Start typing the name of the entity you will like to add. Then click on the name when it appears in
the search results. You can also click on the “Define” links to define an entirely new entity.
You can safely remove entities from the panel. They will not be permanently deleted. You can add
them back at any time.
Viewing the list of entities defined by you. To see an overview of all the entities defined by you,
click on “My SciVal” in the top right corner of your screen.
12
SciVal
How you can use SciVal
3
How you can use SciVal
3.1
How can my institution demonstrate research excellence?
13
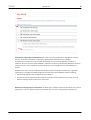
A number of quality metrics are available in SciVal to demonstrate research excellence at your
institution.
Use highly cited publications and publications in leading journals. Two metrics often used to
illustrate excellence of research are Outputs in Top Percentiles and Publications in Top Journal
Percentiles. These show how much of your institution’s publication output was good enough to
rank among the world’s top publications.
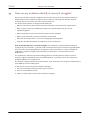
1. Go to the Overview module and select your institution.
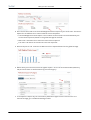
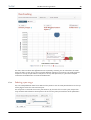
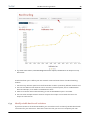
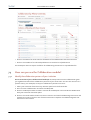
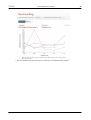
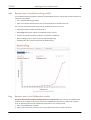
2. Go to the Publications tab and find the Outputs in Top Percentiles section. This shows the share
of your institution’s publications that are within the top 1% and top 10% of the most cited
publications worldwide.
3. As you can see in the chart above, Athena University had almost 25% or more publications in
the top 10 percentile of the most cited publications worldwide from 2008 – 2012.
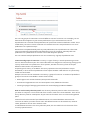
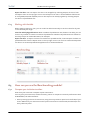
4. The Publications in Top Journal Percentiles section shows how many of your institution’s
publications were in the top 1% and 10% of the world’s journals.
These top journals are selected by measuring all journals by either SNIP or SJR and selecting the
top-ranking ones. You can toggle between SNIP and SJR using the dropdown menu. See
www.journalmetrics.com for more details on SNIP and SJR.
• SNIP (Source-Normalized Impact per Paper) – This measures the citation impact of a journal.
SNIP is normalized for the journal’s subject field, weighting citations based on the number of
expected citations in that field.
• SJR (SCImago Journal Rank) - This measures the prestige of citations received by a journal. The
subject field, quality and reputation of the citing journal have a direct effect on the value of a
citation.
13
SciVal
How you can use SciVal
14
5. As you can see in the chart above, 30% to 35% of the publications at Athena University from
2008 – 2012 were published in the top 10 journals worldwide (measured by SNIP).
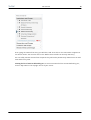
6. Go to the Benchmarking module to see the Outputs in Top Percentiles and Publications in Top
Journal Percentiles metrics for your institution over a longer time period (1996 to present). You
also have additional metric options available here. And you can compare your institution to
other institutions, or the national or global average.
Demonstrate research strengths. Do you have access to the Competencies section in the
Overview module? Then this offers another way to demonstrate excellence.
SciVal’s competency analysis identifies research strengths of your institution – granular areas of
research where your institution is a global leader. A competency shows where an institution has a
leading position compared to other institutions in terms of number of publications, number of
highly cited publications or innovation - the recentness of cited publications.
The competency analysis uses a methodology based on citation patterns called co-citation
analysis. Highly cited publications are clustered based on co-citation counts. The clusters are
grouped together into competencies.
The analysis is always based on five years of data. If you select 2012, the analysis is based on data
from 2008 up until and including 2012.
For more information, see: How can my institution identify its research strengths?
3.2
How can my institution evaluate the impact of our research
portfolio?
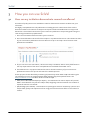
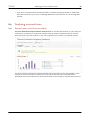
To evaluate the impact of your research, you can use SciVal to analyze your institution’s citation
metrics. Useful metrics include Citation Count, Citations per Publication and Field-Weighted
Citation Impact.
1. Go to the Overview module and select your institution from the left-hand entity selection panel
(Athena University in this example).
2. As you can see, Athena University has averaged 12.1 citations per publications over a five year
time period.
3. If you are interested in a particular field of research or time period, adjust the filters for year
range and Scopus journal category.
14
SciVal
How you can use SciVal
15
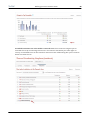
4. Go to the Citations tab to see the Field-Weighted Citation Impact of your institution. This metric
adjusts for the differences in citation behavior across disciplines.
• The Field-Weighted Citation Impact is the number of total citations received divided by the
total citations expected, based on the global average for the field.
• More than 1.00 means that citations are more than expected.
• Less than 1.00 means the citations are less than expected.
5. Athena’s impact is 1.86. Citations are 86% more than expected based on the global average.
6. Where does your institution have the highest impact? Go to the Overview module (Summary
tab) and scroll down to “Performance by Journal Category.”
7. To compare the impact of your institution’s publications against other institutions or the
national average, go to the Benchmarking module.
15
SciVal
How you can use SciVal
16
8. You can also compare the same institutions within a particular subject area. Select your field of
interest from the 27 main categories and 334 subcategories within the Scopus journal
classification.
3.3
How can my institution attract talented researchers?
Who are the most talented researchers in my field? Which institutions are they associated with?
And how do I find them? The best approach to do this in SciVal is to first determine the top
institutions in your field, and then identify the top researchers at those institutions.
16
SciVal
How you can use SciVal
17
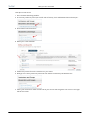
1. Go to the Overview module
2. Select your country or the world in the entity selection panel on the left-hand side.
3. Using the dropdown menu at the top of the page, select your field from the 27 main categories
and 334 subcategories in the Scopus journal classification. Say you are interested in renewable
energy and sustainability:
4. After selecting your field, you can now see the top institutions in that field, based on number of
publications and citations.
17
SciVal
How you can use SciVal
18
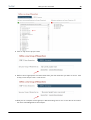
5. Now take a closer look at these institutions. Go to the entity selection panel and select one of
the top institutions.
6. On the Summary tab, you can see the top authors at that institution within the selected field,
based on number of publications, number of received citations, or h-index.
7. You can export the list of authors to a spreadsheet for further analysis, or click on an author’s
name to see their publication profile.
18
SciVal
3.4
How you can use SciVal
19
How can my institution find collaboration partners?
International collaborations can increase your impact and visibility, which could lead to more
funding opportunities. How can you identify suitable international collaboration partners? Which
countries should we focus on? And which institutions are active in which disciplines?
1. Let’s say that your institution is Athena University. It is located in the U.S. and it is looking for a
collaboration partner in Europe for its expanding medical school.
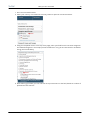
2. Go to the Potential Collaboration tab in the Collaboration module. Select the Scopus journal
category “Medicine” from the dropdown menu at the top of the page.
3. The analysis shows 1,156 institutions in Europe that haven’t yet collaborated with Athena. In
other words: Athena has not co-authored any publications with these institutions within the
selected time period.
19
SciVal
How you can use SciVal
20
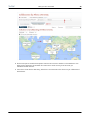
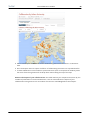
4. Click on Europe to see which European countries are active in medicine. The numbers in the
white circles represent the number of institutions in each country that have not yet
collaborated with Athena.
5. Let’s take a closer look at Germany, which has 119 institutions that have not yet collaborated
with Athena.
20
SciVal
How you can use SciVal
21
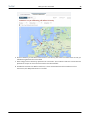
6. Click on Germany to see which institutions in this country are active in medicine but are not yet
collaborating with Athena in this field.
7. Each orange circle in Germany represents an institution. The number inside the circle shows the
publication output at that institution within the selected field.
8. Humboldt-Universitat zu Berlin stands out. There are 974 authors within medicine at this
institution, with 850 publications in this field.
21
SciVal
How you can use SciVal
22
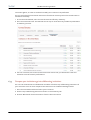
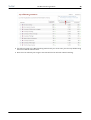
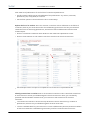
9. You can also view the list of institutions in a table and sort the 100 most productive institutions
by citation impact, using the metrics Citation Count, Citations per Publication and FieldWeighted Citation Impact.
10 To view only hospitals and other medical institutions in Germany, select "Medical" from the
. rightmost of the drop-down menus along the top of the map.
11 You can export a list of all institutions to a spreadsheet for further review.
.
12 For more details on this institution, click on the marker for Humboldt in the map to open the
. institutional details pop-up. Here, you can compare the research output of Humboldt to the
output of your own institution . You can also see a list of potential co-authors at Humboldt.
13 In the institution details pop-up, select "View a high-level performance overview of HumboldtUniversitat zu Berlin" from the Shortcuts menu to view Humboldt in the Overview module and
explore this institution in even more detail. In which fields of medicine are they most active?
Who are the top authors at that institution? How much of their publication output is among
the most cited worldwide, and how much of it is published in the top journals? How much are
they collaborating internationally?
14 Go back to the Collaboration module and select Humboldt from the entity selection panel. You
. can now see who they are already collaborating with. Are they working mostly with other
German institutions or do they have a large international collaboration network?
15 In the Benchmarking module, select Humboldt and Athena University from the entity selection
. panel. Now you can compare the two institutions by various metrics. Does Humboldt have
more or less citation impact than your institution?
22
SciVal
3.5
How you can use SciVal
23
How can my institution identify its research strengths?
Do you have access to SciVal’s “Competencies” section? Then you can use SciVal to identify or
demonstrate areas of research strength at your institution. You may even identify research
strengths of your institution that you are not yet aware of.
For each of these research strengths, SciVal shows you:
• Which institutions are most active in this field, and how is your institution is positioned?
• Who are your institution’s collaboration partners in this field? Who are you not yet
collaborating with?
• Which researchers at your institution are most active in this field?
• What is your institution’s unique contribution to this field?
• What are the overall trends – is this is an emerging or declining field?
• How was this field identified as a competency of your institution?
How SciVal identifies your research strengths. The competency analysis identifies research
strengths of your institution – granular areas of research where your institution is a global leader.
Your institution has a leading position compared to other institutions, in terms of number of
publications, number of highly cited publications or innovation - the recentness of cited
publications.
The competency analysis uses a methodology based on citation patterns called co-citation
analysis. Highly cited publications are clustered based on co-citation counts. The clusters are
grouped together into competencies.
The analysis is always based on five years of data. If you select 2012, the analysis is based on data
from 2008 up to and including 2012.
To see the list of your institution’s research strengths:
1. Go to the Overview module and select your institution.
2. Click on the Competencies tab.
3. Select the Table view to see the list of research strengths.
23
SciVal
How you can use SciVal
24
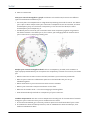
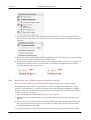
4. Select the Circle and Matrix views to see the research strengths plotted on a graph.
• The Circle plots the competencies on a big wheel representing the world of science. This
allows you to spot in which subject areas your institution’s competencies are concentrated,
and how interdisciplinary they are. The closer a competency to the center of the wheel, the
more interdisciplinary that competency is.
• The Matrix plots the share of your institution within each competency against the growth of
that field of research. This allows you to, for instance, spot emerging fields of research where
your institution isn’t yet playing a leading role.
3.6
What is the impact of adding a new researcher to my team?
SciVal allows you to do “what if” scenario modeling. If I add researcher X to my team, how would
my team perform?
Let’s define a research team and then compare its performance to a team made up of the current
24
SciVal
How you can use SciVal
25
team plus a new recruit.
1. Go to the Benchmarking module.
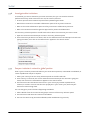
2. In the entity selection panel (on the left side of screen), click “Add Researchers and Groups” .
3. Click “Define new researcher”.
4. Define your team member.
5. Follow this process for each researcher on your team.
6. Now go to the entity selection panel and click “Define a new Group of Researchers”.
7. Select your researchers from the left side of your screen and drag each one across to the right
side of the screen.
25
SciVal
How you can use SciVal
26
8. Save as “My current project team”
9. Define a second group with the same researchers, plus the researcher you want to recruit. Save
as “My current Project team + new recruit.”
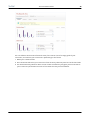
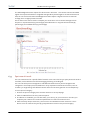
10 Now you can compare the two groups. in Benchmarking. Click on the “x-axis” button and select
. the metric Field-Weighted Citation Impact.
26
SciVal
How you can use SciVal
27
11 Compare the performance of the current team versus the expanded team. As you can see, the
. addition of the new recruit would significantly strengthen the performance of your team.
12 Try a few additional metrics. Other useful metrics for comparison include Scholarly Output,
. Citation Count, Citations per Publication, and Collaboration Impact.
27
SciVal
Data and metrics
4
Data and metrics
4.1
What is the source of the data in SciVal?
28
SciVal is based on data from Scopus, the world’s largest abstract and citation database for peerreviewed publications.
The Scopus database covers over 30 million publications from 1996 until the present:
• 21,000 serials from 5,000 publishers. These include:
• 20,000 peer-reviewed journals
• 390 trade publications
• 370 book series
• 5.5 million conference papers
For detailed information on the data used in SciVal, see the SciVal Metrics Guidebook.
Download the SciVal Metrics Guidebook (PDF format)
4.2
How current is the data?
Publications, author and affiliation profiles in SciVal are updated every week. So our data is almost
in total sync with Scopus.
SciVal does a weekly check for new publications in Scopus. Researchers in SciVal are then
automatically updated with any new publications found in Scopus.
4.3
What publication types can you use?
SciVal includes all types of publications that are classified by Scopus. You can refine your analysis
based on the following types of publications:
• articles
• reviews
• conference papers
• editorials
• short surveys
• books
4.4
Which metrics are available to use in SciVal?
SciVal uses a broad range of metrics, including the Snowball Metrics. The metrics can be divided
into four categories:
28
SciVal
Data and metrics
29
• Productivity metrics
These measure research productivity
• Citation impact metrics
These measure the impact of citations
• Collaboration metrics
These measure the benefits of collaboration
• Disciplinary metrics
These measure multidisciplinarity
The Metrics Guidebook discusses each SciVal metric in detail. The guidebook offers suggestions on
how and when to apply each metric.
Download the SciVal Metrics Guidebook (PDF format)
The available metrics are:
Scholarly Output
The number of publications of a selected
entity
Journal Count
The number of journals in which an
entity's publications have appeared
Category Count
The number of journal categories in which
a selected entity's publications have
appeared
Citations Count
Total citations received by publications of
the selected entities
Snowball Metric
Citations per Publication
The average number of citations received
per publication
Snowball Metric
Cited Publications
Publications that have received at least
one citation
Number of Citing Countries
The number of distinct countries
represented by the publications citing a
selected entity
Field-Weighted Citation
Impact
The ratio of citations received relative to
the expected world average for the
subject field, publication type and
Snowball Metric
Snowball Metric
29
SciVal
Data and metrics
30
publication year
4.5
Collaboration
The extent of international, national and
institutional co-authorship
Collaboration Impact
The average number of citations received
by publications that have international,
national or institutional co-authorship
Academic-Corporate
Collaboration
Publications whose affiliation information
contains both academic and corporate
organization types
Academic-Corporate
Collaboration Impact
The average number of citations received
by publications that have academiccorporate collaboration
Outputs in Top Percentiles
Publications of a selected entity that have
reached a particular threshold of citations
received
Publications in Top Journal
Percentiles
The set of an entity’s publications that
have been published in the world's top
journals
h-index
A measure of both the productivity and
publication impact of an entity, which
depends on both the number of
publications and the number of citations
they have received
Snowball Metric
Snowball Metric
Snowball Metric
What are Snowball Metrics?
The Snowball Metrics were initiated by eight highly successful research universities as a
manageable set of metrics that capture the strategic aspects of research performance. The
ambition is for the Snowball Metrics to become the global standard for the higher education
sector. The agreed and tested definitions are shared free of charge with the research community.
Elsevier supports Snowball Metrics as a recognized industry standard and has implemented many
of the metrics in SciVal. You can recognize these metrics by the following icon:
30
SciVal
Data and metrics
31
More information about Snowball Metrics is available on snowballmetrics.com:
• More info about Snowball Metrics
• Download the Snowball Metrics Recipe Book (PDF format)
31
SciVal
The Overview module
5
The Overview module
5.1
What is the Overview module?
32
The Overview module provides a high-level overview of your institution’s research performance
based on publications, citations, and collaboration.
In addition, you can review the performance of any of the 4,600+ institutions and 200+ countries in
our database. You can even define your own research areas and groups of researchers and review
their performance.
All data can be filtered by a specific subject area. The data can be exported, and you can review the
underlying list of publications behind every publication count.
5.2
Working with the Overview module
5.2.1
Selecting an entity
Use the entity selection panel on the left-hand side to select the entity you want to view.
1. Open the section that contains the entity you want, e.g. “Institutions and Groups” for an
institution.
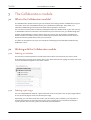
2. If the entity you want is not listed, click on the “Add” link and start typing the name, then click
on the name when it appears in the search results.
3. You can also define your own groups of researchers and research areas.
5.2.2
Selecting a year range
You can view publication data for a period of either three or five years. Use the year range selector
at the top of the page to select the desired year range.
Optionally, you can also include the current year and future publications. However, you may want
to exclude this because, by the end of the current year, Scopus has only received and indexed a
certain portion of the current year’s journals from other publishers.
32
SciVal
5.2.3
The Overview module
33
Filtering by journal category
Interested in evaluating or comparing your performance within a specific discipline? Choose from
27 categories and 334 subcategories in the Scopus journal classification.
1. Use the filter dropdown menu at the top of the page to select a specific journal category.
2. The subcategories appear when you click on the arrow in a category.
3. After your select a journal category, all data shown in SciVal will be filtered by that category.
That is to say, the data will be limited to publications in journals within that category.
4. Choose “no filter selected” from the menu to remove the filter and show all data.
5.3
How can you use the Overview module?
5.3.1
Get an overview of your institution's research performance
You can get an overview of your institution’s research performance in terms of publications and
citations, and answer questions such as:
33
SciVal
The Overview module
34
• Who are the most prolific or most cited authors at my institution?
• In which disciplines is my institution most active?
• In which journals is my institution publishing the most?
• What are the most cited publications of my institution?
• Who are the top collaboration partners of my institution?
To view your institution in Overview:
1. Go to the Overview module and make sure your institution is selected in the entity selection
panel on the left-hand side.
2. Select the year range you want from the first dropdown menu at the top of the page pear when
you click on the arrow in a category.
3. Do you want to view your institution’s research performance within a specific discipline (such as
chemistry or engineering)? Then select a journal category from the second dropdown menu at
the top of the page
4. Click between the Summary, Publications and Citations tabs to get an overview of your
institution’s research performance in terms of publications and citations.
5.3.2
Explore the publication output of your institution
You can see the total list of publications at your institution by clicking on “View list of publications”
on the Summary tab. The most cited publications are at the top.
• The filter options on the left-hand side allow you to explore your institution’s publications in
various ways. For example, you can see the top authors and journals, the top collaborating
institutions and countries, and the top keywords.
• Try filtering the publications by any of the filter options. The breakdown is now recalculated to
reflect the new subset.
34
SciVal
5.3.3
The Overview module
35
Get an overview of your institution's research strengths
Do you have access to the Competencies tab? Then you can also see an analysis of your
institution’s research strengths, or “competencies” as they are known in SciVal. You can also see
the national research strengths of your country. Or you can see the strengths of any other
institution or country.
The competencies analysis identifies areas of research in which your institution is a global leader in
terms of publications, citations, or innovation (here defined as citing recent research). This is the
same analysis that’s shown in SciVal Spotlight.
You can get detailed information on each of these areas, such as:
• How is your institution positioned in this field?
• Which researchers are most active in this field?
• What is your institution’s unique contribution to this field?
• What are the overall trends – is this is an emerging or declining field?
View the list of research strengths. To see the list of your institution’s research strengths:
1. Go to the Overview module and select your institution.
2. Click on the Competencies tab
35
SciVal
The Overview module
36
3. Select the Table view
View your research strengths in a graph. In addition to the table view, there are two different
types of visualizations available to you:
• The Circle plots the competencies on a big wheel representing the world of science. This allows
you to spot in which subject areas your institution’s competencies are concentrated, and how
interdisciplinary they are. The closer a competency to the center of the wheel, the more
interdisciplinary that competency is.
• The Matrix plots the share of your institution within each competency against the growth of
that field of research. This allows you to, for instance, spot emerging fields of research where
your institution isn’t yet playing a leading role.
Analyze your research strengths in detail. Click on a competency in Table, Circle or Matrix to
open a pop-up window where you can explore that competency in detail. For instance, this shows
you:
• Which institutions are most active in this field, and how is your institution positioned?
• Who are your institution’s collaboration partners in this field? Who are you not yet
collaborating with?
• Which researchers at your institution are most active in this field?
• What is your institution’s unique contribution to this field?
• What are the overall trends – is this is an emerging or declining field?
• How did SciVal identify this field as a competency of your institution?
Combine competencies. Are two or more competencies actually part of the same area of research
strength at your institution? Then you can combine them in SciVal.
1. In the Overview module, go to the entity selection panel on the left-hand side of your screen.
2. In the Research Areas and Groups sections, click on “Add Research Areas and Groups”, then
“Define a new Research Area”
36
SciVal
The Overview module
37
3. A popup window now opens where you can define a research area. Select the “Use
competencies” tab.
4. Drag the competencies that you want to combine from the left side to the right side of the
screen. When you are done, click Next Step.
5. Name and save the research area.
6. The new research area will now be computed and shown in Overview.
5.3.4
Get an overview of collaboration by your institution
The Overview module also shows the top external collaboration partners of your institution, and
how much your institution is collaborating (including international collaboration). Collaboration is
measured in terms of co-authored publications.
• The filter options on the left-hand side allow you to explore your institution’s publications in
various ways. For example, you can see the top authors and journals, the top collaborating
institutions and countries, and the top keywords.
• Go to the Collaboration module for a much more detailed view of external collaboration at your
institution.
5.3.5
Evaluate the performance of a group of researchers
SciVal lets you define and evaluate groups of researchers. These can be research teams at your
institution, but also larger units such as institutes, departments, and faculties.
You can even define fantasy researcher groups. For example, you can simulate what would
happen when you add a top researcher from another institution to an existing research team at
your institution.
To define and view a group of researchers:
1. Go to My SciVal and click on “Define a new Researcher” to define the individual researchers that
will make up your group.
2. Click on “Define a new Group of Researchers” to define the group.
3. Now go to Overview and select your new group.
4. You can now evaluate the research performance and collaboration of this group.
The “Top Researchers” section on the Summary tab shows the top 5 researchers in that group by
number of publications, number or citations or h-index. Click on “View list of Researchers” at the
top of the Summary tab to see the complete list of researchers that make up the group.
If different units of your institution have been predefined in SciVal as groups of researchers, the
Collaboration tab will show you how much internal collaboration is taking place within the group,
and how much collaboration with other groups within the same parent group, for example other
departments within the same faculty.
37
SciVal
5.3.6
The Overview module
38
Investigate other institutions
In Overview, you are not limited to your own institution, but you can view the research
performance of any other institution. You can, for instance, find out:
• In which journals are the world’s top institutions publishing the most?
• Would this institution be a suitable collaboration partner for my own institution?
• Who are the other collaboration partners of my institution’s collaboration partners?
• Who at this institution would be good to approach for potential collaboration?
Use the entity selection panel on the left-hand side to select the institution you want to view.
1. Open the “Institutions and Groups” section in the entity selection panel
2. If the institution you want is not listed, click on the “Add Institutions and Groups” link and start
typing the name, then click on the name when it appears in the search results.
5.3.7
See your institution's national or global position
How is your institution positioned? What is your institution’s position, nationwide or worldwide, in
terms of publication output or impact?
1. Select your country from the entity selection panel on the left-hand side.
2. If the country is not listed, click on the “Add Countries and Groups” link and start typing the
name, then click on the name when it appears in the search results.
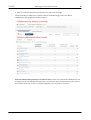
3. The Institution tab ranks all the institutions in your country by number of publications,
citations, or authors. You can see who the top players in your country are, and how your
institution ranks among them.
You can also get a picture of what’s happening worldwide:
1. Select “World” from the “Countries and groups” sections of the entity selection panel.
2. The Institutions tab ranks all institutions worldwide.
3. You can also see the top journals worldwide (under “Publications by journal”).
38
SciVal
5.3.8
The Overview module
39
Identify potential collaboration partners
The Institutions tab for a country can also be used to identify potential collaboration partners.
Say you are looking for collaboration partners in China within the field of inorganic chemistry:
1. Select China in the entity selection panel
2. Select Inorganic Chemistry from the dropdown menu at the top of the page
3. Go the Institution tab to find out who the key players in that country are.
4. For more details on any of the institutions in this list (such as the top authors at that institution
or how much it is collaborating internationally), select it from the entity selection panel.
5.3.9
See your institution's performance in a specific research area
SciVal allows you to define a specific field of research. They can for instance represent a strategic
priority of your institution or an emerging area of science. Unlike the fixed, broad categories of the
Scopus journal classification, these research areas can be as granular or interdisciplinary as you
like.
Once you have defined a research area, you can
• see how your institution is performing in that field
• spot national and international trends
• identify collaboration partners
Say that you are interested in how much research is happening at your institution on
neuroinformatics within the field of computer science.
1. Click on “Add Research Areas and Groups”, then “Define a new Research Area” in the entity
selection panel on the left-hand side of the Overview module.
2. Define your Research Area using the search term “neuroinformatics”.
3. Narrow down your definition by limiting it to publications in computer science journals only.
4. Name and save the research area
5. You can now select and view the research area in the Overview module.
39
SciVal
The Overview module
40
You can define a whole series of research areas, for instance a list of strategic goals of your
institution, and see how your institution is performing in all of these.
1. Define your research areas.
2. Go to Overview and select your institution from the entity selection panel on the left-hand side.
3. The “Performance by Research Area” section under the Summary tab gives you an overview of
your institution’s performance in each of the research areas you have defined.
40
SciVal
The Benchmarking module
6
The Benchmarking module
6.1
What is the Benchmarking module?
41
The Benchmarking module lets you easily evaluate your research performance in comparison to
others. How does your institution compare to others in your region, country or the world?
Choose from a broad range of metrics. You can use 15 different metrics to compare the
performance of different types of entities, such as institutions, research teams and individual
researchers.
Which metrics are available to use in SciVal?
6.2
Working with the Benchmarking module
6.2.1
Selecting metrics
Select the metric you want to view. By default, the metric Scholarly Output (number of
publications) is shown. To view a different metric, click on the “y-axis” button along the top of the
chart and select it from the list. Then click on the “Choose as y-axis” button.
Which metrics are available to use in SciVal?
Choose metric options. Each metric has different options, but all let you choose the types of
publications to include. For instance, you can choose to include only articles and reviews, or only
conference papers.
Citation metrics also let you choose whether or not you want to include self-citations.
Plot metrics against each other. You can plot two or even three different metrics against each
other. Two metrics are shown as a scatter plot. Three metrics are shown as a bubble chart, where
the size of the bubbles (circles) on the chart indicates the value of the third metric.
Select a second metric from the “x-axis” button. This will replace “Publication Year” with that
metric. If you want, you can select a third metric from the “bubble size” button.
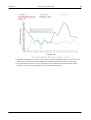
Let’s compare Athena, Yale and the United States on three metrics: Scholarly Output, FieldWeighted Citation Impact and International Collaboration.
1. Select Athena University, Yale and the United States from the entity selection panel on the lefthand side of the screen.
2. Click on the “y-axis” button and select Scholarly Output, if this wasn’t already selected
3. Click on the “x-axis” button and select Field-Weighted Citation Impact.
4. Click on the “Bubble size” button and select Collaboration. In the options for this metric, select
“International collaboration”.
5. The chart now shows that Athena’s international collaboration is slightly higher than the U.S.,
but lower than Yale’s.
41
SciVal
The Benchmarking module
42
You don’t have to select two different metrics necessarily. Instead, you can also select the same
metric for both “x-axis” and “y-axis”, but with different options. For instance, you could compare
outputs in the top 1% percentile to outputs in the top 10% percentile, or you could compare
international collaboration to national collaboration.
6.2.2
Selecting a year range
You can view publication data from 1996 until the present. Use the time period selector at the top
of the page to select the start and end year.
You may want to exclude the current year because, by the end of the current year, Scopus has
only received and indexed a certain portion of the current year’s journals from other publishers.
42
SciVal
6.2.3
The Benchmarking module
43
Filtering by journal category
Interested in evaluating or comparing your performance within a specific discipline? Choose from
27 categories and 334 subcategories in the Scopus journal classification.
1. Use the filter dropdown at the top of the page to select a specific journal category.
2. The subcategories appear when you click on the arrow in a category.
6.2.4
Working with the chart
Chart legend. Each entity plotted on the chart has a different color and symbol. This is shown in
the legend shown next to the chart. You can hide a particular entity from the chart by clicking on
the checkbox next to that item in the legend.
Data pop-ups. Hover over a data point on the chart and a small pop-up will appear with the
metrics you have selected and their values for that year.
43
SciVal
The Benchmarking module
44
Export the chart. You can export the chart to an image file by selecting “Export the chart” from
the Export menu in the top right corner. This will export the chart in several different file formats
at once (JPEG, PNG, SVG and PDF). You can also export the underlying data by choosing “Export
the data to a spreadsheet file”.
6.2.5
Working with the table
When viewing a metric by year, you can scroll the table horizontally to see the values for all years
in the selected year range.
View the underlying publications. When numbers of publications are shown in the table, you can
click on any number to view the actual list of publications. Numbers of publications are shown for
Scholarly Output or Cited Publications, for example.
Export the data. To export the data in the table to a spreadsheet file, choose “Export the data to a
spreadsheet file” from the Export menu in the top right corner. You can then view and manipulate
the data in an external spreadsheet application such as Microsoft Excel.
6.3
How can you use the Benchmarking module?
6.3.1
Compare your institution to others
How does your institution compare to peer institutions?
Let’s say that your institution, Athena University, wants to compare its research performance with
SUNY Buffalo, Yale and Dartmouth.
1. Start by setting up the list of institutions, using the entity selection panel on the left side of your
screen. Make sure your institution and the peer institutions are all selected (checked off) in the
entity selection panel.
44
SciVal
The Benchmarking module
45
2. If an institution is not listed, click “Add Institutions and Groups” and start typing the name of
that institution. Then select the institution from the list of search results that appears below the
text field.
3. By default, you will view Scholarly Output by publication year. This shows you the total research
output of your selected institutions over a period of time.
4. Use the buttons along the top of the chart to select different metrics. Use the “y-axis” button to
change from Scholarly Output to another metric. To compare two different metrics, select a
second metric from the “x-axis” button.
6.3.2
Benchmark your institution against the national average
Do you want to compare your institution’s research performance to the national average?
Field-Weighted Citation Impact is a good metric to use, since it adjusts for differences in citing
behavior across disciplines. A score of 1.00 means citations are as expected based on the global
average. More than 1.00 means that citations are more than expected. Less than 1.00 means the
citations are less than expected.
1. Select Field-Weighted Citation Impact from the “y-axis” button.
2. Make sure your institution and your country are selected in the entity selection panel on the
left side.
3. If your country is not listed in the entity selection panel, click “Add Countries and Groups” and
start typing the name of that country. Then select the country from the list of search results
that appears below the text field.
Let’s say that you want to compare your institution, Athena University, to the national average.
45
SciVal
The Benchmarking module
46
The Field-Weighted Citation Impact for Athena was 1.83 in 2011. This means citations were 83%
higher than expected based on the global average. When plotted against the United States and
Yale, we can see that Athena’s Field-Weighted Citation Impact is higher than the US national
average, but it is slightly lower than Yale.
Other metrics that can be used to compare your institution to the national average include
Outputs in Top Percentiles (by percentage), and Publications in Top Journal Percentiles (by
percentage), and Collaboration (by percentage).
6.3.3
Spot research trends
You can view metrics for a specific field of research over time. This lets you spot potential trends in
that field, such as whether the field is emerging, declining or levelling off.
You can use either journal categories or self-defined research areas. Journal categories are
categories in the Scopus journal classification. They represent broad areas of science, such as
chemistry or engineering. Self-defined research areas can be more granular or interdisciplinary.
To use a journal category:
1. Choose the journal category from the filter selector at the top of page.
2. Select the World from the entity selection panel.
3. In addition to the World, you can also select your country or your institution. This lets you
compare your national or institutional performance to the international trend.
4. Select Scholarly Output from the “y-axis” button and “Publication Year” from the “x-axis”
button. You can now see the year-by-year publications trend in this journal category.
46
SciVal
The Benchmarking module
47
5. Try some other metrics, like Field-Weighted Citation Impact, Collaboration or Outputs in Top
Percentiles.
SciVal also allows you to define your own research areas and view these in the Benchmarking
module.
1. Use the entity selection panel on the left-hand side to select a previously defined research area.
2. You can also define a new research area. In the entity selection panel, click on “Add Research
Areas and Groups”, then “Define a new Research Area”.
3. Select the research area in Benchmarking to see the worldwide output in that field.
4. You can select multiple research areas to compare the output in one research area to the
output in another area.
6.3.4
Identify suitable benchmark institutions
If you have access to the Overview module, you can make use of it to identify suitable benchmark
institutions for your institution. These are institutions that you can use to compare your own
47
SciVal
The Benchmarking module
48
institution against, in order to evaluate how well your institution has performed.
Say you are looking for benchmark institutions for Athena University within the United States in
the field of chemistry.
1. In the Overview module, select the United States and filter by chemistry.
2. Go to the Institutions tab. This will now list the top U.S. institutions by number of publications
in chemistry journals.
3. You can now select one or more institutions from this list that you would like to match or
exceed in terms of research performance.
6.3.5
Compare your institution against collaborating institutions
You can use the Overview or Collaboration modules to find the top collaborating institutions of
your institution. You can then compare these institutions in the Benchmarking module.
1. Go to the Overview module and select your institution.
2. Find the Top collaborating institution section on the Summary tab.
3. Choose “Benchmark these institutions” from the Shortcuts menu.
48
SciVal
The Benchmarking module
49
4. You will now jump to the Benchmarking module and your institution, plus the top collaborating
institutions will be selected there.
5. Note that the selected year range in Overview will also be selected in Benchmarking.
49
SciVal
The Collaboration module
7
The Collaboration module
7.1
What is the Collaboration module?
50
The Collaboration module is where you can evaluate the existing research collaborations of your
institution. Start with a worldwide view of your collaboration landscape. Then zoom in to
individual collaborating institutions and researchers anywhere in the world.
You can also use this module to identify new opportunities for collaboration in your own country
or worldwide. See which institutions and researchers your institution isn’t yet collaborating with.
All data can be filtered by a specific subject area. Say you are only interested in collaboration
within the field of chemistry. Then you can view only institutions and researchers that have coauthored chemistry publications with your institution.
The data can be exported, and you can review the underlying list of publications behind every
publication count.
7.2
Working with the Collaboration module
7.2.1
Selecting an institution
Use the entity selection panel on the left-hand side to select the institution you want to view.
If the institution you want is not listed, click on the “Add” link and start typing the name, then click
on the name when it appears in the search results.
7.2.2
Selecting a year range
You can view publication data for a period of either three or five years. Use the year range selector
at the top of the page to select the desired year range.
Optionally, you can also include the current year and future years. However, you may want to
exclude this because, by the end of the current year, Scopus has only received and indexed a
certain portion of the current year’s journals from other publishers.
50
SciVal
7.2.3
The Collaboration module
51
Selecting a region, country or sector
You can limit the list of institutions shown to a specific world region or country. This will apply to
both the "Current collaboration" and "Potential collaboration" views, and to both the Map and
Table views.
In addition, you can filter the list of institutions by sector. For instance, you can choose to view
only institutions in the corporate sector, or only institutions in the medical sector.
You can also combine the geographical and sector selections. For example, you could choose to
view only corporations in France, or only medical institutions in North America.
Select a region. From the drop-down menu marked "Worldwide", select the region you would like
to view, for instance North America, Asia Pacific or Europe. In Map view, you can also click on one
of region markers that are shown on the map when you are zoomed out to worldwide view.
Select a country. Start by selecting the region of the country you want from the leftmost dropdown menu, A second drop-down menu now appears that lets you pick the country. For example,
to select the United States, select "North America" from the first menu, then select "United States"
from the second menu. In Map view, you can also click on one of blue-on-white country markers
that are shown on the map after you have zoomed in to a particular region. To return to region
level, select "All countries" from the country menu.
51
SciVal
The Collaboration module
52
Select a sector. Use the rightmost drop-down menu to select a specific sector, such as corporate
or medical.
7.2.4
Filtering by journal category or research area
Interested in evaluating or comparing your performance within a specific discipline? You can
choose from 27 categories and 334 subcategories in the Scopus journal classification.
52
SciVal
The Collaboration module
53
1. Use the filter dropdown menu at the top of the page to select a specific journal category.
2. The subcategories appear when you click on the arrow in a category.
Filter by research area. You can also filter by research areas that you have defined yourself. These
can be as granular or interdisciplinary as you like.
1. Select your institution from the entity selection panel on the left-hand side.
2. Use the filter dropdown menu at the top of the page to select a specific research area.
3. If you have not yet defined the research area, click on “Define a Research Area” in the filter
menu.
7.2.5
Working with the map
Zooming in and out. You can use the zoom control in the top left corner of the map to zoom in
and out. You can also double-click on the map to zoom in further.
Zoom in on a region. At world level, the map gives you an overview of your global collaboration
landscape.
• There are markers on the map for each of the world regions (Asia Pacific, North America, South
America, Europe, Middle East, and Africa). These markers show you how many collaborating
institutions there are in each region.
• Click on one of the region markers at world level to zoom in to that region.
53
SciVal
The Collaboration module
54
Zoom in on a country. After zooming in on a region, you see a number of round markers for each
of the countries in that region.
• These country markers display the number of collaborating institutions in each country.
• Click on a country marker to zoom into that country.
Zoom in on an institution. You can now click on any of the institutions. A pop-up window opens
with full details on the collaboration with that institution.
7.2.6
Working with the table
Instead of the map view, you also see your institution’s (potential) collaborating institutions in a
tabular list view.
In “Current collaboration” this table view shows the top 100 collaboration institutions, by number
of publications. You can use the dropdown menus at the top to view the top collaborating
institutions in a specific region or country.
• You can change the sort order of the table by clicking on any of the column headings.
• You can use the dropdown menu to switch from citations to a different metric for citation
impact.
54
SciVal
The Collaboration module
55
• Click on the name of an institution for full details of the collaboration with that institution
• Click on the number of co-authored publications to view the list of publications
Use the Export menu to export the full list of collaborating institutions to a spreadsheet file.
7.3
How can you use the Collaboration module?
7.3.1
Identify the collaboration partners of your institution
Get an overview of your collaboration landscape. The map view in Current collaboration gives
you a global overview of the collaboration partners of your institution. You can then zoom in to a
specific country. For example, to see your collaboration partners in France:
1. Select your institution from the entity selection panel on the left-hand side.
2. Go to “Current collaboration” and select the Map view
3. Click on the Europe marker to zoom in and see all the European countries where collaboration
with your institution has taken place.
4. Click on the round marker shown in France to zoom in and see all collaborating institutions and
researchers in France. Click on one of these institutions to explore the collaborating with that
institution in more detail.
55
SciVal
The Collaboration module
56
5. Switch from map to table view to see the collaborating institutions in France in a tabular list
view.
6. Go to the Export menu to export the full list of collaborating institutions to a spreadsheet file.
7. To view collaboration in France within a particular sector (such as corporate or medical), select
the sector from the rightmost olf the drop-down menus along the top of the map.
Measure the impact of your collaborations. The table view lets you compare institutions by the
number of publications co-authored with each. You can also evaluate the impact of your
collaborations using metrics such as number of citations or Field-Weighted Citation Impact.
56
SciVal
The Collaboration module
57
View your collaborations within a specific field of research. Do you want to see the
collaborations of your institution within a specific field of research? Then select a filter from the
dropdown menu at the top of the page. For example, to see collaboration within chemistry only,
choose Chemistry from the menu.
• You can choose from 27 categories and 334 subcategories in the Scopus journal classification
• You can also define your own research areas, which can be as granular or interdisciplinary as
you like.
57
SciVal
7.3.2
The Collaboration module
58
Evaluate a collaboration partner in detail
Click on any institution in either map or table view. You can now zoom into that institution and
look at your collaboration with that institution in much greater detail.
If you’ve filtered the data by a journal category or research area, you will see only the collaboration
with that institution in the field of research you’ve selected.
Compare the co-authored publications to the overall output of the institutions. At the top of
the pop-up window, you can compare the co-authored publications to the total output at each
institution.
• Which is the most active and most cited of the two institutions?
• Do the co-authored publications have more citation impact than the individual institutions’
overall publication output?
View the list of co-authored publications. The pie chart in the pop-up window gives you a
breakdown of the co-authored publications by journal category. In which disciplines did most of
the collaboration occur?
You can also view this as a bar chart, which lets you compare the co-authored publications by
journal category to the total output of each institution by journal category.
58
SciVal
The Collaboration module
59
Click “View list of publications” for the full list of co-authored publications.
• The filter options will show you a breakdown of the publications – by author, institution,
publication year, or keyword, for instance.
• Use the filter options to slice and dice the list in various ways.
Explore the list of co-authors. Go to the "Current co-authors" tab to drill down to the full list of
co-authors, both at your institution and at the collaborating institution. This lets you see which
researchers have co-authoring publications, and which of those collaborations had the most
citation impact.
• Click on a researcher’s name for more details on that researcher’s publication career.
• Click on the arrow next to each name to see their co-authors at the other institution.
• Use the Export menu to export the complete list of co-authors to a spreadsheet file.
Identify potential new co-authors. Go to the "Potential co-authors" tab to see which researchers
at each institution are not yet collaborating with the other institution. Here, you can identify
potential matches between researchers at your institution and researchers at the other
institution.
• The "Potential co-authors" tab lists the top 100 authors at each institution, by number of
publications, who are not yet collaborating with the other institution.
• The list is available both for your institution's current collaboration partners (institutions where
at least one researcher is collaborating institution), and for institutions where no one is
59
SciVal
The Collaboration module
60
collaborating with your institution yet.
• This view is particularly useful when filtering by a specific research area or journal category
Other ways to evaluate a collaboration partner. Use the Shortcuts menu in the institution
details pop-up to examine a collaboration partner in even more detail. You can:
• get a high-level overview of the institution in the Overview module
• view and compare metrics for that institution in Benchmarking
• see the collaboration partners of that institution in the Collaboration module
7.3.3
Identify potential new collaboration partners of your institution
Switch to the “Potential collaboration” tab to see institutions that haven’t yet co-authored any
publications with your institution. This allows you to identify potential new opportunities for
collaboration.
This view is similar in many ways to the “Current collaboration” view:
• You can see these institutions in either map or table view, and zoom in from the world to a
particular region or country.
• You can also use the Export menu to export the list of institutions to a spreadsheet file.
Potential collaboration partners are arranged by their total publication output. In table view, you
also see their citation impact.
60
SciVal
The Collaboration module
61
View potential collaboration partners within a specific field of research. The “Potential
collaboration” view is most useful when you filter the data by a particular field of research.
Say you are only interested in collaboration within the field of chemistry. Then you can view only
institutions that have are active within chemistry, but have not yet co-authored any chemistry
publications with your institution.
• You can choose from 27 categories and 334 subcategories in the Scopus journal classification.
• You can also define your own research areas, which can be as granular or interdisciplinary as
you like.
Evaluate a potential collaboration partner. Click on any institution in either map or table view.
You can now zoom into that institution and evaluate that institution as a potential new
collaboration partner in much greater detail.
• At the top of the pop-up window, you can compare the total output at each institution.
• The pie chart and bar chart below that let you compare the total output of each institution by
journal category. Where do the institutions overlap and where is their research unique?
• Go to the "Potential co-authors" tab to see the top researchers at each institution. Here, you
can identify potential matches between researchers at your institution and researchers at the
other institution.
Use the Shortcuts menu in the institution details pop-up to examine a potential collaboration
partner in even more detail. You can:
• get a high-level overview of the institution in the Overview module
• view and compare metrics for that institution in Benchmarking
61
SciVal
The Collaboration module
62
• see the collaboration partners of that institution in the Collaboration module
62
SciVal
Defining your own research areas
8
Defining your own research areas
8.1
About research areas in SciVal
63
SciVal gives you the flexibility to model, evaluate and benchmark any field of research. This can be
a strategic priority, an emerging area of science or any other topic of interest.
Once you have defined a research area, you can:
• evaluate your institution’s output in that field
• see which other institutions and researchers are active in this field
• compare the output of your institution in that field against other institutions,
• identify existing and potential new collaboration partners
User-defined research areas offer an alternative to subject area classifications like the Scopus
journal classification. They can be as granular or interdisciplinary as you like.
Research areas are not fixed, but represent a dynamic definition of a field of science. Whenever the
publication data in Scopus is updated, new publications matching the definition are added to the
research area.
8.2
Defining a research area
The definition of a research area can either be keywords or entities. If this definition is too broad,
you can apply filters to narrow it down further.
Let’s say that your institution has made research on graphene a strategic focus. You are
specifically interested in research on the thermal conductivity of graphene, and want to see how
well your institution performs in this area.
1. Go to the Overview module.
2. Open the “Research Areas and Groups” section of the entity selection panel on the left-hand
side of the screen.
3. Click on “Add Research Areas and Groups”, then “Define a new Research Area”.
63
SciVal
Defining your own research areas
64
A pop-up window will now open. Here you can define your research area using a 3-step process.
Step 1. Start by defining your research area:
1. Go to the tab “Use search terms”
2. Enter “thermal conduction graphene” in the input field.
3. Press the Search button.
Step 2. You will now proceed to step 2. Here you can see how many publications worldwide (since
1996) match the definition “thermal conduction graphene”.
Apply filters (if needed) to narrow down the definition of your research area. Let’s say that you are
interested only in academic publications. To filter out other organization types:
1. Click on the tab “Organization types”
2. Check off “Academic”
3. Click on “Limit to”
The filter you have just applied will now be shown on the right side of the screen.
64
SciVal
Defining your own research areas
65
Step 3. Click “Next Step” in the bottom right corner to proceed to step 3.
1. Name your research area “Thermal Conductivity Graphene (Academic)”
2 Click "Save and finish".
Your research area is now computed, and you are returned to the Overview module.
See Search tips for more help with using search terms to define a research area.
8.3
Search tips
Search technology in SciVal. When you use search terms to define your research area, SciVal will
search the Scopus database for publications matching your search terms. We search through the
publication titles, as well as the abstracts and the keywords that Scopus assigns to each
publication.
SciVal uses a search engine called Apache Solr, while Scopus uses FAST ESP. So the results returned
65
SciVal
Defining your own research areas
66
from search queries might differ in SciVal and Scopus, even though they use the same data source.
Compare Bing and Google Search for example - both search the Web, but return different results.
Key search tips for creating a Research Area
• Choose search terms that are specific and closely related to your research area
• Avoid very general terms like 'cell'
SciVal ignores accents and upper/lower case
• The search is not case-sensitive. It will match both upper-case and lower-case text
• Terms containing accented characters will be found if you type in the unaccented version, for
example u to represent ü or ú
SciVal uses a stemming algorithm that reduces words to their root form
• If you enter 'fishing', 'fished', 'fish', or 'fisher', they will all be stemmed automatically so that the
search is conducted on the root word, 'fish'
• If you use the singular form of a word, your search will retrieve the singular, plural, and
possessive forms of most words
• Search strings containing wild-cards are not reduced to their root form
Your syntax will make a difference in how SciVal interprets your search
• 'Solar flare' is interpreted as 'solar AND flare', which may be located next to each other or in
separate sentences
• 'Solar-flare' is also interpreted as 'solar AND flare'
• Enclose the search terms in double quotes (for example "solar flare") to bring back exact
matches only. This search will find publications containing 'solar flare' but not 'solar-flare'.
• Stop words are always ignored. Stop words include personal pronouns (such as 'he', 'she', 'we',
'they'); most articles (such as 'the', 'an'); most forms of the verb to be (such as 'be', 'is', 'was');
and some conjunctions (such as 'as', 'because', 'if', 'when')
You can find variants using wild-card searching
• ? replaces a single character. For example, 'organi?ation' will return both 'organisation' and
'organization'
• * replaces one or more characters. For example, 'cat*' will return 'catastrophe', 'catheter',
'catnip', and so on
SciVal uses the Boolean operators AND, OR, NOT
• Entering 'blood cell' will search for 'blood AND cell'
• Entering 'cat AND dog OR mouse' we will search for '(cat AND dog) OR mouse'
• If you specify parentheses, they will be followed and not overridden. If you enter 'cat AND (dog
OR mouse)' we will search for 'cat AND (dog OR mouse)'
66
SciVal
Defining your own research areas
67
• If you don't use parentheses, we will add them to simulate operative precedence - AND takes
precedence over OR. If you enter 'cat OR dog AND mouse' we will search for 'cat OR (dog AND
mouse)'
8.4
Analyzing a research area
8.4.1
Research areas in the Overview module
See your institution's output within a research area. In the Overview module, you can view your
institution’s contribution to a particular research area by number of publications and citations.
How does your institution’s output in this area compare to the national or worldwide output?
For more in-depth information, browse the Publications and Citations tabs. For example, to see
how much of your institution's output was in the top 1% and 10% most cited publications
worldwide, click on the Publications tab and scroll down to the Outputs in Top Percentiles section.
67
SciVal
Defining your own research areas
68
See which institutions are active within a research area. The Institutions tab gives you an
overview of the top contributing institutions in the research area within your own region or
country or worldwide. You can also see which institutions are collaborating with your institution
within the research area.
68
SciVal
8.4.2
Defining your own research areas
69
Research areas in the Benchmarking module
Use the Benchmarking module to explore the worldwide output in a particular research area from
1996 until the present.
• Go to the Benchmarking module
• Select the research area from the entity selection panel on the left-hand side
You can spot possible trends using a variety of different metrics, such as:
• Scholarly Output (number of publications)
• Field-Weighted Citation Impact (normalized citation count)
• Outputs in Top Percentiles (an indicator of research excellence)
• Journal Category Count (an indicator of multidisciplinarity)
• Collaboration (for instance international collaboration)
8.4.3
Research areas in the Collaboration module
See your institution's collaboration partners in a research area. You can use the Collaboration
module for an in-depth view of your institution’s collaboration partners in a particular research
area. Or identify potential new collaboration partners in that research area.
1. Go to the Collaboration module
2. Select your home institution from the entity selection panel on the left-hand side
69
SciVal
Defining your own research areas
70
3. Select the research area from the filter menu at the top of the page.
Switch from Map to Table view to view the full list of collaborating institutions. Which
collaboration had the greatest citation impact?
Find new collaboration partners in a research area. Switch to the “Potential collaboration” tab
to view potential new collaboration partners in this research area. These institutions are active in
this research area, but are not yet collaborating with your institution in that area.
70
SciVal
Defining your own research areas
71
71
SciVal
Index
Index
-Ddata, recency 28
data, source 28
disciplines, filtering by
-AAcademic-Corporate Collaboration (metric) 28
Academic-Corporate Collaboration Impact (metric)
28
Apple Safari 6
attracting talent 16
-Bbenchmark institutions 47
Benchmarking module 41
Benchmarking module, chart view 43
Benchmarking module, research areas in
Benchmarking module, selecting metrics
Benchmarking module, table view 44
browsers 6
72
9, 33, 43, 52
-Eentities, selecting 9, 32, 44, 50
entities, types of 9
excellence, research 13
exporting, charts 43
exporting, data 44
-F69
41
-CCategory Count (metric) 28
Chrome 6
Citations Count (metric) 28
Citations per Publication (metric) 28
Cited Publications (metric) 28
co-authors 58, 60
Collaboration (metric) 28, 45
Collaboration Impact (metric) 28
Collaboration module 50
Collaboration module, map view 53
Collaboration module, research areas in 52, 69
Collaboration module, selecting a region or country
51
Collaboration module, selecting a sector 51
Collaboration module, table view 54
collaboration, co-authors 58
collaboration, collaborating institutions 37, 48,
55, 58
collaboration, getting an overview 37
collaboration, identifying collaboration partners
39
collaboration, identifying new collaboration
partners 19, 60
competencies 23, 35
country average 45
country, selecting in Collaboration module 51
Field-Weighted Citation Impact (metric)
filtering 9, 33, 43, 52
Firefox 6
14, 28, 45
-Gglobal rank or position
Google Chrome 6
38
-Hh-index (metric)
hiring 16
28
-Iimpact, research 14
institutions, benchmark 47
institutions, collaborating 48, 55
institutions, peer 38, 44
institutions, rank or position 38
institutions, top 16, 38
Internet Explorer 6
-Jjournal categories, filtering by
Journal Count (metric) 28
journals, top 38
9, 33, 43, 52
72
SciVal
Index
-Llogging in to SciVal
8
-MMac OS 6
map 53
metrics 28
metrics, selecting in the Benchmarking module
41
modeling, research areas 63
modeling, research teams 24
-Nnational average 45
national rank or position 38
Number of Citing Countries (metric)
28
-OOutputs in Top Percentiles (metric) 13, 28, 45
Overview module 32
Overview module, research areas in 67
-Ppassword 8
peer institutions 38, 44
performance, research 33
position, national or global 38
publication output 34
Publications in Top Journal Percentiles (metric)
13, 28, 45
publications, types of 28
-Rrank, national or global 38
region, selecting in Collaboration module 51
registering as a user 8
remote access 8
research areas 63
research areas, analyzing 67, 69
research areas, defining 39, 63
research areas, evaluate performance in 39
research areas, filtering by 52
73
research areas, trends in 46
research excellence 13
research impact 14
research performance 33
research strengths 23, 35
research teams, evaluating performance
research teams, modeling 24
research trends 46
researchers, top 16
37
-SSafari 6
scenario modeling 24
Scholarly Output (metric) 28
Scopus 28
sector, selecting in Collaboration module
SJR (metric) 13
SNIP (metric) 13
Snowball Metrics 28, 30
Spotlight, SciVal 5
Strata, SciVal 5
strengths, research 23, 35
subject areas, filtering by 9, 33, 43, 52
51
-Ttalent, attracting 16
time period, selecting a 8, 32, 42, 50
top institutions 16, 38
top researchers 16
trends, research 46
-Uusername
8
-WWeb browsers 6
what-if scenario modeling
world map 53
24
-Yyear range, selecting a
8, 32, 42, 50
73