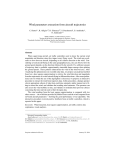
1
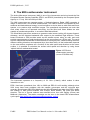
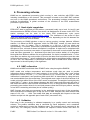
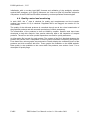
ERS Scatterometer Product User Manual EUMETSAT Advanced Retransmission Service Version 1.6 November 2008 KNMI-publicatie ; 212f DOCUMENT SIGNATURE TABLE Name Prepared by : Date KNMI EARS Team Signature November 2008 DOCUMENTATION CHANGE RECORD Issue / Revision Version 0.9 Version 1.0 Version 1.1 Date : Nov. 2005 Jan. 2006 Mar. 2006 Change : Minor Minor Version 1.2 Version 1.3 Version 1.4 Version 1.5 Version 1.6 Apr. 2006 Feb. 2007 Feb. 2007 Jul. 2007 Nov. 2008 Minor Minor Minor Minor Minor Description : Draft version EUMETSAT comments incorporated BUFR output is generated in ASCAT format as well Adapted web location of [Ref-3] Changed file name convention Correction in file name convention Abandoned product in ESA BUFR format Change to neutral winds KNMI, De Bilt, the Netherlands Reference: KNMI-publicatie ; 212f Cover illustration: on 23 April 2004 around midnight and west of Ireland, a complex low was developing. The red arrows show wind speeds up to 15 m/s and a cyclonic wind direction. One cyclonic centre is located surrounding the group of yellow spots, while another centre is located more to the southwest at the left side of the scatterometer swath. Between both cyclonic centres a line of shear flow is present (where the wind direction turns by 180 degrees) surrounded by wind speeds of 10 m/s strength. The blue arrows in the background represent a 3-hour forecast of the winds by the KNMI High-Resolution Limited Area Model (HiRLAM). Even on this short forecast range, the HiRLAM model only depicts one cyclonic centre and no shear line at all. As background a METEOSAT Infrared image is shown in black and white. While this shows the supporting cloud structures associated with the ERS scatterometer winds, it does in itself not provide much information on the surface wind conditions. In the next 12 hours after midnight on 23 April, the winds strengthened and the depression central surface pressure dropped by more than 10 hPa to 974 hPa. In this case the timely available ERS scatterometer winds thus provide guidance on routing conditions to ships at sea. See ESA press release on http://www.esa.int/esaEO/SEM0V177ESD_index_0.html EARS ERS Product User Manual version 1.6 November 2008 1 KNMI-publicatie ; 212f Contents 1. Introduction.......................................................................................................................4 1.1. Overview...................................................................................................................4 1.2. Disclaimer .................................................................................................................5 1.3. References ...............................................................................................................5 1.4. Useful links ...............................................................................................................6 1.5. Literature ..................................................................................................................6 2. The ERS scatterometer instrument ..................................................................................7 3. Algorithms.........................................................................................................................8 3.1. Wind definition ..........................................................................................................8 3.1.1. Geophysical model function..............................................................................9 3.2. Wind retrieval..........................................................................................................10 3.2.1. Ambiguity removal ..........................................................................................10 3.2.2. Quality control.................................................................................................10 4. Processing scheme ........................................................................................................11 4.1. Node triplet completion ...........................................................................................11 4.2. NWP collocation .....................................................................................................11 4.3. Validation................................................................................................................11 4.4. Quality control and monitoring ................................................................................12 5. Dissemination .................................................................................................................13 6. Data description..............................................................................................................14 6.1. Wind product characteristics...................................................................................14 6.2. File formats .............................................................................................................15 7. Data quality.....................................................................................................................17 7.1. Accuracy .................................................................................................................17 7.2. Reliability and data use...........................................................................................17 7.3. Ambiguity selection.................................................................................................17 8. Glossary .........................................................................................................................18 EARS ERS Product User Manual version 1.6 November 2008 2 KNMI-publicatie ; 212f Preface The distribution of ERS-2 scatterometer winds in the framework of the EARS (EUMETSAT Advance Retransmission Service) has only been made possible through a concerted effort. The ERS-2 scatterometer data is provided by ESA to KNMI in the framework of the Cat-1 project Nr. 1105 of 2001. KNMI is considered Principal Investigator in this project and registered users of the KNMI wind product are considered as Co-Principal Investigators; their names will be provided to ESA. The KNMI wind processing and dissemination of the ERS-2 scatterometer winds on EUMETCast (EUMETSAT’s Digital Video Broadcast Data Distribution System) is funded by EUMETSAT. The processor software was developed in a coordinated effort between EUMETSAT, ESA, and KNMI. EARS ERS Product User Manual version 1.6 November 2008 3 KNMI-publicatie ; 212f 1. Introduction 1.1. Overview The EUMETSAT Advanced Retransmission Service (EARS) was established to provide the meteorological community with regional data with a timeliness adequate for nowcasting and regional numerical weather prediction. Currently, ATOVS and AVHRR data from NOAA satellites are collected by several HRPT reception stations, processed and distributed on EUMETCast. After the MetOp launch, products generated from HRPT data from this satellite will be also disseminated. In particular, the EARS will be complemented with a Pilot ASCAT service. The targeted EARS ASCAT product is a regional-coverage Level 2 wind product on the ASCAT swath grid, in BUFR format, for distribution on EUMETCast. The targeted timeliness is 30 minutes from data acquisition. KNMI will be involved in the EARS ASCAT service as the centre where the Level 1b to Level 2 processing will be carried out. As a preparation for the EARS ASCAT service, KNMI has established and operates a demonstration system based on the dissemination via EUMETCast of the current regional ERS-SCAT KNMI value-added wind product. This document is the Product User Manual to this product. The wind product is distributed in the BUFR format that is also used for the ASCAT wind data. This data stream can be ingested by the user using the same interfacing as for the ASCAT wind products. The scatterometer is an instrument that provides information on the wind field near the ocean surface, and scatterometry is the knowledge of extracting this information from the instrument’s output. Space-based scatterometry has become of great benefit to meteorology and climate in the past years, see e.g. [Ref 1]. KNMI has a long experience in scatterometer processing and is developing generic software for this purpose. Processing systems have been developed for the ERS, NSCAT and SeaWinds scatterometers, and will be adopted for ASCAT. Scatterometer processing software is developed in the EUMETSAT Numerical Weather Prediction Satellite Application Facility (NWP SAF), whereas wind processing is performed (semi-)operationally in the Ocean and Sea Ice SAF (OSI SAF). ESA makes available a near real-time Level 2 scatterometer wind product from the ERS-2 satellite through the Regional Meteorological Data Communication Network (RMDCN). This product is used as basis for further processing at KNMI. Since the loss of the on-board tape device in 2001, data can be acquired only when the satellite flies in sight of a ground station. ESA deploys a number of ground stations, mainly in the North Atlantic Region. KNMI combines data from all ground stations and produces one unique data set without overlap between different ground stations. In case of overlap, data from different ground stations are combined to obtain a result as complete as possible. Hence, contrary to the ESA product, the KNMI wind product offers completeness with best timeliness and no redundant data. Moreover, the KNMI additional quality control ensures that only reliable data will be made available. The KNMI products are delivered on request through the KNMI FTP server to all users and through the EUMETCast system. See also http://www.knmi.nl/scatterometer/ for real-time graphical examples of the products and up-to-date information and documentation. This user manual outlines user information for the KNMI products based on the ERS scatterometer. Section 2 presents a brief description of the ERS SCAT instrument, section 3 the processing algorithms, and section 4 gives an overview of the data processing configuration. Section 5 provides details on how to access the products. Detailed information on the file content and format is given in section 6, while in section 7 the product quality is elaborated. EARS ERS Product User Manual version 1.6 November 2008 4 KNMI-publicatie ; 212f 1.2. Disclaimer All intellectual property rights of the EARS products belong to EUMETSAT. The use of these products is granted to every interested user, free of charge. If you wish to use these products, EUMETSAT's copyright credit must be shown by displaying the words "copyright (year) EUMETSAT" on each of the products used. 1.3. References [Ref-1] Isaksen, L., and A. Stoffelen, 2000, “ERS-Scatterometer Wind Data Impact on ECMWF’s Tropical Cyclone Forecasts”, IEEE-Transactions on Geoscience and Remote Sensing (special issue on Emerging Scatterometer Applications) 38 (4), pp. 1885-1892 [Ref-2] Valenzuela, G. R., Theories for the interaction of electromagnetic and ocean waves - a review, Bound. Layer Meteor., 13, 612-685, 1978 [Ref-3] Thesis “Scatterometry” by Ad Stoffelen, 1998 (*) [Ref-4] Hersbach, H., Stoffelen, A. and de Haan, S., An Improved C-band scatterometer ocean geophysical model function: CMOD5, J. Geophys. Res., 112, 2007 [Ref-5] Donelan, M. A., and W. J. Pierson, Radar scattering and equilibrium ranges in windgenerated waves with application to scatterometry, J. Geophys. Res., 92, 49715029, 1987 [Ref-6] Donelly, William J., James R. Carswell, and Robert E. McIntosh, Revised ocean backscatter at C and Ku band under high wind conditions, J. Geophys. Res., 104, 11,485-11,497, 1999 [Ref-7] Pierson, W.J., Probabilities and statistics for backscatter estimates obtained by a scatterometer, J. Geophys. Res., 94, 9743-9759, 1989; correction in J. Geophys. Res., 95, 809, 1990 [Ref-8] Stoffelen, Ad, Siebren de Haan, Yves Quilfen, and Harald Schyberg, ERS Scatterometer Ambiguity Removal Comparison, OSI SAF report, 2000 (*) [Ref-9] Portabella, M., A. Stoffelen, Quality Control and Wind Retrieval for SeaWinds, EUMETSAT fellowship report, 2002 (*) [Ref-10] de Vries, J, Stoffelen, A and Beysens, J, Ambiguity Removal and Product Monitoring for SeaWinds, NWP SAF report NWPSAF_KN_TR_001 (*) [Ref-11] ERS PRODUCTS – WMO FM94 BUFR FORMAT, ER-IS-UKM-GS-0001, Version 4, Issue 2, 16 February 2001 [Ref-12] ADDITIONS TO BUFR/CREX TABLES FOR PRE-OPERATIONAL IMPLEMENTATION ENDORSED BY CBS for full operational status on 7 November 2007 (updated 04/01/07), pp55-60, available on http://www.wmo.int/web/www/WMOCodes/Updates/BUFRCREX/Preoperational050 107.doc [Ref-13] Portabella, M. and Stoffelen, A., Development of a Global Scatterometer Validation and Monitoring, Visiting Scientist report for the Ocean & Sea Ice SAF, SAF/OSI/CDOP/KNMI/SCI/RP/141, 2007 (*) [Ref-14] Verhoef, A., M. Portabella, A. Stoffelen and H. Hersbach, CMOD5.n - the CMOD5 GMF for neutral winds, OSI SAF report, SAF/OSI/CDOP/KNMI/TEC/TN/165, 2008 (*) References marked with a (*) are available on http://www.knmi.nl/scatterometer/publications/. EARS ERS Product User Manual version 1.6 November 2008 5 KNMI-publicatie ; 212f 1.4. Useful links KNMI scatterometer web site: http://www.knmi.nl/scatterometer/ - ERS visual products: http://www.knmi.nl/scatterometer/ers_prod/ Information on EARS and EUMETCast: http://www.eumetsat.int/ O&SI SAF wind product documentation on http://www.osi-saf.org/: 1. Scientific documents: - 2D Variational Ambiguity Removal Technical documents - Science Plan - OSI SAF User Requirements Document - OSI SAF Project Plan - OSI SAF Report on Algorithm Development and Prototyping Activities - OSI SAF top-level Configuration Management Plan - OSI SAF Output Products Format Document - OSI SAF Software Requirements Document - ICD for the wind production of the OSI SAF - SVVP for the wind production of the OSI SAF NWP SAF website: http://www.metoffice.gov.uk/research/interproj/nwpsaf/index.html ESA ERS Documentation: http://earth.esa.int/ers/eeo4.144/ and http://earth.esa.int/pcs/ers/scatt/articles/ 1.5. Literature 1. Figa, J., and A. Stoffelen, 2000, “On the Assimilation of Ku-Band Scatterometer Winds for Weather Analysis and Forecasting”, IEEE-Transactions on Geoscience and Remote Sensing (special issue on Emerging Scatterometer Applications) 38 (4), pp. 1893-1902 2. Graham, R., D. Anderson A. Hollingsworth and H.Böttger, Evaluation of ERS-1 wind extraction and ambiguity removal algorithms: meteorological and statistical evaluation, ECMWF report, ECMWF, Reading, England, 1989 3. Mastenbroek, Kees, “Wind-Wave Interaction”, thesis at the Delft University of Technology, Delft, the Netherlands, 12 December 1996 4. Stoffelen, Ad, A Generic Approach for Assimilating Scatterometer Observations, ECMWF seminar, 2000, available on http://www.knmi.nl/scatterometer/publications/ 5. Thesis “Wind Field Retrieval from Satellite radar systems” by Marcos Portabella, available on http://www.knmi.nl/scatterometer/publications/ EARS ERS Product User Manual version 1.6 November 2008 6 KNMI-publicatie ; 212f 2. The ERS scatterometer instrument The Active Microwave Instrument (AMI) is one of the instruments carried on-board the first European Remote Sensing Satellites (ERS-1 and ERS-2) launched by the European Space Agency on 17 July 1991 and 20 April 1995. The AMI incorporates two separate radars, a Synthetic-Aperture Radar (SAR) operating in image or wave mode, and a Wind Scatterometer. The Earth's surface is illuminated by four antennas and backscattered energy is received either to derive data on wind fields and wave spectra, or to produce high resolution images. The operational requirements are such that each mode needs to be operated exclusively, but the Wind and Wave Modes are also capable of interleaved operation, in so-called 'Wind/Wave Mode'. The Wind Mode uses three antennas to generate radar beams looking 45 degrees forward, sideways, and 45 degrees backwards with respect to the satellite's flight direction. These beams illuminate a 500 km-wide swath as the satellite moves along its orbit, and each provide measurements of radar backscatter from the sea surface on a 25 km grid. The result is three independent backscatter measurements for each grid point, obtained using the three different viewing directions and separated by a short time delay. As the backscatter depends on the sea surface roughness as a function of the wind speed and direction at the ocean surface, it is possible to calculate the surface wind speed and direction by using these 'triplets' within a mathematical model. Figure 1: ERS wind scatterometer geometry (source: ESA web site). The instrument operates at a frequency of 5.3 GHz (C-band), which makes it rather insensitive to rain. ERS-1 has been operational from 1991 to 2000 and ERS-2 is still working, although since 2001 there have been problems with the satellite gyroscopes and the on-board tape recorder. Since August 2003 ESA distributes the Wind Scatterometer data from ERS-2 within the visibility of ESA ground stations over Europe, North Atlantic, the Arctic and North America. The list of ground stations was extended since then with Beijing (China) and McMurdo (Antarctica). The station coverage can be seen in the latest ERS scatterometer cycle report (http://earth.esa.int/pcs/ers/scatt/reports/pcs_cyclic/). EARS ERS Product User Manual version 1.6 November 2008 7 KNMI-publicatie ; 212f 3. Algorithms Scatterometry was developed heuristically. It was found experimentally that the sensitivity to wind speed and direction describe well the changes in backscatter over the ocean at moderate incidence angles due to changes in surface roughness, as depicted in figure 2 [Ref-2]. In return, backscatter measurements can be used to determine the wind speed and wind direction in a Wind Vector Cell (WVC). A schematic illustration of the processing is given in figure 3. After defining the wind output and motivating the Geophysical Model Function that is used, the algorithms developed at KNMI are described. Figure 2: Schematic representation of microwave scattering and reflection at a smooth (a), rough (b) and very rough (c) ocean surface. As the roughness increases more microwave power is returned towards the direction of the microwave source. 3.1. Wind definition A scatterometer measurement relates to the ocean surface roughness (see figure 2), while the scatterometer product is represented by the wind at 10m height over a WVC. It is important to realize that in the approach followed here the radar backscatter measurement σ 0 is related to the wind at 10 meter height above the ocean surface, simply because such measurements are widely available for validation. This means that any effect that relates to the mean wind vector at 10 meter height is incorporated in the backscatter-to-wind EARS ERS Product User Manual version 1.6 November 2008 8 KNMI-publicatie ; 212f relationship. As such, air stability, the appearance of surface slicks, and the amplitude of gravity or longer ocean waves, depend to some degree on the strength of the wind and may, to the same degree, be fitted by a geophysical model function, GMF ([Ref-3]; Chapter I). Stoffelen ([Ref-3]; Chapter IV) discusses a unique method to determine the accuracy of scatterometer, buoy, and NWP model winds. 3.1.1. Geophysical model function For the ERS wind product the CMOD5.n geophysical model function (GMF) for calculating neutral winds is used [Ref-14]. This model function enables the calculation of wind speeds meeting the product requirements between 0 and 25 m/s. CMOD5.n is based on CMOD5 [Ref-4]. It is known from extensive validation work on ERS that a CMOD5 bias of 0.5 m/s against buoys persists for all wind speeds [Ref-13] and this is compensated. moreover, another 0.2 m/s is added to convert from real winds to neutral winds. The CMOD5.n inverted winds are thus 0.7 m/s higher than CMOD5 winds. At low wind speeds the wind direction and speed may vary considerably within the WVC. Locally, below a speed of roughly 2 ms−1 calm areas are present where little or no backscatter occurs, perhaps further extended in the presence of natural slicks that increase the water surface tension [Ref-5]. However, given the variability of the wind within a footprint area of 25 km it is, even in the case of zero mean vector wind, very unlikely that there are no patches with roughness in the footprint. As the mean vector wind increases, the probability of a calm patch will quickly decrease, and the mean microwave backscatter will increase. Also, natural slicks quickly disappear as the wind speed increases, and as such the occurrence of these is correlated to the amplitude of the mean vector wind over the footprint, as modelled by the GMF. Low scatterometer wind speeds are thus providing useful information. NWP collocation Figure 3: Overview of wind retrieval algorithm Quality Control Wind computation by GMF Inversion Fieldwise Ambiguity Removal At high wind speeds wave breaking will further intensify, causing air bubbles, foam and spray at the ocean surface, and a more and more complicated ocean topography. Although theoretically not obvious, it is empirically found that σ 0 keeps increasing for increasing wind speed from 25 m/s to 40 m/s, and that a useful wind direction dependency remains [Ref-6], albeit gradually weakening. EARS ERS Product User Manual version 1.6 November 2008 9 KNMI-publicatie ; 212f 3.2. Wind retrieval The GMF has two unknowns, namely wind speed and wind direction, so, if more than two backscatter measurements are available then these two unknowns may be estimated using a maximum-likelihood estimator (MLE) as the objective function for determining wind vector solutions [Ref-7]. The MLE is defined by ([Ref-3]; Chapter II) J = ( z oi − z m (u, χ i )) 2 where z = (σ 0)0.625 are the transformed backscatter data, zoi are the backscatter measurements, zm(u,χi) are the model backscatter values corresponding to the measurements. The local minima of J correspond to wind vector solutions. The three independent measurements (fore, mid and aft beam) well sample the azimuth variation of the GMF in order to resolve the wind direction, albeit ambiguously. 3.2.1. Ambiguity removal ERS scatterometer winds have a multiple ambiguity and there are up to two wind solutions in each WVC on the earth’s surface. These ambiguities are removed by applying constraints on the spatial characteristics of the output wind field, such as on rotation and divergence. Several ambiguity removal (AR) schemes were evaluated for ERS data [Ref-8]. In the OSI SAF Development Phase some schemes that were developed for the SCAT were compared. In addition to the subjective comparison of AR schemes, a method for the objective comparison of AR performance among the different schemes was used. In [Ref-8] it is shown that this way of comparison is effective to evaluate the shortcomings of AR schemes, but also reveals a more general way forward to improve AR, which is followed up by tuning 2DVAR. For ERS this tuned version of 2D-VAR is used. 3.2.2. Quality control Since the scatterometer wind retrieval problem is over determined, this opens up the possibility of quality control (QC) by checking the inversion residual J. If J is normalised by the expected isotropic error variance then it is in theory inversely proportional to the log probability that a node is affected solely by a uniform wind. If Var(σm)i = (Kpi2σoi2) are the measurement variances then the norm for the inversion residual is √3 times the RMS of (Var(σm)i)0.625 (Stoffelen, 1998). Generally this normalised MLE is substantial and, as a consequence, the inferred probability low, when there is substantial wind or sea state variability within the cell. As such, Stoffelen [Ref-3] and Portabella and Stoffelen [Ref-9] found that the inversion residual is well capable of removing cases with extreme variability (at fronts or centres of lows), or with other geophysical variables affecting the radar backscatter. EARS ERS Product User Manual version 1.6 November 2008 10 KNMI-publicatie ; 212f 4. Processing scheme KNMI has an operational processing chain running in near real-time with ERS-2 data, including visualisation on the Internet. This processor is based on the NWP SAF software and runs in the KNMI operational environment. The processing includes monitoring and archiving functionalities. A global overview of the modules of the ERS scatterometer processor is given below. 4.1. Node triplet completion ERS-SCAT data is acquired at ESA stations, processed locally up to level 1b (and 2) and then transmitted to ESRIN in Rome, from where it is distributed to all users via the GTS. The station coverage can be seen in the latest ERS scatterometer cycle report (http://earth.esa.int/pcs/ers/scatt/reports/pcs_cyclic/). The timeliness of the arrival of input data from different stations ranges from 20 to 100 min, depending on the link between the stations and the Rome node at ESRIN. The processing at KNMI includes a step to remove product overlaps between different stations. It is based on BUFR segments, which for ERS-SCAT contain 19 rows (each row containing in turn 19 nodes). This is equivalent to a 500 km x 500 km swath and approximately 1.5 minutes. Each node is processed to generate winds only once, as soon as the triplet of fore, mid and aft beam information is complete. A triplet can be completed with data coming from more than one station. If input data for that node is received after the wind node has been generated (i.e., duplicated input data from another station) it is discarded. Node grids from different stations are not synchronised. If a triplet is completed with σ 0s from more than one station, the node position is fixed to the latest received product, and the node is filled with the closest σ 0 values available from all the stations and located within a distance of half a cell. No interpolation is performed because tests at KNMI have shown that the improvement in the wind quality is not significant. 4.2. NWP collocation KNMI receives NWP model data from ECMWF twice a day through the RMDCN. NWP model sea surface temperature and land-sea mask data are used to provide information about possible ice or land presence in the WVCs. WVCs with a sea surface temperature below 272.16 K (-1 °C) are assumed to be covered with ice and no wind information is calculated. Land presence within each WVC is determined by using the landsea mask available from the model data. The weighted mean value of the land fractions of all model grid points within 80 km of the WVC centre is calculated. The weight of each grid point scales with 1/r2, where r is the distance between the WVC centre and the model grid point. If this mean land fraction value exceeds a threshold of 0.02, no wind retrieval is performed. Our processing uses stricter limits for ice and land presence than the ESA input product, resulting in less WVCs containing wind data (but of a better quality). NWP forecast wind data are necessary in the ambiguity removal step of the processing. Wind forecasts are available twice a day (00 and 12 GMT analysis time) with forecast time steps of +3h, +6h, …, +36h. The model wind data are averaged with respect to time and location and put into the appendix part of each WVC (see section 6.2). 4.3. Validation Each step in the processing is validated separately by a quality control and monitoring scheme. The product validation step is controlled by visual inspection, and a statistical analysis is performed to control the validation steps. The inversion step is controlled in the same way. For ambiguity removal schemes an objective scheme exists that relies on EARS ERS Product User Manual version 1.6 November 2008 11 KNMI-publicatie ; 212f initialisation with a one-day lead NWP forecast and validation of the ambiguity selection against NWP analyses, as in [Ref-8]. Moreover, de Vries et al [Ref-10] describe subjective comparison of the 2D-VAR and PreScat schemes by routine operational meteorologists. 4.4. Quality control and monitoring In each WVC, the σ 0 data is checked for quality and completeness and the inversion residual (see section 3.2.2) is checked. Degraded WVCs are flagged; see section 6.2 for more details. The quality of the delivered products is controlled through an ad hoc visual examination of the graphical products and the automatic production of control parameters. The examination of the products is done at KNMI by experts. Specific tools have been developed to help this analysis. User queries obviously lead to the inspection of suspect products. The ad hoc and user queried inspections are used for quality assurance. An information file is made for each product. The content of the file is identical whatever the product and results from a compilation of all the global information concerning this product. From these files, various graphs are produced to visually display the confidence levels of the products and their evolution with time. These graphs are available on the KNMI website. Data quality is also available to the users within the products; see section 6 and 7 for a description of quality flags. EARS ERS Product User Manual version 1.6 November 2008 12 KNMI-publicatie ; 212f 5. Dissemination The ERS BUFR products are disseminated on EUMETCast. Please consult http://www.eumetsat.int/, under ‘Access to Data’ for more information on EUMETCast dissemination and how to receive these and other EUMETSAT meteorological satellite products. The products are also made available on a password-protected ftp site. This password is provided to new users by Email request. Please send your requests to [email protected]. EARS ERS Product User Manual version 1.6 November 2008 13 KNMI-publicatie ; 212f 6. Data description 6.1. Wind product characteristics Physical definition Horizontal neutral wind vector at 10m height. Units and range Wind speed is measured in m/s and wind direction in meteorological (WMO) convention relative to North: 0 degrees corresponds to a wind flowing to the South with a clockwise increment. The wind speed range is from 0-50 m/s, but wind speeds over 25 m/s are generally not reliable [Ref-6]. Input satellite data ERS SCAT BUFR data from ESA are described in their user manual [Ref-11]. ERS-SCAT data is acquired locally at ESA stations, processed locally up to level 1b (and level 2) and then transmitted to ESRIN in Rome, from where it is distributed to all users via the GTS. The product contains geo-located measurement triplets on a satellite swath grid of 25 km size. Geographical definition The ERS-2 satellite flies in a near-polar sun synchronous orbit at 98 degrees inclination at approximately 800 km orbit height. The satellite swath is located to the right of the satellite ground track. The swath width is 19 25-km size WVCs, corresponding to 500 km. Products are organised in messages of 19 X 19 WVCs. Coverage Data is available only when the satellite is in sight of a ground station. Most ground stations are in the North Atlantic region. Actual coverage is available on the KNMI ERS-2 product visualisation website (see http://www.knmi.nl/scatterometer/ers_prod/). Output product The input product in BUFR is processed into a BUFR output product including a unique wind solution (chosen), its corresponding ambiguous wind solution and quality information (distance to cone, quality flag). Delivery time A wind product is available for distribution within 10 minutes after the input product reception at KNMI. The delivery time between acquisition of the data and reception at KNMI ranges from 20 to 100 minutes, depending on the ground station and network speed. In practice, approximately 40% of the KNMI output data is available within 60 minutes after acquisition and approximately 90% of the data is available after 100 minutes. Expected accuracy The expected accuracy is defined as the expected bias and standard deviation of the primary calculations. The accuracy is validated against in situ wind measurements from buoys, platforms, or ship, and against NWP data. Even better, the errors of all NWP model winds, in situ data, and scatterometer winds are computed in a triple collocation exercise [Ref-3]. The performance is pretty constant over the globe and depends mainly on the sub footprint wind variability. The performance of the products issued by KNMI is characterised by a wind component RMS error smaller than 2 m/s and a bias of less than 0.5 m/s in wind speed. EARS ERS Product User Manual version 1.6 November 2008 14 KNMI-publicatie ; 212f 6.2. File formats Wind products are in BUFR. A complete description of BUFR can be found in WMO publication No 306, Manual on Codes. The graphical displays of the wind products are available and explained on the web: http://www.knmi.nl/scatterometer/ers_prod/. The file name convention is scatt_YYYYMMDD_HHMMSS_ers2___00000_ear_o_250_ovw.l2_bufr, where scatt denotes the instrument (ERS AMI scatterometer) YYYYMMDD denotes the date of the first data in the file HHMMSS denotes the time (UTC) of the first data in the file ers2 denotes the satellite name 00000 is reserved for the orbit number (not available for ERS-2) ear denotes the EARS service o stands for operational product 250 denotes 25-km WVC spacing ovw denotes that the product contains ocean vector winds and no soil moisture information l2 (l is the lowercase L) denotes Level 2 product bufr denotes BUFR product format An example of a file name is: scatt_20070115_071325_ers2___00000_ear_o_250_ovw.l2_bufr. The wind product is stored in the BUFR format as proposed for ASCAT and described in [Ref-12]. Note that this format may still be subject to small changes. Any change will be notified to all registered users. In Fortran, if the Wind Vector Cell Quality (table 021155) is stored in an integer I then use BTEST(I,NDW-NB-1) to test BUFR bit NB, where NDW=24 is the width in bits of the data element in BUFR. If the ‘monitoring not used’ bit (BUFR bit 4) is set to zero, the product is monitored. If the product is monitored and the ‘monitoring flag’ bit (BUFR bit 5) is set to zero, the product is valid; otherwise it is rejected by the monitoring. The monitoring bits are set to the same value in all WVCs in one BUFR output file. If the KNMI QC flag (BUFR bit 6) is set in a WVC this means that the backscatter information is of poor quality for various reasons, such as a too large inversion residual, poor satellite yaw steering, or a too high noise value in the input product. WVCs, in which the KNMI QC flag is set, are not used in the calculation of the analysis field in the ambiguity removal step. However, after the ambiguity removal the wind solution closest to the analysis field is chosen (if wind solutions are present in the WVC). This means that such a WVC may contain a selected wind solution, but it is suspect. Land presence flag is set if a land fraction (see section 4.2) larger than zero is calculated for the WVC. As long as the land fraction is below the limit value, a reliable wind solution may however still be present. Ice presence flag is set if the SST calculated for the WVC (see section 4.2) is below 272.16. If the variational QC flag is set, the wind vector in the WVC is rejected during ambiguity removal due to spatial inconsistency. A wind solution is present, but it may be suspect. EARS ERS Product User Manual version 1.6 November 2008 15 KNMI-publicatie ; 212f It is recommended not to use WVCs with the monitoring flag, the KNMI quality control flag or the variational quality control flag set. See section 7.2 for more information on product reliability. The ‘likelihood computed for solution’ (descriptor 021104) actually contains the log10 of the calculated likelihood for the wind solution. This is done since otherwise values close to zero will be rounded to zero in the BUFR encoding. In order to recalculate the probability, the user should compute 10 to the power <value from BUFR>. EARS ERS Product User Manual version 1.6 November 2008 16 KNMI-publicatie ; 212f 7. Data quality 7.1. Accuracy As introduced in section 6.1, the accuracy is better than 2 m/s in wind component RMS with a bias of less than 0.5 m/s in wind speed; see [Ref-3]. 7.2. Reliability and data use For global coverage products, it is possible to generate a product monitoring flag, based on a multi-step check. If in one product the number of WVC Quality Control rejections, the mean residual, or the wind speed bias with respect to the NWP background is above certain threshold values, then the monitoring event flag is raised since the product is suspicious. The threshold values are based on evaluation of the product statistics over a long period [Ref-10]. Because of the granular nature of the EARS product, where files containing only a few minutes of data are generated and disseminated in real-time, this mechanism raises problems if there are not enough data in one pass for a statistically valid check. The multistep monitoring check is sensitive to noise which is larger when mean values are calculated over fewer WVCs. If, accordingly, the thresholds are set high, many bad products will pass the check. On the other hand, if the threshold values are set too low, too many false alarms will be raised. This problem can be solved probably by evaluating not only the data of the last processed pass, but by evaluating the last 60 or 70 minutes of data present, although originating from typically 4 or 5 passes of 15 minutes. In case of instrument degradation or other problems, the monitoring event flag will be raised with some delay, inherent to the discontinuous nature of the data stream. Sensitivity tests will provide guidance on this issue. It is planned to implement the monitoring event flag in a future version of the EARS product running on ASCAT data. Since the quality of backscatter measurements is somewhat insufficient to provide goodquality ERS scatterometer winds at WVCs 1 and 2, we recommend to accept these winds with degraded confidence. For use in NWP these winds should be disregarded altogether. WVCs 3-19 are of uniform quality and fulfil the requirements as specified in the OSI SAF User Requirements Document. 7.3. Ambiguity selection A version of 2D-VAR is used with minimal regional performance differences [Ref-10]. This improved version was obtained after taking into account the findings of [Ref-8]. A variational QC step is performed to reject a few WVCs, which are in meteorological unbalance with their neighbours. This rejection rate, often called gross error rate, peaks at the inside swath and falls off quickly in the middle swath. The variational QC flagged WVCs are flagged in the output product. EARS ERS Product User Manual version 1.6 November 2008 17 KNMI-publicatie ; 212f 8. Glossary AR Ambiguity Removal ASCAT Advanced Scatterometer BUFR Binary Universal Format Representation EARS EUMETSAT Advanced Retransmission Service EPS Eumetsat Polar System ERS European Remote-Sensing Satellite EUMETCast EUMETSAT’s Digital Video Broadcast Data Distribution System EUMETSAT European Organisation for the Exploitation of Meteorological Satellites HDF Hierarchical Data Format JPL Jet Propulsion Laboratory (NASA) KNMI Royal Netherlands Meteorological Institute MetOp Meteorological Operational satellite NASA National (US) Air and Space Agency NOAA National (US) Oceanic and Atmospheric Administration NSCAT NASA Scatterometer NWP Numerical Weather Prediction OSI SAF Ocean and Sea Ice SAF QC Quality Control QuikSCAT US dedicated scatterometer mission RMDCN Regional Meteorological Data Communication Network SAF Satellite Application Facility SeaWinds US scatterometer on-board QuikSCAT platform SOS Scatterometer Ocean Stress SST Sea Surface Temperature SVVP Software Verification and Validation Plan U West-to-east wind component V South-to-north wind component WVC Wind Vector Cell EARS ERS Product User Manual version 1.6 November 2008 18