1
iTool User’s Guide
IDL Version 7.0
November 2007 Edition
Copyright © ITT Visual Information Solutions
All Rights Reserved
1107IDL70ITU
Restricted Rights Notice
The IDL®, IDL Analyst™, ENVI®, and ENVI Zoom™ software programs and the accompanying procedures, functions, and
documentation described herein are sold under license agreement. Their use, duplication, and disclosure are subject to the
restrictions stated in the license agreement. ITT Visual Information Solutions reserves the right to make changes to this document at
any time and without notice.
Limitation of Warranty
ITT Visual Information Solutions makes no warranties, either express or implied, as to any matter not expressly set forth in the
license agreement, including without limitation the condition of the software, merchantability, or fitness for any particular purpose.
ITT Visual Information Solutions shall not be liable for any direct, consequential, or other damages suffered by the Licensee or any
others resulting from use of the software packages or their documentation.
Permission to Reproduce this Manual
If you are a licensed user of these products, ITT Visual Information Solutions grants you a limited, nontransferable license to
reproduce this particular document provided such copies are for your use only and are not sold or distributed to third parties. All such
copies must contain the title page and this notice page in their entirety.
Export Control Information
This software and its associated documentation are subject to the controls of the Export Administration Regulations (EAR). It has
been determined that this software is classified as EAR99 under U.S. Export Control laws and regulations, and may not be retransferred to any destination expressly prohibited by U.S. laws and regulations. The recipient is responsible for ensuring compliance
to all applicable U.S. Export Control laws and regulations.
Acknowledgments
ENVI® and IDL® are registered trademarks of ITT Corporation, registered in the United States Patent and Trademark Office. ION™, ION Script™,
ION Java™, and ENVI Zoom™ are trademarks of ITT Visual Information Solutions.
Numerical Recipes™ is a trademark of Numerical Recipes Software. Numerical Recipes routines are used by permission.
GRG2™ is a trademark of Windward Technologies, Inc. The GRG2 software for nonlinear optimization is used by permission.
NCSA Hierarchical Data Format (HDF) Software Library and Utilities. Copyright © 1988-2001, The Board of Trustees of the University of Illinois. All
rights reserved.
NCSA HDF5 (Hierarchical Data Format 5) Software Library and Utilities. Copyright © 1998-2002, by the Board of Trustees of the University of
Illinois. All rights reserved.
CDF Library. Copyright © 2002, National Space Science Data Center, NASA/Goddard Space Flight Center.
NetCDF Library. Copyright © 1993-1999, University Corporation for Atmospheric Research/Unidata.
HDF EOS Library. Copyright © 1996, Hughes and Applied Research Corporation.
SMACC. Copyright © 2000-2004, Spectral Sciences, Inc. and ITT Visual Information Solutions. All rights reserved.
This software is based in part on the work of the Independent JPEG Group.
Portions of this software are copyrighted by DataDirect Technologies, © 1991-2003.
BandMax®. Copyright © 2003, The Galileo Group Inc.
Portions of this computer program are copyright © 1995-1999, LizardTech, Inc. All rights reserved. MrSID is protected by U.S. Patent No. 5,710,835.
Foreign Patents Pending.
Portions of this software were developed using Unisearch’s Kakadu software, for which ITT has a commercial license. Kakadu Software. Copyright ©
2001. The University of New South Wales, UNSW, Sydney NSW 2052, Australia, and Unisearch Ltd, Australia.
This product includes software developed by the Apache Software Foundation (www.apache.org/).
MODTRAN is licensed from the United States of America under U.S. Patent No. 5,315,513 and U.S. Patent No. 5,884,226.
FLAASH is licensed from Spectral Sciences, Inc. under a U.S. Patent Pending.
Portions of this software are copyrighted by Merge Technologies Incorporated.
Support Vector Machine (SVM) is based on the LIBSVM library written by Chih-Chung Chang and Chih-Jen Lin (www.csie.ntu.edu.tw/~cjlin/libsvm),
adapted by ITT Visual Information Solutions for remote sensing image supervised classification purposes.
IDL Wavelet Toolkit Copyright © 2002, Christopher Torrence.
IMSL is a trademark of Visual Numerics, Inc. Copyright © 1970-2006 by Visual Numerics, Inc. All Rights Reserved.
Other trademarks and registered trademarks are the property of the respective trademark holders.
Contents
Chapter 1
Introducing
the IDL iTools ......................................................................................... 17
Introducing the iTools .................................................................................................... 18
Using This Guide ............................................................................................................. 20
Chapter 2
Importing and Exporting Data ............................................................. 23
About the Data Manager ................................................................................................
Data Manager Interface ............................................................................................
Data Item Management .............................................................................................
Data Import Methods ......................................................................................................
Using the Data Import Wizard .................................................................................
Using File Open ........................................................................................................
Using the Data Manager Dialog ...............................................................................
Importing Data from a File ..............................................................................................
iTool User’s Guide
24
25
26
27
28
32
33
34
3
4
Importing Image Data ............................................................................................... 34
Importing ASCII Data ............................................................................................... 34
Importing Binary Data ............................................................................................... 35
Importing Shapefile Data .......................................................................................... 36
Working with Unknown Data ......................................................................................... 37
Using the Gridding Wizard ....................................................................................... 38
Importing Data from the IDL Session ............................................................................. 41
Importing Graphic Objects ........................................................................................ 42
Parameter Data and the Command Line .................................................................... 42
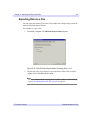
Exporting Data ................................................................................................................ 44
Exporting Data to a File ............................................................................................ 45
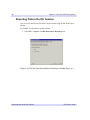
Exporting Data to the IDL Session ............................................................................ 48
Chapter 3
Visualizations ........................................................................................ 51
About Visualizations ........................................................................................................ 52
Visualization Creation Methods ...................................................................................... 53
Creating Visualizations Automatically ..................................................................... 53
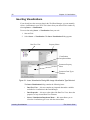
Inserting Visualizations ............................................................................................ 54
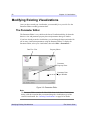
Modifying Existing Visualizations ................................................................................. 56
The Parameter Editor ................................................................................................. 56
Removing Data Associations .................................................................................... 57
Replacing Data Associations ..................................................................................... 57
Exporting Visualizations .................................................................................................. 58
Exporting to a File ..................................................................................................... 58
Chapter 4
Manipulating the Display ..................................................................... 59
Introduction ...................................................................................................................... 60
Selection of Objects ......................................................................................................... 61
Select All ................................................................................................................... 61
Undo/Redo ....................................................................................................................... 62
Adding a Data Space ........................................................................................................ 63
Translation ....................................................................................................................... 64
Scaling .............................................................................................................................. 65
Zooming ........................................................................................................................... 70
Canvas Zoom ............................................................................................................. 70
Contents
iTool User’s Guide
5
View Zoom ............................................................................................................... 70
View Panning .................................................................................................................. 72
Window Layouts ............................................................................................................. 73
Chapter 5
Adding Annotations .............................................................................. 75
Introduction .....................................................................................................................
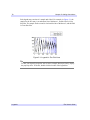
Legends ...........................................................................................................................
Annotations .....................................................................................................................
Text Annotations .......................................................................................................
Line Annotations .......................................................................................................
Rectangle Annotations ..............................................................................................
Oval Annotations ......................................................................................................
Polygon Annotations .................................................................................................
Freehand Annotations ...............................................................................................
Additional Axes ...............................................................................................................
76
77
79
79
80
81
82
82
83
84
Chapter 6
Property Sheets and Browsers ............................................................ 85
Introduction ..................................................................................................................... 86
Property Sheets ................................................................................................................ 87
Visualization Property Sheets ................................................................................... 88
Operations Property Sheets ....................................................................................... 88
The Visualization Browser .............................................................................................. 90
The Operations Browser .................................................................................................. 93
The Preferences Browser ................................................................................................ 95
General Settings ....................................................................................................... 97
File Readers ............................................................................................................. 99
File Writers ............................................................................................................ 105
Chapter 7
Common Operations ........................................................................... 111
Introduction ...................................................................................................................
File Operations ..............................................................................................................
Opening Files ..........................................................................................................
Importing Variables and Files .................................................................................
Saving Files .............................................................................................................
iTool User’s Guide
112
113
113
113
113
Contents
6
Exporting Variables and Files ................................................................................. 114
Exiting the iTool ...................................................................................................... 114
Rotation .......................................................................................................................... 115
Mouse Rotation ....................................................................................................... 115
Rotate Left and Rotate Right ................................................................................... 117
Rotate by Specified Angle ....................................................................................... 118
Transformations ............................................................................................................. 119
Resample ................................................................................................................. 119
Rotate Data .............................................................................................................. 120
Scale Data ................................................................................................................ 121
Filtering .......................................................................................................................... 122
Smooth Filter ........................................................................................................... 122
Median Filter ........................................................................................................... 123
Convolution Filter ................................................................................................... 124
Unsharp Mask Filter ................................................................................................ 125
Morphing ........................................................................................................................ 127
Additional Operations .................................................................................................... 128
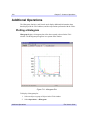
Plotting a Histogram ................................................................................................ 128
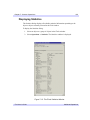
Displaying Statistics ................................................................................................ 129
Resetting Dataspace Ranges .................................................................................... 131
Rendering Translucent Objects ...................................................................................... 132
Operations on Regions of Interest .................................................................................. 133
Operations Modifying ROI Data ............................................................................. 133
Operations Modifying ROI Vertices ....................................................................... 133
Printing ........................................................................................................................... 134
Print Preview ........................................................................................................... 134
Chapter 8
Working with Macros .......................................................................... 139
Introduction .................................................................................................................... 140
What Are Macros? ......................................................................................................... 141
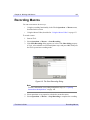
Recording Macros ......................................................................................................... 143
Capturing Intermediate Manipulations .................................................................... 144
Running Macros ............................................................................................................ 146
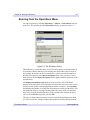
Running from the Operations Menu ........................................................................ 147
Running from the Macro Editor .............................................................................. 148
Contents
iTool User’s Guide
7
Running from the Command Line ..........................................................................
Using the Macro Controls Dialog ...........................................................................
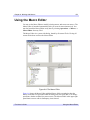
Using the Macro Editor ................................................................................................
Understanding the Macro Editor .............................................................................
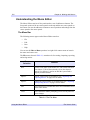
Understanding Items in the Macro Editor .....................................................................
Macro Items ............................................................................................................
Source Items ...........................................................................................................
Making Selection and Tool Changes .............................................................................
Macro Type Based on Recording Selection ...........................................................
About Containers ....................................................................................................
Selection Changes ...................................................................................................
Tool Changes ..........................................................................................................
Importing and Exporting Macros ..................................................................................
148
149
153
154
164
164
165
179
179
179
180
183
186
Chapter 9
Working with Styles ............................................................................ 187
What Are Styles? ...........................................................................................................
Type of Styles .........................................................................................................
Applying a Style .....................................................................................................
Creating Styles .............................................................................................................
Creating a Style from the Current Visualization ....................................................
Creating a New Style from the Style Editor ...........................................................
Working with the Current Style ..............................................................................
Copying an Existing Style ......................................................................................
Applying Styles ............................................................................................................
Applying a Style to a Selected Item ........................................................................
Applying a Style to All Items .................................................................................
Applying a Style When Launching an iTool ..........................................................
Editing Styles ...............................................................................................................
Copying Properties Within Styles ...........................................................................
Cutting and Deleting Properties within Styles ........................................................
Selecting Multiple Properties for Editing ...............................................................
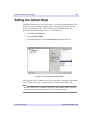
Setting the Default Style ................................................................................................
Importing and Exporting Styles ....................................................................................
Exporting a File to Share ........................................................................................
Importing a Received File .......................................................................................
iTool User’s Guide
188
189
189
190
190
193
195
195
196
196
199
201
202
202
203
203
205
206
206
206
Contents
8
Chapter 10
Working with Images .......................................................................... 207
Introduction .................................................................................................................... 208
Displaying Images ......................................................................................................... 209
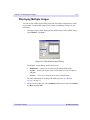
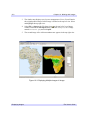
Displaying Multiple Images .................................................................................... 211
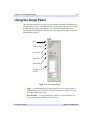
Using the Image Panel ................................................................................................... 213
Image ROIs .............................................................................................................. 214
The Palette Editor .................................................................................................... 215
Window Level Control ............................................................................................ 215
Image Properties ............................................................................................................ 216
Modifying Properties ............................................................................................... 216
Adding a Colorbar .......................................................................................................... 217
Adding Axes .................................................................................................................. 218
Resampling an Image ..................................................................................................... 219
Filtering an Image .......................................................................................................... 220
Convolving an Image .............................................................................................. 220
Applying a Median Filter ........................................................................................ 220
Smoothing an Image ................................................................................................ 220
Applying a Roberts Filter ........................................................................................ 221
Applying a Sobel Filter ........................................................................................... 221
Applying an Unsharp Mask ..................................................................................... 221
Applying a Morphological Operator .............................................................................. 222
Contouring an Image ...................................................................................................... 223
Surfacing an Image ........................................................................................................ 225
Manipulating the Image Display .................................................................................... 226
Rotating an Image ................................................................................................... 226
Scaling an Image and Byte Scaling an Image ......................................................... 226
Inverting an Image ................................................................................................... 226
Flipping an Image .................................................................................................... 226
View Zoom .............................................................................................................. 227
Canvas Zoom ........................................................................................................... 227
Pixel Scaling ............................................................................................................ 227
Region Growing ...................................................................................................... 227
Adding Annotations ................................................................................................ 228
Line Profiles ............................................................................................................ 228
View Panning .......................................................................................................... 229
Contents
iTool User’s Guide
9
Cropping an Image ..................................................................................................
iImage Tool Operations ................................................................................................
Viewing a Histogram ..............................................................................................
Viewing Image Statistics ........................................................................................
Cropping Images .....................................................................................................
229
231
231
231
231
Chapter 11
Working with Surfaces ........................................................................ 233
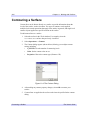
Introduction ...................................................................................................................
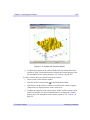
Displaying Surfaces .......................................................................................................
Surface Properties ..........................................................................................................
The Visualization Browser .....................................................................................
The Operations Browser .........................................................................................
Adding a Colorbar .........................................................................................................
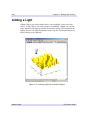
Adding a Light ...............................................................................................................
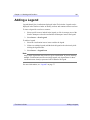
Adding a Legend ...........................................................................................................
Adding Axes ..................................................................................................................
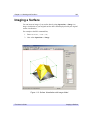
Imaging a Surface ..........................................................................................................
Contouring a Surface .....................................................................................................
Resampling a Surface ....................................................................................................
Filtering a Surface .........................................................................................................
Convolving a Surface ..............................................................................................
Median a Surface ....................................................................................................
Smoothing a Surface ...............................................................................................
Adding a Texture Map ..................................................................................................
Manipulating Surface Displays .....................................................................................
Rotating a Surface ...................................................................................................
Scaling a Surface ....................................................................................................
Adding Annotations ................................................................................................
View Zoom .............................................................................................................
Canvas Zoom ..........................................................................................................
Extracting a Line Profile .........................................................................................
iSurface Tool Operations ...............................................................................................
Viewing a Histogram Plot .......................................................................................
Viewing Statistics ...................................................................................................
iTool User’s Guide
234
235
237
237
237
239
240
241
242
243
244
246
247
247
247
247
248
249
249
251
252
252
253
253
254
254
254
Contents
10
Chapter 12
Working with Contours ...................................................................... 255
Introduction .................................................................................................................... 256
Displaying Contours ...................................................................................................... 257
Displaying Regular-grid Data ................................................................................. 257
Displaying Irregular-grid Data ................................................................................ 258
Contour Properties ......................................................................................................... 264
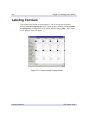
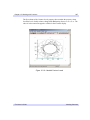
Labeling Contours .......................................................................................................... 266
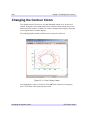
Changing the Contour Colors ........................................................................................ 268
Filling Contours ............................................................................................................. 269
Adding a Colorbar .......................................................................................................... 271
Adding a Legend ............................................................................................................ 272
Adding Axes .................................................................................................................. 273
Filtering a Contour ......................................................................................................... 274
Contour Smoothing ................................................................................................. 274
Contour Convolution ............................................................................................... 275
Manipulating the Contour Display ................................................................................. 276
Translating ............................................................................................................... 276
View Zoom .............................................................................................................. 276
Flipping a Contour ................................................................................................... 276
Canvas Zoom ........................................................................................................... 276
Scaling a Contour Display ....................................................................................... 277
Adding Annotations ................................................................................................ 277
iContour Tool Operations .............................................................................................. 279
Viewing a Histogram ............................................................................................... 279
Viewing Statistics .................................................................................................... 279
Chapter 13
Working with Plots ............................................................................. 281
Introduction .................................................................................................................... 282
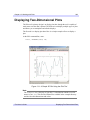
Displaying Two-Dimensional Plots ............................................................................... 283
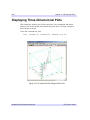
Displaying Three-Dimensional Plots ............................................................................. 284
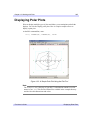
Displaying Polar Plots .................................................................................................... 285
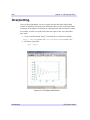
Overplotting ................................................................................................................... 286
Plot Properties ................................................................................................................ 288
Modifying Properties ............................................................................................... 288
Contents
iTool User’s Guide
11
Adding Legends ............................................................................................................
Adding a Colorbar .........................................................................................................
Adding Error Bars .........................................................................................................
Curve Fitting ..................................................................................................................
Filtering a Plot ...............................................................................................................
Plot Smoothing .......................................................................................................
Plot Convolution .....................................................................................................
Plot Median .............................................................................................................
Manipulating the Plot Display .......................................................................................
Translating ..............................................................................................................
Adding Annotations ................................................................................................
View Zoom .............................................................................................................
Canvas Zoom ..........................................................................................................
Selecting the Data Range ........................................................................................
iPlot Tool Operations ....................................................................................................
Scaling a Plot Display .............................................................................................
Viewing a Histogram ..............................................................................................
Viewing Statistics ...................................................................................................
289
291
292
294
297
297
298
298
299
299
299
300
300
300
301
301
301
301
Chapter 14
Working with Volumes ........................................................................ 303
Introduction ...................................................................................................................
Displaying Volumes ......................................................................................................
Multi-Channel Volumes .........................................................................................
Rendering Volumes ................................................................................................
Using the Volume Panel ................................................................................................
Volume Properties .........................................................................................................
Modifying Properties ..............................................................................................
Adding a Colorbar .........................................................................................................
Adding Axes ..................................................................................................................
Resampling Volumes ....................................................................................................
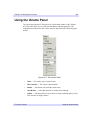
Showing an Image Plane ...............................................................................................
Viewing the Image Plane in iImage ........................................................................
Extracting an IsoSurface ...............................................................................................
Extracting an Interval Volume ......................................................................................
Manipulating the Volume Display ................................................................................
iTool User’s Guide
304
305
305
306
309
311
311
312
313
314
315
315
316
318
320
Contents
12
Rotating a Volume ................................................................................................... 320
Scaling a Volume .................................................................................................... 320
View Zoom .............................................................................................................. 320
Canvas Zoom ........................................................................................................... 320
Adding Annotations ................................................................................................ 320
iVolume Tool Operations .............................................................................................. 322
Viewing a Histogram ............................................................................................... 322
Viewing Statistics .................................................................................................... 322
Smoothing a Volume ............................................................................................... 322
Opening an Image Stack .......................................................................................... 322
Chapter 15
Working with Maps ............................................................................. 325
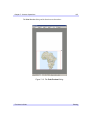
Introduction .................................................................................................................... 326
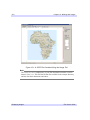
Displaying Maps ............................................................................................................ 327
Applying a Map Projection ........................................................................................... 328
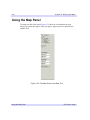
Using the Map Panel ...................................................................................................... 332
Displaying an Image ...................................................................................................... 334
Registering an Image .................................................................................................... 335
Registering an Image in Meters ............................................................................... 337
Registering an Image in Degrees ............................................................................. 340
Displaying a Contour ..................................................................................................... 342
Creating a Shape Visualization ...................................................................................... 343
Inserting a Map Grid ...................................................................................................... 344
Inserting an IDL Shapefile ............................................................................................. 345
Inserting the Continents ........................................................................................... 345
Inserting the Countries (Low Resolution) ............................................................... 346
Inserting the Countries (High Resolution) .............................................................. 346
Inserting the Rivers ................................................................................................. 348
Inserting the Lakes .................................................................................................. 349
Inserting the United States ...................................................................................... 350
Inserting the Canadian Provinces ............................................................................ 351
Chapter 16
Working with Vectors ......................................................................... 353
Introduction .................................................................................................................... 354
Displaying Vectors ......................................................................................................... 355
Contents
iTool User’s Guide
13
Vector Fields ...........................................................................................................
Wind Barbs .............................................................................................................
Streamlines ..............................................................................................................
Vector Properties ...........................................................................................................
Modifying Properties ..............................................................................................
Subsampling ............................................................................................................
Coloring Vectors Using Auxiliary Data .................................................................
Manipulating the Vector Visualization .........................................................................
Translating ..............................................................................................................
Adding Annotations ................................................................................................
View Zoom .............................................................................................................
Canvas Zoom ..........................................................................................................
iVector Tool Operations ................................................................................................
Adding and Modifying Streamlines ........................................................................
Adding Magnitude Contours ..................................................................................
Adding Direction Contours .....................................................................................
Vectors and Mapping ....................................................................................................
355
356
359
360
360
360
362
363
363
363
364
364
365
365
366
366
367
Appendix A
iTools Interface Reference .................................................................. 369
Introduction to iTools Interface Elements .....................................................................
Menu Bar Items ......................................................................................................
Toolbar Items ..........................................................................................................
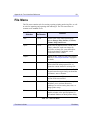
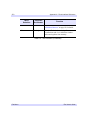
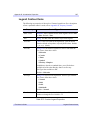
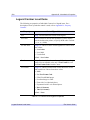
File Menu ......................................................................................................................
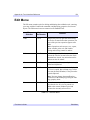
Edit Menu ......................................................................................................................
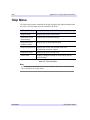
Insert Menu ....................................................................................................................
Operations Menu ...........................................................................................................
Window Menu ...............................................................................................................
Help Menu .....................................................................................................................
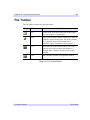
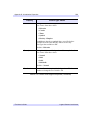
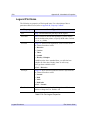
File Toolbar ...................................................................................................................
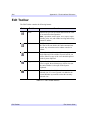
Edit Toolbar ...................................................................................................................
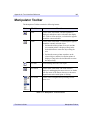
Manipulator Toolbar ......................................................................................................
Annotation Toolbar .......................................................................................................
Context Menu ................................................................................................................
iTool User’s Guide
370
370
370
371
373
376
377
380
382
383
384
385
386
387
Contents
14
Appendix B
Property Controls ............................................................................... 389
Appendix C
Operations Properties ........................................................................ 393
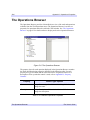
The Operations Browser ............................................................................................... 394
Macros Properties ......................................................................................................... 395
Statistics Properties ....................................................................................................... 396
Histogram Properties .................................................................................................... 397
Filter Properties ............................................................................................................. 398
Convolution Properties ............................................................................................ 398
Median Properties .................................................................................................... 400
Smooth Properties ................................................................................................... 401
Roberts Filter Properties .......................................................................................... 401
Sobel Filter Properties ............................................................................................. 402
Unsharp Mask Properties ........................................................................................ 402
Curve Fitting Properties .......................................................................................... 403
Rotate Properties ........................................................................................................... 405
Rotate Left Properties .............................................................................................. 405
Rotate Right Properties ........................................................................................... 405
Rotate By Angle Properties ..................................................................................... 405
Flip Horizontal ........................................................................................................ 405
Flip Vertical ............................................................................................................. 405
Transform Properties .................................................................................................... 406
Resample Properties ................................................................................................ 406
Rotate Data Properties ............................................................................................. 407
Scale Data Properties ............................................................................................... 408
Invert Image Properties ........................................................................................... 409
Byte Scale Properties ............................................................................................... 409
Map Projection Properties ............................................................................................. 410
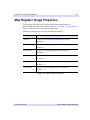
Map Register Image Properties ..................................................................................... 411
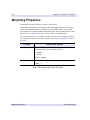
Morphing Properties ..................................................................................................... 412
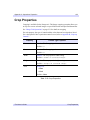
Crop Properties ............................................................................................................. 413
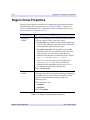
Region Grow Properties ................................................................................................ 414
Contour Properties ........................................................................................................ 416
Image Properties ........................................................................................................... 417
Contents
iTool User’s Guide
15
Surface Properties .........................................................................................................
Vector Properties ...........................................................................................................
Streamlines ..............................................................................................................
Contour Magnitude .................................................................................................
Contour Direction ...................................................................................................
Volume Properties ........................................................................................................
Image Plane .............................................................................................................
Isosurface ................................................................................................................
Render Volume .......................................................................................................
Interval Volume ......................................................................................................
Image Plane Properties .................................................................................................
Launch iImage ........................................................................................................
418
419
419
419
419
420
420
420
420
421
422
423
Appendix D
Visualization Properties ..................................................................... 425
Introduction to Visualization Properties ........................................................................
The Visualization Browser ............................................................................................
Window Properties .......................................................................................................
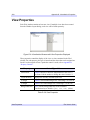
View Properties ............................................................................................................
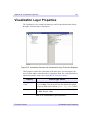
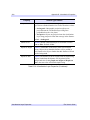
Visualization Layer Properties .....................................................................................
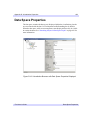
Data Space Properties ...................................................................................................
Rendering Objects at Data Space Depth .................................................................
Visualization Type Properties .......................................................................................
Image ......................................................................................................................
Plot ..........................................................................................................................
Plot 3D ....................................................................................................................
Surface ....................................................................................................................
Contour ...................................................................................................................
Vector ......................................................................................................................
Volume ....................................................................................................................
Isosurface ................................................................................................................
Interval Volume ......................................................................................................
Image Plane .............................................................................................................
Colorbar ..................................................................................................................
Histogram ................................................................................................................
Axes ........................................................................................................................
iTool User’s Guide
426
427
428
430
431
433
436
437
438
441
445
448
453
458
463
469
471
474
477
481
485
Contents
16
Lights ....................................................................................................................... 494
Polygonal ROI ......................................................................................................... 497
IDL Graphics Objects .............................................................................................. 499
Map Grid ................................................................................................................. 500
ShapePolygon .......................................................................................................... 505
ShapePolyline .......................................................................................................... 507
ShapePoint .............................................................................................................. 509
Streamlines .............................................................................................................. 510
2D Annotation Layer Properties .................................................................................... 513
Text Annotation Properties ..................................................................................... 514
Line Annotation Properties ..................................................................................... 516
Line Profile Annotation Properties .......................................................................... 517
Rectangle Annotation Properties ............................................................................. 520
Oval Annotation Properties ..................................................................................... 521
Polygon Annotation Properties ............................................................................... 522
Freehand Annotation Properties .............................................................................. 523
Legend Properties .......................................................................................................... 524
Legend Contour Items ............................................................................................ 527
Legend Contour Level Items .................................................................................. 528
Legend Plot Items ................................................................................................... 530
Legend Surface Items ............................................................................................. 531
Index .................................................................................................... 533
Contents
iTool User’s Guide
Chapter 1
Introducing
the IDL iTools
This chapter introduces you to the new IDL iTools and aids in using this guide.
Introducing the iTools . . . . . . . . . . . . . . . . . 18
iTool User’s Guide
Using This Guide . . . . . . . . . . . . . . . . . . . . 20
17
18
Chapter 1: Introducing the IDL iTools
Introducing the iTools
The new IDL Intelligent Tools (iTools) are a set of interactive utilities that combine
data analysis and visualization with the task of producing presentation quality
graphics. Based on the IDL Object Graphics system, the iTools are designed to help
you get the most out of your data with minimal effort. They allow you to continue to
benefit from the control of a programming language, while enjoying the convenience
of a point-and-click environment.
In IDL, seven pre-built iTools are exposed for immediate interactive use. Each of
these tools is designed around a specific data or visualization type, including:
•
Two- and three-dimensional plots (line, scatter, polar, and histogram style)
•
Surface representations
•
Contour data
•
Map data
•
Image displays
•
Volume visualizations
•
Vector displays
The iTools are built upon a new object-oriented framework, or set of object classes,
that serve as the building blocks for the interface and functionality of the iTools. IDL
programmers can easily use this framework to create custom data analysis and
visualization environments. Such custom iTools may be called from within a larger
IDL application, or they may serve as the foundation for a complete application.
A Single Tool with Many Faces
What sets the iTools apart from precursors such as the Live Tools (now obsolete) —
and what gives them their optimal power, flexibility, and extensibility — is the
cohesive, open architecture of the iTools system. The iTools system is actually
comprised of a single tool, which adapts to handle the data that you pass to it. The
plot, surface, image, contour, and volume tools are simply shortcut configurations,
which facilitate ad hoc data analysis and visualization. Each tool encapsulates the
functionality (data operations, display manipulations, and visualization types)
required to handle its data or visualization type. However, you are not constrained to
work with a single data or visualization type. Instead, using the iTools system, you
may start by bringing up a surface plot in a surface tool and then import scattered
point data into the same plot to see the relationship between two data sets. Or, you
may start with an image display, overlay contours from another data set, and map
Introducing the iTools
iTool User’s Guide
Chapter 1: Introducing the IDL iTools
19
both the image and contours onto a three-dimensional surface representation of a
third data set. By throwing new data into an iTool, it is easy to end up with a hybrid
tool that can handle complex, composite visualizations.
Of course, you have always been able to create these kinds of powerful, composite
visualizations in IDL to reveal important relationships and trends in data. The main
enhancements the new iTools provide are more mouse interactivity, WYSIWYG
(What-You-See-Is-What-You-Get) printing, built-in analysis, undo-redo capabilities,
layout control, and better-looking plots. These robust, pre-built tools reduce the
amount of programming IDL users must do to create interactive visualizations. At the
same time, the iTools integrate in a seamless manner with the IDL Command Line,
user interface controls, and custom algorithms. In this way, the iTools maintain and
enhance the control and flexibility IDL users rely on for data exploration, algorithm
design, and rapid application development.
Foundation for the Future
As you will discover, the iTools are compelling new tools to add to your arsenal.
They complement the strong foundation that IDL has maintained over the course of
its evolution. This foundation has made possible countless valuable user-written
applications across many disciplines and industries. However, the iTools also
represent the start of a new, updated display paradigm for IDL. While the iTools
system in IDL is a powerful and flexible environment that will allow you to
immediately accelerate your data interpretation and reporting, it is only the
beginning. We will continue to build on this new technology in future releases. You
can look forward to more functionality, flexibility, and optimization as the iTools
system continues to grow.
We look forward to members of the IDL community building on the iTools system as
well. The iTools source code is included in the IDL distribution to allow you to:
•
extend the pre-built tools with your own operations, manipulations,
visualization types, and GUI controls
•
create your own custom tools based on the iTools component framework
•
share your inventions with others in the IDL community via the ITT Visual
Information Solutions User-Contributed Library (www.ittvis.com/codebank)
or other avenues of collaboration and distribution
Note
For more information on building your own iTools or building hybrid iTools, see
the iTool Developer’s Guide.
Tips and instructions for using this guide are detailed in the following section.
iTool User’s Guide
Introducing the iTools
20
Chapter 1: Introducing the IDL iTools
Using This Guide
The iTool User Guide can show you important iTool functionality such as how to
start the iTools, how to import data into an iTool, how to export data out of an iTool,
the general layout of the iTools, and how to perform common iTool tasks.
This User Guide is organized to help you make the most of the IDL iTools. The User
Guide contains the following chapters:
•
Chapter 2, “Importing and Exporting Data” — This chapter introduces you to
bringing data into the iTools as well as exporting data.
•
Chapter 3, “Visualizations” — This chapter introduces what an iTool
visualization is and how to work with visualizations.
•
Chapter 4, “Manipulating the Display” — This chapter describes the various
ways that you can manipulate your displays within an iTool.
•
Chapter 5, “Adding Annotations” — This chapter describes the various types
of annotations available in iTools and how to work with them.
•
Chapter 6, “Property Sheets and Browsers” — This chapter describes the
property sheets and browsers that are common to all iTools.
•
Chapter 7, “Common Operations” — Many iTool operations are common to
each tool. These operations are described in this chapter.
•
Chapter 8, “Working with Macros” — This chapter describes macros in iTools
and how they are created and used.
•
Chapter 9, “Working with Styles” — This chapter describes iTool styles and
how to create and work with them.
•
Chapter 10, “Working with Images” — This chapter describes the iImage tool
and gives you insight into unique image visualization and manipulation tasks.
•
Chapter 11, “Working with Surfaces” — This chapter describes the iSurface
tool and gives you insight into unique surfacing and surface manipulation
tasks.
•
Chapter 12, “Working with Contours” — This chapter describes the iContour
tool and gives you insight into unique contouring and contour manipulation
tasks.
•
Chapter 13, “Working with Plots” — This chapter describes the iPlot tool and
gives you insight into unique plotting and plot manipulation tasks.
Using This Guide
iTool User’s Guide
Chapter 1: Introducing the IDL iTools
21
•
Chapter 14, “Working with Volumes” — This chapter describes the iVolume
tool and gives you insight into unique volume visualization and volume
manipulation tasks.
•
Chapter 15, “Working with Maps” — This chapter describes the iMap tool and
gives you insight into unique mapping and map manipulation tasks.
•
Chapter 16, “Working with Vectors” — This chapter describes the iVector tool
and gives you insight into unique vector and vector manipulation tasks.
•
Appendix A, “iTools Interface Reference” — This appendix gives you a
detailed look at the iTool interface and its components.
•
Appendix B, “Property Controls” — This appendix describes the iTool
controls used to set properties in the iTool property sheets.
•
Appendix C, “Operations Properties” — This appendix describes the
properties of the iTools found in the Operations Browser of each iTool.
•
Appendix D, “Visualization Properties” — This appendix describes the
properties of the iTools found in the Visualization Browser of each iTool.
iTool User’s Guide
Using This Guide
22
Using This Guide
Chapter 1: Introducing the IDL iTools
iTool User’s Guide
Chapter 2
Importing and
Exporting Data
This chapter describes how to access data using the iTool.
About the Data Manager . . . . . . . . . . . . . . .
Data Import Methods . . . . . . . . . . . . . . . . . .
Importing Data from a File . . . . . . . . . . . . .
Working with Unknown Data . . . . . . . . . . .
iTool User’s Guide
24
27
34
37
Importing Data from the IDL Session . . . . 41
Parameter Data and the Command Line . . 42
Exporting Data . . . . . . . . . . . . . . . . . . . . . . 44
23
24
Chapter 2: Importing and Exporting Data
About the Data Manager
All data used by any iTool is first loaded into the iTools Data Manager, which keeps
track of which data items are associated with an iTool visualization. The Data
Manager provides a convenient and structured environment in which to import and
view files and variables.
The process of loading data into the Data Manager is entirely automatic if you
specify data when launching an iTool at the IDL command line or if you open a data
file using the Open command from the iTool’s File menu. In these cases, the iTool
will import the data in the specified file or variable and create a visualization of the
default type for the selected data and the iTool you are using.
If you want more control over the process of creating a visualization, you can load
data into the Data Manager manually, either from a data file or from one or more
variables that exist in your current IDL session. Once a data item is placed in the Data
Manager, it is available to all iTools until it is removed.
The IDL iTools support several data types. Data import and export capabilities within
each iTool allow you to access these various types of data. Methods used to place
data into the Data Manager are described in this chapter. File readers allow you to
import data stored in binary formats, ASCII files, and several image file types.
Note
You can also create file readers for other data types besides those provided in IDL.
For more information on creating file readers and creating your own iTools, see
Chapter 9, “Creating a File Reader” (iTool Developer’s Guide).
About the Data Manager
iTool User’s Guide
Chapter 2: Importing and Exporting Data
25
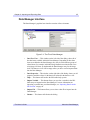
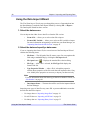
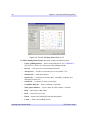
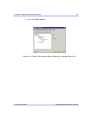
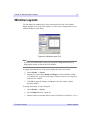
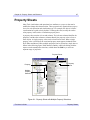
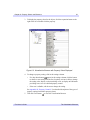
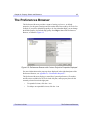
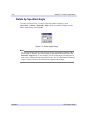
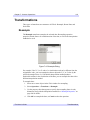
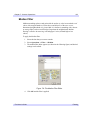
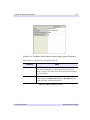
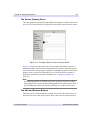
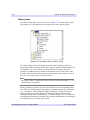
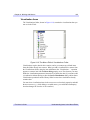
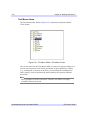
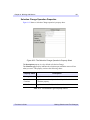
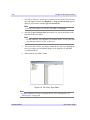
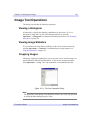
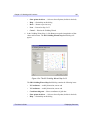
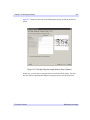
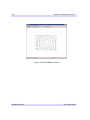
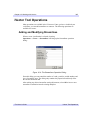
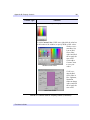
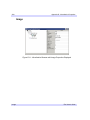
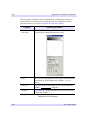
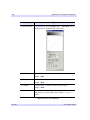
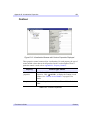
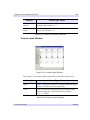
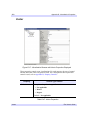
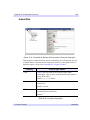
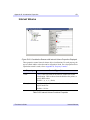
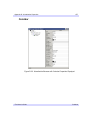
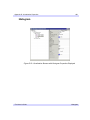
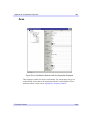
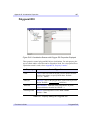
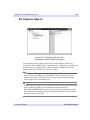
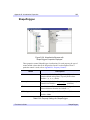
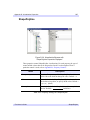
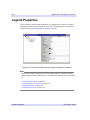
Data Manager Interface
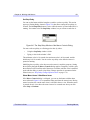
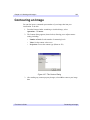
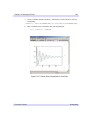
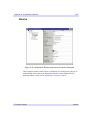
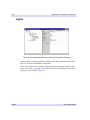
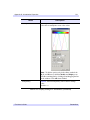
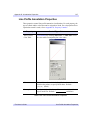
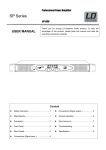
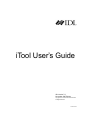
The Data Manager’s graphical user interface consists of these elements:
Figure 2-1: The iTools Data Manager
•
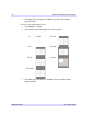
Data Tree View — This window, on the left side of the dialog, shows all of
the data items available within the Data Manager. Depending on how data
items were added to the Data Manager, they may be collected into groups of
related items; for example, individual image channels associated with a truecolor image will show up underneath the Data Manager entry for the image
itself. The data tree view will be empty unless you have read or imported data
into the Data Manager.
•
Data Properties— This window, on the right side of the dialog, shows you all
properties and their values for the data item selected in the data tree view.
•
Help — This button will invokes the IDL online help system.
•
Import Variable — This button allows you to select a variable in the IDL
Main scope to import into the Data Manager. For more information on
importing a variable into your Data Manager, see “Importing Data from the
IDL Session” on page 41.
•
Import File — This button allows you to select a data file to import into the
Data Manager.
•
Dismiss — This button will dismiss the dialog.
iTool User’s Guide
About the Data Manager
26
Chapter 2: Importing and Exporting Data
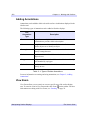
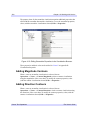
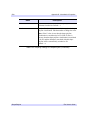
Data Item Management
In addition to the ability to import new data into the Data Manager, you can rename,
duplicate, or remove existing data items.
•
Renaming data — To rename a data item, enter a new name in the Name field
on the data property sheet.
•
Deleting data — To delete an unused or outdated data item, select the item in
the tree view, click the right mouse button to display the Data Manager context
menu, and choose the Delete option.
Note
Deletion is not reversible.
•
Duplicating data — To create a copy of an existing data item, select the item
in the tree view, click the right mouse button to display the Data Manager
context menu, and choose the Duplicate option.
About the Data Manager
iTool User’s Guide
Chapter 2: Importing and Exporting Data
27
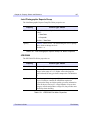
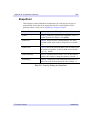
Data Import Methods
Data items in the Data Manager are available to all iTools until it they are removed.
You can bring data into the iTool Data Manager in the following ways:
•
Using the Data Import Wizard (File → Import)
•
By opening a data file directly (File → Open)
•
Using the Import Variable ... or Import File... buttons on the Data Manager
dialog (Window → Data Manager)
•
By specifying data parameters at the IDL command line. For example,
specifying the following at the IDL command line:
iPlot, myDataVariable
places the variable myDataVariable in the Data Manager.
These methods are described in the following sections.
•
“Using the Data Import Wizard” on page 28
•
“Using File Open” on page 32
•
“Using the Data Manager Dialog” on page 33
•
“Importing Data from the IDL Session” on page 41
Note
Once data has been imported into the iTool and is visible in the Data Manager, there
are a numerous ways to visualize the data. To learn more about visualizing data, see
Chapter 3, “Visualizations”.
iTool User’s Guide
Data Import Methods
28
Chapter 2: Importing and Exporting Data
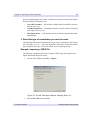
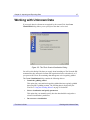
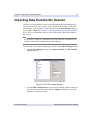
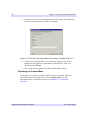
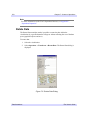
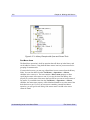
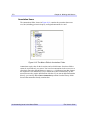
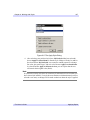
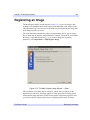
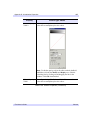
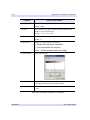
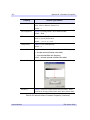
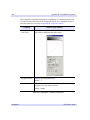
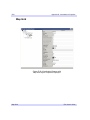
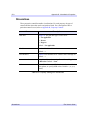
Using the Data Import Wizard
The iTool Data Import Wizard steps you through the process of importing data into
the Data Manager. Launch the Data Import Wizard by selecting File → Import...
The Data Import Wizard has three screens:
1. Select the data source.
You can import data either from a data file or from the IDL session:
•
From a File — allows you to select a data file to import.
•
From an IDL Variable — allows you to select an IDL variable to import.
For more information on importing a variable into your Data Manager, see
“Importing Data from the IDL Session” on page 41.
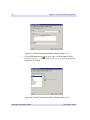
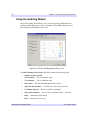
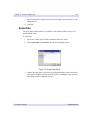
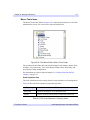
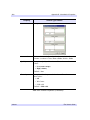
2. Select the data and specify a data name.
If you are importing data from a file, the second screen of the Data Import Wizard
contains the following items:
•
File Name — The full path of the file want to open. You can populate this
field using a standard dialog by clicking the File Open button.
•
File Open button
•
File Type — After a file is selected, the File Type field displays the
format of the file.
•
Type Properties Window — After a file is selected the properties
window shows properties of the file reader that will import the data, if any
exist. Modify these properties as necessary to import your data correctly.
— Displays the standard file-selection dialog.
Note
For more information about file format types that are available in iTools, see
“File Readers” on page 99.
•
Data Import Name — The name that will be used for the imported data in
the Data Manager.
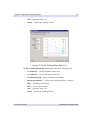
Importing some types of data files may cause IDL to present additional screens that
describe the data before import.
•
For image data see “Importing Image Data” on page 34
•
For ASCII data see “Importing ASCII Data” on page 34
•
For binary data see “Importing Binary Data” on page 35
Using the Data Import Wizard
iTool User’s Guide
Chapter 2: Importing and Exporting Data
29
If you are importing data from an IDL variable, the second screen of the Data Import
Wizard contains the following items:
•
List of IDL Variables — All variables available in the current IDL session are
listed in a tree view.
•
Variable Information — Information about the selected variable is displayed
to the right of the tree view.
•
Data Import Name — The name that will be used for the imported data in the
Data Manager.
3. Select the type of visualization you want to create.
The Data Import Wizard will automatically create a new visualization of the selected
type. Choosing <Default> will create the default visualization for the selected data
type, regardless of the type of iTool into which you are importing the data.
Example: Importing a JPEG File
The following example describes how to import a JPEG image file using the Data
Import Wizard and display the image:
1. From an iTool window select File → Import.
Figure 2-2: The IDL Data Import Wizard, Showing Step 1 of 3
2. Select From a File and click Next.
iTool User’s Guide
Using the Data Import Wizard
30
Chapter 2: Importing and Exporting Data
Figure 2-3: The IDL Data Import Wizard, Showing Step 2 of 3
3. Click the File Open button
just to the right of the File Name field and
select the endocell.jpg file from the examples/data directory of the IDL
distribution. Click Next.
Figure 2-4: The IDL Data Import Wizard, Showing Step 3 of 3
Using the Data Import Wizard
iTool User’s Guide
Chapter 2: Importing and Exporting Data
31
4. Select Image as the desired visualization to create since we have a JPEG
image.
5. Click Finish. The data is imported into the Data Manager, and a new image
visualization appears in the iTool window.
Note
The process of creating visualizations is discussed in detail in Chapter 3,
“Visualizations”.
iTool User’s Guide
Using the Data Import Wizard
32
Chapter 2: Importing and Exporting Data
Using File Open
Selecting a data file using File → Open will open the file using the default iTool file
reader for the type of file you select. The data will be added to the Data Manager and
the iTool will automatically create the default visualization for the data contained in
the file.
If the data in the file you select is binary or ASCII, you will be prompted to specify
further information that will allow the binary or ASCII file readers to correctly
import the data. For an explanation of the handling of various file types see the
following sections:
•
For ASCII data see “Importing ASCII Data” on page 34
•
For binary data see “Importing Binary Data” on page 35
•
For ShapeFile data see “Importing Shapefile Data” on page 36
•
For data of an unrecognized format see “Working with Unknown Data” on
page 37
Using File Open
iTool User’s Guide
Chapter 2: Importing and Exporting Data
33
Using the Data Manager Dialog
Selecting Window → Data Manager opens the Data Manager dialog. You can then
click the Import Variable... or Import File... button.
Importing a File
If you are importing data from a file, the File Import dialog appears. It contains the
following items:
•
File name — The full path of the file want to open. You can populate this field
using a standard dialog by clicking the File Open button.
•
File Open button
•
Import options — Displays a properties window shows properties of the file
reader that will import the data, if any exist. Modify these properties as
necessary to import your data correctly.
— displays the standard file-selection dialog.
Note
For more information about file format types that are available in iTools, see
“File Readers” on page 99.
•
Data import name — The name that will be used for the imported data in the
Data Manager.
Importing a Variable
If you are importing data from an IDL variable, the IDL Variable Browser appears. It
contains the following items:
•
List of IDL Variables — All variables available in the current IDL session are
listed in a tree view.
•
Variable Information — Information about the selected variable is displayed
to the right of the tree view.
•
Data Import Name — The name that will be used for the imported data in the
Data Manager.
•
Import Type — The variable type to be used for the imported data in the Data
Manager.
iTool User’s Guide
Using the Data Manager Dialog
34
Chapter 2: Importing and Exporting Data
Importing Data from a File
You can import data from several types of files into the iTool Data Manager. The
following sections describe the process of importing different types of data.
•
“Importing Image Data” on page 34
•
“Importing ASCII Data” on page 34
•
“Importing Binary Data” on page 35
•
“Importing Shapefile Data” on page 36
Importing Image Data
You can visualize image data stored in many common file formats. Common image
file formats accepted are:
• DICOM Images
• Macintosh PICT
• Graphics Interchange
Format Images (GIF)
• Portable Network
Graphics (PNG)
• Joint Photographic
Experts Group (JPEG)
• Tag Image File Format
(TIFF)
• JPEG2000 (JP2 or JPX)
• Windows Bitmap (BMP)
Note
You can also use the iTool’s export and export variable features to export image
data and variables. For more information on exporting, see “Exporting Data” on
page 44.
Note
For more information on the iImage tool and its functions and features, see Chapter
10, “Working with Images”.
Importing ASCII Data
When you open a file containing ASCII data, you must specify the format of the file
before the iTool can read the data and place it into the Data Manager. The iTool
opens the ASCII Template dialog to allow you to specify the format of the ASCII
data.
Importing Data from a File
iTool User’s Guide
Chapter 2: Importing and Exporting Data
35
Note
You can also use the iTool’s export and export variable features to export ASCII
data and variables. For more information on exporting, see “Exporting Data” on
page 44.
To import ASCII data in an iTool, select File → Open or click the Import File
button in the Data Manager or Insert Visualization dialog. See “Using the ASCII
Template Dialog” under “ASCII_TEMPLATE” (IDL Reference Guide) for
instructions on how to use the dialog to define the structure of your ASCII data.
Note
Once data has been imported into the iTool and is visible in the Data Manager, there
are a few ways to visualize the data. To learn more about visualizing data, see
Chapter 3, “Visualizations”.
For more information on using the ASCII file reader, see “ASCII_TEMPLATE” (IDL
Reference Guide).
Importing Binary Data
When you open a file containing binary data that is not of a format recognized by any
other file reader available to your iTool, you must specify the format of the file before
the iTool can read the data and place it into the Data Manager. The iTool opens the
Binary Template dialog to allow you to specify the format of the binary data.
Note
If the file contains binary data of a recognized format, such as TIFF or JPEG, the
iTool will automatically choose the correct file reader to read the binary data.
Note
You can also use the iTool’s export and export variable features to export binary
data and variables. For more information on exporting, see “Exporting Data” on
page 44.
To import binary data in an iTool, select File → Open or click the Import File
button in the Data Manager or Insert Visualization dialog. See “Using the
BINARY_TEMPLATE Interface” under “BINARY_TEMPLATE” (IDL Reference
Guide) for instructions on how to use the dialog to define the structure of your binary
data.
iTool User’s Guide
Importing Data from a File
36
Chapter 2: Importing and Exporting Data
Note
Once data has been imported into the iTool and is visible in the Data Manager, there
are a few ways to visualize the data. To learn more about visualizing data, see
Chapter 3, “Visualizations”.
For more information on the binary file reader, see “BINARY_TEMPLATE” (IDL
Reference Guide).
For more information on plotting and plot functions, see Chapter 13, “Working with
Plots”.
Importing Shapefile Data
For more information on shapefiles and inserting them into an iTool, see “Inserting an
IDL Shapefile” on page 345.
Note
Once data has been imported into the iTool and is visible in the Data Manager, there
are a few ways to visualize the data. To learn more about visualizing data, see
Chapter 3, “Visualizations”.
Importing Data from a File
iTool User’s Guide
Chapter 2: Importing and Exporting Data
37
Working with Unknown Data
If you supply data in a format not recognized by the current iTool, the Create
Visualization dialog allows you to specify how the data is to be used.
Figure 2-5: The iTools Create Visualization Dialog
You will see this dialog if the data you supply when launching an iTool from the IDL
command line does not match a known data organization for the selected tool, or if
you open an ASCII text file containing data that appears to be irregularly gridded.
The Create Visualization dialog contains the following choices:
•
Launch the gridding wizard
This option lets you transform irregularly-gridded data into regularly-gridded
data using IDL’s gridding routines. The resulting data is displayed by the
iTool. See “Using the Gridding Wizard” on page 38 for details.
•
Select a visualization and specify parameters
This option lets you manually specify how the data should be assigned to a
selected visualization’s parameters.
•
iTool User’s Guide
Do not create a visualization
Working with Unknown Data
38
Chapter 2: Importing and Exporting Data
Using the Gridding Wizard
The iTools Gridding Wizard allows you to convert irregularly-gridded data into
regularly-gridded data using a variety of methods. The gridding wizard processes
your irregularly-gridded data in three steps.
Figure 2-6: The IDL Gridding Wizard Step 1 of 3
The IDL Gridding Wizard Step 1 of 3 dialog contains the following items:
•
Number of points entered
•
X Coordinates — The X coordinate range
•
Y Coordinates — The Y coordinate range
•
Data values — The data minimum and maximum values
•
Spherical data checkbox — Check this box if the data is spherical
•
Coordinate diagram — Shows coordinates of grid data
•
Show points checkbox — Select to show all points (default = checked)
•
Help — Obtain help on this dialog
•
Back — Return to previous step
Working with Unknown Data
iTool User’s Guide
Chapter 2: Importing and Exporting Data
•
Next — Proceed to Step 2 of 3
•
Cancel — Dismiss the Gridding Wizard
39
Figure 2-7: The IDL Gridding Wizard Step 2 of 3
The IDL Gridding Wizard Step 2 of 3 dialog contains the following items:
•
X Coordinates — modify dimension, start or end
•
Y Coordinates — modify dimension, start or end
•
Coordinate diagram — shows coordinates of grid data
•
Show points checkbox — select to show all points (default = checked)
•
Help — obtain help on this dialog
•
Back — return to previous step
•
Next — proceed to Step 3 of 3
•
Cancel — dismiss the Gridding Wizard
iTool User’s Guide
Working with Unknown Data
40
Chapter 2: Importing and Exporting Data
Figure 2-8: The IDL Gridding Wizard Step 3 of 3
The IDL Gridding Wizard Step 3 of 3 dialog contains the following items:
•
Choose gridding method — choose from pull-down list. See “GRIDDATA”
(IDL Reference Guide) for a discussion of the gridding methods.
•
Preview — click to preview selected method and data
•
Auto preview — checkbox to turn auto preview on (default = off)
•
Statistics tab — shows data statistics
•
Options tab — set options for missing values, smoothing, weighting, and
anisotropy between axes
•
Search tab — set options for using search ellipse
•
Coordinate diagram — shows coordinates of grid data
•
Show points checkbox — select to show all points (default = checked)
•
Help — obtain help on this dialog
•
Back — return to previous step
•
Finish — dismiss the Gridding Wizard with data gridded
•
Cancel — dismiss the Gridding Wizard
Working with Unknown Data
iTool User’s Guide
Chapter 2: Importing and Exporting Data
41
Importing Data from the IDL Session
Variables in your current IDL session can be imported into the Data Manager to be
visualized in an iTool. Once you have entered variables into the IDL session at the
command line, you can import a variable directly from the Data Manager dialog, or
by using File → Import. See Chapter 3, “Importing and Writing Data into Variables”
(Using IDL) for information on how to create variables that contain data within an
IDL session.
Note
If you specify a variable as a parameter to the iTool at the IDL command line, the
variable is automatically imported into the Data Manager.
The following is an example of importing a variable using the Data Manager dialog:
1. From the Data Manager dialog, select Import Variable. The IDL Variable
Browser appears.
Figure 2-9: The IDL Variable Browser
2. From the IDL Variable Browser you can select available variables which you
have created in your IDL session and click Import to add them to your Data
Manager as available variables.
iTool User’s Guide
Importing Data from the IDL Session
42
Chapter 2: Importing and Exporting Data
Figure 2-10: Imported Variable with Imported Files
After importing data into the Data Manager, you can display the data using the Insert
Visualization dialog. See “Inserting Visualizations” on page 54 for details.
Importing Graphic Objects
You can import graphic objects into your iTool using the Visualization pull-down
menu on the Insert Visualization window. Select IDL Graphics Object and then
import your variable from the Data Manager into the Graphics Object field and
select Insert.
When importing graphic objects into an iTool it is important to remember:
•
If the object hierarchy being inserted as a graphic object does not have the
REGISTER_PROPERTIES keyword set, then no properties will be available
in your iTool when the object is visualized.
If the object hierarchy being inserted as a graphic object includes an image object,
rotation may not behave as expected. For more information on image objects and
their behavior, see “Transformations of IDLgrImage Objects” (Chapter 32, IDL
Reference Guide).
Parameter Data and the Command Line
Parameter data can often be entered at the IDL command line in IDL when creating
an iTool. Consider the following example:
1. At the IDL Command Line, enter the following:
myPlotData = RANDOMU(seed, 30)
iPlot, myPlotData
Importing Data from the IDL Session
iTool User’s Guide
Chapter 2: Importing and Exporting Data
43
2. The variable myPlotData is inserted into the iTool Data Manager.
3. The following is produced in an iPlot window:
Figure 2-11: Reading Parameter Data in at the IDL Command Line
Note
See Chapter 3, “Importing and Writing Data into Variables” (Using IDL) for more
information on Command Line data access.
iTool User’s Guide
Importing Data from the IDL Session
44
Chapter 2: Importing and Exporting Data
Exporting Data
Data of many common file formats can be exported by IDL iTools. File formats that
are exportable are:
• ASCII text
• JPEG2000
• Binary data
• Macintosh PICT
• Encapsulated Postscript
(EPS)
• Portable Network
Graphics (PNG)
• Graphics Interchange
Format (GIF)
• Tag Image File Format
(TIFF)
• iTools State
• Windows Bitmap (BMP)
• Joint Photographic
Experts Group (JPG)
• Windows Enhanced
Metafile (WMF)
You can export data from an iTool to a data file or back to the current IDL session:
•
“Exporting Data to a File” on page 45
•
“Exporting Data to the IDL Session” on page 48
These methods are discussed next.
Exporting Data
iTool User’s Guide
Chapter 2: Importing and Exporting Data
45
Exporting Data to a File
You can export the contents of an entire iTool window into a single image or data file
using the IDL Data Export Wizard.
For example, to export a file:
1. Select File → Export. The IDL Data Export Wizard appears.
Figure 2-12: The IDL Data Export Wizard, Showing Step 1 of 3
2. The first step asks you to choose to export the data to either a file or an IDL
variable. Select To a File and then Next.
Note
For more information on exporting data to an IDL variable, see the following
section, “Exporting Data to the IDL Session” on page 48.
iTool User’s Guide
Exporting Data to a File
46
Chapter 2: Importing and Exporting Data
Figure 2-13: The IDL Data Export Wizard, Showing Step 2 of 3
3. From the next screen, select the data which you wish to export. Notice that
only the Window level or View level can be exported. Click Next.
Figure 2-14: The IDL Data Export Wizard, Showing Step 3 of 3
Exporting Data to a File
iTool User’s Guide
Chapter 2: Importing and Exporting Data
47
4. You are now prompted for selection of the destination and file type. After
entering a desired filename, extension, and destination, click Finish. The file is
then exported.
iTool User’s Guide
Exporting Data to a File
48
Chapter 2: Importing and Exporting Data
Exporting Data to the IDL Session
You can export data from an iTool into a single variable using the IDL Data Export
Wizard.
For example, to export data to an IDL variable:
1. Select File → Export. The IDL Data Export Wizard appears.
Figure 2-15: The IDL Data Export Wizard, Exporting a Variable Step 1 of 3
Exporting Data to the IDL Session
iTool User’s Guide
Chapter 2: Importing and Exporting Data
49
2. Select To an IDL Variable.
Figure 2-16: The IDL Data Export Wizard, Exporting a Variable Step 2 of 3
iTool User’s Guide
Exporting Data to the IDL Session
50
Chapter 2: Importing and Exporting Data
3. From the next screen, select the data that you wish to export. Notice that only
data items can be exported as variables. Click Next.
Figure 2-17: The IDL Data Export Wizard, Exporting a Variable Step 3 of 3
4. The final screen and step allow you to name your variable as you wish. A
default name also appears as representative of the data item. Name your
variable and click Finish.
5. The variable will now appear in the IDL Variable Watch window.
Exporting via Context Menu
An alternate way to export a variable to IDL is to select the variable within the
Visualization browser and right-click to choose Export to IDL. For more
information on the Visualization browser, see Appendix D, “Visualization
Properties”.
Exporting Data to the IDL Session
iTool User’s Guide
Chapter 3
Visualizations
This chapter describes how working with visualizations within the iTool.
About Visualizations . . . . . . . . . . . . . . . . . . 52
Visualization Creation Methods . . . . . . . . . 53
Creating Visualizations Automatically . . . . 53
iTool User’s Guide
Inserting Visualizations . . . . . . . . . . . . . . . 54
Modifying Existing Visualizations . . . . . . . 56
Exporting Visualizations . . . . . . . . . . . . . . 58
51
52
Chapter 3: Visualizations
About Visualizations
A visualization is a graphical representation of data that has been imported into the
iTool Data Manager. This might mean a plot, image, or surface just to name a few.
Visualizations can be created in any iTool window either automatically or manually.
Visualizations can also be modified and exported. These topics are all discussed in
this chapter.
When data is imported into the IDL iTools system, it resides in the Data Manager.
The Data Manager provides a convenient interface within which you can organize
and manage data. For more information on importing and exporting data in an iTool
and the use of the Data Manager, see Chapter 2, “Importing and Exporting Data”.
This chapter deals with the process of visualizing data that is already imported into an
iTool. Visualizations can be created automatically at the IDL Command Line or can
be inserted manually within an existing tool window. Once created, visualizations
contain parameters which can be modified in various ways. Visualizations can also
be exported from an iTool. These topics are all discussed in detail in this chapter.
About Visualizations
iTool User’s Guide
Chapter 3: Visualizations
53
Visualization Creation Methods
Visualizations can be created either automatically or manually. The following
sections discuss automatic and manual creation methods.
Creating Visualizations Automatically
Visualizations can be created automatically in the following ways:
•
By specifying some data when creating an iTool at the IDL Command Line.
For example:
myPlotData = RANDOMU(seed, 30)
iPlot, myPlotData
These statements will create a new data item in the iTool Data Manager and
create a new iPlot tool that visualizes the data in a line plot.
•
By opening a file in an existing iTool, either by selecting File → Open or
using the Data Import Wizard (File → Import...).
•
By using the Data Import Wizard (File → Import...) to import a variable from
the IDL Session.
Both the Data Import Wizard and the process of using File → Open are described in
detail in Chapter 2, “Importing and Exporting Data”.
Note
Certain data types (such as binary or ASCII) may require you to supply IDL with
further information before they can be visualized. For more information about
reading certain data types into iTools, see “Importing Data from a File” in Chapter
2.
iTool User’s Guide
Visualization Creation Methods
54
Chapter 3: Visualizations
Inserting Visualizations
If you already have the necessary data in the iTool Data Manager, you can manually
create a visualization in your iTool. This is done from your desired iTool window by
selecting Insert → Visualization.
To access data using Insert → Visualization from your tool:
1. Start an iTool.
2. Select Insert → Visualization. The Insert Visualization Dialog appears.
Data Tree View
Property Sheets
Visualization
Drop-down Menu
Parameter Property
Sheet
Parameter Data Types
Window
Figure 3-1: Insert Visualization Dialog With Image Visualization Type Selected
The Insert Visualization dialog contains the following items:
•
Data Tree View — this tree contains any imported data and/or variables
available for visualization in the Data Manager.
•
Data Properties — this area, to the right of the Data Tree View, shows the
properties of any selected Data Tree elements.
•
Select a Visualization Drop-down Menu — this menu allows you to
select the visualization type to use with the selected data.
Inserting Visualizations
iTool User’s Guide
Chapter 3: Visualizations
55
•
Parameter Property Sheet— these are the input parameters for the
visualization type selected in the Visualization Type Drop-down Menu.
These input variables will change per visualization type.
•
Parameter Data Types Window — this window to the right of the
parameters table shows the properties of the selected parameter.
•
Help — this button will invoke the help system.
•
Import Variable — gives you the ability to select a variable to import into
the Data Manager. For more information on importing a variable into your
Data Manager, see “Importing Data from the IDL Session” on page 41.
•
Import File — gives you the ability to select data from a file to import
into the Data Manager. For more information on importing a file into your
Data Manager, see “Importing Data from a File” on page 34.
•
Insert Button — this button will insert the specified visualization into the
current iTool. Insert is only active if data is associated with all required
parameters.
•
Dismiss — this button will dismiss the dialog.
3. Select the visualization type from the visualization type drop-down menu.
4. Next, assign data in the dialog to the parameters of the visualization being
inserted.
5. Now click Insert to finish inserting the visualization.
iTool User’s Guide
Inserting Visualizations
56
Chapter 3: Visualizations
Modifying Existing Visualizations
Once you have created your visualization, you can modify it as you wish. Use the
Parameter Editor to modify parameter data.
The Parameter Editor
The Parameter Editor is very similar to the Insert Visualization dialog. It shows the
data tree view and parameter property sheet and parameter data types window.
If you have already created a visualization, you can change the data associated with
one or more visualization parameters using the Parameter Editor. To display the
Parameter Editor, select your visualization, then select Edit → Parameters....
Data Tree View
Property Sheets
Parameter
Property Sheet
Parameter Data
Types Window
Figure 3-2: Parameter Editor
Note
The Parameter Editor contains all of the fields shown in the Insert Visualization
dialog, with the exception that you cannot change the visualization type of the
selected visualization. See “Inserting Visualizations” on page 54 for details.
Modifying Existing Visualizations
iTool User’s Guide
Chapter 3: Visualizations
57
To associate data with a visualization’s parameters using the Parameter Editor:
1. Select Edit → Parameters.
2. Do one of the following:
•
Select an item already in the Data Tree View.
•
Click Import File to import a file into the Data Tree View, and select the
file.
•
Click Import Variable to import a variable into the Data Tree View, and
select the variable.
3. Assign items to the appropriate input parameter and data item, then doubleclicking or by selected the down arrow just below the Data Tree View.
4. Click Apply to apply your new changes or Dismiss to close the Parameter
Editor.
Note
The Apply button will not be available unless all required parameters have been
assigned within a visualization.
Removing Data Associations
Once a visualization has been created, you can always remove associations within the
parameter editor. Select the parameter in the parameter property sheet and click the X
button between the data tree view and the parameter property sheet.
Note
If you remove a required parameter, you will not be able to apply your changes until
you select a new data item for that parameter.
Replacing Data Associations
To replace the data associated with a given parameter, select the parameter in the
parameter property sheet, then select a new data item in the data tree. Double-click or
click the down arrow button to replace the data associated with the selected
parameter.
iTool User’s Guide
Modifying Existing Visualizations
58
Chapter 3: Visualizations
Exporting Visualizations
Any iTool visualization can be saved. In order to save your visualization, select
File → Save As... and then name the file. The file will automatically be assigned the
extension .isv.
Exporting to a File
You can export data from an iTool to a data file or back to the current IDL session.
For more information on exporting to a file, see “Exporting Data” in Chapter 2.
Exporting Visualizations
iTool User’s Guide
Chapter 4
Manipulating the
Display
This chapter describes the following common tasks that can be performed with all of the IDL
Intelligent Tools:
Introduction . . . . . . . . . . . . . . . . . . . . . . . . .
Selection of Objects . . . . . . . . . . . . . . . . . . .
Undo/Redo . . . . . . . . . . . . . . . . . . . . . . . . . .
Adding a Data Space . . . . . . . . . . . . . . . . . .
Translation . . . . . . . . . . . . . . . . . . . . . . . . . .
iTool User’s Guide
60
61
62
63
64
Scaling . . . . . . . . . . . . . . . . . . . . . . . . . . . .
Zooming . . . . . . . . . . . . . . . . . . . . . . . . . . .
View Panning . . . . . . . . . . . . . . . . . . . . . . .
Window Layouts . . . . . . . . . . . . . . . . . . . .
65
70
72
73
59
60
Chapter 4: Manipulating the Display
Introduction
The Standard IDL iTools supplied in the IDL distribution comprise seven distinct
tools: iImage, iPlot, iSurface, iContour, iVolume, iMap, and iVector. Each tool
performs a specific set of tasks related to the type of data it is designed to use. In
addition to these specific tasks, all six tools have a number of manipulation tasks in
common. This chapter describes only these common display manipulation tasks; for
information about specific tasks performed by the individual iTools, refer to the
chapters describing those tools.
Note
This chapter describes manipulation tasks related only to the Standard IDL iTools,
those iTools supplied in the IDL distribution. Other iTools written by users and
third-party developers share a common interface with the ITT Visual Information
Solutions iTools because the iTools framework is used to create all iTools.
However, the specific functionality of such iTools may be different from the
functionality of the iTools described here.
Introduction
iTool User’s Guide
Chapter 4: Manipulating the Display
61
Selection of Objects
iTool elements such as axes and annotations have objects associated with them.
These objects have their own associated properties — such as color, line style, size,
and so on. There are two ways to select objects in IDL iTools:
•
With the Select arrow
•
From the Visualization Browser
To select an object or group of objects with the Select arrow:
1. If necessary, click the Select button
on the toolbar to enter Select mode.
2. Position the arrow mouse pointer over the object and click. A selection box
appears around the object.
3. To select additional objects, hold down the SHIFT key while clicking them.
To select an object or group of objects from the Visualization Browser:
1. Select Window → Visualization Browser.
2. Click the name of the object in the Visualization Browser list. A selection box
or selection highlight appears on that object in the iTool window.
3. To select additional objects, hold down the Shift key while selecting the names
of additional objects in the Visualization Browser list.
Select All
Select All selects all objects (visualizations, annotations, legends, etc.) displayed in
the iTool window.
To select all objects:
1. Select Edit → Select All. All displayed objects are selected.
2. CTRL + click to deselect any objects that you do not want to include.
iTool User’s Guide
Selection of Objects
62
Chapter 4: Manipulating the Display
Undo/Redo
Any action performed in an iTool window can be undone or redone. The Undo and
Redo mechanism provides a useful way of retracing and repeating steps that have
been performed in the iTool window.
Note
Operations which cannot be undone are Open, Save, Export, Export variable, Print,
Exit, and window moving and resizing.
To undo the most recent action, do one of the following:
•
Select Edit → Undo
•
Click
To undo multiple actions, simply repeat these commands. When no more actions
remain to be undone, the Undo menu item or toolbar button is no longer active.
To repeat actions that have been undone, do one of the following:
•
Select Edit → Redo
•
Click
Tip
Look at the text following the Undo or Redo menu item, or hover the mouse pointer
over the Undo or Redo button on the toolbar to display the tooltip, to identify the
action that will be undone or redone.
Undo/Redo
iTool User’s Guide
Chapter 4: Manipulating the Display
63
Adding a Data Space
The data space is the area within your visualization window where imported data
appears. A data space is added automatically when data is visualized directly into an
iTool window. However, if you desire to add a data space manually to any of the
iTools, you can select Insert → Data Space from the iTool window.
iTool User’s Guide
Adding a Data Space
64
Chapter 4: Manipulating the Display
Translation
Translation moves an object or group of objects in a specified direction. When an
object is selected, a bounding box appears around the object.
To translate a selected object to another location:
1. Position the pointer inside the bounding box. The mouse pointer changes to the
translation pointer .
2. Drag in the desired direction. The entire object moves to the new location.
Figure 4-1: Translating Objects
Note
For information on creating a surface visualization which you can translate such as
the one shown in the previous figure, see Chapter 11, “Working with Surfaces”.
Note
An axis (or axes) will behave differently during translation if any other object is
also selected.
Translation
iTool User’s Guide
Chapter 4: Manipulating the Display
65
Scaling
Two types of scaling are possible: constrained scaling and unconstrained scaling.
Constrained Scaling
Constrained scaling permits scaling of only one dimension while preserving the other
dimensions.
Constrained Scaling of 2-D Objects
To scale one dimension of a 2-D object, click on the object so that eight small
selection-boxes appear at each corner of the object and also midway along each side
of the object. Then position the mouse onto one of these boxes so that the mouse
pointer changes to a four-headed arrow pointer (see the following figure). Drag the
mouse in the desired direction to scale the object in the selected dimension.
Figure 4-2: Resizing a 2-D Plot
iTool User’s Guide
Scaling
66
Chapter 4: Manipulating the Display
Constrained Scaling of 3-D Objects
Two types of constrained scaling are available for 3-D objects: multiple-axis scaling
and single-axis scaling.
The multiple-axis scaling mouse pointer for 3-D objects is a three-headed arrow
displayed when the mouse pointer is positioned over a corner of a 3-D object’s data
space. Dragging the constrained scaling pointer scales the object a fixed distance
along all axes in the direction of the drag.
Constrained scaling
pointer
Bounding box
corners
Figure 4-3: Constrained Scaling
Scaling
iTool User’s Guide
Chapter 4: Manipulating the Display
67
The single-axis scaling pointer for 3-D objects is a two-headed arrow , displayed
when the pointer is positioned over an axis “whisker” in a 3-D image. Dragging an
axis “whisker” scales the object only in the direction of the arrows.
Axis handle
Resizing pointer
Figure 4-4: Resizing a 3-D Surface
Unconstrained Scaling
Unconstrained scaling allows you to scale all dimensions of an object at once from
any point within the object. Unconstrained scaling is different for 2-D and 3-D
objects.
iTool User’s Guide
Scaling
68
Chapter 4: Manipulating the Display
Unconstrained Scaling of 2-D Objects
Unconstrained scaling of 2-D objects occurs when a corner of the data set bounding
box is dragged. The mouse pointer changes to an unconstrained scaling pointer ,
and the object is scaled in the direction of the drag.
Unconstrained scaling pointer
Figure 4-5: Unconstrained Scaling of a 2-D Plot
Scaling
iTool User’s Guide
Chapter 4: Manipulating the Display
69
Unconstrained Scaling of 3-D Objects
Unconstrained scaling of 3-D objects occurs when a single side of the data set
bounding box is dragged. The mouse pointer changes to an unconstrained scaling
pointer , and the object is scaled along the dimensions of the selected side.
Bounding box
side
Unconstrained
scaling pointer
Figure 4-6: Unconstrained Scaling of a 3-D Surface
iTool User’s Guide
Scaling
70
Chapter 4: Manipulating the Display
Zooming
Two types of zooming are available in all iTools:
•
Canvas Zoom changes the magnification of the entire display canvas
(everything in the iTool window). If the display canvas is larger than the iTool
window, scroll bars appear.
•
View Zoom changes the magnification applied to the selected view. If the size
of the view is larger than the visible portion of the view (that is, if the view
zoom is greater than 100%), the view pan manipulator becomes active,
allowing you to move different portions of the view into the visible area.
Canvas Zoom
Canvas Zoom increases or decreases magnification of the entire iTool window
without moving the observer’s “eye.”
To zoom in or out with Canvas Zoom:
1. Select Window → Canvas Zoom and select a percentage from the list.
•
To increase magnification, choose a percentage greater than 100%.
•
To decrease magnification, choose a percentage less than 100%.
2. Select 100% to return to the default magnification.
View Zoom
View Zoom increases or decreases magnification of items in the currently selected
view in an iTool window. This is similar to moving the observer’s “eye” closer to or
farther away from the objects in the view. You can change the view zoom using the
view zoom button or by using the view zoom pull-down menu.
To use the view zoom button:
1. Click Zoom
on the toolbar to enter Zoom mode.
2. Position the mouse pointer on the viewplane. The pointer changes to a zoom
pointer .
Zooming
iTool User’s Guide
Chapter 4: Manipulating the Display
71
3. Do any of the following:
•
Drag the zoom pointer toward the top of the iTool window to enlarge the
display
•
Drag the zoom pointer toward the bottom of the iTool window to make the
display smaller
•
Use the mouse scroll wheel to make the display larger or smaller
4. Click on the arrow Select button to leave Zoom mode and return to Select
mode. The mouse pointer changes to an arrow pointer. In Select mode,
dragging the arrow pointer positions the zoomed image.
The view zoom combobox is located just to the right of the view zoom manipulator
button on the toolbar and always reports the zoom factor of the currently selected
view. You can also use this combobox to set a requested zoom factor for the currently
selected view by simply using the pull-down menu to select a value.
iTool User’s Guide
Zooming
72
Chapter 4: Manipulating the Display
View Panning
The view pan button appears on the iTool’s toolbar as a hand (shown depressed
below) and allows panning within an iTool view by clicking and dragging the mouse.
Figure 4-7: View Pan Selected
Notice that panning will only be possible if the iTool view is not completely within
the window, or the iTool view is larger than viewable area of the window.
View Panning
iTool User’s Guide
Chapter 4: Manipulating the Display
73
Window Layouts
You can change the minimum size of the canvas displayed in the iTool window,
display multiple views in the iTool window, or select a preset arrangement of views,
with the Window Layout dialog.
Figure 4-8: Window Layout Tool
Note
If you are in Freeform mode, canvas size can also be changed interactively by
dragging the corners or sides of the iTool window.
To change the minimum size of the canvas displayed in the iTool window:
1. Select Window → Layout.
2. Edit the pixel values in the Width and Height text boxes (Default = Width
512, Height 384). A preview of the shape of the new canvas size is displayed
in the Preview window.
3. Click OK to apply the changes or Cancel to close the window without
applying changes.
To change the number of views displayed:
1. Select Window → Layout.
2. Select Gridded from the Layout list.
3. Edit the number of columns and rows in the Grid text boxes (Default = 1 by 1).
iTool User’s Guide
Window Layouts
74
Chapter 4: Manipulating the Display
4. Click OK to apply the changes or Cancel to close the window without
applying changes.
To select a preset arrangement of views:
1. Select Window → Layout.
2. Select from the following arrangements in the Layout list:
1x1
Gridded
Trio Left
Inset
Trio Right
Trio Top
Freeform
Trio Bottom
3. Click OK to apply the changes, or Cancel to close the window without
applying changes.
Window Layouts
iTool User’s Guide
Chapter 5
Adding Annotations
This chapter describes the following common tasks that can be performed with all of the IDL
Intelligent Tools:
Introduction . . . . . . . . . . . . . . . . . . . . . . . . . 76
Legends . . . . . . . . . . . . . . . . . . . . . . . . . . . . 77
iTool User’s Guide
Annotations . . . . . . . . . . . . . . . . . . . . . . . . 79
Additional Axes . . . . . . . . . . . . . . . . . . . . . 84
75
76
Chapter 5: Adding Annotations
Introduction
The Standard IDL iTools supplied in the IDL distribution (iImage, iPlot, iSurface,
iContour, iVolume, iMap, and iVector) each posses common annotation capabilities.
This chapter describes this common annotation functionality and how it can be used.
Note
This chapter describes Annotation functionality for only the Standard IDL iTools,
those iTools supplied in the IDL distribution. Other iTools written by users and
third-party developers share a common interface with the ITT Visual Information
Solutions iTools because the iTools framework is used to create all iTools.
However, the specific functionality of such iTools may be different from the
functionality of the iTools described here.
Introduction
iTool User’s Guide
Chapter 5: Adding Annotations
77
Legends
Legends identify the visualizations displayed in the iTool window. For example, a
legend displayed in an iPlot window can include a description of each plot line in a
plot. Or a legend can be displayed in an iSurface window to identify surfaces and
contour levels displayed on those surfaces.
To insert a legend for a surface or contour:
1. Select specific items to include in the legend, or click in an empty area of the
iSurface window dataspace to select the dataspace and include all items in the
legend.
2. Select Insert → New Legend.
To add to a legend:
1. Select the visualization item or items to add to the legend.
2. If there are multiple legends, add the desired legend to the selection by shiftclicking the legend border.
3. Select Insert → Legend Item.
Note
Only a single legend item may exist for a given visualization. If you are inserting
multiple visualization items into an existing legend, only legend items for those
visualizations not already represented will be added to the legend.
iTool User’s Guide
Legends
78
Chapter 5: Adding Annotations
Each legend entry consists of a sample and a label. For example, in Figure 5-1, the
sample for the first entry is an unbroken line of thickness 1, and the label is Noisy
Sine Plot. The sample for the second is a broken blue line of thickness 2, and the label
is Clean Sine Plot.
Figure 5-1: Legend for Two Plot Lines
Tip
To alter your legend’s properties such as in the example shown previously, display
the property sheet. To do this, double-click the border of the legend box.
Legends
iTool User’s Guide
Chapter 5: Adding Annotations
79
Annotations
The following types of annotations can be added to iTool visualizations:
Annotation
Type
Description
Text
Single lines or multiple lines of text can be added to a
visualization to provide a label or description.
Line
Straight line annotations can be added to a visualization to link
labels to objects or to identify an object.
Rectangle
Rectangular annotations can be added to a visualization to
identify rectangular areas.
Oval
Oval annotations can be added to a visualization to identify
circular areas.
Polygon
Polygon annotations can be added to a visualization to identify
areas bounded by a multi-sided polygon.
Freehand
Freehand annotations can be added to a visualization to
identify an area.
Table 5-1: Types of Annotations
Note
Annotations are 2-D in nature and are defined in their own data space. They are
most useful for adding notes to a data visualization for which the orientation has
been finalized.
Text Annotations
To add a text annotation:
1. Click the Text Annotation button
on the toolbar.
2. Click anywhere on the canvas. A text insertion bar appears where you click.
iTool User’s Guide
Annotations
80
Chapter 5: Adding Annotations
3. Type the annotation text.
•
To add a new line, press Ctrl + Enter
•
To add superscript characters, press Ctrl + U
•
To add subscript characters, press Ctrl + D
•
To return to normal characters, press Ctrl + N
Note
For information on how to embed these and other formatting commands from
the Text Annotation property sheet, refer to “Text Annotation Properties” on
page 514.
4. Press Enter. A bounding box appears around the annotation text.
•
To position the annotation, position the mouse pointer within the bounding
box so that it changes to a translation pointer . Click and drag the
annotation to the desired location.
•
To display and modify text annotation properties such as font, text color
and transparency, double-click the bounding box or inside the bounding
box.
Line Annotations
To add a line annotation:
1. Click the Line Annotation button
on the toolbar.
2. Click in an empty part of the canvas and, without releasing the mouse button,
drag to draw a line of the desired length.
Annotations
•
To constrain in the direction that you are drawing, hold down the Shift key
while drawing
•
To draw the line from the center, hold down the Ctrl key while drawing
iTool User’s Guide
Chapter 5: Adding Annotations
81
3. Release the mouse button. Selection handles appear at both ends of the line
annotation.
•
To position the line annotation, position the mouse pointer over the
selected line so that it changes to a translation pointer . Click and drag
the annotation to the desired location.
•
To resize the line annotation, position the mouse pointer over the selection
handle at one end of the line so that it changes to a resize pointer . Click
and drag the selection handle to obtain the desired line length.
•
To display and modify line annotation properties such as line thickness
and arrow style, double-click the annotation.
Rectangle Annotations
To add a rectangle annotation:
1. Click the Rectangle Annotation button
on the toolbar.
2. Click in an empty part of the canvas and, without releasing the mouse button,
drag to draw a rectangle of the desired size.
•
To constrain the rectangle to a square, hold down the Shift key while
drawing
•
To draw the rectangle from the center, hold down the Ctrl key while
drawing
3. Release the mouse button. Selection handles appear at the corners and sides of
the rectangle annotation.
iTool User’s Guide
•
To position the rectangle annotation, position the mouse pointer inside the
selected rectangle so that it changes to a translation pointer . Click and
drag the annotation to the desired location.
•
To resize the rectangle annotation, position the mouse pointer over the
selection handle on one side of the rectangle so that it changes to a resize
pointer . Click and drag the selection handle to obtain the desired shape.
•
To scale the rectangle annotation, position the mouse pointer over the
selection handle at one corner of the rectangle so that it changes to an
unconstrained scaling pointer . Click and drag the selection handle to
obtain the desired scaling.
•
To display and modify rectangle annotation properties such as background
color and transparency, double-click the annotation.
Annotations
82
Chapter 5: Adding Annotations
Oval Annotations
To add an oval annotation:
1. Click the Oval Annotation button
on the toolbar.
2. Click in an empty part of the canvas and, without releasing the mouse button,
drag to draw a circular annotation of the desired size.
•
To constrain the oval to a circle, hold down the Shift key while drawing.
•
To draw the oval from the center, hold down the Ctrl key while drawing.
3. Release the mouse button. Selection handles appear at the corners and sides of
the oval annotation.
•
To position the oval annotation, position the mouse pointer inside the
selected oval so that it changes to a translation pointer . Click and drag
the annotation to the desired location.
•
To resize the oval annotation, position the mouse pointer over the selection
handle on one side of the oval so that it changes to a resize pointer .
Click and drag the selection handle to obtain the desired shape.
•
To scale the oval annotation, position the mouse pointer over the selection
handle at one corner of the oval so that it changes to an unconstrained
scaling pointer . Click and drag the selection handle to obtain the
desired scaling.
•
To display and modify oval annotation properties such as background
color and transparency, double-click the annotation.
Polygon Annotations
To add a polygon annotation:
1. Click the Polygon Annotation button
on the toolbar.
2. Click in an empty part of the canvas to specify the first point of the polygon.
3. Click again to specify the second point of the polygon. A line is drawn to
connect the first and second points.
4. Click to specify the third and each consecutive point of the polygon. Lines are
drawn to connect each subsequent point, forming a multi-sided shape.
Tip
To remove the last point, press the Esc key.
Annotations
iTool User’s Guide
Chapter 5: Adding Annotations
83
5. Double-click to specify the last point of the polygon. Selection boxes appear at
the corners and sides of the newly-created annotation.
•
To position the polygon annotation, position the mouse pointer inside the
selected polygon so that it changes to a translation pointer . Click and
drag the annotation to the desired location.
•
To resize the polygon annotation, position the mouse pointer over the
selection handle on one side of the polygon so that it changes to a resize
pointer . Click and drag the selection handle to obtain the desired shape.
•
To scale the polygon annotation, position the mouse pointer over the
selection handle at one corner of the polygon so that it changes to an
unconstrained scaling pointer . Click and drag the selection handle to
obtain the desired scaling.
•
To display and modify polygon annotation properties such as background
color and transparency, double click the annotation.
Freehand Annotations
To add a freehand annotation:
1. Click the Freehand Annotation button
in the toolbar.
2. Click in an empty part of the canvas and, without releasing the mouse button,
drag to draw a freehand shape.
3. Release the mouse button. Selection handles appear at the corners and sides of
the selected freehand annotation.
iTool User’s Guide
•
To position the freehand annotation, position the mouse pointer inside the
selected freehand shape so that it changes to a translation pointer . Click
and drag the annotation to the desired location.
•
To resize the freehand annotation, position the mouse pointer over the
selection handle on one side of the freehand shape so that it changes to a
resize pointer . Click and drag the selection handle to obtain the desired
shape.
•
To scale the freehand annotation, position the mouse pointer over the
selection handle at one corner of the freehand shape so that it changes to an
unconstrained scaling pointer . Click and drag the selection handle to
obtain the desired scaling.
•
To display and modify rectangle annotation properties such as background
color and transparency, double-click the annotation.
Annotations
84
Chapter 5: Adding Annotations
Additional Axes
By default, X, Y, and (for 3-D data spaces) Z axes are displayed in the iTool window.
The display of these axes is controlled by property sheets for the axes container and
for individual axes (see “Axes” on page 485). Additional X, Y or Z axes can be added
to most data spaces to make it easier to identify characteristics.
To add an additional axis to your data space:
1. Select the data space.
2. Select Insert → Axis.
3. Choose from the following options:
•
X axis
•
Y axis
•
Z axis
Use the mouse to position the new axis, and double-click the axis to display the axis
property sheet.
Note
For a 3-D visualization, you can use the Shift + Ctrl to translate an axis in the
opposite direction. This will be shown in the Status message when an axis is
selected for translation. You can also use the arrow keys to change axes placement
direction.
Additional Axes
iTool User’s Guide
Chapter 6
Property Sheets and
Browsers
This chapter describes the following common tasks that can be performed with all of the IDL
Intelligent Tools:
Introduction . . . . . . . . . . . . . . . . . . . . . . . . . 86
Property Sheets . . . . . . . . . . . . . . . . . . . . . . 87
The Visualization Browser . . . . . . . . . . . . . 90
iTool User’s Guide
The Preferences Browser . . . . . . . . . . . . . . 95
The Operations Browser . . . . . . . . . . . . . . . 93
85
86
Chapter 6: Property Sheets and Browsers
Introduction
The Standard IDL iTools supplied in the IDL distribution (iPlot, iSurface, iContour,
iVolume, iMap, and iVector) each share several common property sheets and
browsers. This chapter discusses those property sheets and browsers and their uses.
Note
This chapter describes only the Standard IDL iTools, those iTools supplied in the
IDL distribution. Other iTools written by users and third-party developers share a
common interface with the ITT Visual Information Solutions iTools because the
iTools framework is used to create all iTools. However, the specific functionality of
such iTools may be different from the functionality of the ITT Visual Information
Solutions iTools described here.
Introduction
iTool User’s Guide
Chapter 6: Property Sheets and Browsers
87
Property Sheets
Most iTool visualizations and operations have attributes or properties that can be
modified to change their characteristics. These properties are organized into property
sheets for each operation and visualization type. For example, the skin of a surface
visualization has a gold color by default. To change this color, modify the surface
color property in the surface visualization property sheet.
A property sheet consists of rows and columns. The left-most column identifies the
properties, and the other column or columns identify the property values of one or
more objects. A single property value can be selected at one time. When a single
property value is clicked on, the associated property name appears indented. In the
Style Editor and Macro Editor, multiple properties can be selected at a single time as
shown in the following figure. Hold down the Ctrl key while left-clicking with the
mouse to make nonadjacent selections, or hold down the Shift key to select an
adjacent range of properties.
Property Sheet
Property
Object
(Component)
Property
Value
Multiple
Property
Selections
Figure 6-1: Property Sheet with Multiple Property Selections
iTool User’s Guide
Property Sheets
88
Chapter 6: Property Sheets and Browsers
Visualization Property Sheets
Visualization property sheets can be displayed from the Visualization Browser or
from the iTool window.
To display a visualization’s property sheet from the Visualization Browser:
1. Select Window → Visualization Browser.
2. Select the name of the object in the Visualization Browser list. The object’s
properties are displayed in the right-hand pane of the Visualization Browser
window (the small arrows at the top-left of the Browser window will allow you
to display both panes).
To display a visualization’s property sheet from the iTool window:
1. Click to select the object in the iTool window.
2. Do one of the following to display the property sheet for the selected
visualization:
•
Double-click the visualization in the iTool window
•
Select Edit → Properties
•
Right-click to display the Context Menu, and select the Properties menu
item
Note
For detailed information on Visualization Browser properties, see Appendix D,
“Visualization Properties”.
Operations Property Sheets
Operations property sheets can only be displayed from the Operations Browser. To
display an operations property sheet:
1. Select Operations → Operations Browser.
2. Select the name of the operation in the Operations Browser list. The operation
properties are displayed in the right-hand pane of the Operations Browser
window (the small arrows at the top-left of the Browser window will allow you
to display both panes).
Property Sheets
iTool User’s Guide
Chapter 6: Property Sheets and Browsers
89
Note
For detailed information on Operations Browser properties, see Appendix C,
“Operations Properties”.
iTool User’s Guide
Property Sheets
90
Chapter 6: Property Sheets and Browsers
The Visualization Browser
The Visualization Browser provides access to visualizations (objects displayed in the
iTool window) and the properties of those visualizations. When the Visualization
Browser is displayed, you can select graphical objects from a nested list and display
the property sheets for those objects. For example, if a surface visualization is
displayed and you would like to change the appearance of the X axis in that
visualization, you can select the axis in the Visualization Browser (Figure 6-2),
display the property sheet for that axis (Figure 6-3), and modify the properties to
change the appearance of the axis.
Element name selected
Property Sheet Expansion Button
Element highlighted in iTool window
Figure 6-2: Visualization Browser with Axis 0 Selected
To select an object with the visualization browser:
1. Select Window → Visualization Browser.
2. Select the name of the object in the list. The element is highlighted in the iTool
window.
•
To expand a list item, click the + icon
•
To collapse an expanded list item, click the - icon
The Visualization Browser
iTool User’s Guide
Chapter 6: Property Sheets and Browsers
91
3. To display the property sheet for the object, click the expansion button to the
right of the list or double-click the property.
Figure 6-3: Visualization Browser with Property Sheet Displayed
4. To change a property setting, click in the settings column.
•
If a drop-down button
appears in the settings column, click the button
to choose a new setting from the list of options, activate a slider to change
the setting value, display a selection dialog or list, or display an Edit button
providing access to a user-defined property control.
•
If the text is editable, edit the text to change the setting.
See Appendix B, “Property Controls” for a detailed description of the types of
property settings included in property sheets.
5. Click the Close button
iTool User’s Guide
to close the Visualization Browser.
The Visualization Browser
92
Chapter 6: Property Sheets and Browsers
Note
Properties of standard graphical objects are described in detail in Appendix D,
“Visualization Properties” and in the “IDL Commands” chapter of the IDL
Reference Guide.
The Visualization Browser
iTool User’s Guide
Chapter 6: Property Sheets and Browsers
93
The Operations Browser
The Operations Browser provides a quick way to display and modify the properties
for a given iTool operation (task performed on iTool data) before that operation is
performed. For example, to display the properties of the Convolution filter, select the
name of the filter in the left pane of the Operations Browser (see Figure 6-4), and
modify the Scale factor property value in the right pane to change the default scale
factor for convolution.
Figure 6-4: Operations Browser with Convolution Filter Properties Displayed
The Operations Browser displays a nested list of operations available in the current
iTool in the left pane, and a property sheet for the currently selected operation in the
right pane.
•
To expand a list item, click the + icon
•
To collapse an expanded list item, click the - icon
To change the properties of an operation from the Operations Browser:
1. Select Operations → Operations Browser.
2. Select the name of the operation in the list. A list of properties and the property
settings appears in the right-hand pane of the Operations Browser window.
iTool User’s Guide
The Operations Browser
94
Chapter 6: Property Sheets and Browsers
3. Locate the property you want to change in the list, and click in the settings
column.
•
If a drop-down button
appears in the settings column, click the button
to choose a new setting from the list of options, activate a slider to change
the setting value, display a selection dialog or list, or display an Edit button
providing access to a user-defined property control.
•
If the text is editable, edit the text to change the setting.
See Appendix B, “Property Controls” for a detailed description of the types of
property settings included in property sheets.
4. Click the Close button
to close the Operations Browser.
Note
Properties of standard iTool operations are described in Appendix C, “Operations
Properties” and in the “IDL Commands” chapter of the IDL Reference Guide.
The Operations Browser
iTool User’s Guide
Chapter 6: Property Sheets and Browsers
95
The Preferences Browser
The Preferences Browser provides a means of setting preferences, or default
properties, for the general settings and file readers and writers used by all iTools. For
example, if you prefer default drag quality to be low rather than high, you can change
the default property for Default drag quality from High to Low in the Preferences
Browser, as shown in Figure 6-5.
Figure 6-5: Preferences Browser with Contour Projection Properties Displayed
For more information on the property sheets displayed in the right-hand pane of the
Preferences Browser, see Appendix D, “Visualization Properties”.
The Preferences Browser displays a nested list of general preferences, file readers,
and file writers available for all iTools in the left pane, and a property sheet for the
currently selected item in the right pane.
•
To expand a list item, click the + icon
•
To collapse an expanded list item, click the - icon
iTool User’s Guide
The Preferences Browser
96
Chapter 6: Property Sheets and Browsers
To change the properties of a general setting, file reader, or file writer from the
Preferences Browser:
1. Select File → Preferences.
2. Select the name of the general setting, file reader, or file writer in the list. A list
of properties and the current property settings appears in the right-hand pane of
the Preferences Browser window.
3. Locate the property you want to change in the list, and click in the settings
column.
•
If a drop-down button
appears in the settings column, click the button
to choose a new setting from the list of options, activate a slider to change
the setting value, display a selection dialog or list, or display an Edit button
providing access to a user-defined property control.
•
If the text is editable, edit the text to change the setting.
See Appendix B, “Property Controls” for a detailed description of the types of
property settings included in property sheets.
4. Click the Close button
to close the Preferences Browser.
Note
Changes to preferences are saved between iTool sessions. When the OK button is
clicked, preferences are saved in their current state.
The Preferences Browser
iTool User’s Guide
Chapter 6: Property Sheets and Browsers
97
General Settings
The first option on the Preferences Browser is the General Settings option. Settings
listed here will be applied to all iTools if altered. The properties listed here are:
Property
Control Type: Values
Unlimited Buffer
Boolean: Set to determine undo/redo buffer size as limited or
unlimited:
• True (limited)
• False (unlimited)
Default = True
Zoom on
Window Resize
Boolean: Set to determine if iTool visualizations resize upon
view resizing:
• True
• False
Default = False
Change directory
on open
Boolean: Set to be prompted to change directory upon open:
• True
• False
Default = True
Default working
directory
Select Edit to bring up the Browse for folder dialog.
Default style
Boolean: Select from existing style list.
Default = none
Default = none
Default drag
quality
Boolean: Set the window drag quality.
• Low
• Medium
• High
Default = High
Table 6-1: General Settings Properties
iTool User’s Guide
General Settings
98
Chapter 6: Property Sheets and Browsers
Property
Printer output
format
Control Type: Values
Boolean: Set the format for printing output.
• Bitmap
• Vector
Default = Bitmap
Clipboard output
format
Boolean: Set the output format for clipboard copied data.
• Bitmap
• Vector
Default = Bitmap
Table 6-1: General Settings Properties (Continued)
Note
The Restore Defaults button at the bottom of the Preferences Browser restores all
default settings immediately.
General Settings
iTool User’s Guide
Chapter 6: Property Sheets and Browsers
99
File Readers
Select this folder to edit file reader preferences and properties. Available file reader
types and their editable properties are listed in the following tables. For more
information on reading in data of various types, see Chapter 2, “Importing and
Exporting Data”.
ASCII text
The ASCII text File Reader properties are:
Property
Control Type: Values
None
The ASCII text File Reader has no configurable properties
other than Name and Description.
Table 6-2: ASCII Text File Reader Properties
Binary data
The Binary data File Reader properties are:
Property
Control Type: Values
None
The Binary data Graphics File Reader has no configurable
properties other than Name and Description.
Table 6-3: Binary Data File Reader Properties
DICOM Image
The DICOM Image File Reader properties are:
Property
None
Control Type: Values
The DICOM Image File Reader has no configurable properties
other than Name and Description.
Table 6-4: DICOM Image File Reader Properties
iTool User’s Guide
File Readers
100
Chapter 6: Property Sheets and Browsers
ESRI Shapefile
The ESRI Shapefile File Reader properties are:
Property
Control Type: Values
Combine all
shapes
Boolean: If True then combine all of the shapes within the file
into a single visualization (ShapePolygon, ShapePolyline, or
ShapePoint). The default is to create a separate visualization
for each shape.
Name attribute
String List: If the shapefile has attributes associated with each
shape, then the Shapefile reader will attempt to use one of
these attributes for the Name of the newly-created data and
visualizations. The droplist contains all of the available
attributes, and allows you to choose a different attribute to be
used for the visualization name. If “Combine all shapes” is
True then this property is insensitive, and the filename will be
used for the Name of the resulting data and visualization.
Table 6-5: ESRI Shapefile File Reader Properties
Graphics Interchange Format
The Graphics Interchange Format (GIF) File Reader properties are:
Property
Image index
Control Type: Values
Number: The index of the image within the GIF file that
should be read into the image data object.
Table 6-6: GIF File Reader Properties
iTools State
The iTools State File Reader properties are:
Property
None
Control Type: Values
The iTools State File Reader has no configurable properties
other than Name and Description.
Table 6-7: iTools State File Reader Properties
File Readers
iTool User’s Guide
Chapter 6: Property Sheets and Browsers
101
Joint Photographic Experts Group
The Joint Photographic Experts Group File Reader properties are:
Property
Control Type: Values
None
The Joint Photographic Experts Group File Reader has no
configurable properties other than Name and Description.
Table 6-8: Joint Photographic Experts File Reader Properties
JPEG2000
The JPEG2000 File Reader properties are:
Property
Control Type: Values
Levels to discard
A droplist giving the number of highest resolution levels
which will not appear in the result. Image dimensions are
divided by 2 to the power of this number. For example, if the
image in the object has dimensions of 1024 x 1026, and
DISCARD_LEVELS is set to 3, the resulting image will have
dimensions of 128 x 129, which is the ceiling of [1024, 1026]
divided by 23. The default is “None”, implying that the full
resolution image will be returned.
Quality layers
A droplist giving the maximum number of quality layers
which will be returned in the result. Each layer contains the
information required to represent the image at a higher quality,
given the information from all the previous layers. A value of
“All”, the default, implies that all layers should be returned.
Table 6-9: JPEG2000 File Reader Properties
iTool User’s Guide
File Readers
102
Chapter 6: Property Sheets and Browsers
Macintosh PICT
The Macintosh PICT File Reader properties are:
Property
None
Control Type: Values
The Macintosh PICT File Reader has no configurable
properties other than Name and Description.
Table 6-10: Macintosh PICT File Reader Properties
Portable Network Graphics
The Portable Network Graphics File Reader properties are:
Property
None
Control Type: Values
The Portable Network Graphics File Reader has no
configurable properties other than Name and Description.
Table 6-11: Portable Network Graphics File Reader Properties
File Readers
iTool User’s Guide
Chapter 6: Property Sheets and Browsers
103
Tag Image File Format
The Tag Image File Format File Reader properties are:
Property
Control Type: Values
Image index
Number: Level at which to begin image index. Edit the
number to change the value. Default = 0
Image Stacking
String List: Image stacking method. Select a method from the
list. Choose between these values:
• +X
• -X
• +Y
• -Y
• +Z
• -Z
Default = Read Single Image
Table 6-12: Tag Image File Format File Reader Properties
Windows Bitmap
The Windows Bitmap File Reader properties are:
Property
None
Control Type: Values
The Windows Bitmap File Reader has no configurable
properties other than Name and Description.
Table 6-13: Windows Bitmap File Reader Properties
iTool User’s Guide
File Readers
104
Chapter 6: Property Sheets and Browsers
Windows Waveform Audio Stream
The Windows Waveform Audio Stream File Reader properties are:
Property
None
Control Type: Values
The Windows Waveform Audio Stream File Reader has no
configurable properties other than Name and Description.
Table 6-14: Windows Waveform Audio Stream File Reader Properties
File Readers
iTool User’s Guide
Chapter 6: Property Sheets and Browsers
105
File Writers
Select this folder to edit file write preferences and properties. Available file writer
types and their editable properties are shown in the following tables. For more
information on writing data of various types, see Chapter 2, “Importing and
Exporting Data”.
ASCII text
The ASCII text File Writer properties are:
Property
Separator
Control Type: Values
Enter a value.
Default = None
Use default
format
Boolean: Use default format? Choose True or False.
Format string
Number: Enter a number to change the value.
Default = True
Default = G9.2
Table 6-15: ASCII Text File Writer Properties
Binary data
The Binary data File Writer properties are:
Property
Byte ordering
Control Type: Values
String List: Byte ordering type. Select from the list. Choose
between these values:
• Native
• Little endian
• Big endian
Default = Native
Table 6-16: Binary Data File Writer Properties
iTool User’s Guide
File Writers
106
Chapter 6: Property Sheets and Browsers
Encapsulated Postscript
The Encapsulated Postscript File Writer properties are:
Property
Control Type: Values
Graphics format
Bitmap or Vector: Render graphics using bitmap or vector
output
Note - Only a Window or View can be exported to EPS.
Color model
RGB or CMYK
ISOLatin1
Boolean: Use ISOLatin1 encoding for fonts that support this
encoding? (ISOLatin1 encoding allows access to many
commonly-used foreign characters.) Choose True or False.
Default = True
Table 6-17: Encapsulated Postscript File Writer Properties
Graphics Interchange Format
The Graphics Interchange Format (GIF) File Writer properties are:
Property
None
Control Type: Values
The Graphics Interchange Format File Writer has no
configurable properties other than Name and Description.
Table 6-18: GIF File Writer Properties
iTools State
The iTools State File Writer properties are:
Property
None
Control Type: Values
The iTool State File Writer has no configurable properties
other than Name and Description.
Table 6-19: iTools State File Writer Properties
File Writers
iTool User’s Guide
Chapter 6: Property Sheets and Browsers
107
Joint Photographic Experts Group
The Joint Photographic Experts Group File Writer properties are:
Property
Color
Control Type: Values
String List: Select a depth from the list. Choose between these
values:
• TrueColor
• Grayscale
Default = TrueColor
Quality
Number: Factor from 0 - 100 determining the level of quality.
Move slider to change the level.
Default = 75
Table 6-20: Joint Photographic Experts Group File Writer Properties
JPEG2000
The JPEG2000 File Writer properties are:
Property
Control Type: Values
Reversible
Boolean: Use reversible (lossless) compression.
Wavelet levels
Number: The number of wavelet decomposition levels, or
stages, in the range of 0...15. Higher values take longer to
store and read, but may give better compression. The default is
5.
Quality layers
Number: A positive integer specifying the number of quality
layers. Each layer contains the information required to
represent the image at a higher quality, given the information
from all the previous layers. A larger number of layers takes
longer to encode and produces a larger file, but provides more
flexibility when decoding.
Table 6-21: JPEG2000 File Writer Properties
iTool User’s Guide
File Writers
108
Chapter 6: Property Sheets and Browsers
Macintosh PICT
The Macintosh PICT File Writer properties are:
Property
None
Control Type: Values
The Macintosh PICT File Writer has no configurable
properties other than Name and Description.
Table 6-22: Macintosh PICT File Writer Properties
Portable Network Graphics
The Portable Network Graphics File Writer properties are:
Property
Bit depth
Control Type: Values
String List: Bit depth in bits. Select a depth from the list.
Choose between these values:
• Automatic
• 8 bit
• 24 bit
Default = Automatic
Table 6-23: Portable Network Graphics File Writer Properties
File Writers
iTool User’s Guide
Chapter 6: Property Sheets and Browsers
109
Tag Image File Format
The Tag Image File Format File Writer properties are:
Property
Bit depth
Control Type: Values
String List: Bit depth in bits. Select a depth from the list.
Choose between these values:
• Automatic
• 8 bit
• 24 bit
Default = Automatic
Compression
String List: Compression type. Select a type from the list.
Choose between these values:
• None
• Packbits
• JPEG
Default = None
Table 6-24: Tag Image File Format File Writer Properties
Windows Bitmap
The Windows Bitmap File Writer properties are:
Property
Bit depth
Control Type: Values
String List: Bit depth in bits. Select a depth from the list.
Choose between these values:
• Automatic
• 8 bit
• 24 bit
Default = Automatic
Table 6-25: Windows Bitmap File Writer Properties
iTool User’s Guide
File Writers
110
Chapter 6: Property Sheets and Browsers
Windows Enhanced Metafile
The Windows Enhanced Metafile File Writer properties are:
Property
Graphics format
Control Type: Values
Bitmap or Vector: Render graphics using bitmap or vector
output
Note - Only a Window or View can be exported to EMF.
Table 6-26: Windows Enhanced Metafile File Writer Properties
File Writers
iTool User’s Guide
Chapter 7
Common Operations
This chapter describes the following common tasks that can be performed with all of the IDL
Intelligent Tools:
Introduction . . . . . . . . . . . . . . . . . . . . . . . .
File Operations . . . . . . . . . . . . . . . . . . . . .
Rotation . . . . . . . . . . . . . . . . . . . . . . . . . . .
Transformations . . . . . . . . . . . . . . . . . . . . .
Filtering . . . . . . . . . . . . . . . . . . . . . . . . . . .
iTool User’s Guide
112
113
115
119
122
Morphing . . . . . . . . . . . . . . . . . . . . . . . . .
Additional Operations . . . . . . . . . . . . . . .
Rendering Translucent Objects . . . . . . . .
Operations on Regions of Interest . . . . . .
Printing . . . . . . . . . . . . . . . . . . . . . . . . . . .
127
128
132
133
134
111
112
Chapter 7: Common Operations
Introduction
The Standard IDL iTools supplied in the IDL distribution (iPlot, iSurface, iImage,
iContour, iVolume, iMap, and iVector) each have many common operations. This
chapter discusses the use of these common operations.
Note
This chapter describes only the Standard IDL iTools, those iTools supplied in the
IDL distribution. Other iTools written by users and third-party developers share a
common interface with the ITT Visual Information Solutions iTools because the
iTools framework is used to create all iTools. However, the specific functionality of
such iTools may be different from the functionality of the iTools described here.
Introduction
iTool User’s Guide
Chapter 7: Common Operations
113
File Operations
File operations are provided in the iTools to allow you to open files, save files, import
variables and files, export variables, or export the contents of the iTool window as an
image file.
Opening Files
Data files, text files, and previously saved iTools State (*.isv) files can be opened
with File → Open. For more information on opening files, see “Using File Open” on
page 32.
Importing Variables and Files
IDL variables and files can be imported into the current iTool with File → Import.
The IDL Data Import Wizard offers you the choice of importing a variable or a file,
and then asks you to identify the location of the data source and the type of
visualization to be created with the data.
Import a Variable
The Data Import Wizard can import an IDL variable created at the IDL command
line or exported from an iTool session into the current iTool. For more information on
importing variables, see “Importing Data from the IDL Session” on page 41.
Import a File
The Data Import Wizard can import text files, data files, or image files into the
current iTool. For more information on importing files, see “Importing ASCII Data”
on page 34, “Importing Binary Data” on page 35, or “Importing Image Data” on
page 34.
Saving Files
The current state of the iTool can be saved as an iTools State (*.isv) file. Whenever
you close an iTool window, you will be prompted to save the current state as an
*.isv file so that you can return to the current state of the data later when you open
the *.isv file. Other IDL users running IDL 7.0 for Windows, UNIX or Mac OS X
can open *.isv files.
iTool User’s Guide
File Operations
114
Chapter 7: Common Operations
Save
File → Save saves the state of the current iTool to a file. If the file has already been
saved, it will be saved under the same filename it was previously saved under. If the
state has not been previously saved and has no filename, enter a filename. The saved
file can be opened by IDL on either the Windows or the UNIX platform.
Save As...
File → Save As also saves the state of the current iTool to a file, but it prompts you to
enter a filename even if the file has been saved previously. Use Save As to save an
existing iTools State file under a different name.
Exporting Variables and Files
Data items created within the current iTool can be exported as IDL Variables, and the
contents of the current iTool window can be exported as an image file. Select
File → Export, and follow the instructions in the IDL Data Export Wizard.
Export as a Variable
Data from the currently selected object can be exported as a variable from the IDL
Data Export Wizard to the main IDL program.
For more information, see “Exporting Data to the IDL Session” on page 48.
Export as a File
The contents of the current window can be exported from the IDL Data Export
Wizard as an image file.
For more information, see “Exporting Data to a File” on page 45.
Exiting the iTool
Clicking the Close button on the iTool window will close the selected window.
File → Exit also closes the iTool window. You will be prompted to save any changes
to the current state (see File → Save above for details). All visualizations and views
within the window are removed from memory.
File Operations
iTool User’s Guide
Chapter 7: Common Operations
115
Rotation
The iTools provide a number of ways to rotate graphical objects. Objects that are 3-D
can be rotated freely or along an axis using the mouse. In addition, both 2-D and 3-D
objects can be rotated left or right in 90-degree increments, or they can be rotated by
a specified number of degrees. These tools rotate the entire data space.
Note
Special consideration should be given when attempting to rotate a graphic image
object within iImage. See for more details.
Mouse Rotation
To rotate a 3-D object with the mouse:
1. Select the object in the iTool window.
2. Click Rotate
on the toolbar to enter Rotate mode. The rotation sphere,
consisting of circular x-, y-, and z-dimension axes, is displayed around the
object, as illustrated in Figure 7-1 and Figure 7-2:
iTool User’s Guide
Rotation
116
Chapter 7: Common Operations
3. 3-D objects can be constrained to rotate only along one of the three displayed
axes, or they can be rotated freely.
•
To rotate an object along an axis, position the mouse pointer on the axis.
The constrained rotation pointer is displayed. Drag in the desired
direction to rotate the object along the selected axis.
Figure 7-1: Rotating a 3-D Object
•
Rotation
To rotate an object freely, position the mouse pointer anywhere on the
object.The free rotation pointer is displayed. Drag in any direction to
rotate the object in that direction.
iTool User’s Guide
Chapter 7: Common Operations
117
Figure 7-2: Free Rotation
4. Click
or select Edit → Undo to undo the rotation, or click
rotate mode.
to leave
Rotate Left and Rotate Right
To rotate a selected 2-D or 3-D object 90° left or right, select
Operations → Rotate → Rotate Left or Operations → Rotate → Rotate Right.
Note
For three-dimensional objects, the rotation is about the Z axis.
iTool User’s Guide
Rotation
118
Chapter 7: Common Operations
Rotate by Specified Angle
To rotate a selected 2-D or 3-D object a specific number of degrees, select
Operations → Rotate → Rotate by Angle, specify the number of degrees in the
Rotate Angle dialog, and click OK.
Figure 7-3: Rotate Angle Dialog
Note
For two-dimensional objects (such as plots, images, annotations, contours, and so
on) the angle is absolute. The rotation angle is remembered and displayed in the
Rotate By Angle dialog. So for example, you can set the angle to zero degrees to
make your visualization angle rotate back to zero. For 3D visualizations, Rotate by
Angle is relative and does not remember the current rotation angle.
Rotation
iTool User’s Guide
Chapter 7: Common Operations
119
Transformations
Three types of transforms are common to all iTools: Resample, Rotate Data, and
Scale Data.
Resample
The Resample transform resamples the selected data. Resampling operation
properties include factors for each dimension of the data, as well as the interpolation
method to be used.
Figure 7-4: Resample Dialog
For example, if the X, Y, or Z value of a visualization needs to be different from the
original data value, you can resample the data to adjust the X, Y, or Z value by the
specified resample factor. Or, if the default interpolation method produces
undesirable artifacts in the visualization of the data, you can resample the data with a
different interpolation method.
To resample data:
1. Select one or more objects in the iTool window for resampling.
2. Select Operation → Transform → Resample.
3. Use the property sheet that appears to specify the resampling factor in each
dimension, along with the interpolation method. See “Resample Properties” on
page 406 for details.
4. Click OK to resample the data, or Cancel to abort the operation.
iTool User’s Guide
Transformations
120
Chapter 7: Common Operations
Note
For more information on the iTool’s Operations Browser, see Appendix C,
“Operations Properties”.
Rotate Data
The Rotate Data transform makes it possible to rotate the data within the
visualization by a specified number of degrees without affecting the rest of the data
space (graphical objects and axes).
To rotate data:
1. Select the visualization.
2. Select Operation → Transform → Rotate Data. The Rotate Data dialog is
displayed.
Figure 7-5: Rotate Data Dialog
Transformations
iTool User’s Guide
Chapter 7: Common Operations
121
3. Specify the number of degrees to rotate by clicking the up-down control, or by
editing the text.
4. Click OK.
Scale Data
The Scale Data transform makes it possible to scale the data within an object by a
specified scale factor.
To scale data:
1. Select one or more objects which contain the data to be scaled.
2. Select Operations → Scale Data. The Scale Data dialog appears.
Figure 7-6: Scale Data Dialog
3. Change the scale factor, if necessary, by editing the number in the Scale Factor
field, and click OK to scale the selected object(s) or Cancel to close the Scale
Data dialog without scaling the object(s).
iTool User’s Guide
Transformations
122
Chapter 7: Common Operations
Filtering
Four types of filters are common to all iTools: Smooth filtering, Median Filtering,
Convolution, and Unsharp Masking.
Smooth Filter
To remove unwanted noise from data, apply the Smooth filter to the data.
To apply the Smooth filter:
1. Select the data that you want to smooth.
2. Select Operations → Filter → Smooth.
3. The smooth filter editor appears (as shown in the following figure) and desired
settings can be edited.
Figure 7-7: The Smooth Filter Editor
4. Click OK and the filter is applied.
Filtering
iTool User’s Guide
Chapter 7: Common Operations
123
Median Filter
Median smoothing replaces each point with the median (a value in an ordered set of
values with an equal number of values above and below it) of the one- or twodimensional neighborhood of a given width. It is similar to smoothing with a boxcar
or average filter, but does not blur edges larger than the neighborhood. Median
filtering is effective in removing “salt and pepper” noise (isolated high or low
values).
To apply the Median filter:
1. Select the data that you want to smooth.
2. Select Operations → Filter → Median.
3. The median filter editor appears (as shown in the following figure) and desired
settings can be edited.
Figure 7-8: The Median Filter Editor
4. Click OK and the filter is applied.
iTool User’s Guide
Filtering
124
Chapter 7: Common Operations
Convolution Filter
To convolve data:
1. Select the data to be convolved.
2. Select Operations → Filter → Convolution. The Convolution Kernel
Editor dialog is displayed.
Figure 7-9: Convolution Kernel Editor
The dialog displays an image preview for two-dimensional data only. The
View 1D slice option is always disabled when you use the editor with existing
data. You have access to the option when you open the editor through the
Operations Browser (see “Convolution Properties” on page 398).
Filtering
iTool User’s Guide
Chapter 7: Common Operations
125
3. Change Convolution Kernel Editor settings as necessary by modifying any
of the following items in the property sheet:
•
Filter — select a filter type from the list. The default filter is Tent.
•
Number of Columns (Rows) — edit if necessary.
•
Center — position is centered by default. Select False to turn centering
off.
•
Auto normalize — scaling is automatic by default. To use a different
scale factor, select False and enter a value in the Scale factor property
field. You can also set Bias offset to add an offset that will be added to the
results after Scale factor.
•
Edge values — edges wrap around by default. To choose a different edge
format, select Zero result, Repeat last value, or Zero pad from the list.
•
Use invalid value — filtering missing data is off by default. To filter
missing data using an invalid value, select True and enter the value in the
Invalid value property field. You can also set Replacement value to give
IDL a value that will replace missing results.
4. Click OK to apply the filter with the current settings and close the Convolution
Kernel Editor window, or click Cancel to close the window without applying
the filter.
Unsharp Mask Filter
An unsharp-mask filter can be applied to any two-dimensional array or a TrueColor
image. The unsharp mask enhances the contrast between neighboring pixels in an
image, and is widely used for astronomical images and for digital photographs.
To apply the Unsharp Mask filter:
1. Select the data that you want to unsharp mask.
2. Select Operations → Filter → Unsharp Mask.
3. The unsharp mask filter editor appears (as shown in the following figure) and
desired settings can be edited.
iTool User’s Guide
Filtering
126
Chapter 7: Common Operations
Figure 7-10: The Unsharp Mask Filter Editor
4. Click OK and the filter is applied.
Filtering
iTool User’s Guide
Chapter 7: Common Operations
127
Morphing
Mathematical morphology is a method of processing digital images on the basis of
shape. Morphing is available when working with images, surfaces, and contours. Six
morphing options are available for use in iTools: dilate, erode, morph open, morph
close, morph gradient, and morph tophat.
Morphing
Option
Description
Dilate
Dilate is commonly known as “fill”, “expand”, or “grow.” It
can be used to fill “holes” of a size equal to or smaller than the
structuring element.
Erode
Erode does to the background what dilation does to the
foreground. Given an image and a structuring element, erode
can be used to remove islands smaller than the structuring
element.
Morph open
Morph open is simply an erosion operation followed by a
dilation operation. Applying morph open more than once
produces no further effect.
Morph close
Morph close is simply a dilation operation followed by an
erosion operation. Applying morph close more than once
produces no further effect.
Morph gradient
Morph gradient is the subtraction of an eroded version of the
original image from a dilated version of the original image.
Morph tophat
Morph tophat is implemented by first applying the opening
operator to the original image, then subtracting the result from
the original image. Applying tophat shows the bright peaks
within the image.
Table 7-1: Morph Menu Options
To apply a morphology option:
1. Select the object to be morphed.
2. Select Operations → Morph → <option>.
iTool User’s Guide
Morphing
128
Chapter 7: Common Operations
Additional Operations
The Histogram, Statistics, and Console tools display additional information about
data displayed in the iTool windows, and about operations performed with the iTools.
Plotting a Histogram
Histogram displays a histogram plot of the data currently selected in the iTool
window. The Histogram plot appears in a separate iPlot window.
Figure 7-11: Histogram Plot
To display a histogram plot:
1. Select an object or group of objects in the iTool window.
2. Select Operations → Histogram.
Additional Operations
iTool User’s Guide
Chapter 7: Common Operations
129
Displaying Statistics
The Statistics dialog displays all available statistical information pertaining to the
object or objects currently selected in the iTool window.
To display the Statistics dialog:
1. Select an object or a group of objects in the iTools window.
2. Select Operations → Statistics. The Statistics window is displayed.
Figure 7-12: The iTools Statistics Window
iTool User’s Guide
Additional Operations
130
Chapter 7: Common Operations
The information displayed in the Statistics window varies depending upon the type of
objects selected.
•
For scalars, the name of the variable and its value are displayed in the Statistics
window.
•
For arrays, the following information is displayed:
•
Name
•
Maximum and location
•
Dimensions
•
Standard deviation
•
Mean
•
Variance
•
Absolute deviation
•
Total
•
Skewness
•
Minimum & location
•
Kurtosis - 3
The information in the Statistics window can be edited (by selecting Edit), printed, or
saved as a file.
•
On Windows platforms, the standard Windows editing context menu
containing Cut, Copy, Paste and Delete commands can be displayed by rightclicking anywhere in the Statistics window.
•
On UNIX platforms, use the left or right mouse buttons to cut, copy or paste.
To save the text as an ASCII file:
1. Select File → Save As.
2. Enter a filename. If the filename already exists, you will be asked if you want
to replace the file.
3. Select Cancel to return to the Statistics window without saving the file.
To print the text, select File → Print. The standard Windows or Motif printer dialog
is displayed.
To close the Statistics window, select File → Close.
Additional Operations
iTool User’s Guide
Chapter 7: Common Operations
131
Resetting Dataspace Ranges
You can reset the ranges of your data space to accommodate all your contained
visualizations. When you reset your ranges, the following properties of the data space
are reset to a value of True:
•
Automatic X range updates
•
Automatic Y range updates
•
Automatic Z range updates
To reset the ranges of your data space, select Window → Reset Dataspace Range.
iTool User’s Guide
Resetting Dataspace Ranges
132
Chapter 7: Common Operations
Rendering Translucent Objects
Within iTools, you can set the transparency of an object to make it appear totally
opaque, transparent, or translucent. Isosurface objects are just such a case. Text
objects can also be made partially transparent so that you can see through the labels
on a complex plot and still see both the labels and the data. In the majority of
scenarios where you will utilize opaque data objects and translucent text labeling, this
translucent rendering works very well.
It is important to know, however, that translucent rendering does not always work
well in more complex situations. This is because translucent objects must be strictly
rendered from the back (far from the viewer) towards the front (closer to the viewer).
IDL accomplishes translucent rendering by blending the pixels already drawn on the
device with the pixels that are drawn to represent a translucent object. Therefore, it is
important that the objects that are positioned behind the translucent object be
rendered before the translucent object. If the ordering is not correct, then you will not
be able to see the objects behind the translucent object.
For most cases in iTools, ordering is not a problem. If you encounter it as a problem,
the Bring to Front (and related) operation can help you improve the appearance of
your translucent objects. In some cases, however, the ordering is not easily
accomplished. For example, a complex isosurface rendered as a translucent object
does not always appear correct from all angles.
An isosurface is composed of a large number of triangles stored in an IDLgrPolygon
object. The triangles are always drawn in the same order, the order in which they are
stored in the object. Thus, as the viewing angle changes, the apparent back-to-front
ordering of the triangles also changes. In some cases, the triangles closest to the
viewer draw first and end up blocking the view of other triangles drawn later and
behind them that should be visible through the translucent triangles drawn first.
For all these reasons, transparency should be used with care in dealing with objects
like a complex isosurface. The rendering of these objects ultimately may not appear
correct.
Note
For more detailed information on alpha channel support in IDL Object Graphics,
see “Controlling Object Transparency” (Chapter 2, Object Programming).
Rendering Translucent Objects
iTool User’s Guide
Chapter 7: Common Operations
133
Operations on Regions of Interest
A region of interest (or ROI) is an area that contains data you wish to identify. An
ROI can be drawn anywhere within your image and can be selected from rectangular,
elliptical, polygonal, and freehand region of interest buttons on the iImage Image
Panel. You can also apply operations to image data contained within an ROI area.
Some operations applied to ROIs affect the ROI data while others affect the ROI
vertices.
Operations Modifying ROI Data
If the operation acts on the pixel values of the underlying data, the pixels that are
contained within the ROI are changed as a result of the operation. Pixel values
outside of the ROI area remain unchanged but pixel values within the ROI are set to
correspond with the pixel result of the chosen operation.
Examples of operations acting upon the ROI data are:
•
Filter operations including Convolution, Median, Smooth, Roberts, and Sobel
•
Morphological operations
•
Transform operations including scaling and inverting data
Operations Modifying ROI Vertices
If the operation acts on the vertices of the ROI itself, the vertices are changed as a
result of the operation. If the entire image is selected for an operation, the ROI will
follow the behavior of the entire image as the operation acts upon it. If only the ROI
is selected, then only the ROI will respond to the operation.
Examples of operations acting upon the ROI vertices are:
•
Rotate right, left, or by a specified angle
•
Flip horizontal or vertical
•
Region grow
iTool User’s Guide
Operations on Regions of Interest
134
Chapter 7: Common Operations
Printing
File → Print sends the current view of the contents of the graphics window to the
specified printer via the standard Windows or Motif printer dialog. If the contents
have been modified in the current view, they will appear modified in the printer
output.
To print the contents of the graphics window:
1. Select File → Print. The standard Windows or Motif printer dialog appears.
2. Select the desired printer and printer properties from the printer dialog.
3. Click Print. The current view of the contents of the graphics window is sent to
the chosen printer, with the chosen options.
Print Preview
The Print Preview dialog in iTools allows you to view and manipulate your iTool
window content before sending it to the printer.
To open the Print Preview dialog, select File → Print Preview...
You can reposition your content in the Print Preview window by clicking it and
dragging it to a new location. If you move your content in such a way that part of it is
no longer visible in the Print Preview dialog, this same part will not be shown when
printed.
Note
If your Print Preview dialog shows the red border, it will not appear on paper when
printed.
You can resize your content by clicking and dragging the small black rectangle at the
upper right corner of the window area. The aspect ratio of the content cannot be
changed. If Center is unchecked then the content will be resized while keeping the
location of the lower left corner static. If Center is checked then resizing will take
place while keeping the content centered.
Printing
iTool User’s Guide
Chapter 7: Common Operations
135
The Print Preview dialog and its functions are shown here:
Figure 7-13: The Print Preview Dialog
iTool User’s Guide
Printing
136
Chapter 7: Common Operations
Component
Function
X Margin
Sets the left margin to your desired value. Values can be
manually entered.
Y Margin
Sets the bottom margin to your desired value. Values can be
manually entered.
Width
Select your desired printout width. Values can be manually
entered. Only positive values are accepted. The aspect ratio of
the content is kept constant so a change in width will also
change the height.
Height
Select your desired printout height. Values can be manually
entered. Only positive values are accepted. The aspect ratio of
the content is kept constant so a change in height will also
change the width.
Units
Set width and height units in inches or centimeters. Default is
inches.
Reset
Resets all settings to the original value when the Print
Preview dialog was first opened. The margins, units, center,
and border settings will be reset to defaults and the size is reset
based on the size of the tool window.
Help
This invokes the IDL help for print and print preview
procedures.
Orientation
Select Portrait or Landscape. Changing the orientation will
reset the X and Y margins and the width and height, unless the
Center check box is checked, in which case the width and
height will be reset but the image will remain centered.
Default is Portrait.
Center
Click to center your content on the page. When center is
checked the X and Y margin text boxes are no longer available
and the ability to drag the image with the mouse is removed.
Default is off.
Table 7-2: Print Preview Functions
Printing
iTool User’s Guide
Chapter 7: Common Operations
Component
137
Function
Border
Click to show or hide the content border as a red outline. The
border does not print and is included only to indicate the
boundary of the contents. The border setting is not saved.
Default is on.
Setup
Select to edit printer information. If the Print button is pressed
while in the setup dialog, the contents of the Print Preview
dialog will be printed and the dialog will be dismissed.
Print
Prints the contents of the Print Preview dialog to the currently
selected printer and closes the dialog.
Close
Closes the Print Preview dialog and saves the current settings
without printing.
Table 7-2: Print Preview Functions
iTool User’s Guide
Printing
138
Printing
Chapter 7: Common Operations
iTool User’s Guide
Chapter 8
Working with Macros
This chapter describes how to use the iTool macros.
Introduction . . . . . . . . . . . . . . . . . . . . . . . .
What Are Macros? . . . . . . . . . . . . . . . . . . .
Recording Macros . . . . . . . . . . . . . . . . . . .
Running Macros . . . . . . . . . . . . . . . . . . . .
iTool User’s Guide
140
141
143
146
Using the Macro Editor . . . . . . . . . . . . . .
Understanding Items in the Macro Editor
Making Selection and Tool Changes . . . .
Importing and Exporting Macros . . . . . . .
153
164
179
186
139
140
Chapter 8: Working with Macros
Introduction
The macros in IDL iTools provide a shortcut mechanism that lets you quickly and
automatically repeat a sequence of operations. You can record a series of actions in
one iTool or several iTools, save the series as a macro, and then apply it to a new set
of data to save you from having to repeat the actions manually.
This chapter discusses the following areas:
Introduction
•
More information about macros (see “What Are Macros?” on page 141)
•
Recording macros (see “Recording Macros” on page 143)
•
Running macros (see “Running Macros” on page 146)
•
Editing macros (see “Using the Macro Editor” on page 153)
•
Making selection and tool changes within a macro (see “Making Selection and
Tool Changes” on page 179)
•
Importing and exporting macros (see “Importing and Exporting Macros” on
page 186)
iTool User’s Guide
Chapter 8: Working with Macros
141
What Are Macros?
In the context of the iTools, a macro is a collection of operations and property values
that can be applied to an existing visualization or visualizations. There are two kinds
of macros, depending on what you have selected when you start recording. For more
information, see “Macro Type Based on Recording Selection” on page 179.
Macros are not linked to the objects or visualizations to which they are applied. When
you run a macro, the operations or property settings apply to the objects currently
selected. (The macro system does include functionality to change selections and tools
during the execution of a macro. For more information, see “Making Selection and
Tool Changes” on page 179.) This means that property settings can be applied to
multiple visualization types, unlike property settings in styles.
Note
Property settings in macros apply to the selection, but are not tied to visualization
type, whereas in styles they are tied to visualization type and might or might not
apply to selection.
The following figure shows part of the display of the Macro Editor, covered in detail
in “Using the Macro Editor” on page 153:
Figure 8-1: A Macro in the iTools Macro Editor
This figure shows an example macro called New Macro, composed of several
operations and property settings. Operations in this macro change the selection and
iTool User’s Guide
What Are Macros?
142
Chapter 8: Working with Macros
apply the smooth operation. Property settings change the color and minor ticks
properties.
Macro information is stored in one or more macro files located on your system.
Macros are stored in IDL SAVE files. Macros are stored in a subdirectory of the
user’s .idl directory. When you create a new macro within an iTool, it will
automatically be saved in the specified location.
Note
Macro information is never stored along with an iTool.
What Are Macros?
iTool User’s Guide
Chapter 8: Working with Macros
143
Recording Macros
You can create macros in two ways:
•
Using the recording functionality in the iTools Operations → Macros menu,
described in this section
•
Using the Macro Editor, described in “Using the Macro Editor” on page 153
To record a macro:
1. Start an iTool.
2. Select Operations → Macros → Start Recording.
3. If the Start Recording dialog appears (as it does if the Show dialog property
is True), select whether to record manipulator steps and press OK, which puts
the iTools system into recording mode.
Figure 8-2: The Start Recording Dialog
Note
For more information on recording manipulator steps, see “Capturing
Intermediate Manipulations” on page 144.
4. Select operations or set properties as desired to create the macro.
5. Select Operations → Macros → Stop Recording to complete the recording.
iTool User’s Guide
Recording Macros
144
Chapter 8: Working with Macros
Putting the iTools system into recording mode creates a new macro folder in the
macro registry, using a unique name based on ‘New Macro’ (as shown in the macro
tree; see “The Macro Tree” on page 156). If the New Macro folder already exists,
then the new name is New Macro (1) and so on until the system finds a uniquely
numbered name. You can change the macro’s name when macro recording finishes.
At the end of recording, IDL saves the completed macro, and the Macro Editor opens.
Note that using the Stop Recording menu command is the only way to stop
recording without exiting the iTools system. Changing tools or closing the tool does
not stop recording, and a recording started in one iTool will continue to other iTools.
You can select the Stop Recording command in any active iTool.
Note
What you select in the iTools system before starting recording dictates what
happens when you run the completed macro. For more information, see “Macro
Type Based on Recording Selection” on page 179.
Capturing Intermediate Manipulations
A manipulation such as Translate typically consists of a series of transformations
based on the screen position of the mouse. They start with a mouse-down operation
and end with a mouse-up operation, but each mouse motion while the mouse button is
down generates a transformation. Typically, when a manipulation such as Translate
or Rotate is recorded, a single macro item is created that contains the overall
translation from mouse-down to mouse-up. This applies to the history item that is
created whether recording or not. When this macro item is processed during macro
playback, the complete transformation is applied, but the individual transformations
based on the individual mouse motions are not available.
A different mode of recording has been added which allows a recording of a
manipulation to save the individual steps based on each mouse movement. This is
useful if the purpose of the macro is to demonstrate the transformation such as a
smooth 3D rotation of a surface. This new mode records each step of the
manipulation while the mouse is down, based on the original motion events from the
operating system.
A new property, Record manipulator steps, has been added to the Start Recording
operation. This Boolean property lets you specify whether to record the individual
Recording Macros
iTool User’s Guide
Chapter 8: Working with Macros
145
movements of a manipulation. The default value is False, meaning that the macro
recording captures only the overall transformation rather than individual steps.
This property applies to the following manipulators when they are used within a
recording:
•
Rotate
•
Translate (includes Image Plane translation)
•
Scale
•
View Pan
•
View Zoom
While they are distinctly different properties, the value of Record manipulator steps
is used to set the default value for the Display intermediate steps property of the
macro itself. If Record manipulator steps is set to True when starting a recording, it
is most likely that the user wants to see the intermediate steps during playback, so
Display intermediate steps is set to True to provide that display.
Note that this property applies only to the macro item generated during recording.
The history item generated for a transformation always consists of the single overall
transformation, regardless of the setting of Record manipulator steps if recording as
well as if not recording.
There are a number of other manipulators that are not affected by the Record
manipulator steps property. For these manipulators, their primary purpose is to
specify an overall movement with the mouse to specify how a succeeding operation
will be applied. Therefore, an overall movement is always used to create a single
macro item. These other manipulators are the following:
•
Crop Box
•
Range Box
•
Range Pan
•
Range Zoom
•
Line Profile
•
Surface Contour
iTool User’s Guide
Recording Macros
146
Chapter 8: Working with Macros
Running Macros
When you run a macro, its operations apply to the item or items selected in the active
iTool.
Note
For more information on a macro’s application to the current selection, see “Macro
Type Based on Recording Selection” on page 179.
To run a macro, do one of the following:
•
From an iTool window, select Operations → Macros → Run Macro
•
From the Macro Editor, select the macro to run and then select Run → Run
Macro
•
At the IDL command line, use the MACRO_NAMES keyword with an iTool
command
Macro items are processed sequentially, each item either applying an operation or
applying property values. Macros can contain operations that change the selection so
that subsequent operations or property settings apply to different visualization objects
in one or more iTools. For more information, see “Making Selection and Tool
Changes” on page 179.
While the macro is running, you have access to the Macro Controls dialog, which
lets you pause, step, and stop the macro. You can also hide or show intermediate
steps in the macro, set the step delay, and hide or show the macro items. For more
information, see “Using the Macro Controls Dialog” on page 149.
After running a macro, you can use the Undo/Redo operation, which treats the
actions performed by a macro as a single event. This means that if you run a macro
and then select Undo, all of the operations and properties changed by the macro
revert to their pre-macro values.
Running Macros
iTool User’s Guide
Chapter 8: Working with Macros
147
Running from the Operations Menu
You can run a macro by selecting Operations → Macros → Run Macros from any
open iTool. This selection opens the Run Macro dialog, as shown in Figure 8-3.
Figure 8-3: The Run Macro Dialog
This dialog lets you select the macro to run. The macro names are obtained from all
saved macros. Macros that have been created in the macro editor, but not saved are
not available. By default, the first item in the list is selected, and the description of
that first macro appears in the Macro Description field. After you select a macro
name from the list, the Macro Description field is updated with the description of the
selected macro.
The Display intermediate steps option is set based on the value of the macro
property of the same name. Set it to display each step of the macro as it runs, or clear
it to prevent any updates of the display until the macro is complete. The Step delay
field displays the number of seconds IDL delays between each step of the macro. You
can change the delay by entering a floating-point value in the field. The minimum
delay is 0.0 seconds; the maximum delay is 60.0 seconds. IDL truncates the delay
value to fall within that range after you click OK.
The values of both of these properties are retrieved from the specified macro when
you select it in the list. Changes made to these properties with this dialog affect the
iTool User’s Guide
Running Macros
148
Chapter 8: Working with Macros
succeeding invocation of the macro specified, but are not applied to the macro itself.
This lets the macro properties maintain default values while the settings of the dialog
can be modified for a single invocation. To make a permanent change to these
properties, edit them in the Macro Editor and save your changes. For more
information on these properties, see “The Macro Property Sheet” on page 156.
To run a macro from this dialog, either:
•
Double-click its name in the list
•
Select its name in the list and click OK
Running from the Macro Editor
You can run macros from within the Macro Editor by doing the following:
1. In the macro-tree panel (top left), select the macro to run.
2. Select Run → Run Macro.
The macro runs on the selected visualization or visualizations in the active iTool.
For more information, see “Using the Macro Editor” on page 153.
Running from the Command Line
You can also apply macros in a non-interactive situation by running them from the
IDL command line.
The iTools routines (such as IPLOT) have a MACRO_NAMES keyword that you can
set when calling them. For example, you can enter the following at the command line,
if you have a macro named ‘plotmacro’ already defined:
IPLOT, RANDOMU(1, 20), MACRO_NAMES='plotmacro'
This command creates a simple two-dimensional plot of 20 randomly generated data
points and then applies the ‘plotmacro’ macro to it.
The keyword can take either a single string, as in the example above, or an array of
strings. In the latter case, the macro names are retrieved and run sequentially at the
conclusion of the iTool’s actions. This action follows the creation of the iTool and, if
applicable, any visualization created by the command.
Note
For more information on the MACRO_NAMES keyword, see the iTools routine
commands in the IDL Reference Guide.
Running Macros
iTool User’s Guide
Chapter 8: Working with Macros
149
Using the Macro Controls Dialog
The Macro Controls dialog is a floating dialog that, when launched, appears in the
bottom-right corner of the iTool window containing the running macro. You cannot
resize or close it, but you can move it to a different location. It appears initially in its
small or collapsed form, as shown in Figure 8-4.
Figure 8-4: The Macro Controls Dialog (Collapsed) While Running
The Macro Controls dialog lets you:
•
Pause and continue the currently running macro
•
Step through the macro one item at a time
•
Stop the macro
•
Hide or show the macro’s intermediate steps
•
Set the step delay
•
Hide or show the macro items
These actions are described in more detail below.
Continue / Pause
If the macro is running, the button label is the pause symbol. Click this button to
pause the macro. Figure 8-4 shows the Macro Controls dialog while running.
If the macro is paused, the button label is the continue symbol. Click this button to
resume macro execution. Figure 8-5 shows the Macro Controls dialog while paused.
Figure 8-5: The Macro Controls Dialog (Collapsed) While Paused
iTool User’s Guide
Running Macros
150
Chapter 8: Working with Macros
Note
Under Microsoft Windows systems, you can invoke either action by pressing F5.
Step
When a macro is paused, you can click the button with the step symbol to execute the
next macro item. When a macro is running, this button is desensitized.
Note
Under Microsoft Windows systems, you can invoke this action by pressing the right
arrow key.
The macro step delay (if nonzero) is not applied when you click the Step button. In
addition, the discrete delay from a Delay or Step Delay Change operation is not
applied. For more information, see “Delay Operation Item” on page 175 or “Step
Delay Change Operation Item” on page 176.
Stop
You can use the button with the stop symbol to stop execution of the macro. The
remaining macro items are skipped, and the Macro Controls dialog is dismissed.
You can use the Stop button while the macro is paused or running.
Hide Steps / Show Steps
If the intermediate steps of the macro are being displayed, the button label is the
closed-eye image, for Hide Steps. Click this button to turn off the display of
intermediate steps.
If the intermediate steps of the macro are not being displayed, the button label is the
open-eye image, for Show Steps. Click this button to turn on the display of
intermediate steps.
Using these controls lets you interactively toggle whether the display of the iTool
window is updated after the execution of each macro item. This ability has several
useful applications. If the list of macro items is displayed (see “Show Macro Items /
Hide Macro Items” on page 151), you can monitor what the macro is doing and
interactively turn on the display of intermediate steps for a particular part of the
macro. You can also interactively test a macro playback when planning to insert Step
Display Change operations into the macro. Inserting these operations might be useful
when a macro recording contains many intermediate steps, but the author of the
macro wants to show only a subset of the steps. For more information on this
operation, see “Step Display Change Operation Item” on page 177.
Running Macros
iTool User’s Guide
Chapter 8: Working with Macros
151
Set Step Delay
You can use the button with the hourglass symbol to set the step delay. This action
pops up a floating dialog, shown in Figure 8-6, that allows setting the step delay in
seconds. The Set Step Delay button is active while the macro is paused and while it is
running. You cannot resize the Step Delay window, but you can move and close it.
Figure 8-6: The Step Delay Window of the Macro Controls Dialog
You can set the step delay to a floating-point value by either:
•
Using the Step Delay window’s slider
•
Typing a value in the window’s field
The minimum value is 0.0 seconds, the maximum value is 60.0 seconds, and the
default step is 0.01 seconds. You can set the step delay value while the macro is
paused or running.
Modifying the step delay value does not set the macro’s step delay property. Setting
the step delay through the Macro Controls dialog applies a temporary override value
that remains in effect until the end of the macro execution, until the value is modified
again with the dialog, or until a Step Delay Change operation is encountered in the
macro items (see “Step Delay Change Operation Item” on page 176).
Show Macro Items / Hide Macro Items
If the Macro Controls dialog is collapsed, you can use the button with the down
arrow (shown in Figure 8-5) to expand the dialog and show the macro items. During
macro execution, the current macro item is selected in the tree view. When the macro
is paused, the tree view shows the macro item to be executed next when you click
either Step or Continue.
iTool User’s Guide
Running Macros
152
Chapter 8: Working with Macros
Figure 8-7: The Macro Controls Dialog (Expanded)
If the Macro Controls dialog is expanded, as shown in Figure 8-7, you can use the
button with the up arrow to collapse the dialog so that macro items are not displayed.
Running Macros
iTool User’s Guide
Chapter 8: Working with Macros
153
Using the Macro Editor
You can use the Macro Editor to modify existing macros and create new macros. The
Macro Editor is launched automatically after you record a macro interactively. You
can also launch the Macro Editor at any time by selecting Operations → Macros →
Macro Editor from any iTool.
The Macro Editor is a system-wide dialog, shared by all current iTools. Closing all
current iTools does not close the Macro Editor.
Figure 8-8: The Macro Editor
Figure 8-8 shows the Macro Editor with the History folder expanded to show the
history items that were generated while the iImage tool was open (that is, all iImage
operations, whether recorded in a macro or not). The Macros folder in the upper-right
panel shows a macro with its SetProperty item selected.
iTool User’s Guide
Using the Macro Editor
154
Chapter 8: Working with Macros
Understanding the Macro Editor
The Macro Editor consists of four panels and two sets of add/remove buttons. The
four panels consist of the two macro panels on the top and the two source panels on
the bottom. You use the add/remove buttons to move operations and settings from the
source panels to the macro panels.
The Menu Bar
The following menus appear on the Macro Editor menu bar:
•
File
•
Edit
•
Run
•
Help
You can use the Edit and Run operations in a right-click context menu on items in
the macro and source trees.
The File menu, shown in Table 8-1, contains tools for creating, importing, exporting,
and saving macros.
Menu
Selection
Function
New
Creates a new macro in the macro tree, with a name based on
‘New Macro.’ If New Macro already exists, then the new
name is New Macro (1) and so on until the system finds a
uniquely numbered name.
Import...
Imports a macro from an external file. See “Importing and
Exporting Macros” on page 186 for details.
Export...
Exports the selected macro to an external file. See “Importing
and Exporting Macros” on page 186 for details.
Save
Saves all macros to external IDL SAVE files with names based
on the macro names.
Close
Closes the Macro Editor, prompting you to save any unsaved
macro changes.
Table 8-1: The File Menu
Using the Macro Editor
iTool User’s Guide
Chapter 8: Working with Macros
155
The Edit menu, shown in Table 8-2, contains tools for editing, deleting, duplicating,
and moving items within the macro and source trees.
Menu
Selection
Function
Cut
Copies the selected item to an internal clipboard and removes
the item from the tree.
Copy
Copies the selected item to an internal clipboard.
Paste
Pastes the contents of the internal clipboard into the tree.
Delete
Deletes the selected item without making a copy. If the
selected item is a SetProperty item and the last selection was
in the macro property sheet, this action deletes selected
properties from the SetProperty item. If the last selection was
in the macro tree, the whole SetProperty item is deleted.
Duplicate
Duplicates the selected item.
Move Item Up
Moves the selected item up one position in the tree.
Move Item Down
Moves the selected item down one position in the tree.
Table 8-2: The Edit Menu
The Run menu contains only one operation: Run Macro, which runs the selected
macro. See “Running from the Macro Editor” on page 148 for details.
The Help menu opens the online help for the Macro Editor.
iTool User’s Guide
Using the Macro Editor
156
Chapter 8: Working with Macros
The Macro Tree
The macro tree (top left) contains folders for existing macros, as shown in Figure 8-9.
Macros are indicated by the gears folder icon. Macro items are indicated by their own
object icons or by the SetProperty icon.
Figure 8-9: The Macro Editor’s Macro Tree
Clicking on an item in the tree selects the item and displays its property sheet to the
right of the tree panel. Right-clicking within the tree brings up the context menu of
available actions (see “The Menu Bar” on page 154). If you right-click on a tree item,
then that item is selected.
For more information on these items, see “Macro Items” on page 164.
The Macro Property Sheet
The macro property sheet (top right) lets you set properties of macro folders and
items.
To see a macro’s properties, click on its folder in the macro tree. The macro’s
properties appear in the macro property sheet, as shown in Figure 8-10. To change
any of the properties, click on it in the sheet and make the modification you want.
Using the Macro Editor
iTool User’s Guide
Chapter 8: Working with Macros
157
Figure 8-10: The Macro Editor’s Macro Property Sheet: Macro Properties
Macros have several properties, described in Table 8-3.
Property
Value
Name
Used to select the desired macro from the Run Macro dialog
(for more information, see “Running from the Operations
Menu” on page 147). Also serves as the basis for the filename
of a saved macro.
Description
Used to describe the behavior or purpose of the macro. Its
value appears in the Run Macro dialog’s Description field
when you select a macro from the list.
Table 8-3: Macro Property Values
iTool User’s Guide
Using the Macro Editor
158
Chapter 8: Working with Macros
Property
Value
Display
Typically set to False so that the display updates only on
intermediate steps completion of the macro. Set this property to True to display
each step of the macro, which might be useful when using a
macro to animate a series of actions.
Step delay
(seconds)
Used to specify the time in seconds to delay between each step
of the macro. The default value is 0.0. The minimum value is
0.0, and the maximum value is 60.0.
Note - You can also add the Delay operation to a macro to
create a single specific delay (see “Delay Operation Item” on
page 175).
Table 8-3: Macro Property Values (Continued)
Note
If Display intermediate steps is set to False (the default value), updates to the
display are suppressed while a macro is being run. Operations that typically update
the display, such as the Volume Render operation, do not change the display if
Display intermediate steps is set to False.
Using the Macro Editor
iTool User’s Guide
Chapter 8: Working with Macros
159
To see an individual macro item’s properties, click on the item in the macro tree. The
properties appear in the macro property sheet, as shown in Figure 8-11. To change
any of the properties, click on a property in the sheet and make the modification you
want.
Figure 8-11: The Macro Editor’s Macro Property Sheet: Macro Item
You can modify any properties of a macro item except for user-defined properties,
which are not available for modification.
The Source Tree
The source tree (bottom left), as shown in Figure 8-12, contains the following items
that you can use for macro creation:
•
History items, grouped by tool (see “History Items” on page 166)
•
Visualizations (see “Visualization Items” on page 169)
•
Annotations (see “Annotation Items” on page 170)
•
Macro tool items (see “Macro Tools Items” on page 171)
•
Tool menu items (see “Tool Menus Items” on page 178)
iTool User’s Guide
Using the Macro Editor
160
Chapter 8: Working with Macros
Figure 8-12: The Macro Editor’s Source Tree
You can use these property settings and operations as a source for macro items.
Selecting one of these items displays its properties in the source property sheet next
to the tree panel. While the visualizations and annotations cannot be used directly in
macros, you can use their properties as the source for macro property settings. The
source tree also contains operations for the current tool, in the Tool Menus →
Operations subfolder, which you can use as a source for macro operations.
Clicking on an item in the tree selects the item and displays its property sheet to the
right of the tree panel. You cannot multi-select within the tree. Right-clicking within
the tree brings up the context menu of available actions (see “The Menu Bar” on
page 154). If you right-click on a tree item, then that item is selected.
Using the Macro Editor
iTool User’s Guide
Chapter 8: Working with Macros
161
The Source Property Sheet
The source property sheet (bottom right) displays the properties of items in the source
tree to its left. As described above, properties can be used as source items for macros.
Figure 8-13: The Macro Editor’s Source Property Sheet
Figure 8-13 shows the properties for the Line operation, found in the source tree’s
Annotations folder. You can multi-select properties in the sheet. Selected properties
may be moved to a macro property setting item. Although all properties in the source
property sheet are grayed out (desensitized), you can select them for creation of
SetProperty macro items (for more information, see “SetProperty Settings” on
page 165).
Note
User-defined properties are available only if they are part of a macro recording;
they will apply like any other property during playback. You cannot otherwise use a
user-defined property (moving, copying, modifying, etc.) in the macros system.
The Add and Remove Buttons
There are two sets of Add and Remove buttons, one for the source and macro trees
and one for the source and macro property sheets. Both sets have similar behavior.
iTool User’s Guide
Using the Macro Editor
162
Chapter 8: Working with Macros
The Item Add Button
The item Add button (in the left pair) copies items from the History and operations
folders up into macros. If a macro folder is selected in the macro tree then the new
item is placed at the end of existing items. If a macro item is currently selected in the
macro tree, then the new item is added to the macro folder, immediately following
the selected macro item. If the top-level Macros folder is selected, then a new macro
is created, and the item is placed within it.
With a visualization selected, the Add button adds a ‘Visualization…’ operation to
the macro. This item will make a running macro present the Insert Visualization
dialog to let you define parameters and insert a new visualization. Note that the Show
Dialog property is set to True because you must define the parameters interactively,
unlike with an Insert Visualization operation that has been recorded or copied from
history.
You can select annotations in the source tree to select their properties, but you cannot
move the annotations directly up into macros because they require initialization with
data. The exception is annotations in the History folder (for more information, see
“Annotation Items” on page 170).
The Item Remove Button
The item Remove button (in the left pair) removes the selected item or folder from
the macro tree.
The Property Add Button
The property Add button (in the right pair) moves selected properties up into a new or
existing SetProperty operation in a macro. Running a macro with a SetProperty
operation applies the property setting to the selected visualization, letting you set the
specified property on any applicable object.
Note
Once a property setting is added to a macro, it is no longer tied to a particular
visualization type.
If you add a desensitized property to a macro item, the property will be sensitized
(not grayed out) in the macro property sheet.
Using the Macro Editor
iTool User’s Guide
Chapter 8: Working with Macros
163
If you select an existing SetProperty item in the macro tree, IDL adds properties to it
instead of creating a new SetProperty item.
Figure 8-14: An Example Using the Property Add Button
Figure 8-14 shows a SetProperty macro item created by selecting the Plot
visualization in the source tree and three properties (Color, Line Style, and
Thickness) in the source property sheet. The property Add button copied the desired
property settings up into a SetProperty macro item containing all three properties.
The Property Remove Button
The property Remove button (in the right pair) removes any selected properties from
SetProperty items. It is not enabled for other types of macro items.
iTool User’s Guide
Using the Macro Editor
164
Chapter 8: Working with Macros
Understanding Items in the Macro Editor
In the Macro Editor, you work with two main groups of items: those that make up a
macro (items in the macro tree) and those that you use to create a macro (items in the
source tree).
Macro Items
Macro items are the elements that make up a macro, namely operations and property
settings. You insert them into a macro either during recording or, in the Macro Editor,
by moving them from the source tree up into the macro tree. The properties of a
selected macro item appear in the macro property sheet.
Figure 8-15: Macro Items in the Macro Editor
Figure 8-15 shows the macro items in the Sample Macro macro, both operations
(Selection Change and Smooth) and property settings (SetProperty: Color,
SetProperty: Minor ticks). The first SetProperty item is selected to show the property
value (Color) that it will set on the selected object during playback.
Operations
Operations are the actions that you want the macro to perform on the selected object
or objects, such as inserting a plot legend or applying a convolution filter. You can
modify an operation’s properties to customize it.
Some operations have the Show dialog property set to False by default when the
operation is added to a macro, either by recording or in the editor. This setting lets the
Understanding Items in the Macro Editor
iTool User’s Guide
Chapter 8: Working with Macros
165
operation run without displaying its dialog when the macro is run. In this case, any
operation properties will be obtained from the saved macro item and used during
playback. You can alter the value of this property to allow customization of operation
properties during playback. If the Show dialog property of the macro item is set to
True, then during macro playback the operation's dialog will be displayed, letting you
alter any operation properties. Once the dialog is closed, the execution of the macro
will continue.
SetProperty Settings
SetProperty settings contain only the properties being modified, which will apply to
the currently active object during macro playback. They do not contain the Name and
Description properties typically displayed for an object because the property can
apply to whatever object is selected (that is, these fields are no longer tied to a certain
type). However, if the name and description properties are selected in the editor or
modified in a recording, the SetProperty item will display these properties as
expected.
You can modify properties in the Macro Editor to customize your macros.
Source Items
This group consists of history items and four folders of operation items that you can
use in macro creation: Visualizations, Annotations, Macro Tools, and Tool Menus.
The items in all five groups are also available as a source for property settings to be
added to a SetProperty macro item.
iTool User’s Guide
Understanding Items in the Macro Editor
166
Chapter 8: Working with Macros
History Items
The History folder in the source tree, shown in Figure 8-16, contains history items.
The properties of a selected history item appear in the source property sheet.
Figure 8-16: The Macro Editor’s History Folder
The History folder records actions that occur in an iTool. The history items are
grouped into folders for each tool in current or past use, with each folder named by its
tool identifier (e.g., ‘PLOT TOOL’ for an open iPlot tool). History items will
continue to be added to history folders for the duration of the iTools session. This
sequence of history items thus represents an audit trail for actions taken in a tool. It
also serves as a source for the creation of macros.
Note
The History folder is cleared at the end of an iTools session (through the itreset
command or by exiting IDL).
When you change a property value in an iTool, IDL creates a corresponding history
item. The name of the property being changed is appended to the name of that item
(e.g., ‘SetProperty: Color’ instead of simply ‘SetProperty’). When you select or
deselect an object in an iTool, the name of the object selected or deselected is
concatenated to the name of that item (e.g., ‘Selection Change: Axes’). In both cases,
this additional information in the audit trail can show which properties were changed
or which objects were selected or deselected.
Understanding Items in the Macro Editor
iTool User’s Guide
Chapter 8: Working with Macros
167
Note
The object name is specified on history items but not on macro items, because when
you run the macro, it might be operating on different objects based on the current
selection. For more information, see “Selection Changes” on page 180.
Items from Closed Tools
When a tool is closed, the name and identifier of the history folder changes to
indicate that the tool has been closed. The string ‘(Closed-N)’ is appended to the
name of the history folder, where N is an integer starting at 1 and is incremented each
time the tool with the same identifier is closed. After a tool is closed and the History
folder renamed, creation of another tool of the same type causes the creation of a new
tool with the name of the tool identifier. Actions in this tool would be recorded in a
history folder named by the simple tool identifier.
For example, the following sequence creates the History folder items shown in Figure
8-17:
1. Start iImage, open an image, and apply the Smooth operation.
2. Close iImage.
3. Start iImage, open an image, and apply the Median operation.
4. Close iImage.
5. Start iImage, open an image, and apply the Convolution operation.
6. Keep iImage open, start a new iImage tool, open an image in the new iImage,
and apply the Dilate operation to it.
7. Close the second (newer) iImage.
8. Open the Macro Editor from the existing iImage tool.
iTool User’s Guide
Understanding Items in the Macro Editor
168
Chapter 8: Working with Macros
Figure 8-17: A History Example with Open and Closed Tools
Run Macro Items
The Run Macro operation is itself an operation that will show up in the history and
can be added to a macro. Using the Run Macro macro item lets you nest macros for
grouping of common tasks.
If a macro has been run, you can copy a Run Macro item to a macro from the History
folder. You can also add it from the Tool Menus → Operations → Macros
subfolder in the source tree. The item contains a Macro name property to allow
specifying the name of the macro to run. If you copy the item from history, this
property is set to the name of the macro that was run, but you can set it to the name of
any macro. If you add the item from the Tool Menus → Operations → Macros
subfolder, the macro name property will be blank and should be set to the name of the
desired macro to run. If you try to run a macro containing a nested Run Macro
operation, you will get an error dialog if the macro name is invalid or the macro
cannot be found.
Understanding Items in the Macro Editor
iTool User’s Guide
Chapter 8: Working with Macros
169
Visualization Items
The Visualizations folder, shown in Figure 8-18, contains the visualizations that you
can use in the iTools.
Figure 8-18: The Macro Editor’s Visualizations Folder
Visualizations require data for their creation, and so you cannot copy default items
from this folder directly into a macro. When you add a visualization to a macro from
the Visualizations folder, using the item Add button, the ‘Visualization…’ operation
appears as a macro item with the Show dialog property set to True because you must
define the visualization parameters interactively to define the data. If you want to add
a visualization without having to show the Insert Visualization dialog, add an Insert
Visualization operation from the History folder because that visualization already
contains data.
You can select visualization items in the source tree to select their properties and add
them to a macro (e.g., while editing a recorded macro, you could add a SetProperty
item that changes the isovalue of an isosurface).
iTool User’s Guide
Understanding Items in the Macro Editor
170
Chapter 8: Working with Macros
Annotation Items
The Annotations folder, shown in Figure 8-19, contains the operations that create
text, line (including geometric shapes), and legend annotations in a tool.
Figure 8-19: The Macro Editor’s Annotations Folder
Annotations require data for their creation, and so default items from those folders
cannot be copied directly to a macro. You can select annotations in the source tree to
select their properties and add them to a macro (e.g., a SetProperty item that changes
the caption of a text annotation), but you cannot move these items directly up into
macros because they require initialization with data. If you want to add an annotation
directly, you can only add an Insert Annotation operation from the History folder
because that annotation already contains data.
Understanding Items in the Macro Editor
iTool User’s Guide
Chapter 8: Working with Macros
171
Macro Tools Items
The Macro Tools folder, shown in Figure 8-20, contains operations that are not in the
standard menu system. You can use these items to build macros.
Figure 8-20: The Macro Editor’s Macro Tools Folder
The operations in this folder deal with selection changes, tool changes, and the Scale,
Translate, View Pan, Rotate, View Zoom, Range Change, Delay, Step Delay, and
Step Display Change manipulations.
For information on selection and tool changes, see “Making Selection and Tool
Changes” on page 179.
Scale Operation Item
The Scale operation stores the scaling factors from an interactive scale manipulation.
Table 8-4 shows the Scale operation’s properties and values.
Property
Value
Description
Operation description, set by default to Scale
X Scale
Factor to scale the selected object’s data in the x direction
Table 8-4: The Scale Operation’s Property Values
iTool User’s Guide
Understanding Items in the Macro Editor
172
Chapter 8: Working with Macros
Property
Value
Y Scale
Factor to scale the selected object’s data in the y direction
Z Scale
Factor to scale the selected object’s data in the z direction
Table 8-4: The Scale Operation’s Property Values (Continued)
Note that you could have unpredictable behavior if you modify those properties in the
Macro Editor and then run the macro containing the modified operation (e.g., an
object scaled further than desired and thus obscuring important details). Be careful
with estimating these values.
Translate Operation Item
The Translate operation stores the translation in pixels in the x and y directions from
an interactive translate manipulation. This operation lets the macro system record and
play back movements made with the Translate manipulator from the iTools toolbar
(the Arrow icon).
Table 8-5 shows the Translate operation’s properties.
Property
Value
Description
Operation description, set by default to Translate
X Translation
Number of pixels to move the selected object in the x direction
Y Translation
Number of pixels to move the selected object in the y direction
Table 8-5: The Translate Operation’s Property Values
Because the [x, y] translation is relative to the selected object’s current position, not
absolute within an iTool view, you could have unpredictable behavior if you modify
those properties in the Macro Editor and then run the macro containing the modified
operation (e.g., an object moving out of view). Be careful with estimating these
values.
View Pan Operation Item
The View Pan operation stores the movement in pixels in the x and y directions from
an interactive view pan manipulation. This operation lets the macro system record
and play back movements made with the View Pan manipulator from the iTools
toolbar (the Hand icon).
Understanding Items in the Macro Editor
iTool User’s Guide
Chapter 8: Working with Macros
173
Table 8-6 shows the View Pan operation’s properties and values.
Property
Value
Description
Operation description, set by default to View Pan
X Pan
Number of pixels to pan the view in the x direction
Y Pan
Number of pixels to pan the view in the y direction
Table 8-6: The View Pan Operation’s Property Values
Note that you could have unpredictable behavior if you modify those properties in the
Macro Editor and then run the macro containing the modified operation (e.g., a view
panned further than desired and thus obscuring important details). Be careful with
estimating these values.
Rotate Operation Item
The Rotate operation stores the rotation angles from an interactive rotate
manipulation. This operation lets the macro system record and play back movements
made with the Rotate manipulator from the iTools toolbar.
Table 8-7 shows the Rotate operation’s properties and values.
Property
Value
Description
Operation description, set by default to Rotate
X Rotation
Angle to rotate the selected object about the x-axis
Y Rotation
Angle to rotate to move the selected object about the y-axis
Z Rotation
Angle to rotate to move the selected object about the z-axis
Table 8-7: The Rotate Operation’s Property Values
Because the [x, y, z] rotation is relative to the selected object’s current position, not
absolute within an iTool view, you could have unpredictable behavior if you modify
those properties in the Macro Editor and then run the macro containing the modified
operation (e.g., an object rotating further than desired and thus obscuring important
details). Be careful with estimating these values.
iTool User’s Guide
Understanding Items in the Macro Editor
174
Chapter 8: Working with Macros
View Zoom Operation Item
The View Zoom operation stores the zoom percentage from an interactive zoom
manipulation. This operation lets the macro system record and play back movements
made with the View Zoom manipulator from the iTools toolbar.
Table 8-8 shows the View Zoom operation’s properties and values.
Property
Value
Description
Operation description, set by default to Zoom
Zoom Percentage
Zoom percentage on the selected object
Table 8-8: The View Zoom Operation’s Property Values
Because the zoom percentage is relative to the selected object’s current position, not
absolute within an iTool view, you could have unpredictable behavior if you modify
this property in the Macro Editor and then run the macro containing the modified
operation (e.g., an object zooming further in than desired). Be careful with estimating
this value.
Range Change Operation Item
The Range Change operation stores the changes to the dataspace range from
interactive range zoom, range pan and range box manipulators. This operation lets
the macro system record and play back changes made with the Data Range
manipulator from the iTools toolbar (the graph icon).
Table 8-9 shows the Range Change operation’s properties and values.
Property
Value
Description
Operation description, set by default to Range Change
X Minimum
Minimum value for the x coordinate of the data set
X Maximum
Maximum value for the x coordinate of the data set
Y Minimum
Minimum value for the y coordinate of the data set
Y Maximum
Maximum value for the y coordinate of the data set
Table 8-9: The Range Change Operation’s Property Values
Understanding Items in the Macro Editor
iTool User’s Guide
Chapter 8: Working with Macros
175
Property
Value
Z Minimum
Minimum value for the z coordinate of the data set
Z Maximum
Maximum value for the z coordinate of the data set
Table 8-9: The Range Change Operation’s Property Values (Continued)
Note that you could have unpredictable behavior if you modify those properties in the
Macro Editor and then run the macro containing the modified operation (e.g., the data
range scaled up or down further than desired and thus obscuring important details).
Be careful with estimating these values.
Delay Operation Item
The Delay operation can be added to a macro to cause a discrete delay at a particular
place in a macro. The Delay (seconds) property of the operation allows setting a
value in seconds to delay macro execution. This specific delay allows for a custom
delay at a specified location in a macro, in contrast to the macro’s Step delay
property, which causes a delay between each step of the macro (see “The Macro
Property Sheet” on page 156).
Note
When you are using the Macro Controls dialog to step manually through a macro,
the delay is not applied. For more information on this dialog operation, see “Step”
on page 150.
Table 8-10 shows the Delay operation’s properties and values.
Property
Value
Description
Operation description, set by default to Delay.
Delay (seconds)
Value, in seconds, to delay. The default value is 0.0. The
minimum value is 0.0. There is no maximum value or step.
Table 8-10: The Delay Operation’s Property Values
iTool User’s Guide
Understanding Items in the Macro Editor
176
Chapter 8: Working with Macros
Step Delay Change Operation Item
The Step Delay Change operation can be added to a macro to change the step delay
during macro execution. The Step Delay property of the operation allows setting a
value in seconds to delay between macro items.
This step delay remains in place until the end of macro execution or until another
Step Delay Change operation is encountered. The Step Delay value from this
operation is not saved in the Step Delay property of the macro containing this
operation. The step delay of the Step Delay Change operation is a temporary override
of the macro’s Step Delay property.
This delay allows setting the step delay for part of a macro. You can use several Step
Delay Change operations within a macro to make different parts of a macro have
delays of different length. If you want a discrete delay in a single location, use the
Delay operation. For more information, see “Delay Operation Item” on page 175.
Note
When you are using the Macro Controls dialog to step manually through a macro,
the step delay is not applied. For more information on this dialog operation, see
“Step” on page 150.
Table 8-11 shows the Step Delay Change operation’s properties and values.
Property
Value
Description
Operation description, set by default to “Change the macro
step delay.”
Delay mode
Indicates which delay to use. If Delay mode is set to “Use
specified delay,” the Step delay (seconds) value becomes the
current step delay. If Delay mode is set to “Use macro folder
delay,” the step delay is retrieved from the macro applied to
the current step delay.
Step delay
(seconds)
Value, in seconds, to delay. The minimum value is 0.0, the
maximum value is 60.0, and the default step is 0.01.
Table 8-11: The Step Delay Change Operation’s Property Values
Understanding Items in the Macro Editor
iTool User’s Guide
Chapter 8: Working with Macros
177
Step Display Change Operation Item
The Step Display Change operation can be added to a macro to toggle the visibility of
intermediate steps during macro execution.
The setting for the Display intermediate steps property remain in place until the end
of macro execution or until another Step Display Change operation is encountered.
The Display intermediate steps value from this operation is not saved in the
corresponding property of the macro containing this operation. The setting is instead
a temporary override of the macro’s Display intermediate steps property.
This property allows setting the visibility of intermediate steps for part of a macro.
You can use several Step Display Change operations within a macro to make
different parts of a macro show intermediate steps while other parts do not update the
display.
Note
An update of the display is always done at the completion of macro execution.
Table 8-12 shows the Step Display Change operation’s properties and values.
Property
Description
Value
Operation description, set by default to “Change the macro
step display”
Display
Indicates whether to display intermediate steps, set by default
intermediate steps to False (do not display intermediate steps)
Table 8-12: The Step Display Change Operation’s Property Values
iTool User’s Guide
Understanding Items in the Macro Editor
178
Chapter 8: Working with Macros
Tool Menus Items
The Tool Menus folder, shown in Figure 8-21, contains the operations from the
iTools’ menus.
Figure 8-21: The Macro Editor’s Tool Menus Folder
You can use items from the Tool Menus folder as a source for property settings or as
a direct source for macro items. When you add one of these operations to a macro
(e.g., to change the view layout of an iTool), you can modify the resulting macro
item’s property values to customize the actions taken by the operation when the
macro runs.
Note
These operations are for the current tool. Therefore, this folder is no longer
available if all tools are closed.
Understanding Items in the Macro Editor
iTool User’s Guide
Chapter 8: Working with Macros
179
Making Selection and Tool Changes
You can change the selection of objects and even iTools in the course of a macro, to
let you apply macro items to different objects within and across iTools. You can add
these operations during macro recording or by using the Macro Editor, where you can
find the selection change operations in the Macro Tools folder of the source tree.
Macro Type Based on Recording Selection
What you have selected when you start recording a macro gives rise to two general
types of macros, where one of the following states is true:
•
A visualization or annotation selected
•
No visualization or annotation selected (e.g., a view selected instead)
In the first case, the macro’s first item is a Selection Change operation with the
Selection type property set to Existing Selection. This item represents the selection
active when recording starts. When you play back the macro, it begins to apply its
items (operations, property settings, or both) to the object that is selected when
playback begins.
In the second case, the macro’s first item is a Selection Change operation with the
Selection type property set to No Items (De-Select All). When you play back the
macro, the current selection is cleared before additional macro items are processed.
You can create this type of macro if you want it to work on only specific objects or
selections. The macro would typically clear the selection and then select the
particular objects and then operate on them.
About Containers
The following discussion on the creation of these change operations and the
properties of the operation introduces the concept of a container and position in the
container. These concepts apply to both selection and tool changes, with some
differences in the details.
For both changes, the term container is a generic term for one of the iTools objects
that contains other objects. In relation to selection changes, the commonly referenced
containers are the Data Space, the Annotation Layer, and the Window.
The Data Space contains visualizations that can be referenced by their position in the
container. If you use the Visualization Browser to look at the visualization hierarchy,
you can see that the order of the visualizations within the tree view represents their
iTool User’s Guide
Making Selection and Tool Changes
180
Chapter 8: Working with Macros
positions in the container. This arrangement is also true of annotations within the
Annotation Layer.
You can see the Window in the Visualization Browser as well. The Window is a
container that holds Views, and the order of Views within the Window folder of the
Visualization Browser is equivalent to the Views’ positions in the container.
In relation to tool changes, the container is the current iTools session, containing all
the tools. The tools container contains the individual tools, which can be referenced
by their zero-based position in the container. The order of the tools is determined by
their order of creation.
Selection Changes
The Selection Change operation is a macro item that can alter the current selection so
that subsequent macro items are applied to different objects. During the recording of
a macro, the selection change operations are added to the macro when the selection is
changed interactively. In addition, when you start recording a macro, a Selection
Change operation is added to reflect the current state of the selection (for more
information, see “Macro Type Based on Recording Selection” on page 179).
Adding a Selection Change Operation
You can add a Selection Change operation either when you start recording a macro or
during recording.
A Selection Change operation is inserted during recording if the selection is changed
interactively. In this case, the type of the selection change operation is set to Position
in Container. The values of the Container and Item Identifier properties are set. The
value of the Selection Mode property is set to the applicable value of ['New
Selection', 'Add to selection', 'Remove from selection'].
As with other operations, you can modify and delete the Selection Change operation
by using the Macro Editor. You can also add the operation from the Macro Tools
folder in the source tree.
Making Selection and Tool Changes
iTool User’s Guide
Chapter 8: Working with Macros
181
Selection Change Operation Properties
Figure 8-22 shows a Selection Change operation’s property sheet.
Figure 8-22: The Selection Change Operation’s Property Sheet
The Description property is set by default to Selection Change.
The Selection type property indicates the selection upon which the macro will act
when you run it. This property can have the following values:
Property Value
Description
Existing Selection Applies macro to the current selection.
Position in
Container
Applies macro to the object indicated by the Position in
Container property.
All in Container
Applies macro to all objects in the container.
Table 8-13: The Selection Type Property Values
iTool User’s Guide
Making Selection and Tool Changes
182
Chapter 8: Working with Macros
Property Value
Description
Next in Container
Applies macro to the next object in the container based on the
currently selected object or objects in the container. If multiple
objects in the container are selected, the object with the
highest position index is used as the starting point from which
to determine the next in container. If the currently selected
object is the last in the container, this operation wraps to the
beginning when selecting the next in container.
Previous in
Container
Applies macro to the previous object in the container based on
the currently selected object or objects in the container. If
multiple objects in the container are selected, the object with
the lowest position index is used as the starting point from
which to determine the previous in container. If the currently
selected object is the first in the container, this operation
wraps to the end when selecting the previous in container.
By Identifier
Applies macro to the object indicated by the Item Identifier
property.
All Items
Applies macro to all items in all containers.
No Items (Deselect All)
Applies macro to no items (requires a Selection Change
operation in the macro to select an object).
Table 8-13: The Selection Type Property Values (Continued)
As Table 8-13 indicates, several Selection Change properties deal with containers (for
more information, see “About Containers” on page 179). For example, if the
Container property is set to Data Space, a Selection Change operation with a
Selection Type property of All in Container selects all visualizations.
The Selection mode property indicates the selection upon which the macro will act
when you run it. This property can have the following values (Table 8-14):
Property Value
New Selection
Description
Makes the current object the selection
Table 8-14: The Selection Mode Property Values
Making Selection and Tool Changes
iTool User’s Guide
Chapter 8: Working with Macros
183
Property Value
Description
Add to Selection
Adds the current object to the selection
Remove from
Selection
Removes the current object from the selection
Table 8-14: The Selection Mode Property Values (Continued)
The Container property defines the container within which the Selection Change
operation will act (e.g., Window/View_1/Visualization Layer/Data Space for the first
View’s data space).
The Item identifier property names the object upon which the Selection Change
operation will act (e.g., View_1 for the first View in the Window).
The Position in container property identifies the selected object’s position by
number (e.g., 0 for the first item in the Visualization Layer).
Tool Changes
The Tool Change operation represents a macro item that sets the current tool so that
subsequent macro items are applied in a different tool. During macro recording, a
Tool Change operation is added when the currently selected tool is changed
interactively. Note that when the tool selection changes because of an operation such
as Histogram rather than changing interactively, a Tool Change operation is not
added because it would be redundant (that is, the tool change is part of such an
operation).
Adding a Tool Change Operation
You can add a Tool Change operation either when you record a macro or by adding
the operation from the Macro Editor’s source tree, in the Macro Tools folder.
If the operation is added during recording, the Change type property is set to By
Identifier, and the identifier and position values are set. If it is added through the
Macro Editor, only the Change type and Position in container properties are set (to
By Identifier and 0, respectively).
As with other operations, you can modify and delete the Tool Change operation by
using the Macro Editor.
iTool User’s Guide
Making Selection and Tool Changes
184
Chapter 8: Working with Macros
Tool Change Operation Properties
Figure 8-23 shows a Tool Change operation’s property sheet.
Figure 8-23: The Tool Change Operation’s Property Sheet
The Description property is set by default to Tool Change.
The Change type property indicates the kind of tool change that the macro will
perform when you run it. This property can have the following values (Table 8-15):
Property Value
Description
By Identifier
Change selection to the tool indicated by the Tool Identifier
property
Position in
Container
Change selection to the tool indicated by the Position in
Container property
Table 8-15: The Change Type Property Values
Making Selection and Tool Changes
iTool User’s Guide
Chapter 8: Working with Macros
185
Property Value
Description
Next in Container
Change selection to the next tool in the container. If the
current tool is the last in the container, the search for the next
tool will wrap to the beginning of the container, and the first
tool in the container will become the current tool
Previous in
Container
Change selection to the previous tool in the container. If the
current tool is the first in the container, the search for the next
tool will wrap to the end of the container, and the last tool in
the container will become the current tool
Table 8-15: The Change Type Property Values (Continued)
Recall that in terms of tool changes, the container means simply the current iTools
session, encompassing all tools. For more information, see “About Containers” on
page 179.
The Tool identifier property names the tool to which the Tool Change operation will
change (e.g., ‘IMAGE TOOL’ for an iImage tool). This property is used only if the
value of the Change Type property is By Identifier; otherwise, it is ignored.
The Position in container property identifies the tool to which the Tool Change
operation will change by number (e.g., 0 for the first tool in the session). This
property is used only if the value of the Change type property is Position in
Container; otherwise, it is ignored.
iTool User’s Guide
Making Selection and Tool Changes
186
Chapter 8: Working with Macros
Importing and Exporting Macros
You can import a macro from a file by selecting File → Import from the Macro
Editor, which opens a dialog that lets you select one or more macro files to import.
Macro files are IDL SAVE files created by exporting an existing macro.
Note
Macros created in future versions of IDL might contain features not present in the
current release and might not behave as designed. Users will be warned if they are
importing macros from a future version of IDL.
You can export a macro to a file by selecting File → Export from the Macro Editor.
The filename that you specify will be used to create an IDL SAVE file containing the
macro. The macro to be saved is specified by either the macro folder selected
explicitly or the macro folder containing the selected macro item.
Note
If a Run Macro operation is in the macro being exported, you must export the macro
to which that operation refers as well, to ensure proper playback behavior of the
original exported macro.
Importing and Exporting Macros
iTool User’s Guide
Chapter 9
Working with Styles
This chapter introduces IDL iTool styles and discusses the following related-tasks:
What Are Styles? . . . . . . . . . . . . . . . . . . . .
Creating Styles . . . . . . . . . . . . . . . . . . . . . .
Applying Styles . . . . . . . . . . . . . . . . . . . . .
Editing Styles . . . . . . . . . . . . . . . . . . . . . . .
iTool User’s Guide
188
190
196
202
Editing Styles . . . . . . . . . . . . . . . . . . . . . . 202
Setting the Default Style . . . . . . . . . . . . . 205
Importing and Exporting Styles . . . . . . . . 206
187
188
Chapter 9: Working with Styles
What Are Styles?
iTool styles provide a convenient way to store and apply a set of properties to items in
your iTool. While modifying individual property items within a style has the same
effect as creating a new style that sets the same properties, a new style can be created,
customized, and applied in a current session or in later sessions. Styles provide a
shortcut mechanism that allows you to quickly apply groups of properties to your
visualization, and to automatically alter the properties of newly-created
visualizations. Styles are available across all iTools. For example, a style created in
the iPlot tool will also appear as a Style selection when working in the iImage tool.
However, only relevant style properties are applied to a selected visualization.
Property settings for absent visualization items in the style are ignored.
Nearly all properties can be stored in styles. The only exception to this are userdefined properties (such as the color look-up table associated with an image).
Individual property styles are never global, that is, the color property associated with
a plot object applies only to a plot, and does not affect the color property of a surface.
Nevertheless, a style can easily be created to set the color property for these
individual visualization types.
When applied, styles are not permanently linked to a visualization. In other words,
the visualization is exactly the same as it would be if individual properties had been
set instead of the style being applied. Changes to the style are not automatically
updated in the visualization unless the style is re-applied to the visualization. All of
these characteristics ensure that when an iTool is saved and then shared with any
other users, it will display identically. There is no need to send an associated style
file.
Note
You can share styles with other users. See “Importing and Exporting Styles” on
page 206 for details.
What Are Styles?
iTool User’s Guide
Chapter 9: Working with Styles
189
Type of Styles
Style information is stored in one or more style files located on your system. The two
classes of style files are System Styles and Personal Styles:
•
•
System Styles — IDL System Styles are pre-loaded in your IDL distribution.
IDL’s supplied System Styles are:
•
IDL Classic - This System Style contains IDL Direct Graphics’ common
black background with white text and white linestyle.
•
IDL Standard - This System Style is the iTools default and contains a
white background with black text and black lines.
Personal Styles — IDL Personal Styles are styles which you create. These are
stored inside your .idl directory. When you create a new style within an
iTool, it is automatically saved in this location.
Note
Style information is stored independently of any iTool. Styles are never
automatically saved by simply making style changes in an iTool. They must always
be saved explicitly.
Applying a Style
As mentioned, System Styles exist in your IDL distribution and are ready to use
immediately (creating your own new Personal Styles is discussed at-length in the
Creating Styles section). From an iTool window, in order to apply a style, select
Edit → Style → Apply Style... or Edit → Style → Style Editor...
For more in-depth information on style application, see “Applying Styles” on
page 196.
iTool User’s Guide
What Are Styles?
190
Chapter 9: Working with Styles
Creating Styles
There are two ways a new Personal Style can be created. You can use the iTool’s
Style Editor or you can select one or more visualizations within your iTool view (or
the view itself) and create a new style. Both of these options are discussed here.
Creating a Style from the Current Visualization
You can create a new style by selecting one or more visualization objects within the
view (or by selecting the entire view). A new style created in this manner will contain
all property settings of the selected objects (or all objects in the view if nothing was
selected).
Creating a Style From All Items in a View
The following example shows how to create a new style from all items in a view:
1. From the IDL Command Line, plot a simple line graph within iPlot:
iPlot, RANDOMU(seed, 30)
2. From the iPlot window, select one or more visualization objects or the entire
view within the window. Then select: Edit → Style → Create Style from
Selection...
3. Enter a name for your new style (in this example it is named MyNewStyle1) in
the Create Style from Selection dialog shown in the following figure.
Figure 9-1: Create Style from Selection Dialog (MyNewStyle1 Style)
4. Now you can select between creating the new style using the selected items or
using all items in the view. In this instance, choose Create using all items in
view.
Creating Styles
iTool User’s Guide
Chapter 9: Working with Styles
191
5. Select OK and the iTools Style Editor appears.
6. You can now expand the newly named style to view its properties. Under
MyNewStyle1, select Plot and change the Color to your preference as shown
here:
Figure 9-2: Selecting Background Color
7. Change the Symbol to Asterisk.
8. Now, from the Style Editor window, select the Axis object and change the
color.
9. Select File → Save to save changes to MyNewStyle1.
10. Next, from the iPlot window, select Edit → Style → Apply Style and select
MyNewStyle1 from the Apply Style dialog that appears. Your new style,
which contains changes to your line style color, plot symbol type (asterisks)
and color of plot axes, is applied to the plot object.
iTool User’s Guide
Creating Styles
192
Chapter 9: Working with Styles
Note
If multiple items of the same class are within a container (e.g. the axes container),
the first one within the container will be used when creating the style.
Creating a Style From Selected Items
The following example shows how to create a new style from selected items within
an iTool view:
1. From your existing iPlot window, select the text annotation tool (the letter A
on the top of the window on the annotation toolbar).
2. Click anywhere in the window you wish to add a title for your plot. Type in
“My Plot”.
3. Double-click on your new text annotation, and the Visualization Browser
appears. Here you can edit the properties of your annotation. Change the text
font, size, and color.
4. With your text annotation “My Plot” is selected (a box appears around the title
when selected), select Edit → Style → Create Style from Selection...
5. Enter a name for your new style in the Create Style from Selection dialog
shown in the following figure.
Figure 9-3: Create Style from Selection Dialog (NewTextStyle1 Style)
6. Name your new style NewTextStyle1. Now you can select between creating
the new style using the selected items or using all items in the view. In this
instance, choose Create using selected items.
7. Select OK and the iTools Style Editor appears.
8. Since we have already set our text options as we want them to appear, you can
close the Style Editor.
Creating Styles
iTool User’s Guide
Chapter 9: Working with Styles
193
9. Now open a new iPlot window and add a new title (for example, “My New
Plot”) using the text annotation tool.
10. Select Edit → Style → ApplyStyle and select to apply NewTextStyle1. This
applies the personal text style to the new annotation.
For details on applying a style to selected items or to all items within a view, or when
launching an iTool, see “Applying Styles” on page 196. For information on
modifying existing styles, see “Editing Styles” on page 202.
Note
If nothing is currently selected, then the Visualization Layer within the current view
will be used when creating the style.
Creating a Style from Multiple Selected Items
Within an iTool view, you can select one or more visualization objects or annotations
(or a combination of the two) to be included in a new Personal Style. To select one
object or annotation simply click on the item. To select multiple items, select the first
and then, holding down the Ctrl key, click on the other items.
Changes to the properties of the object or annotation can be made prior to creating a
new style (by double-clicking on the item and altering the properties in the
Visualization browser) or after creating a new style (within the iTools Style Editor).
Note
If multiply items of the same class are selected (say two axes), the first one selected
will be used when creating the style.
Creating a New Style from the Style Editor
The Style Editor can be used to manually create a new style and specify the values of
individual properties. Options are available in the Style Editor to duplicate existing
styles, or to copy items from one style to another.
The following example shows how to create a new style using the iTool’s Style
Editor:
1. First, open any iTool window and import some data.
2. From the iTool window, select Edit → Style → Style Editor... The iTools
Style Editor window appears.
iTool User’s Guide
Creating Styles
194
Chapter 9: Working with Styles
3. You will see My Styles, System Styles, and Current Style listed. Select Current
Style and right-click and select Duplicate. A Copy of Current Style appears
under My Styles and is named Copy of Current Style.
Note
From the iTool window you can also select File → New Style.
4. Select the Copy of Current Style and rename it to your desired name in the
right-hand side of the Editor.
Note
To avoid confusion, styles should be given unique names. You may not name
a style the same name as an IDL system style.
5. You are now able to make any changes within the new style by expanding the
new style’s object tree and making changes to the properties of individual
visualization objects.
6. When finished, select File → Save.
Figure 9-4: The iTool’s Style Editor
Note
For more information on how to populate the new style with properties, see
“Editing Styles” on page 202.
Creating Styles
iTool User’s Guide
Chapter 9: Working with Styles
195
Working with the Current Style
The Current Style contains the properties that will be used to create new
visualizations in the current tool. The Current Style can be found in the iTools Style
Editor. The Current Style can be modified by:
•
Changing individual property values. These changes can be copied into
another style, or applied to a visualization when the Current Style item is
selected.
•
Updating the Current Style when applying style modifications. See “Applying
Styles” on page 196 for details.
•
Updating the Current Style from a style in the Style Editor. Select a Personal or
System style and select Update Current Tool Style from the context menu or
Apply menu.
Note
The Current Style is not saved between IDL sessions or between iTools. Because of
this, one use of the Current Style can be as a practice area to define new styles.
Changes can be made to the Current Style and then used to create your desired
style. You can then save this new style under a new name. The new style can be set
as the “Default style” in the Preferences. For more information on setting a default
style, see “Setting the Default Style” on page 205.
Copying an Existing Style
Any existing style can be copied within the Style Editor. This is useful when you
want to change only a few style properties while maintaining the majority of a style’s
existing properties. Simply click on the style name and choose Edit → Copy or Edit
→ Duplicate. Alternately, you can right-click on the style and choose Duplicate (or
Copy and then Paste). A style named “Copy of style name” is then added in the My
Styles folder of the Style Editor.
Note
Styles may be named and renamed as you wish.
iTool User’s Guide
Creating Styles
196
Chapter 9: Working with Styles
Applying Styles
Styles can be applied to a single item or all items within a view. When a new
visualization is added to an existing tool, the style of any previous visualization will
not be automatically applied unless the preferred style is set as the default style (as
described in “Setting the Default Style” on page 205) or unless the STYLE_NAME
keyword is used. STYLE_NAME allows you to specify the name of a user-defined or
system style to be applied to the created visualizations.
Changes to style properties are not automatically reflected in your visualization. To
update a visualization with a modified style, you must reapply the style.
When the Update current tool style checkbox is selected on the Apply Style dialog,
the Current Style is updated. Any properties set in the style you have just applied are
also changed in the Current Style. Other properties are left unchanged. Any new
visualizations added from that point on will have the updated style applied.
Applying a style modifies only applicable items. If the style does not contain any
properties that are relevant to the selected item or visualization, no changes are made
to the visualization.
Note
Selecting Edit → Undo/Redo will completely undo the application of a style. If a
style is applied and Undo is selected, all properties changed by the style revert to
their pre-application values.
Applying a Style to a Selected Item
You can apply a style to selected items in a visualization. For example:
1. From the IDL Command Line, visualize the following simple line graph:
iPlot, RANDOMU(seed, 30)
2. Highlight and select the plot line by clicking on the line.
3. Select Edit → Style → Apply Style...
The Apply Style dialog appears (as shown in the following figure). Here you
can select your preferred style to be applied to the plot item.
Applying Styles
iTool User’s Guide
Chapter 9: Working with Styles
197
Figure 9-5: The Apply Style Dialog
4. After selecting your preferred style (here MyNewStyle1 has been selected),
choose Apply to selected items so that the style changes will only be made to
the selected item. MyNewStyle1 was created to contain properties to change
line color, plot symbol type, and axis color. Because Apply to selected items
is selected and not Apply to all items in view, you can expect that the axes
will remain their original color (black).
Note
If a particular existing style does not contain style information for an item that you
have selected (for instance, if a style does not contain text information and you have
selected a text item), no changes will be made to that item when the style is applied.
iTool User’s Guide
Applying Styles
198
Chapter 9: Working with Styles
5. Click OK and your style changes will be visualized (as shown in the following
figure).
Figure 9-6: iPlot Window Before (background) and After (foreground) Style
Selection Application Changes Line Color and Plot Symbol Only
Note
If nothing is currently selected, then style will be applied to the Visualization Layer
within the current view.
Applying Styles
iTool User’s Guide
Chapter 9: Working with Styles
199
Applying a Style to All Items
You can also apply a style to all items within a view. For example:
1. Visualize a surface from the IDL Command Line by typing:
iSurface, dist(20)
2. Next add a text annotation to your image reading: New Surface.
3. Now select Edit → Style → Apply Style...
4. The Apply Style dialog appears (as shown in the following figure), here you
can select your preferred style to be applied to the text item.
Figure 9-7: The Apply Style Dialog
5. After selecting your preferred style (here IDL Classic has been selected),
select Apply to all items in current view so that the style changes will be
made to all the items in the view.
iTool User’s Guide
Applying Styles
200
Chapter 9: Working with Styles
Note
Selecting Apply to all items in all views applies the style changes to every
item in every view available in the current iTool (e.g., an iPlot tool
subdivided into four views using the VIEW_GRID keyword from the
command line).
6. Click OK and the style is applied to the entire visualization.
Figure 9-8: iSurface Window Before (left) and After (right) Entire Style
Application
Note
Applying a style to all items will ignore items that have the Show property is set to
False (i.e. hidden items).
Applying Styles
iTool User’s Guide
Chapter 9: Working with Styles
201
Applying a Style When Launching an iTool
The STYLE_NAME keyword allows you to apply a style to a visualization when an
iTool is launched from the command line. This keyword can be used with any of the
iTool routines (ICONTOUR, IIMAGE, IMAP, IPLOT, ISURFACE, IVECTOR, and
IVOLUME).
Several system styles are included in your IDL distribution. For more information on
setting a system style or created style, see “Setting the Default Style” on page 205.
Note
Styles specified in the STYLE_NAME string override the default style.
iTool User’s Guide
Applying Styles
202
Chapter 9: Working with Styles
Editing Styles
The iTools Style Editor makes it possible to edit your existing personal styles as well
as copies of IDL System Styles. The Style Editor is shown in the following figure.
Menus
Visualization
Object
Style List
Object
Properties
Figure 9-9: The iTools Style Editor
It is important to note that IDL’s System Styles cannot be edited. These can,
however, be copied as a new style and then edited. For information on copying styles,
see “Copying an Existing Style” on page 195. The following section describes
various editing tasks related to styles.
Copying Properties Within Styles
You can copy properties from the Current Style, My Styles, and System Styles within
the iTools Style Editor and paste these into any new or existing personal style. For
example:
1. Select a style by clicking on it.
2. Select the style visualization object whose properties you wish to copy. The
properties appear in the right panel of the editor.
Editing Styles
iTool User’s Guide
Chapter 9: Working with Styles
203
3. Select a property by clicking on the property name and selecting Edit → Copy
or right-clicking and selecting Copy.
4. Select the style name of the style in which you wish to add the copied property.
The properties will be copied to corresponding visualization object within that
style.
5. Select Edit → Paste or right click to select Paste. Your selected property is
added to your selected style.
Cutting and Deleting Properties within Styles
You can cut or delete properties from your personal styles but not from the Current
Style or from the System Styles. For example:
1. From the iTools Style Editor, select a personal style and select a visualization
object property you wish to delete.
2. Select Edit → Cut or Edit → Delete. Alternately, you can right-click on the
property and select Cut or Delete.
Note
Deleting a property from a personal style cannot be undone. Cutting a property
places the property on the clipboard and the property may then be pasted within
another style.
Selecting Multiple Properties for Editing
Multiple properties may be copied and pasted (for all styles), and cut or deleted (only
for personal styles) as shown for individual properties in the previous sections. To
select multiple properties for these operations:
1. Select a style by clicking on it.
2. Select the style visualization object whose properties you wish to copy, The
properties appear in the right panel of the editor.
3. Click on the property name and then, for the selection of multiple
discontinuous items, hold down the Ctrl key while clicking on any other
properties you wish to select. For continuous selection, hold down the Shift
key while clicking on the final property you wish to select in your group. All
selected property names should appear depressed.
iTool User’s Guide
Editing Styles
204
Chapter 9: Working with Styles
4. With your cursor over one of the property names and all desired properties
selected, right-click and select Copy. Alternately, with all properties selected,
you can select Edit → Copy.
Figure 9-10: The iTools Style Editor with Multiple Properties Selected to Copy
5. You can now select the style name of the style in which you wish to add the
copied properties and find and highlight the corresponding visualization object
within that style.
6. Select Edit → Paste or right click to select Paste. Your selected properties are
added to your selected style.
Editing Styles
iTool User’s Guide
Chapter 9: Working with Styles
205
Setting the Default Style
The default iTools style for your system can be set via the Preferences Browser. The
Preferences Browser contains default property values used by all iTools. You can
assign a personal style or any of the System Styles as the default iTools style
preference. The default setting is none. To set a default style:
1. Select File → Preferences.
2. Select General Settings.
3. Select the desired style from the Default Style field drop-down list.
Figure 9-11: Selecting the Default Style
Once a default style is set, when a new iTool is started, the Current Style will contain
a set of default values. That is, the default style is read into the Current Style.
Note
Because a default style is applied over the IDL system default settings, a default
style does not need to include properties for all visualization types.
iTool User’s Guide
Setting the Default Style
206
Chapter 9: Working with Styles
Importing and Exporting Styles
You can use the Styles import/export functionality to share style files between
yourself and other users.
Exporting a File to Share
You can save (export) a style file to a place on your system to then share with other
users. To do this:
1. From the Style Editor, select File → Export... and name the file, then save it
into a directory as a style file (.sav).
2. This file can then be saved to a disk or sent via E-mail, FTP, etc. to another
user.
Importing a Received File
You can import a saved style file. To do this:
1. From the Style Editor, select File → Import... and locate the desired file.
2. Click Open.
3. The style should now appear in your style listing in the iTools Style Editor.
Importing and Exporting Styles
iTool User’s Guide
Chapter 10
Working with Images
This chapter describes how to use the Image iTool.
Introduction . . . . . . . . . . . . . . . . . . . . . . . .
Displaying Images . . . . . . . . . . . . . . . . . . .
Using the Image Panel . . . . . . . . . . . . . . . .
Image Properties . . . . . . . . . . . . . . . . . . . .
Adding a Colorbar . . . . . . . . . . . . . . . . . . .
Adding Axes . . . . . . . . . . . . . . . . . . . . . . .
Resampling an Image . . . . . . . . . . . . . . . .
iTool User’s Guide
208
209
213
216
217
218
219
Filtering an Image . . . . . . . . . . . . . . . . . .
Applying a Morphological Operator . . . .
Contouring an Image . . . . . . . . . . . . . . . .
Surfacing an Image . . . . . . . . . . . . . . . . . .
Manipulating the Image Display . . . . . . .
iImage Tool Operations . . . . . . . . . . . . . .
220
222
223
225
226
231
207
208
Chapter 10: Working with Images
Introduction
The IDL iImage tool displays your data in image form. The iImage tool then allows
you great flexibility in manipulating and visualizing image data. To use iImage, from
the IDL Command Line, type iImage. An empty iImage tool appears. You can then
import image data using any of several data import methods. For more information
importing image data see Chapter 2, “Importing and Exporting Data”.
Note
For more information on accepted arguments and keywords, see “IIMAGE” (IDL
Reference Guide).
The iImage tool can be launched in many different ways:
•
At the IDL Command Line without arguments or keywords
•
At the IDL Command Line with arguments or keywords
•
Through the File → New → Visualization → iImage menu option in the IDL
Workbench
•
Through the File → New → iImage menu option in an iTool
Common image file formats accepted are listed in “Importing Image Data” on
page 34.
Introduction
iTool User’s Guide
Chapter 10: Working with Images
209
Displaying Images
The iImage tool’s primary design is to visualize image data, though the tool is
capable of much more once the data is displayed. The iImage tool also allows you to
manipulate and edit the displays. The first task is to display the image data.
Your options for invoking the iImage tool are:
•
At the IDL Command Line without arguments or keywords
•
At the IDL Command Line with arguments or keywords
For more information on accepted arguments and keywords, see “IIMAGE” (IDL
Reference Guide).
•
Through the File → New → Visualization → iImage menu option in the IDL
Workbench
•
Through the File → New → iImage menu option in an iTool
To visualize image data in the iImage tool:
1. Image data can be loaded into the data manager. Image data of any supported
type can also be directly visualized into the iImage tool using File → Open or
the File Open icon at the top left of your iImage window, and the File Open
Dialog appears.
2. Select the desired image file from your directory structure. For example here
we will visualize an examples/data file named afrpolitsm.png. Select
the file name and click Open.
iTool User’s Guide
Displaying Images
210
Chapter 10: Working with Images
Figure 10-1: A JPEG File Visualized Using the iImage Tool
Note
The examples/data subdirectory of your IDL distribution contains a text file
named index.txt. This file lists all data files available in the example directory
and also lists their dimensions and values.
Displaying Images
iTool User’s Guide
Chapter 10: Working with Images
211
Displaying Multiple Images
You can use the window layout dialog to provide for multiple image display within
your window. To add another image to the window containing the image you just
visualized:
1. From the iImage window displaying the political map of Africa JPEG image,
select Window → Layout.
Figure 10-2: The Window Layout Dialog
The Window Layout dialog contains these items:
•
Dimensions — Allows you to enter specific window dimensions.
•
Layout — Allows you to pick from a scroll-down list of layout options
and grids.
•
Preview — Gives you a visual preview of the selected layout.
For more information on working with window layouts, see “Window
Layouts” on page 73.
2. Select a layout, in this case select Gridded and then enter 2 and 1 for Columns
and Rows and then OK.
iTool User’s Guide
Displaying Images
212
Chapter 10: Working with Images
3. The window now displays a two by two arrangement of views. You will notice
the original political map of Africa image is shifted to the top-left view. Select
and highlight the top-right view.
4. Select File → Open or the File Open icon at the top left of your iImage
window, and from the File Open Dialog select the examples/data image
named africavlc.png and click Open.
5. The second image of the African continent now appears in the top-right view.
Figure 10-3: Displaying Multiple Images in iImage
Displaying Images
iTool User’s Guide
Chapter 10: Working with Images
213
Using the Image Panel
The image panel appears to the right of the visualization window of the iImage tool.
This panel allows you to view and manipulate various image properties such as pixel
location and values and color properties. You can also draw ROIs within your
visualization. The components and functions of the image panel are discussed in the
following figure and list.
ROIs
Pixel Location
Pixel Value
Pixel Scale
Edit Palette
Window Level
Control
Figure 10-4: The Image Panel
•
ROIs — The ROI buttons on the image panel allow you to draw regions of
interest within your visualization. For more information on ROIs, see Image
ROIs in the following section.
•
Pixel Location — If your pointer/cursor is held over the visualization, the
precise pixel location will be shown in this area.
iTool User’s Guide
Using the Image Panel
214
Chapter 10: Working with Images
•
Pixel Value — Pixel color values are shown in this area.
Note
If the byte scaled pixel value (used for display) is different from the image
data value at that pixel, it will be displayed in parentheses.
•
Pixel Scale — Pixel scale data is shown in this area.
•
Edit Palette — This button is enabled for indexed binary and greyscale color
images. For more information on the Palette Editor, see The Palette Editor in
the following section.
•
Window Level Control — The window level control allows you to adjust and
manipulate the image brightness and contrast by changing the RGBA or
indexed channel values. For more information on the window level control,
see Window Level Control in the following section.
Image ROIs
The ROI buttons (shown in the Image Panel in the preceding figure) allow you to
draw regions of interest within your visualization. You can select from rectangular,
elliptical, polygonal, and freehand region of interest buttons. Once you have created
your ROI, you can also apply operations to image data contained within an ROI area.
Note
The ROI tools are not available for images that have an associated map projection.
Select the desired button and then hold your cursor over the area in the visualization
where you wish your ROI to appear. Click the left mouse button and drag until the
ROI is the desired shape and location. ROIs can be selected and moved or deleted
after they are drawn.
Note
For more information on operations and regions of interest, see “Operations on
Regions of Interest” on page 133.
Using the Image Panel
iTool User’s Guide
Chapter 10: Working with Images
215
The Palette Editor
RGB images contain their own color information while color information for indexed
images is separate from the image itself. Color information can be modified for
indexed and greyscale images.
The easiest way to modify color attributes for a selected indexed, binary, or greyscale
image is to click on the Edit Palette... button on the image panel to the right of your
visualization.
The various components and functions of the Palette Editor are discussed in
“CW_PALETTE_EDITOR” (IDL Reference Guide).
Note
You can also access the palette editor by selecting the image visualization (clicking
once on the visualization and then double-clicking on it to bring up the
Visualization Browser) and selecting Image Palette → Edit Color Table → Edit.
Window Level Control
The Window Level Control on the iImage tool allows you to adjust and manipulate
the image brightness and contrast for each channel of the currently selected image.
The Channel droplist allows you to select the channel to be adjusted. The Link All
checkbox may be selected to cause all channels to be adjusted simultaneously. A
small plot window shows the histogram for the currently selected channel. For
indexed color images, Channel 0 represents the image data values. For RGBA
images, Channel 0 represents the red values, Channel 1 represents the green values,
Channel 2 the blue values, and Channel 3 the alpha values (if present). Within the
plot area is a red bar representing minimum values and a green bar representing
maximum values. You can click on each bar to manipulate these values. The dotted
black bar represents the level; you can click and drag this bar to move both the
minimum and maximum values simultaneously.
iTool User’s Guide
Using the Image Panel
216
Chapter 10: Working with Images
Image Properties
The iImage tool is a self-contained image display and manipulation tool. You can
import, export, modify, and manipulate image data. For more information on the
basic iImage interface and its layout, see Appendix A, “iTools Interface Reference”.
Modifying Properties
By selecting Edit → Properties from the iImage tool, you may modify your image
properties. You may modify your image’s name, description, transparency,
interpolation, pixel dimensions, pixel origin, and so on. For more information on
editing properties in the iTools, see Appendix D, “Visualization Properties”.
Image Properties
iTool User’s Guide
Chapter 10: Working with Images
217
Adding a Colorbar
You can add a colorbar to your visualized image which will show on a color scale the
minimum to maximum pixel values. To add a colorbar, click on the image and then
from the iImage window, select Insert → Colorbar. A colorbar will be placed in the
visualization window. This colorbar can be resized and moved around the window.
You can also double-click on the colorbar to invoke the Visualization Browser,
which will allow you to change properties for the colorbar.
Figure 10-5: Image With Inserted Colorbar
iTool User’s Guide
Adding a Colorbar
218
Chapter 10: Working with Images
Adding Axes
You can add X and Y axes to your image data by selecting Insert → Axis from the
iTool window. From here you can select X Axis or Y Axis. You can modify axis
properties by opening the Visualization Browser and selecting Axes and then
changing the Style property from None to the desired style. Another option is to
double-clicking on the axis itself within the visualization and modify its properties.
Figure 10-6: Image in iImage with Axes Inserted and Placed
Adding Axes
iTool User’s Guide
Chapter 10: Working with Images
219
Resampling an Image
Resampling re-imports the selected image data using parameters specified in the
Resample properties. Resampling parameters include factors for adjusting the X, Y,
or Z dimensions of the data, as well as the interpolation method to be used.
To resample image data:
1. Select one or more images in the iImage window for resampling.
2. If necessary, use the Operations Browser to set the desired parameters through
the Resample properties. See “Resample Properties” on page 406 for details.
3. Select Operation → Transform → Resample.
iTool User’s Guide
Resampling an Image
220
Chapter 10: Working with Images
Filtering an Image
There are six types of filters available in the iImage tool.
Convolving an Image
To convolve an image:
1. Select the image to be convolved.
2. Select Operations → Filter → Convolution.
3. The convolution filter editor appears and desired settings can be edited.
4. Click OK and the filter is applied.
For more details on the convolution filter, see “Convolution Filter” on page 124.
Applying a Median Filter
The median filter replaces each pixel with the median (a value in an ordered set of
values with an equal number of values above and below it) of the two-dimensional
neighborhood of a given width.
To apply the median filter to an image:
1. Select the image.
2. Select Operations → Filter → Median.
For more details on the median filter, see “Median Filter” on page 123.
Smoothing an Image
The smooth filter removes unwanted noise from an image using a weighted average.
To apply the smooth filter to an image:
1. Select the image.
2. Select Operations → Filter → Smooth.
For more details on the smooth filter, see“Smooth Filter” on page 122.
Filtering an Image
iTool User’s Guide
Chapter 10: Working with Images
221
Applying a Roberts Filter
The Roberts filter uses the Roberts edge enhancement operator to detect edges within
the image.
To apply the Roberts filter to an image:
1. Select the image.
2. Select Operations → Filter → Roberts.
3. The Roberts filter is applied.
Applying a Sobel Filter
The Sobel filter uses the Sobel edge enhancement operator to detect edges within the
image.
To apply the Sobel filter to an image:
1. Select the image.
2. Select Operations → Filter → Sobel.
3. The Sobel filter is applied.
Applying an Unsharp Mask
The unsharp mask enhances the contrast between neighboring pixels in an image.
To apply the Unsharp Mask filter:
1. Select the data that you want to unsharp mask.
2. Select Operations → Filter → Unsharp Mask.
For more details on the unsharp mask filter, see “Unsharp Mask Filter” on page 125.
iTool User’s Guide
Filtering an Image
222
Chapter 10: Working with Images
Applying a Morphological Operator
Mathematical morphology is a method of processing digital images on the basis of
shape. Six morphing options are available for use in iImage: dilate, erode, morph
open, morph close, morph gradient, and morph tophat. For more information on
morphing, see “Morphing” on page 127. To morph your image, select Operations →
Morph → <option>.
Applying a Morphological Operator
iTool User’s Guide
Chapter 10: Working with Images
223
Contouring an Image
You can also insert a contoured representation of your image data into your
visualization. To do this:
1. From the iImage window containing a visualized image, select
Operations → Contour.
2. The Contour dialog appears (shown below) allowing you to adjust contour
setting, including:
•
Number of levels: Set the number of contouring levels
•
Value: Set the contour value to use
•
Projection: Choose the contour type (Planar or 3D)
Figure 10-7: The Contour Dialog
3. After making any contour property changes, select OK to contour your image
data.
iTool User’s Guide
Contouring an Image
224
Chapter 10: Working with Images
The following figure shows contouring added to the image of a meteor surface.
Figure 10-8: A Contoured Image in iImage
You can highlight and double-click your contoured image data, invoking the
Visualization Browser which allows you to edit Contour Level properties and
Contour Level color table data. For more information on these edit options, see
“Contour” on page 453.
Contouring an Image
iTool User’s Guide
Chapter 10: Working with Images
225
Surfacing an Image
You can also insert a surface representation of your image data into your
visualization by selecting Operations → Surface. This causes the display to become
three-dimensional. The following figure shows a surface added to the image of the
African political map.
Figure 10-9: Image Data Shown as a Surface
You can highlight and double-click your new surface, invoking the Visualization
Browser which allows you to edit surface properties. For more information on these
edit options, see “Surface” on page 448.
iTool User’s Guide
Surfacing an Image
226
Chapter 10: Working with Images
Manipulating the Image Display
The iImage tool allows you many options to manipulate your existing image displays.
Once you have visualized your image, you may rotate, flip, translate, scale, and zoom
as well as modify image properties, scroll, and select image ROIs. The following
options are available for manipulating images.
For more information on manipulation tasks which are common to iImage as well as
other iTools, see Chapter 4, “Manipulating the Display”.
Rotating an Image
The rotate operation makes it possible to rotate the image within the visualization by
a specified number of degrees. To rotate your selected image, select
Operations → Transform → Rotate Data. For more information about rotating,
see “Rotation” on page 115.
Scaling an Image and Byte Scaling an Image
It is possible to scale the pixel values within an image by a specified scale factor. To
scale your image, select Operations → Transform → Scale Data. For more
information on scaling data, see “Scaling” on page 65.
Note
When working with byte data, the default byte scale range is always 0-255.
Therefore, even if data ranges from 0-100, it will display using 0-255. This may
cause visualized data to appear darker.
Inverting an Image
You can also invert the data associated with your image, or with each channel of an
RGB or RGBA image. If the data is byte data, the inversion occurs relative to the
maximum byte value (255). Otherwise, the inversion occurs relative to the maximum
data value per channel. To invert your image, select
Operations → Transform → Invert Image.
Flipping an Image
You can flip your image within the data space either horizontally or vertically. These
operations flip the actual data associated with the image. To flip your data, select
Operations → Flip → Flip Horizontal or Operations → Flip → Flip Vertical.
Manipulating the Image Display
iTool User’s Guide
Chapter 10: Working with Images
227
View Zoom
View Zoom allows you to zoom in or out on a specific area of the image display area.
To zoom in or out in View Zoom mode click Zoom
on the toolbar or select a
percentage value from the View Zoom droplist. For more information on working
with View Zoom, see “Zooming” on page 70.
Canvas Zoom
Canvas Zoom allows you to increase or decrease the magnification of the entire
display canvas (which may contain multiple views, depending on the layout) by a
specified percentage. Canvas Zoom is available by selecting a percentage from the
Window → Canvas Zoom menu. For more information on working with Canvas
Zoom, see “Zooming” on page 70.
Pixel Scaling
The pixel scale represents the number of window pixels used to display a single
image pixel (horizontally and vertically). Pixel scaling is shown on the image panel
(which appears on the right side of the iImage tool) and can be manipulated via the
View Zoom manipulator on the iImage window toolbar and using its accompanying
pull-down menu.
When an image is first loaded into iImage, the X and Y pixel scales are by default set
to 100% (one window pixel is used to display one image pixel horizontally).
Typically, when iImage first displays an image, the view zoom factor matches the X
pixel scale. Changing the view zoom factor also updates the pixel scale labels.
If the currently selected image has been rotated, or if the visualization has switched to
3D (for example, because a surface was inserted), then the pixel scale labels are set to
an empty string.
Region Growing
The iImage region growing operation lets you apply a region growing algorithm to
the currently selected ROI. A new ROI is then created and displayed. To apply region
growing to your ROI, select Operations → Region Grow. You can then select the
region grow method (by threshold or by standard deviation).
iTool User’s Guide
Manipulating the Image Display
228
Chapter 10: Working with Images
Adding Annotations
Annotations can be added to label or describe image visualizations displayed in the
iImage tool.
The following types of annotations can be added to iImage displays:
Image
Annotation
Type
Description
Text
Single lines or multiple lines of text can be added to a
visualization to provide a label or description
Line
Straight line annotations can be added to a visualization to link
labels to objects or to identify an object
Rectangle
Rectangular annotations can be added to a visualization to
identify rectangular areas
Oval
Oval annotations can be added to a visualization to identify
circular areas
Polygon
Polygon annotations can be added to a visualization to identify
areas bounded by a multi-sided polygon
Freehand
Freehand annotations can be added to a visualization to
identify an area
Table 10-1: Types of Image Annotations
For more information on creating and using annotations, see Chapter 5, “Adding
Annotations”.
Line Profiles
You can plot image pixel values along a selected line. These values are extracted as a
line profile of part of your image visualization and displayed in a new iPlot window:
1. From an iImage window with a visualized image, click on the Line Profile
icon on the toolbar.
2. Use the mouse to position the jagged-edge line profile tool over the place
which you wish your line profile to begin and click.
3. Drag to the ending point of your line profile and release.
Manipulating the Image Display
iTool User’s Guide
Chapter 10: Working with Images
229
4. A new plot window appears showing a plot of the image pixel values that fall
along that line.
Once a line profile has been drawn, it will remain until deleted. The line may be
translated (or its endpoints moved individually). If it is translated or edited, the
profile plot will automatically update.
If you dismiss your Plot Profile window and wish to have it back again, from your
iImage window, with the line selected, choose Operations → Plot Profile and the
Plot Profile window will reappear.
Note
Line profiles on map projections always connect points using the image coordinates
(either degrees or meters). See “Registering an Image” on page 335 for more
information on image coordinates.
View Panning
To pan an image, select the View Pan tool button
on the toolbar and then click on
the image and drag until it is in the desired location. Panning causes the extents of the
visible portion of the view to be shifted.
Cropping an Image
The iImage crop manipulator button allows you to crop your image to your specified
size and dimension. It also allows you to translate and resize the crop box, and then
apply the crop to the currently selected image or images. The button appears in the
toolbar as shown in the following figure.
Crop Manipulator Button
Figure 10-10: The Crop Manipulator Button on the Toolbar
iTool User’s Guide
Manipulating the Image Display
230
Chapter 10: Working with Images
The crop box will appear only if information has been set and is applicable to the
currently-selected image. If the crop box information has not been set for the crop
operation, or does not fit within your image, then no crop box appears. For more
information see “Cropping Images” on page 231
If no crop box visual is present, you can click using the mouse anywhere on an image
and drag to create a crop box.
Note
All portions of the image that fall outside of the crop box are grayed out.
Once a crop box is present, it may be translated (by clicking and dragging anywhere
within the crop box, or along its edges) or scaled (by clicking and dragging on one of
the scale handles). A new crop box can also be created by clicking anywhere within
the gray area outside of the current crop box.
The arrow keys can also be used to translate the crop box (when the mouse location is
anywhere within the crop box or along its edges).
When your crop box is correctly sized and positioned, you can crop the image by:
•
Double-clicking anywhere within the defined crop box
•
Right clicking to invoke the context menu, and then selecting Crop
•
Selecting Operations → Crop from the iImage tool.
Manipulating the Image Display
iTool User’s Guide
Chapter 10: Working with Images
231
iImage Tool Operations
The iImage tool provides the following operations:
Viewing a Histogram
A histogram is a density plot showing a distribution of data values. To view a
histogram of image data, use the iTool’s histogram feature by selecting
Operations → Histogram. For information on histogram creation, see “Plotting a
Histogram” on page 128.
Viewing Image Statistics
To view statistics for image data or for ROIs, use the iTool’s statistics feature by
selecting Operations → Statistics. For information on viewing statistics, see
“Displaying Statistics” on page 129.
Cropping Images
The iImage cropping operation allows you to crop one or more selected images at a
specified location and specified dimensions. To activate the cropping operation,
select Operations → Crop. The Crop manipulator is automatically activated.
Figure 10-11: The Crop Operation Dialog
Note
The appearance of this dialog can be disabled for future uses of the crop operation
by setting the Show dialog property to False.
iTool User’s Guide
iImage Tool Operations
232
Chapter 10: Working with Images
The X, Y and Width, Height properties in the dialog represent the location and
dimensions of the crop box to be applied. If these values have never been set, they are
by default initialized to match the full extent of your first selected image. If these
values have previously been set, they are constrained to fit within the first selected
image. You can enter new values manually, or the mouse can be used to define,
resize, and/or translate the crop box.
The Units property can be set to indicate the units of measure to be used for reporting
crop box coordinates. The default is data units. This property will automatically reset
to data units (and become de-sensitized) if multiple images are selected and their
pixel origins or pixel sizes differ.
Once your crop dialog is present on your image, you can crop by doing the following:
•
Double-clicking anywhere within your defined crop box (in the primary
visualization window).
•
Pressing the Crop button within the crop operation dialog.
Once your image is cropped, the original image is replaced by the new, cropped
image data. You can only retrieve your original data by selecting Edit → Undo
crop, or by reloading the original image data as a separate visualization.
Note
If your original image contains any ROIs, those that do not lie completely within
the crop box will be lost in the new image.
iImage Tool Operations
iTool User’s Guide
Chapter 11
Working with Surfaces
This chapter describes how to work with surfaces in the iSurface tool.
Introduction . . . . . . . . . . . . . . . . . . . . . . . .
Displaying Surfaces . . . . . . . . . . . . . . . . . .
Surface Properties . . . . . . . . . . . . . . . . . . .
Adding a Colorbar . . . . . . . . . . . . . . . . . . .
Adding a Light . . . . . . . . . . . . . . . . . . . . . .
Adding a Legend . . . . . . . . . . . . . . . . . . . .
Adding Axes . . . . . . . . . . . . . . . . . . . . . . .
iTool User’s Guide
234
235
237
239
240
241
242
Contouring a Surface . . . . . . . . . . . . . . . .
Resampling a Surface . . . . . . . . . . . . . . . .
Filtering a Surface . . . . . . . . . . . . . . . . . .
Adding a Texture Map . . . . . . . . . . . . . . .
Manipulating Surface Displays . . . . . . . .
iSurface Tool Operations . . . . . . . . . . . . .
244
246
247
248
249
254
233
234
Chapter 11: Working with Surfaces
Introduction
The IDL iSurface tool provides interactive access to surface data. You can visualize
surfaces and then modify and manipulate those surfaces in the ways that you need.
The following sections describe how surfaces can be displayed, modified, and
manipulated in iSurface.
To use iSurface from the IDL Command Line, type iSurface. An empty iSurface tool
appears. You can then import surface data using any of several data import methods.
For more information on importing surface data, see Chapter 2, “Importing and
Exporting Data”.
Note
For more information on accepted arguments, see “ISURFACE” (IDL Reference
Guide).
The iSurface tool can be launched in the following ways:
Introduction
•
At the IDL Command Line without arguments or keywords
•
At the IDL Command Line with arguments and keywords
•
Through the File → New → Visualization → iSurface menu option in the
IDL Workbench
•
Through the File → New → iSurface menu option in an existing iTool
iTool User’s Guide
Chapter 11: Working with Surfaces
235
Displaying Surfaces
Three-dimensional visualizations of surfaces can be displayed in the iSurface
window.
To open an iSurface window, do one of the following:
•
At the IDL command line, enter ISURFACE
•
From an iTool window, select File → New and select iSurface
Surface data can be displayed by specifying data parameters at the IDL command
line, or by importing a binary or ASCII text file containing surface data.
To import a file containing surface data into the iSurface tool:
1. Select File → Open from the iSurface tool and locate the file to open. For
example, from your IDL examples/data directory, select idemosurf.dat.
2. Double-click the filename or select the filename and click Open to open the
surface data file. You will be prompted to enter information regarding your file
type (for example, ASCII or binary). For more information on entering this
information and on importing data, see Chapter 2, “Importing and Exporting
Data”. In this example, enter demosurface for your template name and then
select New Field and specify demosurface as the Field Name and specify it as
a two-dimensional 200 by 200 Floating type.
3. Then select OK and OK to dismiss and visualize.
iTool User’s Guide
Displaying Surfaces
236
Chapter 11: Working with Surfaces
Figure 11-1: Surface Data Visualized in iSurface
Displaying Surfaces
iTool User’s Guide
Chapter 11: Working with Surfaces
237
Surface Properties
Surfaces have attributes or properties that can be modified to change their
characteristics. These properties are organized into property sheets for each operation
and visualization type. For example, the skin of a surface visualization has a gold
color by default. To change this color, modify the surface color property in the
surface visualization property sheet.
To display the property sheet for a surface, do one of the following:
•
Double-click the surface in the iTool window
•
Select the surface, and select Edit → Properties
•
Display the Visualization Browser, and double-click the entry for the surface
For more information, see Chapter 6, “Property Sheets and Browsers”.
The Visualization Browser
The Visualization Browser provides a nested list of all visualizations displayed in the
iSurface window. From the Visualization Browser, you can select visualizations and
display property sheets for those visualizations.
To display the Visualization Browser:
1. Select Window → Visualization Browser.
2. Do either of the following:
•
Click an item to select it in the Visualization Browser
•
Double-click an item in the iTool window to display its property sheet
For more information, see Chapter 6, “Property Sheets and Browsers” and Appendix
D, “Visualization Properties”.
The Operations Browser
The Operations Browser provides a nested list of all operations available from the
iSurface Operations menu. From the Operations Browser, you can display property
sheets for each of the items in the iSurface Operations menu.
To display the Operations Browser:
1. Select Operations → Operations Browser
2. Click an item to display its property sheet
iTool User’s Guide
Surface Properties
238
Chapter 11: Working with Surfaces
For more information, see Chapter 6, “Property Sheets and Browsers” and Appendix
C, “Operations Properties”.
Surface Properties
iTool User’s Guide
Chapter 11: Working with Surfaces
239
Adding a Colorbar
If you have added vertex coloring or texture to your surface visualization, you can
add a colorbar that will show on a color scale the minimum to maximum values of
data in the visualization. To add a colorbar, click on the surface data and then from
the iSurface window, select Insert → Colorbar. A colorbar will be placed in the
visualization window. This colorbar can be resized and moved around the data space.
You can also double-click on the colorbar to invoke the Visualization Browser which
will allow you to change the values for the colorbar. For more information on the
colorbar, see “Colorbar” on page 477.
iTool User’s Guide
Adding a Colorbar
240
Chapter 11: Working with Surfaces
Adding a Light
Adding a light to your surface display allows you to highlight various parts of the
surface. To add a light to your surface display, select Insert → Light. you can click
on the light bulb which appears and drag it around the display area to manipulate the
lighting. You can also adjust the lighting settings using the Visualization Browser by
double-clicking on the light bulb.
Figure 11-2: Inserting Light into a Surface Display
Adding a Light
iTool User’s Guide
Chapter 11: Working with Surfaces
241
Adding a Legend
Legends identify the visualizations displayed in the iTool window. Legends can be
displayed in the iSurface window to identify surfaces and contours on those surfaces.
To insert a legend for a surface or contour:
1. Select specific items to include in the legend, or click in an empty area of the
iSurface dataspace to deselect and include all dataspace items in the legend.
2. Select Insert → New Legend.
To add to a legend:
1. Select the visualization item or items to add to the legend.
2. If there are multiple legends, add the desired legend to the selection by shiftclicking the legend border.
3. Select Insert → Legend Item.
Note
Only a single legend item may exist for a given visualization. If you are inserting
multiple visualization items into an existing legend, only legend items for those
visualizations not already represented will be added to the legend.
For more information, see “Legends” on page 77.
iTool User’s Guide
Adding a Legend
242
Chapter 11: Working with Surfaces
Adding Axes
By default, surfaces are displayed with X, Y and Z axes. The display of these axes is
controlled by property sheets for the axes container and for individual axes (see
“Axes” on page 485). Additional X, Y or Z axes can be added to a surface
visualization to make it easier to identify surface characteristics.
To add an axis to your surface visualization:
1. Select the surface.
2. Select Insert → Axis.
3. Choose from the following options:
•
X axis
•
Y axis
•
Z axis
Use the mouse to position the new axis, and double-click the axis to display the axis
property sheet.
For more information on adding axes, see “Additional Axes” on page 84.
Adding Axes
iTool User’s Guide
Chapter 11: Working with Surfaces
243
Imaging a Surface
You can insert an image of your surface data by using Operations → Image. An
image visualization of your original surface data is then displayed with your original
surface visualization.
For example at the IDL command line,
1. Enter iSurface, DIST (10)
2. Now select Operations → Image.
Figure 11-3: Surface Visualization with Image Added
iTool User’s Guide
Imaging a Surface
244
Chapter 11: Working with Surfaces
Contouring a Surface
Contour lines can be drawn directly on a surface to provide information about the
levels of the surface, such as elevation. Two types of contours can be applied:
multiple-level contour operations that apply to the surface in general, and single-level
contour objects applied at a specific location on the surface.
To add contour lines to a surface:
1. Select the surface in the iTools window. For example, select the
isurfdemo.dat surface data previously visualized.
2. Select Operations → Contour.
3. The Contour dialog appears (shown below) allowing you to adjust contour
setting, including:
•
N_LEVELS: Set the number of contouring levels
•
Value: Set the contour value to use
•
Projection: Choose the contour type (Planar or 3D)
Figure 11-4: The Contour Dialog
4. After making any contour property changes, select OK to contour your
surface.
5. Contour lines are applied to the surface at the interval specified in the contour
dialog.
Contouring a Surface
iTool User’s Guide
Chapter 11: Working with Surfaces
245
Figure 11-5: Surface with Contours Added
6. To adjust the properties of the contour, double-click the contour in the iTool
window or in the Visualization Browser to display the Contour property sheet.
For information on the contour properties, see “Contour” on page 453.
To insert a contour object at a specific location on a surface:
1. Select a surface in the iSurface window.
2. Click the Surface Contour button
in the Manipulator toolbar.
3. Click the level on the surface at which you would like the contour to appear.
Contour lines are displayed on the surface at that level.
4. To adjust the properties of the contour object, double-click the contour object
in the iTool window or in the Visualization Browser to display the Contour
property sheet. For information on the contour properties, see “Contour” on
page 453.
iTool User’s Guide
Contouring a Surface
246
Chapter 11: Working with Surfaces
Resampling a Surface
Once surface data has been imported into the iSurface window, that data can be reimported using different import parameters by resampling the data. See “Resample”
on page 119 for details.
To resample a surface:
1. Select a surface in the iSurface window. For example, select the
isurfdemo.dat surfaced data.
2. Select Operations → Transform → Resample.
Figure 11-6: Resampled Surface in iSurface
Resampling a Surface
iTool User’s Guide
Chapter 11: Working with Surfaces
247
Filtering a Surface
Three types of filters are available in the iSurface tool: smooth filtering and
convolution filtering.
Convolving a Surface
To convolve a surface:
1. Select the surface to be convolved.
2. Select Operations → Filter → Convolution.
For details on using the convolution filter, see “Convolution Filter” on page 124.
Median a Surface
The median filter replaces each point with the median (a value in an ordered set of
values with an equal number of values above and below it) of the one- or twodimensional neighborhood of a given width.
to median a surface:
1. Select the surface.
2. Select Operations → Filter → Median.
For details about using the median filter, see “Median Filter” on page 123.
Smoothing a Surface
The smooth filter removes unwanted noise from a surface.
To apply the smooth filter to a surface:
1. Select the surface.
2. Select Operations → Filter → Smooth.
For details on using the smooth filter, see “Smooth Filter” on page 122.
iTool User’s Guide
Filtering a Surface
248
Chapter 11: Working with Surfaces
Adding a Texture Map
An image file can be imported into a surface visualization to serve as a texture map:
an image projected onto the surface skin in place of the default red skin.
To add a texture map to a surface:
1. Select the surface.
2. Select Edit → Parameters to open the Parameter Editor.
3. Click Import File to import the image file to be used as a texture map into the
Data Manager.
4. Find the image file in the list of files in the Data Manager tree and select either
a specific image channel to import, or select Image Planes to import all
channels of the image.
5. Click the Assign Data button under TEXTURE. The name of the data to
import appears in the TEXTURE field.
Clear data
Assign data
Data name
Figure 11-7: TEXTURE Field in Parameter Editor
6. Click OK. The Parameter Editor window closes, and the texture map appears
on the surface.
Adding a Texture Map
iTool User’s Guide
Chapter 11: Working with Surfaces
249
Manipulating Surface Displays
The iSurface tool provides options for manipulating surface data. You can rotate as
well as scale surfaces. These manipulations are described in the following sections.
Rotating a Surface
Rotation tools are provided in the iSurface tool to make it easier to see all aspects of a
3-D surface visualization. Surfaces can be rotated freely or along an axis with the
mouse, and they can be rotated in fixed or arbitrary increments from the Operations
menu.
To rotate a surface freely or along an axis with the mouse:
1. Select the surface in the iSurface window.
2. Click Rotate
on the Manipulator toolbar. The rotation sphere is displayed
around the surface.
iTool User’s Guide
Manipulating Surface Displays
250
Chapter 11: Working with Surfaces
Figure 11-8: Surface with Rotation Sphere Displayed
•
To rotate the surface freely, position the mouse pointer over the surface so
that it changes to a free rotation pointer . Click and drag to rotate the
surface in the desired direction.
•
To rotate the surface along an axis, position the mouse pointer over an axis
so that it changes to an axis rotation pointer
. Click and drag to rotate
the surface along the axis in the desired direction.
To rotate a surface in 90° increments left or right from the Operations menu:
1. Select the surface in the iTool window.
2. Select Operations → Rotate → Rotate Left or Operations → Rotate →
Rotate Right.
To rotate a surface an arbitrary number of degrees from the Operations menu:
1. Select the surface in the iTool window.
2. Select Operations → Rotate → Rotate by Angle.
Manipulating Surface Displays
iTool User’s Guide
Chapter 11: Working with Surfaces
251
3. In the Rotate Angle dialog, enter the desired number of degrees to rotate the
surface.
For more information, see “Rotation” on page 115.
Scaling a Surface
Surfaces can be scaled freely, or scaling can be constrained to one or more
dimensions.
To scale a surface freely:
1. Select the surface in the iTool window.
2. Position the mouse pointer over a side of the data set bounding box so that it
changes to an unconstrained scaling pointer .
3. Click and drag to scale all points of the surface in the desired direction.
To constrain scaling of a surface:
1. Select the surface in the iTool window.
2. Position the mouse pointer over an axis “whisker” to scale along only one axis,
or over a corner of the bounding box for multi-axis scaling.
Figure 11-9: Constrained Single-Axis (left) and Multi-Axis (right) Scaling
3. Click and drag to scale in the desired direction.
For more information, see “Scaling” on page 65.
iTool User’s Guide
Manipulating Surface Displays
252
Chapter 11: Working with Surfaces
Adding Annotations
Annotations can be added to label or describe surface visualizations displayed in the
iSurface tool.
The following types of annotations can be added to iSurface displays:
Plot
Annotation
Type
Description
Text
Single lines or multiple lines of text can be added to a
visualization to provide a label or description.
Line
Straight line annotations can be added to a visualization to link
labels to objects or to identify an object.
Rectangle
Rectangular annotations can be added to a visualization to
identify rectangular areas.
Oval
Oval annotations can be added to a visualization to identify
elliptical areas.
Polygon
Polygon annotations can be added to a visualization to identify
areas bounded by a polygon.
Freehand
Freehand annotations can be added to a visualization to
identify an area.
Table 11-1: Types of Surface Annotations
For more information on creating and using annotations, see Chapter 5, “Adding
Annotations”.
View Zoom
View Zoom allows you to zoom in or out on a specific area of the surface display
area. To zoom in or out in View Zoom mode click Zoom
on the toolbar. For more
information on working with View Zoom, see “Zooming” on page 70.
Manipulating Surface Displays
iTool User’s Guide
Chapter 11: Working with Surfaces
253
Canvas Zoom
Canvas Zoom allows you to increase or decrease the magnification of the entire
display canvas (which may contain multiple views, depending on the layout) by a
specified percentage. Canvas Zoom is available by selecting the pull-down
percentage list from the top of the tool just under the Help menu. For more
information on working with Canvas Zoom, see “Zooming” on page 70.
Extracting a Line Profile
To extract a line profile of part of your surface visualization in an iPlot window:
1. Click on the Line Profile icon on the iSurface window toolbar.
2. Use the mouse to position the jagged-edge line profile tool over the place
which you wish your line profile to begin.
3. Drag to the ending point of your line profile.
4. The profile plot appears in an iPlot window.
Once a line profile has been drawn, it will remain until deleted. The line may be
translated (or its endpoints moved individually) by switching back to the arrows. If it
is translated or edited, the profile plot will automatically update.
If you dismiss your Plot Profile window and wish to have it back again, from your
iSurface window, with the line selected, choose Operations → Plot Profile and the
Plot Profile window will reappear.
iTool User’s Guide
Manipulating Surface Displays
254
Chapter 11: Working with Surfaces
iSurface Tool Operations
The iSurface tool provides the following operations:
Viewing a Histogram Plot
To display a histogram plot of your surface:
1. Select the surface.
2. Select Operations → Histogram.
For more information, see “Plotting a Histogram” on page 128.
Viewing Statistics
To display the Statistics dialog:
1. Select an object or a group of objects in the iTools window.
2. Select Operations → Statistics. The Statistics window displays the statistics
for the selected object(s).
For more information, see “Displaying Statistics” on page 129.
iSurface Tool Operations
iTool User’s Guide
Chapter 12
Working with Contours
This chapter describes how to work with contours in the iContour tool.
Introduction . . . . . . . . . . . . . . . . . . . . . . . .
Displaying Contours . . . . . . . . . . . . . . . . .
Contour Properties . . . . . . . . . . . . . . . . . . .
Labeling Contours . . . . . . . . . . . . . . . . . . .
Changing the Contour Colors . . . . . . . . . .
Filling Contours . . . . . . . . . . . . . . . . . . . . .
iTool User’s Guide
256
257
264
266
268
269
Adding a Colorbar . . . . . . . . . . . . . . . . . .
Adding a Legend . . . . . . . . . . . . . . . . . . .
Adding Axes . . . . . . . . . . . . . . . . . . . . . . .
Filtering a Contour . . . . . . . . . . . . . . . . . .
Manipulating the Contour Display . . . . . .
iContour Tool Operations . . . . . . . . . . . . .
271
272
273
274
276
279
255
256
Chapter 12: Working with Contours
Introduction
The IDL iContour tool allows you interactive access to contour data. You may
visualize contours and then modify and manipulate those contours in the ways that
you need.
The IDL iContour tool displays your data as contours and allows you great flexibility
in manipulating and visualizing these contours. The iContour tool can be used for
irregular or regular grid data. Irregularly-grid data arranged as three fields (three onedimensional vectors) are gridded by a Gridding Wizard if this data is imported into
the iTool. Regular grid data arranged as a two-dimensional array is directly imported.
To use iContour from the IDL Command Line, type iContour. An empty iContour
tool appears. You can then import contour data using any of several data import
methods. For more information on importing contour data, see Chapter 2, “Importing
and Exporting Data”.
Note
For more information on accepted arguments and keywords, see “ICONTOUR”
(IDL Reference Guide).
The iContour tool can be launched in the following ways:
Introduction
•
At the IDL Command Line without arguments or keywords
•
At the IDL Command Line with arguments and keywords
•
Through the File → New → Visualization → iContour menu option in the
IDL Workbench
•
Through the File → New → iContour menu option in an existing iTool
iTool User’s Guide
Chapter 12: Working with Contours
257
Displaying Contours
The iContour tool’s primary purpose is to display contours, though the tool is capable
of much more once the data is displayed. The iContour tool can display regular-grid
data or irregular-grid data. Gridding is the creation of uniformly-spaced planar data
from data points. These points may initially be irregular.
Displaying Regular-grid Data
Regular-grid data points are presented by two-dimensional arrays. The following
example shows one way of importing and displaying this type of data into the
iContour tool. The 248-by-248 two-dimensional array contained within the
convec.dat binary file in the examples/data directory is imported into IDL with
the READ_BINARY function. The iContour tool then displays this data as contours.
At the IDL Command Line, enter:
file = FILEPATH('convec.dat', SUBDIRECTORY = ['examples', 'data'])
data = READ_BINARY(file, DATA_DIMS = [248, 248])
iContour, data
iTool User’s Guide
Displaying Contours
258
Chapter 12: Working with Contours
Figure 12-1: Earth Convection Contours in the iContour Tool
Note
The examples/data directory of your IDL 7.0 distribution contains a text file
named index.txt. This file lists all data files available in the example directory
and also lists their dimensions and values.
Displaying Irregular-grid Data
Irregular-grid data points are presented by three one-dimensional vectors, usually
known as fields. The following example shows one way of importing and displaying
this type of data into the iContour tool. The three fields contained within the
irreg_grid1.txt ASCII file in the examples/data directory is imported into
IDL with the File → Open option in the iContour tool. This option uses the ASCII
Template wizard to import the data, which is then gridded into contour data with the
Gridding Wizard. The iContour tool then displays this data as contours.
Displaying Contours
iTool User’s Guide
Chapter 12: Working with Contours
259
1. At the IDL Command Line, enter:
ICONTOUR
2. Select File → Open from the pulldown menus of the empty iContour tool. The
Open dialog will appear.
3. Use the Open dialog to find and select the irreg_grid1.txt file in the
example/data directory. The ASCII Template wizard will appear.
The irreg_grid1 file contains three columns of data points. These columns
represent the x-locations, y-locations, and the elevation (respectively) of this
data. These columns are specified as three fields (vectors) of data with the
ASCII Template wizard.
4. Click Next on the first and second step of the wizard, then click Finish on the
third (last) step of the wizard. The IDL iTools Create Visualization dialog
will appear.
Figure 12-2: The iTools Create Visualization Dialog
iTool User’s Guide
Displaying Contours
260
Chapter 12: Working with Contours
The IDL iTools Create Visualization dialog contains the following choices:
•
Launch the gridding wizard
•
Select a visualization and specify parameters
•
Do not create a visualization
5. Select the Launch the gridding wizard radio button, then click OK. The IDL
Gridding Wizard Step 1 of 3 dialog will appear.
Figure 12-3: The IDL Gridding Wizard Step 1 of 3
The Gridding Wizard allows you to specify the method of gridding while
showing you the possible results for that method. The IDL Gridding Wizard
Step 1 of 3 dialog contains the following items:
•
Number of points entered
•
X Coordinates — X coordinate range
•
Y Coordinates — Y coordinate range
•
Data values — Data values are shown here
•
Spherical data checkbox — Check to make data spherical
•
Coordinate diagram — Shows coordinates of grid data
Displaying Contours
iTool User’s Guide
Chapter 12: Working with Contours
261
•
Show points checkbox — Select to show all points (default is checked)
•
Help — Obtain help on this dialog
•
Back — Return to previous step
•
Next — Proceed to Step 2 of 3
•
Cancel — Dismiss the Gridding Wizard
6. In the Gridding Wizard Step 1, click Next to accept the interpolation of data
values and locations. The IDL Gridding Wizard Step 2 of 3 dialog will
appear.
Figure 12-4: The IDL Gridding Wizard Step 2 of 3
The IDL Gridding Wizard Step 2 of 3 dialog contains the following items:
iTool User’s Guide
•
X Coordinates — modify dimension, start or end
•
Y Coordinates — modify dimension, start or end
•
Coordinate diagram — Shows coordinates of grid data
•
Show points checkbox — Select to show all points (default is checked)
•
Help — Obtain help on this dialog
Displaying Contours
262
Chapter 12: Working with Contours
•
Back — Return to previous step
•
Next — Proceed to Step 3 of 3
•
Cancel — Dismiss the Gridding Wizard
7. At Step 2, click Next to accept the dimensions, start and spacing. The IDL
Gridding Wizard Step 3 of 3 dialog will appear.
Figure 12-5: The IDL Gridding Wizard Step 3 of 3
The IDL Gridding Wizard Step 3 of 3 dialog contains the following items:
•
Choose gridding method — Choose from pull-down list of methods
•
Preview — Click to preview selected method and data
•
Auto preview — Checkbox to turn auto preview on (default = off)
•
Statistics tab — Shows data statistics
•
Options tab — Set options for missing values, smoothing, weighting, and
anistropy between axes
•
Search tab — Set options for using search ellipse
•
Coordinate diagram — Shows coordinates of grid data
Displaying Contours
iTool User’s Guide
Chapter 12: Working with Contours
263
•
Show points checkbox — Select to show all points (default = checked)
•
Help — Obtain help on this dialog
•
Back — Return to previous step
•
Finish — Dismiss the Gridding Wizard with data gridded
•
Cancel — Dismiss the Gridding Wizard
8. At Step 3, select Inverse Distance as the gridding method and click Finish to
display the surface.
9. The resulting contours are displayed in the iContour tool.
Figure 12-6: Irregular-grid Elevation Contours in the iContour Tool
iTool User’s Guide
Displaying Contours
264
Chapter 12: Working with Contours
Contour Properties
The iContour window is a self-contained contour display and manipulation device.
You can import and export contour data, and modify and manipulate contours. For
more information on the basic iContour interface and its layout, see Appendix A,
“iTools Interface Reference”.
With the contour selected, the Edit → Properties... option allows access to the
contour property sheet. You can change many contour properties through this sheet.
Figure 12-7: Contour Property Sheet
The following examples show how to modify some contour properties. These
examples are performed on the contours imported by using the following steps:
1. At the IDL Command Line, enter:
ICONTOUR
2. Select File → Open from the pulldown menus of the empty iContour tool. The
Open dialog will appear.
Contour Properties
iTool User’s Guide
Chapter 12: Working with Contours
265
3. Use the Open dialog to find and select the convec.dat file in the
example/data directory. The Binary Template wizard will appear.
4. In the Binary Template dialog, click New Field, and enter the following
information in the New Field dialog:
•
Field name: data (or a name of your choosing)
•
Type: byte
•
Number of dimensions: 2
•
1st dimension Size: 248
•
2nd dimension Size: 248
5. Click OK to close the New Field dialog and the Binary Template dialog, and
the contours are displayed in the tool.
Figure 12-8: Earth Convection Contours in the iContour Tool
iTool User’s Guide
Contour Properties
266
Chapter 12: Working with Contours
Labeling Contours
Each contour level line has its own properties. You can access these properties
through Contour level properties in the contour property sheet by clicking Contour
level properties, clicking on the arrow button, and then clicking Edit... The Contour
Levels property sheet will appear.
Figure 12-9: Contour Levels Property Sheet
Labeling Contours
iTool User’s Guide
Chapter 12: Working with Contours
267
The first column of the Contour Levels property sheet contains the property values
for all the levels. In this column, change the Label setting from None to Value. The
value of each contour line appears as labels in the iContour display.
Figure 12-10: Labelled Contour Levels
iTool User’s Guide
Labeling Contours
268
Chapter 12: Working with Contours
Changing the Contour Colors
The columns after the first one are for each individual contour level. In each level
column, change the Color setting from black to a different color making sure to use a
different color for each level. When a level color is changed in the property sheet, that
level is updated in the iContour display.
The resulting display contains a different color contour for each level.
Figure 12-11: Color Contour Levels
After changing the colors of each level, click OK in the Contour Levels property
sheet. The Contour Labels property sheet closes.
Changing the Contour Colors
iTool User’s Guide
Chapter 12: Working with Contours
269
Filling Contours
The Fill contours setting in the original contour property sheet controls whether the
contour levels are filled or not. Change the Fill contours setting to True.
Note
You must also change the Use palette color setting to True as well before colors
can be used. After that, you can choose or set your own color scheme from the
Levels Color Table → Edit color table function.
The contour colors are now more distinctive.
Figure 12-12: Filled Contour Levels Using the Predefined Blue Waves Scheme
Even more detail can be added by increasing the number of levels in the contour
display. Change the Number of levels from 6 to 20.
iTool User’s Guide
Filling Contours
270
Chapter 12: Working with Contours
The color set for each of the original seven levels is repeated every set of seven
within the 20 new levels.
Figure 12-13: 20 Filled Contour Levels Reset at 20 Levels
Filling Contours
iTool User’s Guide
Chapter 12: Working with Contours
271
Adding a Colorbar
You can add a colorbar to your visualized contour which will show on a color scale
the minimum to maximum values of data in the visualization. To add a colorbar, click
on the contour data and then from the iContour window, select Insert → Colorbar.
A colorbar will be placed in the visualization window.
Note
Be sure that the Use palette color setting in the Visualization Browser is True so
that colors can be used. After that, you can choose or set your own color scheme
from the Levels Color Table → Edit color table function.
This colorbar can be resized and moved around the data space. You can also doubleclick on the colorbar to invoke the Visualization Browser which will allow you to
change the values for the colorbar and edit color tables. For more information on the
colorbar, see “Colorbar” on page 477.
iTool User’s Guide
Adding a Colorbar
272
Chapter 12: Working with Contours
Adding a Legend
You can add a legend to your contour which shows the levels of the contour in their
increments. To add a legend, select Insert → New Legend from the iContour tool
window.
Figure 12-14: A Contour With Legend Added Showing Levels
Once you have placed a legend on your contour, you can edit the legend settings such
as the title and level increments as well as the color options on the legend. Doubleclicking on the legend itself will show you the Visualization Browser. For more
information on the options available, see “Legend Properties” on page 524.
Adding a Legend
iTool User’s Guide
Chapter 12: Working with Contours
273
Adding Axes
You can also add axes to your contour as visual aids for reading contour data.
Although axes are added to two-and three dimensional contour data there are
advantages to adding additional axes. For example in the figure which follows,
additional axes have been added in order to create a box-style contour showing the
tick marks and increments on all sides of the image. You can add X, Y and Z axes
depending on your contour and needs. To insert axes, select Insert → Axis and then
select X Axis, Y Axis, or Z Axis or from the Visualization Browser, select the Axes
group and then set Style to Box Axes.
Figure 12-15: A Contour With Axes Added and Altered in Box-Style
Once you have placed an axis on your contour you can edit the axis settings by
changing the title and increments as well as the color options on the axis. Doubleclicking on the axis itself will show you the Visualization Browser.
iTool User’s Guide
Adding Axes
274
Chapter 12: Working with Contours
Filtering a Contour
The iContour tool allows you to modify your contour data in the following ways:
Contour Smoothing
Within the iContour tool, contours can also be smoothed to refine edges or
compensate for random noise in the data. To smooth your data from the iContour
window, select Operations → Filter → Smooth.
Figure 12-16: Brain MRI Data (left) and Smoothed Data (right)
Note
The previous figure shows brain MRI data taken from the IDL examples\data
directory in a file named mr_brain.dcm.
Note
The window’s default size is three, however this can be changed via the operations
browser. For more information on smoothing properties, see “Smooth Properties”
on page 401.
Filtering a Contour
iTool User’s Guide
Chapter 12: Working with Contours
275
Contour Convolution
You can also use iContour convolution feature by selecting Operations → Filter →
Convolution. By selecting this, the Convolution Editor appears.
From this dialog, you can select the desired convolution type from a drop-down list
or you may manipulate the columns and rows and scale factor and details manually.
For more details on the convolution filter, see “Convolution Filter” on page 124.
Figure 12-17: Brain MRI Data (left) and Convolved (right) Using Gaussian
Convolution
For more information on convolution properties, see “Convolution Properties” on
page 398.
iTool User’s Guide
Filtering a Contour
276
Chapter 12: Working with Contours
Manipulating the Contour Display
The iContour tool allows you many options to manipulate your existing plot displays.
Once you have visualized your contours, you may rotate, flip, translate, scale, and
zoom as well as modify contour properties, scroll, and select contour ROIs. The
following options are available for manipulating contours.
Translating
Translation moves an object or group of objects in a specific direction. When an
object is selected, a bounding box appears around the object. For information on
translating objects, see “Translation” on page 64.
View Zoom
View Zoom allows you to zoom in or out on a specific area of the contour display
area. To zoom in or out in View Zoom mode click Zoom
on the toolbar. For more
information on working with View Zoom, see “Zooming” on page 70.
Flipping a Contour
You can flip your contour within the data space either horizontally or vertically.
These operations flip the actual data associated with the contour. To flip your data,
select Operations → Flip → Flip Horizontal or Operations → Flip → Flip
Vertical.
Canvas Zoom
Canvas Zoom allows you to increase or decrease the magnification of the entire
display canvas (which may contain multiple views, depending on the layout) by a
specified percentage. Canvas Zoom is available by selecting the pull-down
percentage list from the top of the tool just under the Help menu. For more
information on working with Canvas Zoom, see “Zooming” on page 70.
Manipulating the Contour Display
iTool User’s Guide
Chapter 12: Working with Contours
277
Scaling a Contour Display
The iContour tool allows you to scale your contour data by selecting
Operations → Transform → Scale Data. You can scale your data by a factor which
you provide in the Scale Factor dialog.
Figure 12-18: Setting the Contour Scale Factor
Once you have set the scale factor, select OK and the scaling takes place.
You may zoom in and out from your plot using either the Zoom In and Zoom Out
buttons on the iPlot toolbar, or by selecting Window → Zoom In or
Window → Zoom Out.
Adding Annotations
The following types of annotations can be added to iContour displays:
Plot
Annotation
Type
Description
Text
Single lines or multiple lines of text can be added to a
visualization to provide a label or description.
Line
Straight line annotations can be added to a visualization to link
labels to objects or to identify an object.
Rectangle
Rectangular annotations can be added to a visualization to
identify rectangular areas.
Oval
Oval annotations can be added to a visualization to identify
oval areas.
Table 12-1: Types of Contour Annotations
iTool User’s Guide
Manipulating the Contour Display
278
Chapter 12: Working with Contours
Plot
Annotation
Type
Description
Polygon
Polygon annotations can be added to a visualization to identify
areas bounded by a polygon.
Freehand
Freehand annotations can be added to a visualization to
identify an area.
Table 12-1: Types of Contour Annotations (Continued)
For more information on creating and using annotations, see Chapter 5, “Adding
Annotations”.
Manipulating the Contour Display
iTool User’s Guide
Chapter 12: Working with Contours
279
iContour Tool Operations
The iContour tool provides the following operations:
Viewing a Histogram
A density histogram is a density plot showing the distribution of data values. The Xaxis represents data values and the Y-axis represents density or frequency. Another
type of histogram is a style plot histogram. To view a density histogram of contour
data, use the iTool’s histogram feature by selecting Operations → Histogram. For
information on histogram creation, see “Plotting a Histogram” on page 128.
Viewing Statistics
To view statistics for contour data, use the iTool’s statistics feature by selecting
Operations → Statistics. For information on viewing statistics, see “Displaying
Statistics” on page 129.
iTool User’s Guide
iContour Tool Operations
280
iContour Tool Operations
Chapter 12: Working with Contours
iTool User’s Guide
Chapter 13
Working with Plots
This chapter describes plotting tasks and the iPlot tool.
Introduction . . . . . . . . . . . . . . . . . . . . . . . .
Displaying Two-Dimensional Plots . . . . . .
Displaying Three-Dimensional Plots . . . .
Displaying Polar Plots . . . . . . . . . . . . . . . .
Overplotting . . . . . . . . . . . . . . . . . . . . . . . .
Plot Properties . . . . . . . . . . . . . . . . . . . . . .
Adding Error Bars . . . . . . . . . . . . . . . . . . .
iTool User’s Guide
282
283
284
285
286
288
292
Adding Legends . . . . . . . . . . . . . . . . . . . .
Adding a Colorbar . . . . . . . . . . . . . . . . . .
Adding Error Bars . . . . . . . . . . . . . . . . . .
Curve Fitting . . . . . . . . . . . . . . . . . . . . . .
Filtering a Plot . . . . . . . . . . . . . . . . . . . . .
Manipulating the Plot Display . . . . . . . . .
iPlot Tool Operations . . . . . . . . . . . . . . . .
289
291
292
294
297
299
301
281
282
Chapter 13: Working with Plots
Introduction
The IDL iPlot tool displays your data in plot form. The iPlot tool then allows you
great flexibility in manipulating and visualizing plot data. iPlot can be used for any
type of two- or three-dimensional plot, including scatter plots, line plots, polar plots,
and histogram plots. To use iPlot, from the IDL Command Line, type iPlot. An
empty iPlot tool appears. You can then import plot data using any of several data
import methods. For more information importing plot data see Chapter 2, “Importing
and Exporting Data”.
Note
For more information on accepted arguments, see “IPLOT” (IDL Reference Guide).
The iPlot tool can be launched in many different ways:
Introduction
•
At the IDL Command Line without arguments or keywords
•
At the IDL Command Line with arguments or keywords
•
Through the File → New → Visualization → iPlot menu option in the IDL
Workbench
•
Through the File → New → iPlot menu option in an iTool
iTool User’s Guide
Chapter 13: Working with Plots
283
Displaying Two-Dimensional Plots
The iPlot tool’s primary design is to display plot data, though the tool is capable of
much more once the data is plotted. The iPlot tool can display multiple types of plots
and allows you to manipulate and edit the displays.
The first task is to display plot data. Here is a simple example of how to display a
plot.
At the IDL command line, enter:
iPlot, RANDOMU(seed, 20)
Figure 13-1: A Simple 2D Plot Using the iPlot Tool
Note
The examples/data directory of your IDL 7.0 distribution contains a text file
named index.txt. This file lists all data files available in the example directory
and also lists their dimensions and values.
iTool User’s Guide
Displaying Two-Dimensional Plots
284
Chapter 13: Working with Plots
Displaying Three-Dimensional Plots
iPlot can display multiple types of plots and allows you to manipulate and edit the
displays. You can also display three-dimensional plots. Here is a simple example of
how to display a 3D plot.
At the IDL command line, enter:
iPlot, FINDGEN(20), FINDGEN(20), RANDOMU(seed, 20)
Figure 13-2: A Simple 3D Plot Using the iPlot Tool
Displaying Three-Dimensional Plots
iTool User’s Guide
Chapter 13: Working with Plots
285
Displaying Polar Plots
iPlot can display multiple types of plots and allows you to manipulate and edit the
displays. You can also display polar plots. Here is a simple example of how to
display a polar plot.
At the IDL command line, enter:
iPlot, FINDGEN(20), FINDGEN(20), /POLAR
Figure 13-3: A Simple Polar Plot Using the iPlot Tool
Note
The examples/data directory of your IDL 7.0 distribution contains a text file
named index.txt. This file lists all data files available in the example directory
and also lists their dimensions and values.
iTool User’s Guide
Displaying Polar Plots
286
Chapter 13: Working with Plots
Overplotting
Once you have plotted data, you may overplot new plot data in the original iPlot
window. Overplotting is the process of plotting new data over the top of original data
or datasets for the purpose of analyzing or comparing more than one dataset at a time.
For example, in order to overplot cosine data onto a plot of sine wave data follow
these steps:
1. Create a variable named “theory” to contain sine wave data to be plotted:
theory = SIN(2.0*FINDGEN(200)*!PI/25.0)*EXP(-0.02*FINDGEN(200))
2. Plot theory using iPlot:
iPlot, theory
Figure 13-4: Sin Wave Data Plotted
Overplotting
iTool User’s Guide
Chapter 13: Working with Plots
287
3. Create a variable named “newtheory” which stores cosine data to be used for
overplotting:
newtheory = COS(2.0*FINDGEN(200)*!PI/25.0)*EXP(-0.02*FINDGEN(200))
4. Now overplot the new cosine data onto your original plot:
iPlot, newtheory, /OVERPLOT
Figure 13-5: Cosine Data Overplotted on Sine Data
iTool User’s Guide
Overplotting
288
Chapter 13: Working with Plots
Plot Properties
The iPlot window is a self-contained plot display and manipulation device. You can
import and export plot data, and modify and manipulate plot data. For more
information on the basic iPlot interface and its layout, see Appendix A, “iTools
Interface Reference”.
Modifying Properties
By selecting Edit → Properties from the iPlot tool, you may modify your plot
properties. You may modify your plot’s name, description, fill type and fill color,
opacity as well as the show/hide properties and the line color, style and thickness. For
more information on editing properties in the iTools, see Appendix D, “Visualization
Properties”.
Plot Properties
iTool User’s Guide
Chapter 13: Working with Plots
289
Adding Legends
A legend is text that describes aspects of a visualization. For example, a legend might
show the plot line or plot points. If multiple plots are present the legend may show
which colors and linestyles represent which plots. An inserted legend will include
items selected at the time of insertion. If no specific dataset is selected, the legend
will include all datasets in the plot.
To add a legend to your plot, select Insert → New Legend.
Figure 13-6: A Simple Sine Plot with Default Legend Added
You can add new information to your existing legend, or you can also use the
Insert → Legend option can be used over again to add more legends. For example,
in the theory plot with newtheory overplot displayed in the previous section, you
can add a legend for each plot:
1. Select the newtheory plot by clicking once on the line.
2. Select Insert → New Legend. A new legend appears on top of the previous
legend (this new legend can be selected and repositioned).
iTool User’s Guide
Adding Legends
290
Chapter 13: Working with Plots
Figure 13-7: Plot and Overplot in iPlot with Legend Added for Each
You can double-click on the legend to bring up a property sheet to alter its settings.
Through the property sheet, you can also access the Visualization Browser, which
can be used to navigate through other legends and objects within the visualization. In
the previous example the names of the legends have been altered to reflect the data
names. For more information on editing settings in the Visualization Browsers, see
“The Visualization Browser” on page 427.
Adding Legends
iTool User’s Guide
Chapter 13: Working with Plots
291
Adding a Colorbar
If you have added vertex coloring to your plot visualization, you can add a colorbar
which will show on a color scale the minimum to maximum values of data in the
visualization.
To add a colorbar,
1. Click on the plot data.
2. From the iPlot window, select Insert → Colorbar.
3. A colorbar will be placed in the visualization window.
This colorbar can be resized and moved around the data space. You can also doubleclick on the colorbar to invoke the Visualization Browser which will allow you to
change the values for the colorbar. For more information on the colorbar, see
“Colorbar” on page 477.
iTool User’s Guide
Adding a Colorbar
292
Chapter 13: Working with Plots
Adding Error Bars
Error bars are used to show uncertainty in data values. These uncertainties may be
caused by measurement errors or instrument noise, and are usually specified in terms
of standard deviations away from the data value.
For example, to create a 2D plot with asymmetric error bars on the X and Y axes,
follow these steps:
1. To set asymmetric error bars for X and Y with X bars initially hidden, enter:
err = FLTARR(2,10)
err[0, *] = FINDGEN(10)/10.
err[1, *] = FLTARR(10) + 0.5
2. Plot the error bars in the iPlot window:
iPlot, FINDGEN(10), COLOR = [255, 0, 255],$
ERRORBAR_COLOR = [255, 0, 0], $
ERRORBAR_CAPSIZE = 0.25, X_ERRORBARS = 0, $
XERROR = err, YERROR = err
Figure 13-8: 2D Plot with Error Bars
Adding Error Bars
iTool User’s Guide
Chapter 13: Working with Plots
293
Also, to create a 3D plot with asymmetric error bars on the X, Y and Z axes:
1. To set asymmetric error bars for a 3D plot, enter:
nVerts = 30
x = FINDGEN(nVerts)/10.
y = (SIN(x*2) + 1.)*25.
z = x
err = FLTARR(2, nVerts)
err[0, *] = RANDOMU(seed, nVerts)
err[1, *] = RANDOMU(seed, nVerts)
2. Plot the error bars in the iPlot window with 3D plot and name the plot “3D Plot
with Error Bars”:
iPlot, x, y, z, COLOR = [0, 0, 255], $
THICK = 2, ERRORBAR_COLOR = [255, 0, 0], $
XERROR = err/2., YERROR = err*5., ZERROR = err, $
NAME = '3D Plot with Error Bars'
Figure 13-9: 3D Plot with Error Bars and Name
For more information on error-bar properties, see “Plot” on page 441.
iTool User’s Guide
Adding Error Bars
294
Chapter 13: Working with Plots
Curve Fitting
Curve fitting is the process of finding various ways to fit a curve to a series of data
points which best represents all points. More specifically, since data, such as plot
data, is often given as values along a continuum, you may wish at times to give
estimates at points between values. Curve fitting allows you to find intermediate
estimates for these values.
Note
For both 2D and 3D plots, the curve fitting operation is performed on the X versus
Y plot dimensions.
For example, to fit a curve to the damped sine plot we have already created:
1. Select Operations → Filter → Curve Fitting.
2. The Curve Fitting dialog appears.
Figure 13-10: The Curve Fit Dialog with Curve Fitting Model Choices
Curve Fitting
iTool User’s Guide
Chapter 13: Working with Plots
295
The Curve Fitting dialog contains the following fields:
•
Curve fitting model — used to select the type of model used to try to fit a
curve to the data.
•
Initial parameters and results — used to specify the initial values of the
parameters of the model used to fit a curve to the data and to display the
resulting values of these parameters for the model selected in the Curve
fitting model drop-down list. The initial values are specified in the text
boxes on the left side and the results are shown in the labels on the right
side.
•
Equation of the model — shows the equation of the model used to try to
fit a curve to the data. This model is selected from the Curve fitting
model.
•
Display of resulting fit — graphically shows how well the model
specified by the Curve fitting model drop-down menu and the Initial
parameters text boxes fits the data.
•
Chi-square value — shows the resulting chi-square value, which is a
measure of goodness-of-fit.
You can use this dialog to determine what type of model would best fit your
data by changing the Curve fitting model drop-down menu setting and the
Initial parameters text boxes values.
3. Select the desired curve fit from the Curve fitting model drop-down list. You
can also set initial parameters if desired.
iTool User’s Guide
Curve Fitting
296
Chapter 13: Working with Plots
Figure 13-11: A Quintic Curve Fit to a Sin Wave Plot
The new curve created by the curve fitting operation is added to the Data
Manager.
Curve Fitting
iTool User’s Guide
Chapter 13: Working with Plots
297
Filtering a Plot
The iPlot tool allows you to modify your plot data in the following ways:
Plot Smoothing
Within the iPlot tool, plots can also be smoothed to soften edges or compensate for
random noise in the plot. To smooth your plot from the iPlot window, select
Operations → Filter → Smooth.
Figure 13-12: Damped Sine Plotted Data (left) and Smoothed Data (right)
Note
The example shown in the previous figures is taken from example data available in
the examples\data directory of your IDL installation. The data is contained in a
file called damp_sn.dat.
Note
The window’s default size is three, however this can be changed via the operations
browser. For more information on smoothing properties, see “Smooth Properties”
on page 401.
iTool User’s Guide
Filtering a Plot
298
Chapter 13: Working with Plots
Plot Convolution
You can also use the iPlot convolution feature by selecting Operations → Filter →
Convolution. By selecting this, the Convolution Editor appears. From this dialog,
you can select the desired convolution type from a drop-down list or you can
manually manipulate the columns, rows, scale factor, and details.
For more information on convolution properties, see “Convolution Properties” on
page 398.
Plot Median
The median filter replaces each point with the median (a value in an ordered set of
values with an equal number of values above and below it) of the one- or twodimensional neighborhood of a given width.
To apply the smooth filter to an image:
1. Select the plot.
2. Select Operations → Filter → Median.
For more details on the median filter, see “Median Filter” on page 123.
Filtering a Plot
iTool User’s Guide
Chapter 13: Working with Plots
299
Manipulating the Plot Display
The iPlot tool allows you many options to manipulate your existing plot displays.
Once you have visualized your plot data, you may rotate, flip, translate, scale, and
zoom as well as modify plot properties, scroll, and select plot ROIs. The following
options are available for manipulating plots.
Translating
Translation moves an object or group of objects in a specific direction. When an
object is selected, a bounding box appears around the object. For information on
translating objects, see “Translation” on page 64.
Adding Annotations
The following types of annotations can be added to iPlot displays:
Plot
Annotation
Type
Description
Text
Single lines or multiple lines of text can be added to a
visualization to provide a label or description.
Line
Straight line annotations can be added to a visualization to link
labels to objects or to identify an object.
Rectangle
Rectangular annotations can be added to a visualization to
identify rectangular areas.
Oval
Oval annotations can be added to a visualization to identify
elliptical areas.
Polygon
Polygon annotations can be added to a visualization to identify
areas bounded by a multi-sided polygon.
Freehand
Freehand annotations can be added to a visualization to
identify an area.
Table 13-1: Types of Plot Annotations
For more information on creating and using annotations, see Chapter 5, “Adding
Annotations”.
iTool User’s Guide
Manipulating the Plot Display
300
Chapter 13: Working with Plots
View Zoom
View Zoom allows you to zoom in or out on a specific area of the plot display area.
To zoom in or out in View Zoom mode click Zoom
on the toolbar. For more
information on working with View Zoom, see “Zooming” on page 70.
Canvas Zoom
Canvas Zoom allows you to increase or decrease the magnification of the entire
display canvas (which may contain multiple views, depending on the layout) by a
specified percentage. Canvas Zoom is available by selecting the pull-down
percentage list from the top of the tool just under the Help menu. For more
information on working with Canvas Zoom, see “Zooming” on page 70.
Selecting the Data Range
In a two-dimensional plot, your data range can be manipulated in several ways. First,
enter into the Data Range tool mode by clicking on the Data Range button
on the
toolbar. You can then manipulate your data range in the following ways:
•
Clicking and dragging a selection box within the view. The selected range
becomes the new data range.
•
Panning in one direction or another along a single axis by clicking on the
arrow manipulators.
•
Zooming in or out by clicking on one of the plus or minus symbols. When
isotropic scaling is in effect (the default for the iPlot tool), these symbols
appear at the axis origin, and will impact both the X and Y ranges
simultaneously.
Note
Plots are clipped to fit within newly selected data ranges.
Manipulating the Plot Display
iTool User’s Guide
Chapter 13: Working with Plots
301
iPlot Tool Operations
Many operations are available in the iPlot tool. Once you have visualized your plot
data, you can scale and filter as well as creating a histogram or viewing statistics for
your plot. The following operations are available for plots.
Scaling a Plot Display
iPlot allows you to scale your plotted data by selecting Operations → Transform
→ Scale Data. You can scale your data by a factor which you provide in the Scale
Factor dialog.
Figure 13-13: Setting the Plot Scale Factor
Once you have set the scale factor, select OK and the scaling takes place.
Viewing a Histogram
A density histogram is a plot consisting of either horizontal or vertical bars. The
widths or heights of these bars represent data values. Another type of histogram is a
style plot histogram which plots different data sets side-by-side using differently
styled points or bars to represent the data. To view a density histogram of plot data,
use the iTool’s histogram feature by selecting Operations → Histogram. For
information on histogram creation, see “Plotting a Histogram” on page 128.
Viewing Statistics
To view statistics for plot data, use the iTool’s statistics feature by selecting
Operations → Statistics. For information on viewing statistics, see “Displaying
Statistics” on page 129.
iTool User’s Guide
iPlot Tool Operations
302
iPlot Tool Operations
Chapter 13: Working with Plots
iTool User’s Guide
Chapter 14
Working with Volumes
This chapter describes how to use the iVolume tool.
Introduction . . . . . . . . . . . . . . . . . . . . . . . .
Displaying Volumes . . . . . . . . . . . . . . . . . .
Using the Volume Panel . . . . . . . . . . . . . .
Volume Properties . . . . . . . . . . . . . . . . . . .
Adding a Colorbar . . . . . . . . . . . . . . . . . . .
Adding Axes . . . . . . . . . . . . . . . . . . . . . . .
iTool User’s Guide
304
305
309
311
312
313
Resampling Volumes . . . . . . . . . . . . . . . .
Showing an Image Plane . . . . . . . . . . . . .
Extracting an IsoSurface . . . . . . . . . . . . .
Extracting an Interval Volume . . . . . . . . .
Manipulating the Volume Display . . . . . .
iVolume Tool Operations . . . . . . . . . . . . .
314
315
316
318
320
322
303
304
Chapter 14: Working with Volumes
Introduction
The IDL iVolume tool displays your data in volume form. The iVolume tool then
allows you great flexibility in manipulating and visualizing volume data. To use
iVolume, from the IDL Command Line, type iVolume. An empty iVolume tool
appears. You can then import volume data using any of several data import methods.
For more information importing volume data see Chapter 2, “Importing and
Exporting Data”.
Note
For more information on accepted arguments, see “IVOLUME” (IDL Reference
Guide).
The iVolume tool can be launch in many different ways:
Introduction
•
At the IDL Command Line without arguments or keywords
•
At the IDL Command Line with arguments or keywords
•
Through the File → New → Visualization → iVolume menu option in the
IDL Workbench
•
Through the File → New → iVolume menu option in an iTool
iTool User’s Guide
Chapter 14: Working with Volumes
305
Displaying Volumes
The iVolume tool’s primary purpose is to visualize volume data, though the tool is
capable of much more once the data is displayed. The iVolume tool also allows you
to manipulate and edit the displays. The first task is to display the volume data.
Before displaying, volume data must be loaded into the tool. Here is a simple
example of one way to load in some data.
At the IDL command line, enter:
file = FILEPATH('head.dat', $
SUBDIRECTORY = ['examples', 'data'])
data = READ_BINARY(file, DATA_DIMS = [80, 100, 57])
IVOLUME, data
Note
The examples/data directory of your IDL 7.0 distribution contains a text file
named index.txt. This file lists all data files available in the example directory
and also lists their dimensions and values.
Note
IDL converts and stores volume data in a BYTE array. Thus, all incoming volume
data is converted to BYTE type. This could alter the volume data values if the
incoming data cannot accurately be stored as BYTE data.
Multi-Channel Volumes
The data in the previous example is a single-channel volume which is volume data
specified in a single parameter. This is the simplest and most common way to display
volume data. The iVolume tool also supports two-channel and four-channel volume
rendering. Two-channel rendering allows you to combine or blend two volume arrays
together. Four-channel rendering is useful when your volume data is composed of a
volume array for each of the red, green, blue, and alpha display channels. Note that
the dimensions of all the volume arrays used in multi-channel volume rendering must
be the same.
iTool User’s Guide
Displaying Volumes
306
Chapter 14: Working with Volumes
In the following example, the second volume array of a two-channel volume is used
as a mask to cut out a portion of the volume to create a hole. With the head.dat data
already loaded from the examples/data directory, a mask volume is created and
displays the result:
mask = BYTARR(80, 100, 57, /NOZERO)
mask[*] = 255
mask[30:50, *, 20:30] = 0
IVOLUME, data, mask
A rectangular hole through the middle of the head is created, making portions of the
inside more visible.
The following is an example of a four-channel volume:
red = BYTARR(20,20,20, /NOZERO)
green = BYTARR(20,20,20, /NOZERO)
blue = BYTARR(20,20,20, /NOZERO)
alpha = BYTARR(20,20,20, /NOZERO)
red[10:*,*,*]=255
green[*,10:*,*]=255
blue[*,*,10:*]=255
alpha[*] = 128
IVOLUME, red, green, blue, alpha
Rendering Volumes
Volume data does not automatically appear in the tool window since volume
rendering can be a time consuming operation. To render the volume, click the
Render button on the tool. Auto render is available but not set by default since it can
slow down your iTool session if you have simultaneous operations.
Note
Volume data is only rendered if the volume data space is selected. Thus, if you have
multiple volumes in your data space, auto render must be turned on in order to
render both simultaneously.
Displaying Volumes
iTool User’s Guide
Chapter 14: Working with Volumes
307
The data loaded earlier can be displayed by clicking the Render button.
Figure 14-1: Rendered MRI Head Volume Data
Rendering Quality
The volume can be rendered in two quality modes:
•
Low — Done with a stack of 2D texture-mapped semi-transparent polygons.
The polygons are oriented so that the flat sides face the viewer as directly as
possible. On most systems, Low-quality mode renders faster than High-quality
mode, but not as accurately.
•
High — Done with the IDLgrVolume ray-casting volume renderer. This
quality mode is CPU-intensive and will usually take much longer than the
Low-quality mode.
iTool User’s Guide
Displaying Volumes
308
Chapter 14: Working with Volumes
Extents
Since the volume is not always rendered, iVolume draws volume extents to help you
locate and select the volume. You can select the volume by selecting on the extents,
without rendering the volume. By default, iVolume draws a translucent solid cube
with internal extents. You can also select a wire frame, or no extents within the
visualization browser.
Note
Use caution when turning off extents. If extents are turned off and auto render is
also off, you may need to use the Visualization Browser to select the volume again.
Displaying Volumes
iTool User’s Guide
Chapter 14: Working with Volumes
309
Using the Volume Panel
The volume panel appears to the right of the visualization window of the iVolume
tool. This panel allows you to render and manipulate rendering properties. The
components and functions of the volume panel are discussed in the following figure
and list.
Figure 14-2: The Volume Panel
•
Name — The volume object’s name (if any).
•
Data Channels — The volume’s data channels.
•
Render — This button will render the volume data.
•
Auto-Render — Select this checkbox to enable auto-rendering.
•
Quality — Pull-down menu to select desired volume rendering quality. Select
Low (textures) or High (volume).
iTool User’s Guide
Using the Volume Panel
310
Chapter 14: Working with Volumes
•
Boundary — Pull-down menu to select desired volume data space boundaries.
Select none, wire frame, or solid walls.
•
Render Step — Enter desired order for rendering here (if any).
Using the Volume Panel
iTool User’s Guide
Chapter 14: Working with Volumes
311
Volume Properties
The iVolume window is a self-contained volume display and manipulation device.
You can import and export volume data, and modify and manipulate volume data.
For more information on the basic iVolume interface and its layout, see Appendix A,
“iTools Interface Reference”.
Modifying Properties
By selecting Edit → Properties from the iVolume tool, you can modify your volume
properties. You may modify your volume’s name, description as well as the
show/hide properties and the line color, style, and thickness. For more information on
editing properties in the iTools, see Appendix D, “Visualization Properties”.
iTool User’s Guide
Volume Properties
312
Chapter 14: Working with Volumes
Adding a Colorbar
You can add colorbars to your visualized volume which will show on a color scale
the minimum to maximum values of data in the visualization. To add a colorbar, click
on the volume visualization and then from the iVolume window, select
Insert → Colorbar. Colorbars showing RGB values as well as opacity values will be
placed in the visualization window. These colorbars can be resized and moved
around the data space. You can also double-click on the colorbars to invoke the
Visualization Browser which will allow you to change the properties for that
colorbar.
Figure 14-3: Rendered Volume with Colorbars Added
Note
Color and opacity data can be manipulated by selecting
Window → Visualization Browser... from the iVolume window and then selecting
Edit color/opacity table under Color & opacity table.
Adding a Colorbar
iTool User’s Guide
Chapter 14: Working with Volumes
313
Adding Axes
By default, volumes are displayed with X, Y, and Z axes. The display of these axes is
controlled by property sheets for the axes container and for individual axes (see
“Axes” on page 485). Additional X, Y, or Z axes can be added to a volume
visualization to make it easier to identify volume characteristics.
To add an axis to your volume visualization:
1. Select the volume.
2. Select Insert → Axis.
3. Choose from the following options:
•
X axis
•
Y axis
•
Z axis
Use the mouse to position the new axis and double-click the axis to display the axis
property sheet.
For more information on adding axes, see “Additional Axes” on page 84.
iTool User’s Guide
Adding Axes
314
Chapter 14: Working with Volumes
Resampling Volumes
Resampling re-imports the selected volume data using parameters specified in the
Resample properties. Resampling parameters include factors for adjusting the X, Y,
or Z dimensions of the data, as well as the interpolation method to be used.
To resample volume data:
1. Select one or more volumes in the iVolume window for resampling.
2. If necessary, use the Operations Browser to set the desired parameters through
the Resample properties. See “Resample Properties” on page 406 for details.
3. Select Operation → Transform → Resample.
Figure 14-4: Resampled and Rendered Volume
Resampling Volumes
iTool User’s Guide
Chapter 14: Working with Volumes
315
Showing an Image Plane
An image plane is a visualization of a slice of the volume. An image plane can be
dragged and rotated within the volume. To show an image plane for a portion of
volume data, first be sure your volume is selected and then choose
Operations → Volume → Image Plane. An image plane appears showing a crosssection of your volume data. You can change the orientation of an image plane by
double-clicking on the image plane to bring up the property browser. You can also
click on the edge of the plane and move it to various other points in the volume data.
Figure 14-5: Image Plane of a Rendered Volume
Viewing the Image Plane in iImage
Image plane data is available in Data Manager and can be utilized in the iImage tool
for closer image analysis. The image plane image data is always a four-channel
RGBA truecolor image. To view your image plane in iImage, from the iVolume tool
select Operations → Image Plane → Launch iImage.
iTool User’s Guide
Showing an Image Plane
316
Chapter 14: Working with Volumes
Extracting an IsoSurface
An isosurface is a set of polygons drawn in the volume to represent a surface that has
a specific constant value (the isovalue). An isosurface cannot be translated, scaled, or
rotated relative to the volume but does move with the volume.
To create an isosurface, select Operations → Volume → Isosurface and iVolume
displays a dialog allowing you to specify the isovalue. If the volume is multi channel,
you can select a channel and set its isovalue.
Figure 14-6: Isosurface Value Selector for iVolume
Extracting an IsoSurface
iTool User’s Guide
Chapter 14: Working with Volumes
317
You will then create an isosurface for that channel by selecting OK.
Figure 14-7: Isosurfaced Rendered Volume
Note
Isosurfaces often contain a large number of polygons, which may degrade
iVolume’s display performance. When selecting the isovalue, you can also specify a
decimation percentage to reduce the number of polygons in the resulting isosurface.
This decimation step requires additional time, but the resulting isosurface will
contain fewer triangles and will draw faster.
Consider adding a light to improve the isosurface display. Select Insert → Light to
add a light.
iTool User’s Guide
Extracting an IsoSurface
318
Chapter 14: Working with Volumes
Extracting an Interval Volume
An interval volume is a set of tetrahedra that span a space between two isovalues
within a volume. Since a tetrahedral mesh is a solid, iVolume displays the outer
surface of the mesh as a set of polygons. This surface cannot be translated, scaled, or
rotated relative to the volume but does move with the volume.
To create an interval volume, select Operations → Volume → Interval Volume,
and a dialog appears allowing you to set two isovalues.
Figure 14-8: Interval Volume Value Selector for iVolume
Extracting an Interval Volume
iTool User’s Guide
Chapter 14: Working with Volumes
319
If the volume is multi channel, you can select a channel for setting the isovalues and
then create an interval volume for that channel by selecting OK.
Figure 14-9: Interval Volume
Note
Vertex colors are not persevered during decimation.
Note
Interval volume surfaces often contain a large number of polygons, which can
degrade iVolume’s display performance. When selecting isovalues, you can specify
a decimation percentage to reduce the number of polygons in the resulting surface.
This decimation step requires additional time, but the resulting surface will contain
fewer triangles and will draw faster.
iTool User’s Guide
Extracting an Interval Volume
320
Chapter 14: Working with Volumes
Manipulating the Volume Display
The iVolume tool allows you many options to manipulate your existing volume
displays. Once you have visualized your volume data, you may rotate, translate,
scroll, and zoom as well as modify volume properties. The following options are
available for manipulating volumes.
Rotating a Volume
Rotating makes it possible to rotate the volume within the visualization without
affecting the rest of the data space (graphical objects and axes). To rotate your
volume, from the toolbar on the iVolume window, select the Rotate button. For more
information about rotating, see “Rotation” on page 115.
Scaling a Volume
It is possible to scale the data within a volume by a specified scale factor. To scale
your volume, select Operations → Transform → Scale Data. For more information
on scaling data, see “Scaling” on page 65.
View Zoom
View Zoom allows you to zoom in or out on a specific area of the volume display
area. To zoom in or out in View Zoom mode click Zoom
on the toolbar. For more
information on working with View Zoom, see “Zooming” on page 70.
Canvas Zoom
Canvas Zoom allows you to increase or decrease the magnification of the entire
display canvas (which may contain multiple views, depending on the layout) by a
specified percentage. Canvas Zoom is available by selecting the pull-down
percentage list from the top of the tool just under the Help menu. For more
information on working with Canvas Zoom, see “Zooming” on page 70.
Adding Annotations
Annotations can be added to label or describe volume visualizations displayed in the
iVolume tool.
Manipulating the Volume Display
iTool User’s Guide
Chapter 14: Working with Volumes
321
The following types of annotations can be added to iVolume displays:
Plot
Annotation
Type
Description
Text
Single lines or multiple lines of text can be added to a
visualization to provide a label or description.
Line
Straight line annotations can be added to a visualization to link
labels to objects or to identify an object.
Rectangle
Rectangular annotations can be added to a visualization to
identify rectangular areas.
Oval
Oval annotations can be added to a visualization to identify
circular areas.
Polygon
Polygon annotations can be added to a visualization to identify
areas bounded by a multi-sided polygon.
Freehand
Freehand annotations can be added to a visualization to
identify an area.
Table 14-1: Types of Volume Annotations
For more information on creating and using annotations, see Chapter 5, “Adding
Annotations”.
iTool User’s Guide
Manipulating the Volume Display
322
Chapter 14: Working with Volumes
iVolume Tool Operations
Many operations are available in the iVolume tool. Once you have visualized your
volume data, you can scale and filter as well as creating a histogram or viewing
statistics for your volume. The following operations are available for volumes.
Viewing a Histogram
A density histogram is a plot consisting of either horizontal or vertical bars. The
widths or heights of these bars represent data values. Another type of histogram is a
style plot histogram which plots different data sets side-by-side using differently
styled points or bars to represent the data. To view a density histogram of volume
data, use the iTool’s histogram feature by selecting Operations → Histogram. For
information on histogram creation, see “Plotting a Histogram” on page 128.
Viewing Statistics
To view statistics for volume data, use the iTool’s statistics feature by selecting
Operations → Statistics. For information on viewing statistics, see “Displaying
Statistics” on page 129.
Smoothing a Volume
Within the iVolume tool, plots can also be smoothed to soften edges or compensate
for random noise in the volume.
To apply the smooth filter to a volume:
1. Select the volume.
2. Select Operations → Filter → Smooth.
Opening an Image Stack
iVolume allows you to open a group of images as an image stack within the tool. To
open images as an image stack select File → Open Image Stack... From the dialog,
select the images you wish to open using either Shift + right click if images are
consecutive or Ctrl + right click if nonconsecutive.
iVolume Tool Operations
iTool User’s Guide
Chapter 14: Working with Volumes
323
Note
Images are opened and stacked in the order they are named and not in the order of
selection. In other words file names are opened alphanumerically. The only way to
control the order of opening files is through the naming or renaming of files.
iTool User’s Guide
iVolume Tool Operations
324
iVolume Tool Operations
Chapter 14: Working with Volumes
iTool User’s Guide
Chapter 15
Working with Maps
This chapter describes how to use the map iTool.
Introduction . . . . . . . . . . . . . . . . . . . . . . . .
Displaying Maps . . . . . . . . . . . . . . . . . . . .
Applying a Map Projection . . . . . . . . . . . .
Using the Map Panel . . . . . . . . . . . . . . . . .
Displaying an Image . . . . . . . . . . . . . . . . .
iTool User’s Guide
326
327
328
332
334
Registering an Image . . . . . . . . . . . . . . . .
Displaying a Contour . . . . . . . . . . . . . . . .
Creating a Shape Visualization . . . . . . . .
Inserting a Map Grid . . . . . . . . . . . . . . . .
Inserting an IDL Shapefile . . . . . . . . . . . .
335
342
343
344
345
325
326
Chapter 15: Working with Maps
Introduction
The IDL iMap tool displays image and contour data that are georeferenced and
mapped to particular projections, as well as shapefile data. The iMap tool gives you
great flexibility in manipulating and visualizing these data. To use iMap, from the
IDL Command Line, type iMap. An empty iMap tool appears. You can then import
image or contour data using any of several data import methods. For more
information on importing data, see Chapter 2, “Importing and Exporting Data”.
Note
For more information on accepted arguments and keywords, see “IMAP” (IDL
Reference Guide).
The iMap tool can be launched in many different ways:
Introduction
•
At the IDL Command Line without arguments or keywords
•
At the IDL Command Line with arguments or keywords
•
Through the File → New → Visualization → iMap menu option in the IDL
Workbench
•
Through the File → New → iMap menu option in an iTool
iTool User’s Guide
Chapter 15: Working with Maps
327
Displaying Maps
The iMap tool’s primary goal is to visualize map data, though the tool is capable of
much more once the data is displayed. The iMap tool also allows you to manipulate
and edit the displays. The first task is to display the map data.
Your options for calling the iMap tool are:
•
At the IDL Command Line without arguments or keywords
•
At the IDL Command Line with arguments or keywords
Note
Arguments and keywords are accepted at the IDL Command Line for the
iMap tool, for more information on accepted arguments and keywords, see
“IMAP” (IDL Reference Guide).
•
Through the File → New → Visualization → iMap menu option in the IDL
Workbench
•
Through the File → New → iMap menu option in an iTool
You have two options for getting started with displaying a map. You can:
•
Apply a map projection and then visualize data within it
•
Visualize image or contour data and then apply a map projection to it
To get started with one of these options, see the following sections:
•
“Applying a Map Projection” on page 328
•
“Displaying an Image” on page 334
•
“Displaying a Contour” on page 342
iTool User’s Guide
Displaying Maps
328
Chapter 15: Working with Maps
Applying a Map Projection
A map projection establishes the axis type and coordinate conversion mechanism for
mapping points on the earth’s surface, expressed in latitude and longitude, to points
on a plane, according to one of several possible map projections.
You can apply a map projection before or after you import image or contour data into
the iMap tool. To do so, select Operations → Map Projection. This command
opens the Map Projection dialog, shown in Figure 15-1.
Figure 15-1: The Map Projection Dialog
You can apply a map projection to another iTool as well. If you do, the tool will adapt
to expose iMap functionality, including the iMap operations and the Map panel.
Applying a Map Projection
iTool User’s Guide
Chapter 15: Working with Maps
329
Table 15-1 shows the common projection properties.
Name
Description
Description
Description of the map projection
Show dialog
Show this dialog before executing the Map Projection
operation
Projection
Name of the map projection
Ellipsoid (datum)
Semimajor and -minor axes that define the ellipsoid
Semimajor axis
Length of the semimajor axis, in meters, for the reference
ellipsoid
Semiminor axis
Length of the semiminor axis, in meters, for the reference
ellipsoid
Center longitude (degrees)
Longitude in degrees of the projection’s center
Center latitude (degrees)
Latitude in degrees of the projection’s center
Longitude minimum (deg)
Minimum longitude to include in the projection, in degrees
Longitude maximum (deg)
Maximum longitude to include in the projection, in degrees
Latitude minimum (deg)
Minimum latitude to include in the projection, in degrees
Latitude maximum (deg)
Maximum latitude to include in the projection, in degrees
False easting (meters)
False easting to be added to each x-coordinate, in meters
False northing (meters)
False northing to be added to each y-coordinate, in meters
Table 15-1: Common Map Projection Properties
In addition to these properties, the following properties (Table 15-2) become
available depending on the selected projection:
Name
Description
Height (meters)
Height above surface, in meters, for satellite projections
Hemisphere
Hemisphere for UTM and Polar projections
HOM azimuth angle (deg)
Hotine Oblique Mercator azimuth angle (degrees) east
Table 15-2: Properties for Selected Map Projections
iTool User’s Guide
Applying a Map Projection
330
Chapter 15: Working with Maps
Name
Description
HOM latitude 1 (deg)
Hotine Oblique Mercator latitude, in degrees, of the first
point
HOM latitude 2 (deg)
Hotine Oblique Mercator latitude, in degrees, of the second
point
HOM longitude 1 (deg)
Hotine Oblique Mercator longitude, in degrees, of the first
point
HOM longitude 2 (deg)
Hotine Oblique Mercator longitude, in degrees, of the
second point
IS longitudinal zones
Intergerized Sinusoidal number of longitudinal zones
IS row justify flag
Integerized Sinusoidal flag that indicates what to do with
rows with an odd number of columns. The following
values are allowed:
• 0 — Indicates the extra column is on the right of the
projection y-axis
• 1 — Indicates the extra column is on the left of the
projection y-axis
• 2 — Calculates an even number of columns
Mercator scale
Scale factor at the central meridian (for the Transverse
Mercator projection) or the center of the projection (for the
Hotine Oblique Mercator projection)
NAD27 Zone name (FIPS)
NAD27 State Plane Coordinate System Zone (FIPSZone)
NAD83 Zone name (FIPS)
NAD83 State Plane Coordinate System Zone (FIPSZone)
OEA horizontal shape m
Oblated equal area horizontal (m) shape parameter
OEA vertical shape n
Oblated equal area vertical (n) shape parameter
OEA rotation angle (deg)
Oblated equal area rotation angle, in degrees
SOM end-of-path flag
Space Oblique Mercator Landsat end-of-path flag, where 0
is the start and 1 is the end
SOM inclination (deg)
Space Oblique Mercator orbit inclination angle, in degrees,
of the ascending node, counter-clockwise from the equator
Table 15-2: Properties for Selected Map Projections (Continued)
Applying a Map Projection
iTool User’s Guide
Chapter 15: Working with Maps
Name
331
Description
SOM Landsat number
Space Oblique Mercator Landsat number (Worldwide
Reference System)
SOM Landsat path
Space Oblique Mercator Landsat path number
SOM longitude (deg)
Space Oblique Mercator longitude, in degrees, of the
ascending node
SOM period (minutes)
Space Oblique Mercator satellite period, in minutes
SOM ratio
Space Oblique Mercator Landsat ratio that compensates for
confusion at the northern end of orbit
Standard parallel 1 (deg)
First standard parallel (degrees latitude) of true scale
Standard parallel 2 (deg)
Second standard parallel (degrees latitude) of true scale
Zone (1-60)
Universal Transverse Mercator (UTM) grid zone number
(must be negative for zones in the southern hemisphere)
Table 15-2: Properties for Selected Map Projections (Continued)
Note
The map projection properties are normally taken from the currently selected
dataspace. However, in the Operations Browser, the map projection properties are
registered on the operation itself. Changing these properties in the Operations
Browser will have no affect on the currently selected dataspace. If the Show Dialog
property is set to False and then the Map Projection operation is activated, the
projection properties will be copied directly from the Map Projection operation onto
the currently selected dataspace.
Note
Each projection has default longitude and latitude limits. If you have not modified
one of these limits (the longitude and latitude minimum and maximum properties),
the Map Projection operation will automatically use its default limit. However, if
you have modified one of these limits, the Map Projection operation will use either
your desired limit or the default limit, whichever is smaller.
iTool User’s Guide
Applying a Map Projection
332
Chapter 15: Working with Maps
Using the Map Panel
The iMap tool has a Map panel (Figure 15-2) that lets you manipulate the map
display. The panel also appears when you apply a map projection or shapefile into
another iTool.
Figure 15-2: The Map Panel in the iMap Tool
Using the Map Panel
iTool User’s Guide
Chapter 15: Working with Maps
333
Table 15-3 describes the items on the Map panel.
Name
Location
Description
Displays the following information:
• If no map projection is applied — the cursor location in
degrees longitude/latitude or meters, depending on the
image units
• If a map projection is applied — the cursor location in
degrees longitude/latitude and the corresponding
Cartesian X/Y (or U/V) coordinates in meters
Sensitive only if an image or a contour is selected.
Data Value
Displays the following information:
• For an image — the data value and corresponding
grayscale or RGB value for the current cursor location
(identical to Pixel Value on the Image panel)
• For a contour — the data value for the current cursor
location
Sensitive only if an image or contour visualization is
selected.
Longitude limits
Displays the active map projection’s maximum and
minimum longitude values. Enter new values to update
these limits.
Sensitive only if a dataspace (or a visualization within the
dataspace) with a map projection is selected.
Latitude limits
Displays the active map projection’s maximum and
minimum latitude values. Enter new values to update these
limits.
Sensitive only if a dataspace (or a visualization within the
dataspace) with a map projection is selected.
Edit Projection...
Opens the Map Projection dialog for the currently active
dataspace. For more information, see “Applying a Map
Projection” on page 328.
Table 15-3: Items on the Map Panel
iTool User’s Guide
Using the Map Panel
334
Chapter 15: Working with Maps
Displaying an Image
You can visualize image data in the iMap tool as you would in the iImage tool. To
learn more about visualizing image data, see “Displaying Images” on page 209.
Note
By default, the iMap tool creates an image visualization if given a 2D array or a
Truecolor image. This image is warped internally to fit the map projection, if one is
present. The actual image data itself remains unchanged.
When you open an image in the iMap tool, you need to register the image to define
how the pixel data corresponds to points on the earth’s surface. For more information
on this process, see “Registering an Image” on page 335.
Once you have image data in the iMap tool, all of the features of the iImage tool are
available. For more information, see Chapter 10, “Working with Images”.
You can export the mapped image by selecting File → Export. When the IDL Data
Export wizard opens, choose the “To a file” option, the image visualization to save,
and the output file format. The result will be the image warped to the current map
projection.
Note
Depending on the map projection, the alpha channel might be used to mask out
pixels outside the map boundary. In this case, you can export the image to a file
format that supports four channels, such as TIFF, PNG, or JPEG2000.
Displaying an Image
iTool User’s Guide
Chapter 15: Working with Maps
335
Registering an Image
The Map Register Image wizard, shown in Figure 15-3, registers an image’s data,
creating a correspondence between the image pixels and points on the earth’s surface.
This registration step is necessary to let the iMap tool properly display the image data
in the map projection you select.
The wizard launches automatically when you import image data or open an image
file for which not all necessary map information is known. To launch the wizard after
the image is open and registered (e.g., if you want to change the registering
properties), select Operations → Map Register Image.
Figure 15-3: The Map Register Image Wizard — Step 1
The coordinates are in either meters or degrees; which units you choose for the
translation can affect how the image appears in a map projection. Selecting meters
means that the image data have already been warped to a particular projection, and
you need to tell IDL which projection to use in displaying the image. Selecting
iTool User’s Guide
Registering an Image
336
Chapter 15: Working with Maps
degrees, on the other hand, means that the image data are not already warped, so you
do not need to specify a map projection for the image. It is important that you know
in which units your data are, to make the correct decision when registering the image
for display.
The Map Register Image wizard reflects this difference between the units by having
three steps for meters and two for degrees:
1. Select the coordinate units.
2. Set the pixel minimum, maximum, and size values.
3. (Meters only) Specify the map projection to associate with the image and, if
desired, with the dataspace as well.
Once you have set these registering properties and map projection (if applicable),
IDL registers the image data, and the iMap tool displays the image and the Image
panel along with the Map panel.
Note
If the image being registered was originally from either a TIFF file containing
GeoTIFF tags or a JPEG2000 file containing a GeoTIFF UUID box, an additional
button, Show GeoTIFF tags, is available on the latter dialogs of the Map Register
Image wizard (Steps 2 and 3 for meters, Step 2 for degrees). Pressing this button
brings up a separate text window containing the GeoTIFF tags, which can be useful
in determining the map registration properties.
For a list of GeoTIFF tags, see the GEOTIFF keyword in “READ_TIFF” (IDL
Reference Guide). For more information on JPEG2000 with GeoTIFF, see
http://www.remotesensing.org/jpeg2000/.
The rest of this section describes the two registration pathways, with meters or with
degrees, in more detail.
Registering an Image
iTool User’s Guide
Chapter 15: Working with Maps
337
Registering an Image in Meters
If you select Meters as the coordinate units in Step 1 and click on Next, you see the
wizard’s Step 2 dialog for meters, shown in Figure 15-4.
Figure 15-4: The Map Register Image Wizard — Step 2 (Meters)
Table 15-4 shows the properties associated with meter coordinates.
Name
Description
X (or U) minimum (meters)
Minimum position in the x (or u)
direction, in meters, of the image data
X (or U) maximum (meters)
Maximum position in the x (or u)
direction, in meters, of the image data
Table 15-4: Meter Coordinate Properties
iTool User’s Guide
Registering an Image
338
Chapter 15: Working with Maps
Name
Description
X (or U) pixel size (meters)
Pixel size, in meters, in the x (or u)
direction
Y (or V) minimum (meters)
Minimum position in the y (or v)
direction, in meters, of the image data
Y (or V) maximum (meters)
Maximum position in the y (or v)
direction, in meters, of the image data
Y (or V) pixel size (meters)
Pixel size, in meters, in the y (or v)
direction
Table 15-4: Meter Coordinate Properties (Continued)
Note
The (u.v) coordinates refer to the UV plane of a cylindrical projection.
Entering the minimum value and the pixel size automatically updates the maximum
value.
Registering an Image
iTool User’s Guide
Chapter 15: Working with Maps
339
Figure 15-5 shows the final step in the Map Register Image wizard for the Meters
option.
Figure 15-5: The Map Register Image Wizard: Step 3 (Meters)
In this step, you can select a map projection to associate with the image. You also
have the option of updating the dataspace map projection to use this projection.
iTool User’s Guide
Registering an Image
340
Chapter 15: Working with Maps
Registering an Image in Degrees
If you select Degrees as the coordinate units in Step 1 and click on Next, you see the
wizard’s Step 2 dialog for degrees, shown in Figure 15-6.
Figure 15-6: The Map Register Image Wizard: Step 2 (Degrees)
Table 15-5 shows the properties associated with degree coordinates.
Name
Description
Longitude minimum (deg)
Minimum longitude position, in
degrees, of the image data
Longitude maximum (deg)
Maximum longitude position, in
degrees, of the image data
Table 15-5: Degree Coordinate Properties
Registering an Image
iTool User’s Guide
Chapter 15: Working with Maps
341
Name
Description
Longitude pixel size (deg)
Pixel size, in degrees, in the longitude
direction
Latitude minimum (deg)
Minimum latitude position, in degrees,
of the image data
Latitude maximum (deg)
Maximum latitude position, in
degrees, of the image data
Latitude pixel size (deg)
Pixel size, in degrees, in the latitude
direction
Table 15-5: Degree Coordinate Properties (Continued)
Entering the minimum value and the pixel size automatically updates the maximum
value.
iTool User’s Guide
Registering an Image
342
Chapter 15: Working with Maps
Displaying a Contour
You can visualize contour data in the iMap tool as you would in the iContour tool. To
learn more about visualizing contour data, see “Displaying Contours” on page 257.
Once you have contour data in the iMap tool, all of the features of the iContour tool
are available. For more information, see Chapter 12, “Working with Contours”.
Displaying a Contour
iTool User’s Guide
Chapter 15: Working with Maps
343
Creating a Shape Visualization
A shapefile stores nontopological geometry and attribute information for the spatial
features in a data set. The shapefile format was created by ESRI, and is widely used
in the geographic information systems community. The iTools display a shapefile’s
data by creating one of three special visualization types: ShapePolygon,
ShapePolyline, and ShapePoint. The type of visualization created depends on the
type of data in the shapefile.
Note
For more information on the shape visualizations, see “Visualization Type
Properties” on page 437.
You can create a shape visualization in one of the following ways:
•
Using File → Open and selecting the shapefile
•
Using File → Import to launch the Data Import Wizard, and selecting the
shapefile
•
Using Insert → Visualization and either selecting the appropriate shape
visualization type (if you have already imported the shape data into an iTool)
or selecting the shapefile whose data you want to import for a shape
visualization
Note
When creating a shape visualization using File → Import or
Insert → Visualization, if the shapefile contains more than one item (polygon,
polyline, or point), you can choose to create a single visualization containing all of
the included items, or to create an individual visualization for each item in the file.
iTool User’s Guide
Creating a Shape Visualization
344
Chapter 15: Working with Maps
Inserting a Map Grid
The Insert → Map → Grid operation creates a longitude-latitude grid (Figure 15-7)
within the current dataspace, using the current projection. If no projection is active,
then IDL uses geographic coordinates.
Figure 15-7: The Map Grid
The gridlines appear as a single MapGrid object within the current dataspace. For
information on this visualization, see “Map Grid” on page 500.
Note
When you insert a map grid, the Axes container within the dataspace is
automatically hidden. To display the axes, use the Visualization Browser to change
the Show property of the Axes container.
Inserting a Map Grid
iTool User’s Guide
Chapter 15: Working with Maps
345
Inserting an IDL Shapefile
IDL comes with several shapefiles that you can insert in the iMap tool or in another
iTool that has a map projection already applied. These files originated from the ESRI
Data and Maps CD-ROM data set (1999, 2000, 2002) and can be found, along with
their associated database (.dbx) and index (.shx) files, in the
resource/maps/shape directory of the IDL installation. Also see “Overview of
ESRI Shapefiles” (Chapter 30, IDL Reference Guide) for more detailed information
on shapefiles.
Inserting the Continents
The Insert → Map → Continents operation loads the continents.shp file and
displays the continents as a single ShapePolygon (Figure 15-8) in the current
dataspace, using the current projection. If no projection is active, then IDL uses
geographic coordinates.
Figure 15-8: The Continents Shapefile
iTool User’s Guide
Inserting an IDL Shapefile
346
Chapter 15: Working with Maps
Inserting the Countries (Low Resolution)
The Insert → Map → Countries (low res) operation loads the country.shp file
and displays the countries (boundaries as of 2002) as separate ShapePolygons (Figure
15-9) in the current dataspace, using the current projection. If no projection is active,
then IDL uses geographic coordinates. The ShapePolygons exist in a Countries (low
res) visualization container.
Figure 15-9: The Countries (Low Res) Shapefile
Inserting the Countries (High Resolution)
The Insert → Map → Countries (high res) operation loads the cntry02.shp file
and displays the countries (boundaries as of 2002) as separate ShapePolygons (Figure
15-10) in the current dataspace, using the current projection. If no projection is active,
Inserting an IDL Shapefile
iTool User’s Guide
Chapter 15: Working with Maps
347
then IDL uses geographic coordinates. The ShapePolygons exist in a Countries (high
res) visualization container.
Figure 15-10: The Countries (High Res) Shapefile
iTool User’s Guide
Inserting an IDL Shapefile
348
Chapter 15: Working with Maps
Inserting the Rivers
The Insert → Map → Rivers operation loads the rivers.shp file and displays the
rivers as separate ShapePolylines (Figure 15-11) in the current dataspace, using the
current projection. If no projection is active, then IDL uses geographic coordinates.
The ShapePolylines exist in a Rivers visualization container.
Figure 15-11: The Rivers Shapefile (Continents Added for Context)
Inserting an IDL Shapefile
iTool User’s Guide
Chapter 15: Working with Maps
349
Inserting the Lakes
The Insert → Map → Lakes operation loads the lakes.shp file and displays the
lakes as separate ShapePolygons (Figure 15-12) in the current dataspace, using the
current projection. If no projection is active, then IDL uses geographic coordinates.
The ShapePolygons exist in a Lakes visualization container.
Figure 15-12: The Lakes Shapefile (Continents Added for Context)
iTool User’s Guide
Inserting an IDL Shapefile
350
Chapter 15: Working with Maps
Inserting the United States
The Insert → Map → United States operation loads the states.shp file and
displays the states as separate ShapePolygons (Figure 15-13) in the current dataspace,
using the current projection. If no projection is active, then IDL uses geographic
coordinates. The ShapePolygons exist in a United States visualization container.
Figure 15-13: The United States Shapefile
Inserting an IDL Shapefile
iTool User’s Guide
Chapter 15: Working with Maps
351
Inserting the Canadian Provinces
The Insert → Map → Canadian Provinces operation loads the
canadaprovince.shp file and displays the provinces as separate ShapePolygons
(Figure 15-14) in the current dataspace, using the current projection. If no projection
is active, then IDL uses default longitude-latitude coordinates. The ShapePolygons
exist in a Canadian Provinces visualization container.
Figure 15-14: The Canadian Provinces Shapefile
iTool User’s Guide
Inserting an IDL Shapefile
352
Inserting an IDL Shapefile
Chapter 15: Working with Maps
iTool User’s Guide
Chapter 16
Working with Vectors
This chapter describes vectors and the iVector tool.
Introduction . . . . . . . . . . . . . . . . . . . . . . . . 354
Displaying Vectors . . . . . . . . . . . . . . . . . . . 355
Vector Properties . . . . . . . . . . . . . . . . . . . . 360
iTool User’s Guide
Manipulating the Vector Visualization . . . 363
iVector Tool Operations . . . . . . . . . . . . . . 365
Vectors and Mapping . . . . . . . . . . . . . . . . 367
353
354
Chapter 16: Working with Vectors
Introduction
The IDL iVector tool displays data in vector form. A vector is a line segment that has
both length (magnitude) and direction. Magnitude and direction are expressed using
two components, the “east-west” component (or U) and the “north-south” component
(or V).
The iVector tool displays two-dimensional vector flow fields. Examples of data that
can be visualized using vector flow fields are ocean currents, wind, and fluid flows.
Data can be visualized as vectors (arrows), wind barbs, or streamlines, and can be
located on a regular or irregular grid or can be georeferenced. You can control all
aspects of these visualizations, including arrow style and size, coloring by magnitude,
direction, or another dataset, data location, missing data, streamline particles, and
subsampling.
For more information about importing vector data see Chapter 2, “Importing and
Exporting Data”.
Note
For more information on accepted arguments, see “IVECTOR” (IDL Reference
Guide).
The iVector tool can be launched in the following ways:
Introduction
•
At the IDL Command Line without arguments or keywords
•
At the IDL Command Line with arguments or keywords
•
Through the File → New → Visualization → iVector menu option in the IDL
Workbench
•
Through the File → New → iVector menu option in an iTool
iTool User’s Guide
Chapter 16: Working with Vectors
355
Displaying Vectors
The iVector tool’s primary purpose is to display vector data, though the tool is
capable of much more once the data is visualized. The iVector tool can display
multiple types of vectors and allows you to manipulate and edit the displays.
The first task is to display vector data. The following sections are examples of how to
display various types of vector data.
Vector Fields
In a vector field, each datum is represented by a small arrow, with a length
proportional to the magnitude of the flow at that location, and pointing in the
direction of the flow.
The following example shows the flow produced by vectors of the form (-Y, X). To
create this flow in IDL, enter the following code at the Command Line:
x = (y = FINDGEN(21) - 10)
u = REBIN(-TRANSPOSE(y),21,21)
v = REBIN(x,21,21)
IVECTOR, u, v, x, y, AUTO_COLOR=1, $
RGB_TABLE=39, SCALE_ISOTROPIC=1
iTool User’s Guide
Displaying Vectors
356
Chapter 16: Working with Vectors
Figure 16-1: Vector Field Showing Flow
Note
The setting AUTO_COLOR=1 sets the color of each vector according to its
magnitude. The ISOTROPIC setting ensures that the X and Y coordinates have the
same scaling.
Wind Barbs
Vector data represented using wind barbs shows data using arrow shafts with barbs
and flags. The direction of the arrow indicates the direction of the wind flow. Barbs
and flags represent wind speed in knots. A short barb represents 5 knots while each
Displaying Vectors
iTool User’s Guide
Chapter 16: Working with Vectors
357
long barb represents 10 knots. Each flag represents 50 knots. Collectively, the barbs
and flags indicate the magnitude on each arrow, using the following conventions:
Speed (knots)
Symbol
0 - 0.5
Dot
0.5 - 2.5
Shaft only
____
2.5 - 7.5
Short barb
`___
7.5 - 12.5
Long barb
\___
12.5 - 17.5
Long + short barb \`__
17.5 - 22.5
Two long barbs
47.5 - 52.5
Flag
\\__
/\__
By convention, for geographic data (GRID_UNITS=1 or 2) the barbs and flags point
in the clockwise direction in the Northern hemisphere and counterclockwise in the
Southern hemisphere. For non-geographic data (GRID_UNITS=0) the barbs and
flags always point in the clockwise direction.
The following example shows the wind barbs produced by a field of the form (-Y, X).
In this example the VECTOR_STYLE keyword sets the style to wind barbs. To
create these wind barbs in IDL, enter the following code at the Command Line:
x = (y = 2*FINDGEN(11) - 10)
u = 9*REBIN(-TRANSPOSE(y),11,11)
v = 9*REBIN(x,11,11)
IVECTOR, u, v, x, y, VECTOR_STYLE=1
iTool User’s Guide
Displaying Vectors
358
Chapter 16: Working with Vectors
Figure 16-2: Wind Barbs in iVector
Displaying Vectors
iTool User’s Guide
Chapter 16: Working with Vectors
359
Streamlines
Streamlines visualize the movement of a set of massless particles through the vector
field. The points are tracked by treating the vector field as a velocity field and
integrating it. Each path is tracked until the path leaves the input field or a maximum
number of steps is reached. You can use keywords to set the number of particles, the
integration step size, and the number of steps.
The following example shows the streamlines produced by a random vector field. To
create these streamlines in IDL, enter the following code at the Command Line:
u = RANDOMU(1,20,20) - 0.5
v = RANDOMU(2,20,20) - 0.5
IVECTOR, u, v, /STREAMLINES, $
X_STREAMPARTICLES=10, Y_STREAMPARTICLES=10, $
HEAD_SIZE=0.1, STREAMLINE_NSTEPS=200
Figure 16-3: Streamlines in iVector
Note
For details on the streamline keywords, see “IVECTOR” (IDL Reference Guide).
Also see “Adding and Modifying Streamlines” on page 365.
iTool User’s Guide
Streamlines
360
Chapter 16: Working with Vectors
Vector Properties
The iVector window is a self-contained vector visualization and manipulation device.
You can import and export vector data, and modify and manipulate vector data. For
more information on the basic iVector interface and its layout, see Appendix A,
“iTools Interface Reference”.
Modifying Properties
By selecting Edit → Properties from the iVector tool, you may modify your vector
properties. You may modify your vector visualization’s name, description, grid units,
style, arrow properties, direction convention, as well as the show/hide properties. For
more information on editing properties in the iTools, see Appendix D, “Visualization
Properties”.
Subsampling
If you have a vector dataset with a large number of vectors, and thus very high
resolution, seeing individual vectors may be difficult. Subsampling allows you to
decrease the number of displayed vectors, making it easier to view the vector dataset.
You can set subsampling using keywords to iVector from the command line or from
the iVector visualization’s property sheet.
The following table shows subsampling functions and how you can invoke them.
Function
Command Line
Method
Visualization
Browser
Method
Options
X
Subsampling
Factor
Set the X_SUBSAMPLE
keyword to IVECTOR
Edit → Properties Set to a value
select X
(from 1 to any
subsample factor positive value)
Y
Subsampling
Factor
Set the Y_SUBSAMPLE
keyword to IVECTOR
Edit → Properties Set to a value
select Y
(from 1 to any
subsample factor positive value)
Subsampling
Method
Set the
SUBSAMPLE_METHOD
keyword to IVECTOR
Edit → Properties Set to Nearest
set Subsampling
neighbor or
method
Linear
Table 16-1: iVector Subsampling
Vector Properties
iTool User’s Guide
Chapter 16: Working with Vectors
361
For example, a subsampling factor of 2 for both x and y indicates that every other
vector will be displayed. A subsampling factor of 10 indicates that one out of every
10 vectors will be displayed.
Autosubsampling
You can also enable autosubsampling. Autosubsampling will automatically decrease
the number of displayed vectors, based on the current view zoom factor. Zooming out
(a smaller zoom percentage) will increase subsampling factors, in turn decreasing the
number of displayed vectors. Zooming in (a larger zoom percentage) will decrease
subsampling factors, in turn increasing the number of displayed vectors. The
following table shows the two ways to enable autosubsampling.
Function
Autosubsampling
Command Line
Method
Visualization
Browser Method
Use the
AUTO_SUBSAMPLE
keyword to IVECTOR
choose
Edit → Properties
and set Automatic
subsampling
Options
• For
Command
Line, set to
enable,
default is
disabled
• For
visualization
browser, set
to True to
enable,
Default is
False
(disabled)
Table 16-2: Enabling Autosubsampling for iVector
iTool User’s Guide
Vector Properties
362
Chapter 16: Working with Vectors
Coloring Vectors Using Auxiliary Data
Imagine you have global wind data and want to color each wind vector according to
the surface temperature at that location. In a case like this you want to visualize your
vector data using one dataset for the magnitude and direction, and another dataset for
the color of each vector.
There are two ways to do this:
•
Use the VECTOR_COLORS keyword from the command line — For more
information about using this keyword, see “IVECTOR” (IDL Reference
Guide).
•
Attach a dataset to the Vector Colors parameter in the Parameter Editor — To
do this select your dataset and then go to Edit → Parameters... to bring up the
Parameter Editor.
Your auxiliary dataset can be either integer or floating-point type. For either type, the
data will automatically be scaled into the 0-255 range to be used as the color indices.
These color indices are then converted into actual colors as given by your current
palette for the vector visualization.
If you insert a colorbar (Insert → Colorbar), the colorbar axis will have the correct
(original) range for your auxiliary dataset.
Vector Properties
iTool User’s Guide
Chapter 16: Working with Vectors
363
Manipulating the Vector Visualization
The iVector tool gives you many options to manipulate your existing vector
visualizations. Once you have visualized your vector data, you may rotate, flip,
translate, scale, and zoom as well as modify vector properties. The following options
are available for manipulating vectors.
Translating
Translation moves an object or group of objects in a specific direction. When an
object is selected, a bounding box appears around the object. For information on
translating objects, see “Translation” on page 64.
Adding Annotations
The following types of annotations can be added to iVector displays:
Vector
Annotation
Type
Description
Text
Single lines or multiple lines of text can be added to a
visualization to provide a label or description.
Line
Straight line annotations can be added to a visualization to link
labels to objects or to identify an object.
Rectangle
Rectangular annotations can be added to a visualization to
identify rectangular areas.
Oval
Oval annotations can be added to a visualization to identify
elliptical areas.
Polygon
Polygon annotations can be added to a visualization to identify
areas bounded by a multi-sided polygon.
Freehand
Freehand annotations can be added to a visualization to
identify an area.
Table 16-3: Types of Vector Annotations
For more information on creating and using annotations, see Chapter 5, “Adding
Annotations”.
iTool User’s Guide
Manipulating the Vector Visualization
364
Chapter 16: Working with Vectors
View Zoom
View Zoom allows you to zoom in or out on a specific area of the vector display area.
To zoom in or out in View Zoom mode click Zoom
on the toolbar. For more
information on working with View Zoom, see “Zooming” on page 70.
Canvas Zoom
Canvas Zoom allows you to increase or decrease the magnification of the entire
display canvas (which may contain multiple views, depending on the layout) by a
specified percentage. Canvas Zoom is available by selecting the pull-down
percentage list from the top of the tool just under the Help menu. For more
information on working with Canvas Zoom, see “Zooming” on page 70.
Manipulating the Vector Visualization
iTool User’s Guide
Chapter 16: Working with Vectors
365
iVector Tool Operations
Many operations are available in the iVector tool. Once you have visualized your
vector data, you can add streamlines or contours. The following operations are
available for vectors.
Adding and Modifying Streamlines
When a vector visualization is selected, choosing
Operations → Vector → Streamlines will bring up the Streamlines operation
dialog:
Figure 16-4: The Streamlines Operation Dialog
From this dialog you can control the number of x and y particles, and the number and
size of streamline steps. The dialog only contains the properties that directly affect
the current streamline data.
After making any desired streamline setting adjustments, select OK to insert a new
streamline visualization into the existing dataspace.
iTool User’s Guide
iVector Tool Operations
366
Chapter 16: Working with Vectors
The property sheet for the streamline visualization contains additional properties that
affect both the streamline data and the visualization. To see the streamline properties,
select (with the streamline visualization selected) Edit → Properties...
Figure 16-5: Editing Streamline Properties in the Visualization Browser
These properties and their values are described in “Vector” in Appendix D:
Visualization Properties.
Adding Magnitude Contours
When a vector or streamline visualization is selected, choose
Operations → Vector → Contour Magnitude to insert a contour visualization
using the magnitudes of the vector data. To modify the contour properties, select
(with the contour visualization selected) Edit → Properties...
Adding Direction Contours
When a vector or streamline visualization is selected, choose
Operations → Vector → Contour Direction to insert a contour visualization using
the directions of the vector data. To modify the contour properties, select (with the
contour visualization selected) Edit → Properties...
iVector Tool Operations
iTool User’s Guide
Chapter 16: Working with Vectors
367
Vectors and Mapping
If you insert a map projection into an iTool with an existing vector visualization, or if
you insert a vector visualization into an iTool with an existing map projection, IDL
will attempt to determine whether the vector visualization should be warped using the
current map projection.
If the X coordinates of the vector visualization are in the range from -180 to 180 and
the Y coordinates are in the range from -90 to 90, the locations of the vectors are
assumed to represent longitude and latitude. In this case, the location of each vector is
warped to the current map projection. If the X and Y coordinates are not in this range,
the vector locations are not warped.
Note
The locations and directions of vectors are warped, but their magnitudes are not.
The magnitude is assumed to be independent of the grid units.
You can override the default behavior by setting the Grid units property of the vector
visualization or by specifying the value of the GRID_UNITS keyword to IVECTOR:
•
Setting the value of the Grid units property to 1 (meters) indicates that the
vector locations are already correctly located on a particular map projection
(assumed to be in meters). In this case, you should then also set the dataspace
map projection to match your map projection, so that any images or shapefiles
are warped to the correct map projection.
•
Setting the value of the Grid units property to 2 (degrees) indicates that the
vector locations are in degrees of longitude and latitude, and that these
locations should be warped to the map projection.
•
Setting the value of the Grid units property to 0 (Not applicable) indicates that
the vector grid is in arbitrary units that are not tied to a map projection.
iTool User’s Guide
Vectors and Mapping
368
Vectors and Mapping
Chapter 16: Working with Vectors
iTool User’s Guide
Appendix A
iTools Interface
Reference
This appendix describes the following common features of the IDL Intelligent Tools interface:
Introduction to iTools Interface Elements .
File Menu . . . . . . . . . . . . . . . . . . . . . . . . . .
Edit Menu . . . . . . . . . . . . . . . . . . . . . . . . .
Insert Menu . . . . . . . . . . . . . . . . . . . . . . . .
Operations Menu . . . . . . . . . . . . . . . . . . . .
Window Menu . . . . . . . . . . . . . . . . . . . . . .
iTool User’s Guide
370
371
373
376
377
380
Help Menu . . . . . . . . . . . . . . . . . . . . . . . .
File Toolbar . . . . . . . . . . . . . . . . . . . . . . .
Edit Toolbar . . . . . . . . . . . . . . . . . . . . . . .
Manipulator Toolbar . . . . . . . . . . . . . . . . .
Annotation Toolbar . . . . . . . . . . . . . . . . . .
Context Menu . . . . . . . . . . . . . . . . . . . . . .
382
383
384
385
386
387
369
370
Appendix A: iTools Interface Reference
Introduction to iTools Interface Elements
The Standard IDL Intelligent Tools comprise seven distinct tools: iImage, iPlot,
iSurface, iContour, iVolume, iMap, and iVector. Each tool has a specific set of
functions related to the type of data it is designed to use. In addition to these specific
tasks, all four tools have a number of functions in common. This appendix describes
those functions that all iTools have in common; for information about the functions
unique to the individual iTools, refer to the chapters describing those tools.
This appendix is an overview of these menu items and toolbar buttons that are
common to all iTools:
Menu Bar Items
The following menus appear on the iTool menu bar:
•
File Menu
•
Edit Menu
•
Insert Menu
•
Operations Menu
•
Window Menu
•
Help Menu
Toolbar Items
The following toolbars appear at the top of each iTool window:
•
The File toolbar, containing the New, Open, Save, and Print buttons.
•
The Edit toolbar, containing the Undo, Redo, Cut, Copy, and Paste buttons.
•
The Manipulator toolbar, containing the Select, Rotate, and View Pan buttons.
•
The View Zoom button and View Zoom drop-down list.
•
The Annotation toolbar, containing the Text and line buttons as well as the
Line, Rectangle, Oval, Polygon, and Freehand annotation buttons.
Introduction to iTools Interface Elements
iTool User’s Guide
Appendix A: iTools Interface Reference
371
File Menu
The File menu contains tools for creating, opening, printing and saving files, as well
as tools for importing and exporting data and images. The File menu items are
common to all standard iTools.
Menu
Selection
Keyboard
Accelerator
Function
New
Ctrl+N
Creates a new iTool of the specified type.
Options: iImage, iPlot, iSurface, iContour,
iVolume, iMap, and iVector.
Open...
Ctrl+O
Opens a file for import into the current iTool.
If this is a data file, such as an image file,
ASCII file, or binary file, a new data object
will be created and, if applicable, a new
visualization will be created.
Import...
Imports an IDL variable or file to the current
iTool. See “Data Import Methods” on page 27
for details.
Export...
Exports the data from the currently-selected
object to the IDL main program level, or
exports the current window to an image file.
Save
Ctrl+S
Saves the state of the current iTool to a file. If
the state has not been previously saved and has
no filename, enter a filename.
Save As...
Prompts you to enter a filename and then saves
the state of the current iTool.
Print Preview...
Shows a preview of the visualization to print
and allows you to reorient (Portrait or
Landscape) as well as center, print, close, or
change printer setup.
Print...
Ctrl+P
Sends the current view of the contents of the
graphics window to the specified printer via
the standard Windows or Motif printer dialog.
Table A-4: The File Menu
iTool User’s Guide
File Menu
372
Appendix A: iTools Interface Reference
Menu
Selection
Keyboard
Accelerator
Preferences...
Exit
Function
Displays the Preferences Browser. See “The
Preferences Browser” on page 95 for details.
Ctrl+Q
Exits the iTool window, closing all
visualizations and views within the window
and removing them from memory.
Table A-4: The File Menu (Continued)
File Menu
iTool User’s Guide
Appendix A: iTools Interface Reference
373
Edit Menu
The Edit menu contains tools for editing and deleting data within the tool, retracing
your steps with the Undo/Redo commands, and displaying properties for selected
objects. The Edit menu items are common to all standard iTools.
Menu
Selection
Undo
Keyboard
Accelerator
Ctrl+Z
Function
Nullifies the previous operation and restores
the iTool to its state before that operation. The
name of the previous operation appears after
Undo.
Note - Operations such as open, save, export,
export variable, print, exit, and window
moving and resizing cannot be undone.
Redo
Ctrl+Y
Nullifies the previous Undo command and
restores the iTool to its state before the Undo
command was issued. Any action that can be
undone can also be redone.
Cut
Ctrl+X
Deletes the selected item(s) and places a copy
on the local clipboard.
Copy
Ctrl+C
Copies the selected item to the local clipboard.
If a view is copied, then a bitmap copy of that
view (not the entire Window) is also put on the
System clipboard.
Note - You may change the magnification
(resolution) of the bitmap copy using the Edit
Copy property sheet.
Paste
Ctrl+V
Pastes the current local clipboard contents into
the selected view. If a view is pasted, it is
added to the current Window layout and
becomes the currently-selected view.
Table A-5: The Edit Menu
iTool User’s Guide
Edit Menu
374
Appendix A: iTools Interface Reference
Menu
Selection
Keyboard
Accelerator
Paste Special
Delete
Function
Pastes the current local clipboard contents into
the selected view, and makes a reference to all
contained data.
Del
Deletes the currently-selected item(s), without
putting a copy on the local or system
clipboards. Deletion can be reversed with
Undo.
Select All
Selects all items in the current view.
Grouping
Select Group to add all selected objects to a
group, Ungroup to remove them from the
group.
Order
Change the display order of the selected
object(s).Choose from these options:
• Bring to Front: Move selected object(s)
to the top display level.
• Send to Back: Move selected object(s) to
the bottom display level.
• Bring Forward: Move selected object(s)
up one display level.
• Send Backward: Move selected object(s)
down one display level.
Style
Selections related to iTool’s styles.
• Apply Style: Applies current style to your
iTool visualization.
• Create Style from Selection: Creates a
new style from selected visualization
items.
• Style Editor: Brings up the Style Editor
dialog.
Table A-5: The Edit Menu (Continued)
Edit Menu
iTool User’s Guide
Appendix A: iTools Interface Reference
Menu
Selection
Keyboard
Accelerator
375
Function
Parameters...
Displays the Parameter Editor. See “Data
Import Methods” on page 27 for details.
Properties...
Brings up the property sheet for the currentlyselected item(s). If only the view is selected,
the property sheet for the view layer is
presented. Only one property sheet may be
displayed at a time. If a different item or view
is selected, the contents of the property sheet
change to the properties of the new item or
view. For grouped items, a single property
sheet with the intersection of the properties is
displayed. When the property values are not
the same for the grouped items, those
properties are set to undefined or default.
Setting a property for a grouped item sets that
property for all items in the group.
Table A-5: The Edit Menu (Continued)
iTool User’s Guide
Edit Menu
376
Appendix A: iTools Interface Reference
Insert Menu
The Insert menu contains tools for adding visualization elements to the displayed
data. Contents of the Insert menu vary from iTool to iTool.
Menu
Selection
Function
Visualization
Inserts a new visualization into the current window. See
“Inserting Visualizations” on page 54 for details.
View
Inserts a new view into the current window.
• If the window is currently locked, this menu item will be
grayed out.
• If the window is not locked, the new view is added to the
layout in the appropriate location, depending on the
currently active layout.
Dataspace
Inserts data space. (useful when overplotting such as in iPlot)
Axis
Inserts a new axis. Choose from these options:
• X: inserts an additional X axis
• Y: inserts an additional Y axis
• Z: inserts an additional Z axis
See “Additional Axes” on page 84 for details.
New Legend
Inserts a new legend for the data set or for the selected
visualization(s) into the current window. See “Legends” on
page 77 for details.
Legend Item
Inserts a new item into your existing legend.
Colorbar
Inserts a colorbar for the selected item.
Note - Only available for indexed color images.
{Additional items vary depending on the iTool selected.} For example:
Light
Inserts a new light into the current window. See “Lights” on
page 494 for details.
Map
Inserts a new map into the current window.
Table A-6: The Insert Menu
Insert Menu
iTool User’s Guide
Appendix A: iTools Interface Reference
377
Operations Menu
The Operations menu contains commands for performing operations on the selected
data. Contents of the Operations menu vary from iTool to iTool.
Menu
Selection
Function
Operations
Browser
Displays a hierarchical nested list of all tools in the menus and
toolbars. See “The Operations Browser” on page 93 for
details.
Macros
Selections related to iTool’s macros.
• Run Macro: Select to run a macro.
• Start Recording: Select to begin recording a macro.
• Stop Recording: Select to cease macro recording.
• Macro Editor: Select to bring up the Macro Editor
dialog.
Statistics
Computes the statistical properties of the selected item(s), and
displays the results in a separate dialog.
See “Displaying Statistics” on page 129 for details.
Histogram
Displays a histogram plot of the selected data. See “Plotting a
Histogram” on page 128 for details.
Filter
Choose from these options:
• Convolution
• Median
• Smooth
See “Filtering” on page 122.
{Additional filters vary depending on the iTool selected.}
Rotate
Table A-7: The Operations Menu
iTool User’s Guide
Operations Menu
378
Appendix A: iTools Interface Reference
Menu
Selection
Function
Rotate Left
Rotate the selected data space left 90°.
Rotate Right
Rotate the selected data space right 90°.
Rotate by Angle Specify the number of degrees to rotate the selected data
space.
Note - Rotate by Angle is absolute and always rotates relative
to the original X-Y coordinate system for 2D visualizations.
For 3D visualizations, Rotate by Angle is relative and does not
remember the current rotation angle.
Transform
• Resample — Resample the selected data using
parameters specified in Resample property settings.
• Rotate Data — Rotate the data within the visualization by
a specified number of degrees without affecting the rest of
the data space.
• Scale Data — Scale the selected object by a specified
scale factor.
See “Transformations” on page 119 for details.
{Additional transformations vary depending on the iTool
selected.}
Table A-7: The Operations Menu (Continued)
Operations Menu
iTool User’s Guide
Appendix A: iTools Interface Reference
Menu
Selection
Morph
379
Function
Choose from the following options:
• Dilate is commonly known as “fill”, “expand”, or “grow.”
It can be used to fill “holes” of a size equal to or smaller
than the structuring element.
• Erode does to the background what dilation does to the
foreground. Given an image and a structuring element,
erode can be used to remove islands smaller than the
structuring element.
• Morph open is simply an erosion operation followed by a
dilation operation. Applying morph open more than once
produces no further effect.
• Morph close is simply a dilation operation followed by an
erosion operation. Applying morph close more than once
produces no further effect.
• Morph gradient is the subtraction of an eroded version of
the original image from a dilated version of the original
image.
• Morph tophat is implemented by first applying the
opening operator to the original image, then subtracting
the result from the original image. Applying tophat shows
the bright peaks within the image.
See “Morphing” on page 127 for details.
{Additional items vary depending on the iTool selected.}
Table A-7: The Operations Menu (Continued)
iTool User’s Guide
Operations Menu
380
Appendix A: iTools Interface Reference
Window Menu
The Window menu contains commands for displaying the Data, Operations and
Visualization browsers, for zooming in and out of the display, for modifying the
window layout, and for displaying a log of system messages. The Window menu
items are common to all iTools.
Menu
Selection
Function
Data Manager
Displays the Data Manager for the current iTool. See “About
the Data Manager” on page 24 for details.
Visualization
Browser
Displays a hierarchical nested list of all visualization elements
in the display area. See “The Visualization Browser” on
page 90 for details.
Canvas Zoom
Set to increase or decrease magnification of the entire iTool
window without moving the observer’s “eye.”
• 800%
• 400%
• 200%
• 100%
• 75%
• 50%
• 25%
Default is 100%. See “Canvas Zoom” on page 70 for more
information.
Zoom on Resize
If this menu item is checked, visualizations will be resized
whenever a view is resized.
By default, visualizations will not be resized if the view size
changes.
Note - Resizing the tool window usually resizes the view as
appropriate.
Table A-8: The Window Menu
Window Menu
iTool User’s Guide
Appendix A: iTools Interface Reference
Menu
Selection
381
Function
Layout...
Displays the window layout dialog, which allows the user to
change the current view layout and the window dimensions.
See “Window Layouts” on page 73 for details.
Fit to View
Changes the View Zoom increment so that selected
visualizations will completely fill the view.
Table A-8: The Window Menu (Continued)
iTool User’s Guide
Window Menu
382
Appendix A: iTools Interface Reference
Help Menu
The Help menu contains commands for displaying online help and information about
the iTools. The Help menu items are common to all iTools.
Menu Selection
Function
Help on iTools
Displays help for the iTools system.
Help on the iTools
Data Manager
Displays help on the Data manager.
Help on the iTools
Parameter Editor
Displays help on the Parameter Editor
Help on Selected Item Displays help for the item selected in the iTool
visualization or browser window.
Help on this iTool
Displays help for the current iTool.
About iTools
Displays a dialog describing the iTools and giving the
version number.
Table A-9: The Help Menu
Note
In the Operations and Preferences browser windows, help for the selected item is
also available on the context menu.
Help Menu
iTool User’s Guide
Appendix A: iTools Interface Reference
383
File Toolbar
The File toolbar contains the following buttons:
Button
Tool Name
Function
New
Creates a new iTool of the same type as the current
tool with no data or visualizations.
Open
Opens a file for import into the current iTool. If this is
a data file, such as an image file, ASCII file, or binary
file, a new data object will be created and, if
applicable, a new visualization will be created.
Save
Saves the state of the current iTool to a file. If the
state has not been previously saved and has no
filename, enter a filename. The saved file is crossplatform.
Print
Prints the entire contents of the graphics window.
Table A-10: File Toolbar Buttons
iTool User’s Guide
File Toolbar
384
Appendix A: iTools Interface Reference
Edit Toolbar
The Edit Toolbar contains the following buttons:
Button
Tool Name
Undo
Function
Nullifies the previous operation and restores the iTool
to its state before that operation.
Note - Operations such as open, save, export, export
variable, print, exit, and window moving and resizing
cannot be undone.
Redo
Nullifies the previous Undo command and restores
the iTool to its state before the Undo command was
issued. Any action that can be undone can also be
redone.
Cut
Deletes the selected item(s) and places a copy on the
local clipboard. If the window layout is locked, you
will be asked if a copy of the view should be placed
on the System clipboard.
Copy
Copies the selected item to the local clipboard. If a
view is copied, then a bitmap copy of that view (not
the entire Window) is also put on the System
clipboard.
Paste
Pastes the current local clipboard contents into the
selected view. If a view is pasted, it is added to the
current Window layout and becomes the currentlyselected view.
Table A-11: Edit Toolbar Buttons
Edit Toolbar
iTool User’s Guide
Appendix A: iTools Interface Reference
385
Manipulator Toolbar
The Manipulator Toolbar contains the following buttons:
Button
Tool Name
Function
Select
Click to enter select mode. The arrow pointer is
displayed, and objects can be selected in the display
area. Click to select an object; a selection box appears
around the current selection.
Rotate
Click to enter rotate mode. A rotation sphere appears
around the currently selected object.
• Position the mouse pointer on an axis, and the
axis rotation pointer is displayed. Drag in the
desired direction to rotate the object along the
axis.
• Position the mouse pointer anywhere on the
selected object, and the free rotation pointer is
displayed. Drag in the desired direction to rotate
the object freely.
View Pan
Click and drag across the view to pan.
View Zoom
Click to enter zoom mode. The zoom cursor is
displayed, and dragging the mouse closer to or farther
from the center of the canvas decreases or increases
magnification at the initial point of clicking.
View Zoom
Click to select a magnification percentage for the
entire view.
Table A-12: Manipulator Toolbar Buttons
iTool User’s Guide
Manipulator Toolbar
386
Appendix A: iTools Interface Reference
Annotation Toolbar
The Annotation Toolbar contains the following buttons:
Button
Tool Name
Function
Text
Click to enter text annotation mode. The insert pointer
is displayed, and text can be entered from the
keyboard.
Line
Click to enter line annotation mode. The crosshairs
pointer is displayed. Click at the starting point for the
line and drag in the desired direction. Release the
mouse button to terminate the line.
Rectangle
Click to enter rectangle annotation mode.
Oval
Click to enter oval annotation mode.
Polygon
Click to create a polygon annotation. Click to define
vertices, double-click to complete polygon.
Freehand
Click to enter freehand annotation mode. The crosshairs pointer is displayed. Click at a starting point and
drag to create the desired shape. Release the mouse
button to complete the polygon.
Table A-13: Annotation Toolbar Buttons
Annotation Toolbar
iTool User’s Guide
Appendix A: iTools Interface Reference
387
Context Menu
Right-clicking on the visualization window brings up a context menu at that location.
The context menu is common to all iTools, and it contains the following menu items:
Menu
Selection
Description
Cut
Deletes the selected item(s) and places a copy on the local
clipboard. If the window layout is locked, you will be asked if
a copy of the view should be placed on the System clipboard.
Copy
Copies the selected item to the local clipboard. If a view is
copied, then a bitmap copy of that view (not the entire
Window) is also put on the System clipboard.
Paste
Pastes the current local clipboard contents into the selected
view. If a view is pasted, it is added to the current Window
layout and becomes the currently-selected view.
Delete
Deletes the currently-selected item(s), without putting a copy
on the local or system clipboards. Deletion can be reversed
with Undo.
Grouping:
Grouping gives you the advantage of allowing desired items to
operate together and be manipulated as a single unit.
Group
Groups the currently-selected items into a single unit.
Ungroup
If the selected item is currently a group, then it is ungrouped.
Note - You cannot group items across separate visualization
and annotation layers.
Table A-14: The Context Menu
iTool User’s Guide
Context Menu
388
Appendix A: iTools Interface Reference
Menu
Selection
Description
Order:
Brings the selected item(s) to the front of the graphics
hierarchy.
Bring To Front
Send To Back
Bring Forward
Send Backward
Sends the selected item(s) to the back of the graphics
hierarchy.
Bring the selected item(s) forward one position in the graphics
hierarchy.
Send the selected item(s) back one position in the graphics
hierarchy.
Export to IDL
Exports the currently selected item(s) to your IDL session.
Parameters...
Brings up the parameter editor for the currently selected
item(s).
Properties…
Brings up the property sheet for the currently selected item(s).
If only the view is selected, the property sheet for the view
layer is presented. Only one property sheet may be displayed at
a time. If a different item or view is selected, the contents of
the property sheet change to the properties of the new item or
view. For grouped items, a single property sheet with the
intersection of the properties is displayed. When the property
values are not the same for the grouped items, those properties
are set to undefined or default. Setting a property for a grouped
item sets that property for all items in the group.
Table A-14: The Context Menu (Continued)
Context Menu
iTool User’s Guide
Appendix B
Property Controls
The following user interface controls are used in iTool property sheets. The general
function of these controls is described here. Refer to the individual property
descriptions in Appendix C, “Operations Properties” and Appendix D, “Visualization
Properties” for specific information on how to set individual property controls.
iTool User’s Guide
389
390
Appendix B: Property Controls
Control Type
Function
Boolean
Click the browse button
to
expand the list. Select either of the
two choices (Show or Hide, True
or False, etc.) from the list.
Number
If the number is editable, type in a new value. You may be
restricted to whole numbers or a range of numbers. Entering a
value outside of the valid range causes the number to snap to
the nearest allowable value.
If a slider is displayed, slide the
marker to select a new value.
If a spinner control is displayed,
click, or click and hold the up or
down buttons to change the value.
String
Enter a string in the text box. If the
string exceeds the length of the
text box, a browse button is
provided to expand the text box.
Table B-15: Controls Used in Property Sheets
iTool User’s Guide
Appendix B: Property Controls
391
Control Type
Function
Color
Select a color from the palette displayed in the color selector:
Or click Custom Color (UNIX users right-click the color bar
at the bottom of the window) to specify RGB or HSL values:
Windows Color Picker
Windows users:
enter Hue, Sat,
Lum or Red,
Green, Blue
values and click
OK to apply the
new values.
Click Add to
Custom Colors
to save your
values.
UNIX users:
drag the Red,
Green, Blue or
Hue, Lightness,
Saturation
sliders to change
values, and click
OK to apply the
new values.
UNIX Color Picker
Table B-15: Controls Used in Property Sheets (Continued)
iTool User’s Guide
392
Appendix B: Property Controls
Control Type
Line Style
Line Thickness
Function
Select a line style from the list. To
make the line invisible, select No
Line.
Select a line thickness from the list.
Numbers indicate line thickness in
pixels. Use the scroll bar to display
additional items.
Symbol
Select a symbol to appear at regular
intervals on the selected line from
the list. To remove a symbol from a
line, select No Symbol. Use the
scroll bar to display additional items.
String List
Select an item from the list. Use
the scroll bar to display additional
items.
User Defined
Click the Edit button to
display the user-defined
property control.
Table B-15: Controls Used in Property Sheets (Continued)
iTool User’s Guide
Appendix C
Operations Properties
This appendix describes the following properties of the IDL Intelligent Tools interface found in
the Operations Browser of each iTool:
The Operations Browser . . . . . . . . . . . . . .
Macros Properties . . . . . . . . . . . . . . . . . . .
Statistics Properties . . . . . . . . . . . . . . . . . .
Filter Properties . . . . . . . . . . . . . . . . . . . . .
Rotate Properties . . . . . . . . . . . . . . . . . . . .
Transform Properties . . . . . . . . . . . . . . . . .
Map Projection Properties . . . . . . . . . . . . .
Map Register Image Properties . . . . . . . . .
Morphing Properties . . . . . . . . . . . . . . . . .
iTool User’s Guide
394
395
396
398
405
406
410
411
412
Crop Properties . . . . . . . . . . . . . . . . . . . . .
Region Grow Properties . . . . . . . . . . . . . .
Contour Properties . . . . . . . . . . . . . . . . . .
Image Properties . . . . . . . . . . . . . . . . . . . .
Surface Properties . . . . . . . . . . . . . . . . . .
Vector Properties . . . . . . . . . . . . . . . . . . .
Volume Properties . . . . . . . . . . . . . . . . . .
Image Plane Properties . . . . . . . . . . . . . . .
413
414
416
417
418
419
420
422
393
394
Appendix C: Operations Properties
The Operations Browser
The Operations Browser provides a hierarchical tree view of the tools and operations
available from the iTool Operations menu. The Operations Browser is used to set
properties for operations and tools used in the iTool window. See “The Operations
Browser” on page 93 for details on how to display and use the Operations Browser.
Figure C-6: The Operations Browser
The property sheet for each operation displayed in the Operations Browser contains
the Name and Description properties described in the following table. For each
property, the type of control and the values that can be assigned are listed. For a
description of how a particular control is used, refer to Appendix B, “Property
Controls”
Property
Control Type: Options
Name
String: Name assigned to this statistics dialog. Edit the text to
change the name.
Description
String: Description of this statistics function. Edit the text to
change the description.
Table C-16: Statistics Operation Properties
The Operations Browser
iTool User’s Guide
Appendix C: Operations Properties
395
Macros Properties
Macros provide a shortcut mechanism that lets you quickly and automatically repeat
a sequence of interactive operations. The Macros tools appears in the Operation
Browser for all iTools. See Chapter 8, “Working with Macros” for details on how to
use macros.
This browser has no properties that can be configured other than Name and
Description.
iTool User’s Guide
Macros Properties
396
Appendix C: Operations Properties
Statistics Properties
The Statistics tool displays statistical information relating to the currently selected
object or group of objects. The Statistics tool appears in the Operation Browser for all
iTools. See “Displaying Statistics” on page 129 for details on how to use the Statistics
tool.
This browser has no properties that can be configured other than Name and
Description.
Statistics Properties
iTool User’s Guide
Appendix C: Operations Properties
397
Histogram Properties
The Histogram tool displays a histogram plot of the data selected in the iTool
window. The Histogram tool appears in the Operation Browser for all iTools. See
“Plotting a Histogram” on page 128 for details on how to use the Histogram tool.
Histogram has no configurable properties other than Name and Description.
iTool User’s Guide
Histogram Properties
398
Appendix C: Operations Properties
Filter Properties
The following properties control the iTool filters.
Convolution Properties
Convolution smooths data by using a weighted moving average. Convolution filter
properties appear on the Operations Browser for all iTools. See “Convolution Filter”
on page 124 for details on applying convolution.
For each property, the type of control and the values that can be assigned are listed.
For a description of how a particular control is used, refer to.
Property
Show dialog
Control Type: Options
Boolean: Display the Convolution Kernel Editor dialog when
the Convolution filter is selected from the
Operations → Filter menu. Choose True to display the
dialog, or False to apply the Convolution filter without
displaying the dialog.
Default = True
Table C-17: Convolution Filter Properties
Filter Properties
iTool User’s Guide
Appendix C: Operations Properties
399
Property
Filter
Control Type: Options
String List: The default filter. Select from the following list:
• User defined
• Tent
• Boxcar
• Gaussian
• Edge Horizontal
• Edge Vertical
• Edge Diagonal Right
• Edge Diagonal Left
• Line Horizontal
• Line Vertical
• Line Diagonal Right
• Line Diagonal Left
• Laplacian
• Emboss
Default = Tent
Number of columns
Number: Width of the filter (applies only to Tent, Boxcar, and
Gaussian). Default = 3
Number of rows
Number: Height of the filter (applies only to Tent, Boxcar, and
Gaussian). Default = 1 for 1D data, 3 for 2D data
Kernel
User Defined: Display the Convolution Kernel Editor
dialog. Click Edit to display the dialog.
Center
Boolean: Select True (centered) or False (no centering).
Default = True
Auto normalize
Boolean: Select True (for automatic normalizing) or False (no
automatic normalizing). Default = True
Scale factor
Number: Value to be divided into each result. Default is
calculated from the kernel.
Table C-17: Convolution Filter Properties (Continued)
iTool User’s Guide
Filter Properties
400
Appendix C: Operations Properties
Property
Control Type: Options
Bias offset
Number: Value to be added to each result, after scale factor.
Default is calculated from the kernel.
Edge values
Boolean: Select for edge value type:
• Zero result
• Wrap around
• Repeat last value
• Zero pad
Default = Wrap around
Use invalid value
Boolean: Select True to use the invalid value to filter out
missing data, or False (invalid value not used). Default =
False
Invalid value
Number: Missing or invalid value that should be ignored.
Default = 0
Replacement value
Number: Value used to replace missing results. Default = 0
Table C-17: Convolution Filter Properties (Continued)
Median Properties
Median smoothing replaces each point with the median (a value in an ordered set of
values with an equal number of values above and below it) of the one- or twodimensional neighborhood of a given width. See “Median Filter” on page 123 for
details on applying the median filter.
Filter Properties
iTool User’s Guide
Appendix C: Operations Properties
401
For each property, the type of control and the values that can be assigned are listed.
For a description of how a particular control is used, refer to Appendix B, “Property
Controls”.
Property
Control Type: Options
WIDTH
Number: Width of the smooth window. Enter a whole number
between 1 (no smoothing) and the width of the data.
Default = 3
Even Average
Boolean: If set to true and the Width property is set to an even
number, the operation will return the average of the two
middle numbers.
Table C-18: Median Filter Properties
Smooth Properties
The Smooth filter reduces noise within an image by applying low pass filters. Smooth
filter properties appear on the Operations Browser for all iTools. See “Smooth Filter”
on page 122 for details on applying the smooth filter.
For each property, the type of control and the values that can be assigned are listed.
For a description of how a particular control is used, refer to Appendix B, “Property
Controls”.
Property
WIDTH
Control Type: Options
Number: Width of the smooth window. Enter a whole number
between 1 (no smoothing) and the width of the data.
Default = 3
Table C-19: Smooth Filter Properties
Roberts Filter Properties
Roberts filter appears on the Operations Browser for the iImage tool only. Roberts
filter has no configurable properties other than Name and Description. For more
information on the Roberts filter, see “ROBERTS” (IDL Reference Guide).
iTool User’s Guide
Filter Properties
402
Appendix C: Operations Properties
Sobel Filter Properties
Sobel filter appears on the Operations Browser for the iImage tool only. Sobel filter
has no configurable properties other than Name and Description. For more
information on the Sobel filter, see “SOBEL” (IDL Reference Guide).
Unsharp Mask Properties
An unsharp-mask filter can be applied to any two-dimensional array or a TrueColor
image. The unsharp mask enhances the contrast between neighboring pixels in an
image, and is widely used for astronomical images and for digital photographs. For
more information on unsharp masking a plot, see “Unsharp Mask Filter” on
page 125.
Property
Show dialog
Control Type: Options
Boolean: Display the Unsharp Mask Editor dialog when the
Unsharp Mask filter is selected from the Operations → Filter
menu. Choose True to display the dialog, or False to apply the
Unsharp Mask filter without displaying the dialog.
Default = True
Amount of filter
(%)
Number: Click and slide to select percentage amount of filter
to be applied.
Default = 100%
Radius in pixels
Number: Click and slide to select filter radius in pixels.
Default = 3
Clipping
threshold
Number: Click and slide to select clipping threshold.
Default = 0
Table C-20: Unsharp Mask Filter Properties
Filter Properties
iTool User’s Guide
Appendix C: Operations Properties
403
Curve Fitting Properties
Curve fitting properties appear on the Operations Browser for the iPlot tool only. See
“Curve Fitting” on page 294 for details on applying curve fitting to a plot.
For each property, the type of control and the values that can be assigned are listed.
For a description of how a particular control is used, refer to Appendix B, “Property
Controls”.
Property
Show dialog
Control Type: Options
Boolean: Display the Curve Fitting Editor dialog when the
Curve Fitting filter is selected from the Operations → Filter
menu. Choose True to display the dialog, or False to apply the
Curve Fitting filter (the default curve fitting model - linear will be used) without displaying the dialog.
Default = True
Table C-21: Curve Fitting Properties
iTool User’s Guide
Filter Properties
404
Appendix C: Operations Properties
Property
Model name
Control Type: Options
String List: Model to use in curve fitting. Select a model from
the list. Choose from these values:
• Linear
• Qaudratic
• Cubic
• Quartic
• Quintic
• Exponential
• Gompertz
• Logsquare
• Hyperbolic
• Hyperbolic trigonometric
• Logistic
• Geometric
• Trigonometric summation
• Trigonometric product
• Variable sinc
• Gaussian
• Gaussian + constant
• Gaussian + linear
• Gaussian + quadratic
Default = Linear
Parameter(s)
Number: Initial parameter(s) and result(s). Values may be
edited here.
Default = Varies
Table C-21: Curve Fitting Properties (Continued)
Filter Properties
iTool User’s Guide
Appendix C: Operations Properties
405
Rotate Properties
The following properties control the iTool Rotate tools. Rotate properties appear on
the Operations Browser for all iTools (for iImage it is Rotate or Flip).
Rotate Left Properties
Rotate Left has no configurable properties other than Name and Description.
Rotate Right Properties
Rotate Right has no configurable properties other than Name and Description.
Rotate By Angle Properties
Rotate by Angle has no configurable properties other than Name and Description.
Flip Horizontal
Flip Horizontal has no configurable properties other than Name and Description.
Flip Vertical
Flip Vertical has no configurable properties other than Name and Description.
iTool User’s Guide
Rotate Properties
406
Appendix C: Operations Properties
Transform Properties
The following properties control the iTool Transform tools.
Resample Properties
The Resample transform resamples the selected data using the resampling factors and
method specified in these properties. Resample Transform properties appear on the
Operations Browser for all iTools. See “Resample” on page 119 for details on how to
resample data.
For each property, the type of control and the values that can be assigned are listed.
For a description of how a particular control is used, refer to Appendix B, “Property
Controls”.
Property
Control Type: Options
1st dimension
factor
Number: The resampling factor for the first dimension (X).
Edit the number to change the value. Default = 2
2nd dimension
factor
Number: The resampling factor for the second dimension (Y).
Edit the number to change the value. Default = 2
3rd dimension
factor
Number: The resampling factor for the third dimension (Z).
Edit the number to change the value. Default = 2
Interpolation
method
String List: Method of interpolation to use in resampling.
Select a method from the list. Choose from these values:
• Nearest neighbor: Assign the value of the nearest pixel to
the pixel in the output image. Fastest method, but may
cause jagged edges.
• Linear: Surveys the two closest pixels, drawing a line
between them and designating a value along that line as
the output pixel value.
• Cubic: Use cubic polynomial waveforms instead of linear
waveforms. Most accurate method, but may require more
processing time.
Default = Nearest neighbor
Table C-22: Resample Transform Properties
Transform Properties
iTool User’s Guide
Appendix C: Operations Properties
407
Rotate Data Properties
The Rotate Data operation allows you to rotate the data within the visualization by a
specified number of degrees without affecting the rest of the data space (graphical
objects and axes). See “Rotation” on page 115 in for details on using the Rotate Data
operation.
The following properties control the Rotate Data tool. For each property, the type of
control and the values that can be assigned are listed. For a description of how a
particular control is used, refer to Appendix B, “Property Controls”.
Property
Control Type: Options
Angle
Number: The angle of rotation in degrees clockwise.
Default = 0
X center offset
Number: X subscript of the center of rotation. Default = 0
Y center offset
Number: Y subscript of the center of rotation. Default = 0
Magnification
Number: Magnification factor. Default = 1
Interpolation
method
String List: Method of interpolation to use when rotating.
Select a method from the list. Choose from these values:
• Nearest neighbor: Assign the value of the nearest pixel to
the pixel in the output image. Fastest method, but may
cause jagged edges.
• Linear: Surveys the two closest pixels, drawing a line
between them and designating a value along that line as
the output pixel value.
• Cubic: Use cubic polynomial waveforms instead of linear
waveforms. Most accurate method, but may require more
processing time.
Default = Nearest neighbor
Extrapolate
missing
Boolean: Extrapolate the value of a missing pixel from the
value of nearby pixels. Default = True
Table C-23: Rotate Data Properties
iTool User’s Guide
Transform Properties
408
Appendix C: Operations Properties
Property
Missing value
Control Type: Options
Number: A value to be substituted for pixels in the rotated
image that fall outside the bounds of the unrotated image. This
property is only used if the Extrapolate missing property is set
to false.
Default = 0
Pivot
Boolean: If set to true, the image will be rotated around the
point defined by the X center offset and Y center offset. If set
to false, the image will be rotated around its center.
Default = False
Table C-23: Rotate Data Properties (Continued)
Scale Data Properties
The Scale Data operation scales the selected objects by a specified scale factor. Scale
Data properties appear on the Operations Browser for all iTools. See “Scaling” on
page 65 for details on using the Scale Data operation.
The following properties control the Scale Data tool. For each property, the type of
control and the values that can be assigned are listed. For a description of how a
particular control is used, refer to Appendix B, “Property Controls”.
Property
Show dialog
Control Type: Options
Boolean: Display the Scale Data Editor dialog when Scale
Data is selected from the Operations → Scale Data menu.
Choose True to display the dialog, or False to apply the Scale
Data without displaying the dialog.
Default = True
Scale Factor
Number: Scale the selected data by this factor. Edit the
number to change the factor that appears in the Scale Factor
dialog. Scale Factor may be positive or negative.
Default = 2
Table C-24: Scale Data Properties
Transform Properties
iTool User’s Guide
Appendix C: Operations Properties
409
Invert Image Properties
Invert Image Transform properties appear on the Operations Browser for iImage
only. The operation has no unique properties.
Byte Scale Properties
Byte Scale properties appear on the Operations Browser for iImage only. For each
property, the type of control and the values that can be assigned are listed. For a
description of how a particular control is used, refer to Appendix B, “Property
Controls”.
Property
Control Type: Options
Automatic
Min/Max
Boolean: Automatically compute minimum and maximum
values? Choose True or False. Default = True
Minimum cutoff
Number: Minimum value of array to be considered. Edit the
number to change the value. Default = 0
Maximum cutoff
Number: Maximum value of array to be considered. Edit the
number to change the value. Default = 255
Bottom byte
Number: Minimum value of scaled result. Edit the number to
change the value. Range = 0-255. Default = 0
Top byte
Number: Maximum value of scaled result. Edit the number to
change the value. Range = 0-255. Default = 255
Table C-25: Byte Scale Transform Properties
Note
When working with byte data, the default bytescale range is always 0-255.
Therefore, even if data is bytescaled from 0-100, it will display using 0-255. This
may cause visualized data to appear darker.
iTool User’s Guide
Transform Properties
410
Appendix C: Operations Properties
Map Projection Properties
The map projection functionality displays image and contour data that are
georeferenced and mapped to particular projections. See Chapter 15, “Working with
Maps” for details on how to use mapping functionality.
For a comprehensive list of map projection properties, see “Applying a Map
Projection” on page 328.
Map Projection has no configurable properties other than Show dialog.
Property
Show dialog
Control Type: Options
Boolean: Display the Map Projection dialog when
Operations → Map Projection is chosen. Choose True to
display the dialog, or False to apply the Map Projection dialog
without displaying the dialog.
Default = True
Table C-26: Map Projection Properties
Map Projection Properties
iTool User’s Guide
Appendix C: Operations Properties
411
Map Register Image Properties
The map projection functionality displays image and contour data that are
georeferenced and mapped to particular projections. See Chapter 15, “Working with
Maps” for details on how to use mapping functionality.
Map Register Image has the following configurable properties.
Property
Origin (x)
Control Type: Options
Number: Set the longitudinal minimum in degrees.
Default = 0
End (x)
Number: Set the longitudinal maximum in degrees.
Default = 0
Pixel size (x)
Number: Set the longitudinal pixel size in degrees.
Default = 0
Origin (y)
Number: Set the latitudinal minimum in degrees.
Default = 0
End (y)
Number: Set the latitudinal maximum in degrees.
Default = 0
Pixel size (y)
Number: Set the latitudinal pixel size in degrees.
Default = 0
Table C-27: Map Register Properties
iTool User’s Guide
Map Register Image Properties
412
Appendix C: Operations Properties
Morphing Properties
Morphing is available for iImage, iSurface, and iContour.
Mathematical morphology is a method of processing digital images on the basis of
shape. Six morphing options are available for use in iTools: dilate, erode, morph
open, morph close, morph gradient, and morph tophat. All six options share the same
properties. See “Morphing” on page 127 in for details on morphing data.
For each property, the type of control and the values that can be assigned are listed.
For a description of how a particular control is used, refer to Appendix B, “Property
Controls”.
Property
Structure Shape
Control Type: Options
String List: The shape of the structuring element used in the
morph operation. Choose from these values:
• Square
• Circle
Default = Square
Structure Width
Number: The width of the structuring element.
Default = 3
Table C-28: Morphological Filter Properties
Morphing Properties
iTool User’s Guide
Appendix C: Operations Properties
413
Crop Properties
Cropping is available for the iImage tool. The iImage cropping operation allows you
to crop one or more selected images at a specified location and specified dimensions.
See “iImage Tool Operations” on page 231 for details on cropping.
For each property, the type of control and the values that can be assigned are listed.
For a description of how a particular control is used, refer to Appendix B, “Property
Controls”.
Property
X
Control Type: Options
Number: The X cropping value.
Default = 0
Y
Number: The Y cropping value.
Default = 0
Width
Number: The crop operation width setting.
Default = <width of selected image>
Height
Number: The crop operation height setting.
Default = <height of selected image>
Units
String List:
• Data
• Pixel
Default = Data
Table C-29: Crop Properties
iTool User’s Guide
Crop Properties
414
Appendix C: Operations Properties
Region Grow Properties
Region growing expands a selected area to include nearby pixels that fall within a
threshold range of the current selection. See “REGION_GROW” (IDL Reference
Guide) for additional details. For a description of how a particular control is used,
refer to Appendix B, “Property Controls”.
Property
Region grow
method
Control Type: Options
String List: The method used to select pixels that are similar to
the current selection. Choose from these values:
• By threshold: The expanded region includes neighboring
pixels that fall within the range defined by the Threshold
minimum and Threshold maximum values.
• By standard deviation: The expanded region includes
neighboring pixels that fall within the range of the mean
of the region’s pixel values plus or minus the given
multiplier times the sample standard deviation as follows:
Mean +/- StdDevMultiplier * StdDev
where Mean is the mean value of the selected pixels,
StdDevMultiplier is the value specified by the
Standard Deviation Multiplier property, and StdDev is
the standard deviation of the selected pixels.
Default = By threshold
Pixel search
method
String List: Specifies which pixels should be considered
during region growing. Four-neighbor searching searches only
the neighbors that are exactly one unit in distance from the
current pixel; Eight-neighbor searching searches all
neighboring pixels.
Choose from these values:
• 4-neighbor
• 8-neighbor
Default = 4-neighbor
Table C-30: Region Grow Operation Properties
Region Grow Properties
iTool User’s Guide
Appendix C: Operations Properties
Property
Threshold to use
415
Control Type: Options
String List: Specifies the threshold values to use. Choose from
these values:
• Source ROI/Image threshold: Base the threshold values
on the pixel values in the currently selected region.
• Explicit: Specify the threshold values using the Threshold
minimum and Threshold maximum properties.
Default = Source ROI/Image threshold
Threshold
minimum
Number: The explicitly specified minimum threshold value.
Default = 0
Threshold
maximum
Number: The explicitly specified maximum threshold value.
Default = 256
Standard
deviation
multiplier
Number: The number of standard deviations to use if the
region growing method is By standard deviation. Default = 1
For an RGB(A)
image use
String List: If the image has separate color channels, use the
selected channel when growing the region. Choose from these
values:
• Luminosity: Luminosity values
• Red Channel: Red values
• Green Channel: Green values
• Blue Channel: Blue values
• Alpha Channel: Transparency values.
Default = Luminosity
Table C-30: Region Grow Operation Properties (Continued)
iTool User’s Guide
Region Grow Properties
416
Appendix C: Operations Properties
Contour Properties
Contour Properties appear on the Operations Browser for iImage and iSurface only.
The following properties control the contour operation. For each property, the type of
control and the values that can be assigned are listed. For a description of how a
particular control is used, refer to Appendix B, “Property Controls”.
Property
N_LEVELS
Control Type: Options
Number: Set the number of contour levels.
Default = 5
Value
Number: Set the contour value to use.
Default = 0
Projection
Boolean: Choose the contour type:
• Planar
• 3D
Default = Planar
Table C-31: Contour Properties
Contour Properties
iTool User’s Guide
Appendix C: Operations Properties
417
Image Properties
Image Properties appear on the Operations Browser for iSurface and iContour only.
Image has no configurable properties other than Name and Description.
iTool User’s Guide
Image Properties
418
Appendix C: Operations Properties
Surface Properties
Surface Properties appear on the Operations Browser for iImage and iContour only.
Surface has no configurable properties other than Name and Description.
Surface Properties
iTool User’s Guide
Appendix C: Operations Properties
419
Vector Properties
Vector Properties appear on the Operation Browser for the iVector tool.
Streamlines
For each property, the type of control and the values that can be assigned are listed.
For a description of how a particular control is used, refer to Appendix B, “Property
Controls”.
Property
Show Dialog
Control Type: Options
Boolean: Display the Streamlines Value Selector dialog when
Streamlines is selected from the Operations → Vector
menu. Choose True to display the dialog, or False to apply the
streamlines without displaying the dialog.
Default = True
X stream particles Number: Set number of X dimension stream particles.
Default = 25
Y stream particles Number: Set number of Y dimension stream particles
Default = 25
Streamline steps
Number: Set number of streamline steps.
Default = 100
Streamline step
size
Number: Set streamline step size value.
Default = 0.2
Table C-32: Vector Streamline Properties
Contour Magnitude
Contour Magnitude has no configurable properties.
Contour Direction
Contour Direction has no configurable properties.
iTool User’s Guide
Vector Properties
420
Appendix C: Operations Properties
Volume Properties
Volume Properties appear on the Operation Browser for the iVolume tool only.
Image Plane
Image Plane has no configurable properties other than Name and Description.
Isosurface
For each property, the type of control and the values that can be assigned are listed.
For a description of how a particular control is used, refer to Appendix B, “Property
Controls”.
Property
Show Dialog
Control Type: Options
Boolean: Display the Isosurface Value Selector dialog when
Isosurface is selected from the Operations → Volume menu.
Choose True to display the dialog, or False to apply the
isosurface without displaying the dialog.
Default = True
Table C-33: Isosurface Properties
Render Volume
Render Volume has no configurable properties other than Name and Description.
Volume Properties
iTool User’s Guide
Appendix C: Operations Properties
421
Interval Volume
For each property, the type of control and the values that can be assigned are listed.
For a description of how a particular control is used, refer to Appendix B, “Property
Controls”.
Property
Show Dialog
Control Type: Options
Boolean: Display the Isosurface Value Selector dialog when
Isosurface is selected from the Operations → Volume menu.
Choose True to display the dialog, or False to apply the
isosurface without displaying the dialog.
Default = True
Table C-34: Interval Volume Properties
iTool User’s Guide
Volume Properties
422
Appendix C: Operations Properties
Image Plane Properties
Image Plane Properties appear on the Operation Browser for the iVolume tool only.
Property
Show
Control Type: Options
Boolean: Display the image plane after Image Plane is
selected from the Operations → Volume → Image Plane
menu. Choose True to display, or False to apply the image
plane without displaying.
Default = True
Opacity control
Boolean: Choose opacity control type.
• Use opacity table
• Opaque
• Opacity value
Default = Use opacity table
Opacity value
Number: Set opacity value.
Default = 50
Orientation
Boolean: Choose image plane orientation.
• X
• Y
• Z
Default = X
Opacity
Number: Set opacity.
Default = 1
Color
Boolean: Set color.
Default = White [255, 255, 255]
Bottom color
Boolean: Set bottom color.
Default = White [255, 255, 255]
Table C-35: Image Plane Properties
Image Plane Properties
iTool User’s Guide
Appendix C: Operations Properties
423
Property
Control Type: Options
Depth offset
Number: Set depth offset value.
Default = 1
Skip zero opacity
Boolean: Choose True to skip zero opacity or False to use
zero opacity.
Default = True
Texture
interpolation
Boolean: Set texture interpolation type.
• Nearest neighbor
• Bilinear
Default = Nearest neighbor
Table C-35: Image Plane Properties (Continued)
Launch iImage
Launch iImage has no configurable properties other than Name and Description.
iTool User’s Guide
Image Plane Properties
424
Image Plane Properties
Appendix C: Operations Properties
iTool User’s Guide
Appendix D
Visualization
Properties
This appendix describes the following visualization properties of the IDL Intelligent Tools
interface found in the Visualization Browser of each iTool:
Introduction to Visualization Properties . .
The Visualization Browser . . . . . . . . . . . .
Window Properties . . . . . . . . . . . . . . . . . .
View Properties . . . . . . . . . . . . . . . . . . . . .
Visualization Layer Properties . . . . . . . . .
iTool User’s Guide
426
427
428
430
431
Data Space Properties . . . . . . . . . . . . . . . .
Visualization Type Properties . . . . . . . . . .
2D Annotation Layer Properties . . . . . . .
Legend Properties . . . . . . . . . . . . . . . . . . .
433
437
513
524
425
426
Appendix D: Visualization Properties
Introduction to Visualization Properties
The IDL iTools comprise seven distinct tools: iImage, iPlot, iSurface, iContour,
iVolume, iMap, and iVector. Each tool has a specific set of functions related to the
type of data it is designed to use. In addition to these specific tasks, all tools have a
number of functions in common.
This appendix describes those functions that all iTools have in common; for
information about the functions unique to the individual iTools, refer to
•
Chapter 10, “Working with Images”
•
Chapter 11, “Working with Surfaces”
•
Chapter 12, “Working with Contours”
•
Chapter 13, “Working with Plots”
•
Chapter 14, “Working with Volumes”
•
Chapter 15, “Working with Maps”
•
Chapter 16, “Working with Vectors”
This appendix describes the properties common to various iTool visualizations.
Introduction to Visualization Properties
iTool User’s Guide
Appendix D: Visualization Properties
427
The Visualization Browser
The Visualization Browser provides a hierarchical tree view of all objects displayed
in the iTool window. The Visualization Browser is used to select objects and to
display the property sheets for selected objects. See “The Visualization Browser” on
page 90 for details on how to display and use the Visualization Browser.
The Visualization Browser displays a list of the contents of the iTool window in the
left pane. The property sheet for the object currently selected in the left pane can be
displayed in the right pane of the Visualization Browser window by clicking on the
small arrows to the top-right of the left pane and top-left of the right pane (in the
middle if both are displayed). For example, to display the properties of the current
window, select Window in the left pane of the Visualization Browser as shown in the
following figure.
iTool User’s Guide
The Visualization Browser
428
Appendix D: Visualization Properties
Window Properties
Figure D-7: The Visualization Browser with Window Properties Displayed
These properties control the display of the iTool window. For each property, the type
of control and the values that can be assigned are listed. For a description of how a
particular control is used, refer to Appendix B, “Property Controls”.
Property
Control Type: Values
Zoom on Resize
Boolean: Zoom visualization upon resize of window? Choose
True or False. Default = False
Window Width
Number: Width of the current iTool window in pixels. Edit the
number to change the value. Default = 640
Note - The minimum width of the window correlates to the
width of the menubar.
Table D-36: iTool Window Properties
Window Properties
iTool User’s Guide
Appendix D: Visualization Properties
Property
429
Control Type: Values
Window Height
Number: Height of the current iTool window in pixels. Edit
the number to change the value. Default = 512
Drag Quality
String: Drag quality to define the level of detail shown when a
visualization is translated, scaled, zoomed, or otherwise
moved by mouse. Choose High, Medium, or Low.
Default = High.
Table D-36: iTool Window Properties (Continued)
All property sheets displayed in the Visualization Browser, with the exception of the
Window property sheet displayed above, include the Name, Description, and Show
properties described in the following table:
Property
Control Type: Values
Name
String: Name assigned to this view. Edit the text to change the
name.
Description
String: Description of this view. Edit the text to change the
description.
Show
Boolean: Show this view? Choose True or False.
Default = True
Table D-37: Name and Description Properties
iTool User’s Guide
Window Properties
430
Appendix D: Visualization Properties
View Properties
Each iTool window contains at least one view. If multiple views have been created
from the Window Layout dialog, each view will be listed separately.
Figure D-8: Visualization Browser with View Properties Displayed
These properties control the display of the view or views contained in the iTool
window. For each property, the type of control and the values that can be assigned are
listed. For a description of how a particular control is used, refer to Appendix B,
“Property Controls”
Property
Control Type: Values
Zoom Factor
Number: Increase or decrease magnification of the view by
this factor. Edit the number to change the value. Default = 1
Layout Position
Displays the currently selected layout view
X margin
Number: Set horizontal margin size. Valid range = 0.0 to 0.49.
Y margin
Number: Set vertical margin size. Valid range = 0.0 to 0.49.
Background color
Color: Sets the background color of the contained
Visualization Layer. Default = [255, 255, 255] (white)
Table D-38: View Properties
View Properties
iTool User’s Guide
Appendix D: Visualization Properties
431
Visualization Layer Properties
The Visualization Layer contains the data space and, for three-dimensional objects,
the lights, associated with a visualization.
Figure D-9: Visualization Browser with Visualization Layer Properties Displayed
These properties control the visualization of the data space. For each property, the
type of control and the values that can be assigned are listed. For a description of how
a particular control is used, refer to Appendix B, “Property Controls”.
Property
Control Type: Values
Background
Color
Color: Visualization layer background color. Transparent must
be set to False. Click to choose from the default color palette,
or specify RGB values. Default = [255, 255, 255] (white)
Transparent
Boolean: Make visualization layer transparent? Choose True
or False. Default = True
Table D-39: Visualization Layer Properties
iTool User’s Guide
Visualization Layer Properties
432
Appendix D: Visualization Properties
Property
Projection
Control Type: Values
String List: Projection method for displaying the visualization
layer. Select a method from the list. Choose from these values:
• Orthogonal: Orthographic projection (objects are
projected onto the visualization layer along lines
perpendicular to the view plane)
• Perspective: Objects are projected onto the visualization
layer along perspective lines that converge in the distance.
Default = Orthogonal
Stretch to Fit
Boolean: Stretch visualization layer to fit window? Choose
True or False. Default = False
Depth cue bright
Number: The distance of the near Z plane used for depth
cueing. Objects closer than this distance will be painted in
their normal color. Objects further than this distance will fade
into the background.
Depth cue dim
Number: The distance of the far Z plane used for depth cueing.
Objects further than this distance will be painted in the
background color. Setting Depth cue bright and Depth cue
dim to the same value will disable depth cueing.
Table D-39: Visualization Layer Properties (Continued)
Visualization Layer Properties
iTool User’s Guide
Appendix D: Visualization Properties
433
Data Space Properties
The data space contains the data type(s) displayed within the visualization, plus the
axes associated with the data. It is a transparent-walled bounding box by default.
When the data space walls are not transparent, some display artifacts may be visible
in certain situations. See “Rendering Objects at Data Space Depth” on page 436 for
more information.
Figure D-10: Visualization Browser with Data Space Properties Displayed
iTool User’s Guide
Data Space Properties
434
Appendix D: Visualization Properties
These properties control the visualization of the data space. For each property, the
type of control and the values that can be assigned are listed. For a description of how
a particular control is used, refer to Appendix B, “Property Controls”.
Property
Isotropic scaling
Control Type: Values
Scaling method. Select a method from the list. Choose
between these values:
• Automatic: automatic scaling
• Isotropic: isotropic scaling
• Anistropic: anistropic scaling
Default = Automatic
Note - If this property is set to Automatic, then:
1. If any visualization within the dataspace has its Isotropic
scaling property set to True, the dataspace will be
automatically set to isotropic, and the Anisotropic 2D/3D
scale properties will be desensitized.
2. If none of the visualizations are isotropic, the dataspace will
be automatically set to anisotropic, and the appropriate
Anisotropic scale property will be sensitized for either 2D or
3D data.
Anistropic 2D
scale
Presentation scale factor applied along Y axis
Anistropic 3D
scale
Presentation scale factor applied along Z axis
Map projection
Default = No projection (click to edit)
X Minimum
Number: Minimum value for X coordinate of data set.
X Maximum
Number: Maximum value for X coordinate of data set.
Y Minimum
Number: Minimum value for Y coordinate of data set.
Y Maximum
Number: Maximum value for Y coordinate of data set.
Z Minimum
Number: Minimum value for Z coordinate of 3-D data set.
Table D-40: Data Space Properties
Data Space Properties
iTool User’s Guide
Appendix D: Visualization Properties
Property
435
Control Type: Values
Z Maximum
Number: Maximum value for Z coordinate of 3-D data set.
Automatic X
range updates
Boolean: Automatically updates the range of X values.
Choose True or False. Default = True
Automatic Y
range updates
Boolean: Automatically updates the range of Y values.
Choose True or False. Default = True
Automatic Z
range updates
Boolean: Automatically updates the range of Z values. Choose
True or False. Default = True
X log
Boolean: Determines X axis type. Choose True (logarithmic)
or False (linear). Default = False.
Y log
Boolean: Determines Y axis type. Choose True (logarithmic)
or False (linear). Default = False.
Z log
Boolean: Determines Z axis type. Choose True (logarithmic)
or False (linear). Default = False.
Color
Color: Data space bounding box border color. Border Style
must not be No line. Click to choose from the default color
palette, or specify RGB values. Default = [0,0,0] (black)
Linestyle
Line Style: Data set bounding box border line style. Select a
line style from the list. Default = No line
Thickness
Line Thickness: Data set bounding box border line thickness.
Select a thickness from the list. Default = 1.
Fill Background
Boolean: Fills data space background with background color.
Choose True or False. Default = True
Fill Color
Color: Data space background color. Fill Background must be
set to True. Click to choose from the default color palette, or
specify RGB values. Default = [255, 255, 200] (cream)
Transparency
Number: Transparency of data space background from 0% to
100%. Fill Background must be set to True. Move slider to
select a new percentage. Default = 100
Table D-40: Data Space Properties (Continued)
iTool User’s Guide
Data Space Properties
436
Appendix D: Visualization Properties
Rendering Objects at Data Space Depth
The depth buffer is a record of the depth at which each pixel of a graphic primitive is
rendered on a graphics device. This is typically used to control the visual positioning
of objects in front or behind other objects. (See “Controlling the Depth of Objects in
a View” (Chapter 2, Object Programming) for more information on depth buffers.)
Data space walls are polygon objects that are transparent by default. In unusual
circumstances when the walls are not transparent, and when another object is drawn
in the same plane, display artifacts may be visible when the objects are transformed.
This results from the normal competition between z-buffer and polygon rasterization
operations. To avoid any display artifacts, reposition the object so that it is not in the
same plane as the data space wall, or make the wall completely transparent.
Data Space Properties
iTool User’s Guide
Appendix D: Visualization Properties
437
Visualization Type Properties
There are many types of visualizations that can be displayed in the six iTools. Each
data type has its own property sheet, which can be displayed in the Visualization
Browser. For more information, see:
•
“Image” on page 438
•
“Plot” on page 441
•
“Plot 3D” on page 445
•
“Surface” on page 448
•
“Contour” on page 453
•
“Vector” on page 458
•
“Volume” on page 463
•
“Isosurface” on page 469
•
“Interval Volume” on page 471
•
“Image Plane” on page 474
•
“Colorbar” on page 477
•
“Histogram” on page 481
•
“Axes” on page 485
•
“Lights” on page 494
•
“Polygonal ROI” on page 497
•
“IDL Graphics Objects” on page 499
•
“Map Grid” on page 500
•
“ShapePolygon” on page 505
•
“ShapePolyline” on page 507
•
“ShapePoint” on page 509
•
“Streamlines” on page 510
iTool User’s Guide
Visualization Type Properties
438
Appendix D: Visualization Properties
Image
Figure D-11: Visualization Browser with Image Properties Displayed
Image
iTool User’s Guide
Appendix D: Visualization Properties
439
These properties control image object visualizations. For each property, the type of
control and the values that can be assigned are listed. For a description of how a
particular control is used, refer to Appendix B, “Property Controls”.
Property
Control Type: Values
Image Palette
User Defined: By selecting Edit Color → Table Edit access
the color table to manipulate color values
Interpolation
String List: Method used for interpolating the image. Select a
method from the list. Choose from these values:
• Nearest Neighbor: Assign the value of the nearest pixel
to the pixel in the output image. Fastest method, but may
cause jagged edges.
• Bilinear: Create a weighted average based on the nearness
and brightness of the closest four pixels, and assign that
value to the pixel in the output image.
Default = Nearest Neighbor
Z value
Number: Z value of plane on to which to project the image.
Edit the number to change the value.
Note - If the Z value is zero then the image visualization is
considered to be 2D. If the Z value is nonzero, then the image
visualization is considered to be 3D, and the dataspace
associated with this image will be automatically switched to
3D.
Default = 0
Pixel size (x)
Number: Pixel size for x value.
Default = 1
Pixel size (y)
Number: Pixel size for y value.
Default = 1
Origin (x)
Number: Origin point for x value.
Default = 0
Origin (y)
Number: Origin point for y value.
Default = 0
Table D-41: Image Properties
iTool User’s Guide
Image
440
Appendix D: Visualization Properties
Property
Units
Control Type: Values
Number: Number of units.
Default = None
Image
transparency
Number: Transparency of the image, 0% - 100%. Move the
slider to change the value. Default = 0 (no transparency)
Note - The transparency is changed by adding an alpha
channel to the image. If your image has an alpha channel then
the Transparency property is ignored.
Row Order
String List: Select an order from the list. Choose from these
values:
• Bottom-to-top
• Top-to-bottom
Default = Bottom-to-top
Table D-41: Image Properties (Continued)
Image
iTool User’s Guide
Appendix D: Visualization Properties
441
Plot
Figure D-12: Visualization Browser with Plot Properties Displayed
iTool User’s Guide
Plot
442
Appendix D: Visualization Properties
These properties control plot object visualizations. For each property, the type of
control and the values that can be assigned are listed. For a description of how a
particular control is used, refer to Appendix B, “Property Controls”.
Property
Control Type: Values
Vertex Colors
Color Table
User Defined: By selecting Edit Color → Table Edit access
the color table to manipulate plot color values
Color
Color: Color for the plot line. Click to choose from the default
color palette, or specify RGB values. Default = [0,0,0]
(black)
Line style
Line Style: Style for the plot line. Select a style from the list.
Default =
(solid line)
Thickness
Line Thickness: Thickness for the plot line. Select a thickness
from the list. Default = 1
Table D-42: Plot Properties
Plot
iTool User’s Guide
Appendix D: Visualization Properties
Property
443
Control Type: Values
Minimum value
Number: Minimum value to include in the plot. Edit the
number to change the value.
Maximum value
Number: Maximum value to display in the plot. Edit the
number to change the value.
Histogram plot
Boolean: Display plot as a histogram? Choose True or False.
Default = False
Points to average
Number: Number of points to average when drawing the plot.
Edit to change the value. Default = 1
Polar plot
Boolean: Display plot as a polar plot? Choose True or False.
Default = False
Fill plot
Boolean: Fill between plot lines? Choose True or False.
Default = False
Fill level
Number: Level at which to begin the plot fill. Edit the number
to change the value. Default = 0
Fill color
Color: Color for the plot fill. Fill transparency must be less
than 100%. Click to choose from the default color palette, or
specify RGB values. Default = [128, 128, 128]
Fill transparency
Number: Transparency of the plot fill from 0% to 100%. Move
the slider to change the value. Default = 0
Symbol
Symbol: Symbol to appear at regular intervals on the plot line.
Choose a symbol from the list. Default = No symbol
Symbol size
Number: Factor from 0 - 1 determining the size of the selected
symbol. Move slider to change the size. Default = 0.2
Use default color
Boolean: Activate Symbol color property. Choose True or
False. Default = False
Symbol color
Color: Color for the selected symbol. Click to choose from the
default color palette, or specify RGB values. Default =
[0,0,0] (black)
Table D-42: Plot Properties (Continued)
iTool User’s Guide
Plot
444
Appendix D: Visualization Properties
Property
Control Type: Values
Symbol thickness
Number: Line thickness from 1 - 9.9 for the selected symbol.
Move slider to change the thickness. Default = 1.
Symbol
increment
Number: Interval at which symbols will be displayed on the
plot line. Influenced by Number of points to average (listed
previously). Edit to change the value. Default = 1
Table D-42: Plot Properties (Continued)
Plot
iTool User’s Guide
Appendix D: Visualization Properties
445
Plot 3D
Figure D-13: Visualization Browser with 3D Plot Properties Displayed
These properties control three-dimensional plot object visualizations. For each
property, the type of control and the values that can be assigned are listed. For a
description of how a particular control is used, refer to Appendix B, “Property
Controls”.
iTool User’s Guide
Plot 3D
446
Appendix D: Visualization Properties
Property
Control Type: Values
Vertex color table
User Defined: By selecting Edit Color → Table Edit access
the color table to manipulate plot color values.
XY Shadow
Boolean: Show XY shadow? Choose Hide or Show.
Default = Hide
YZ Shadow
Boolean: Show YZ shadow? Choose Hide or Show.
Default = Hide
XZ Shadow
Boolean: Show XZ shadow? Choose Hide or Show.
Default = Hide
Color
Color: Color for the plot line. Click to choose from the default
color palette, or specify RGB values. Default = [0,0,0]
(black)
Table D-43: Plot 3D Properties
Plot 3D
iTool User’s Guide
Appendix D: Visualization Properties
Property
447
Control Type: Values
Line style
Line Style: Style for the plot line. Select a style from the list.
Default =
(solid line)
Thickness
Line Thickness: Thickness for the plot line. Select a thickness
from the list. Default = 1
Shading
String List: Shading method. Select a method from the list.
Choose between these values:
• Flat: Flat shading
• Gouraud: Gouraud shading
Default = Flat
Symbol
Symbol: Symbol to appear at regular intervals on the plot line.
Choose a symbol from the list. Default = No symbol
Symbol size
Number: Factor from 0 - 1 determining the size of the selected
symbol. Move slider to change the size. Default = 0.2
Use default color
Boolean: Activate Symbol color property. Choose True or
False. Default = False
Symbol color
Color: Color for the selected symbol. Click to choose from the
default color palette, or specify RGB values. Default =
[0,0,0] (black)
Symbol thickness
Number: Line thickness from 1 - 9.9 for the selected symbol.
Move slider to change the thickness. Default = 1.
Symbol
increment
Number: Interval at which symbols will be displayed on the
plot line. Influenced by Number of points to average (above).
Edit to change the value. Default = 1
Table D-43: Plot 3D Properties (Continued)
iTool User’s Guide
Plot 3D
448
Appendix D: Visualization Properties
Surface
Figure D-14: Visualization Browser with Surface Properties Displayed
Surface
iTool User’s Guide
Appendix D: Visualization Properties
449
These properties control surface object visualizations. For each property, the type of
control and the values that can be assigned are listed. For a description of how a
particular control is used, refer to Appendix B, “Property Controls”.
Property
Control Type: Values
Color
Color: Color of the surface visualization. Click to choose from
the default color palette, or specify RGB values. Default =
[255,184,0] (gold)
Use color on
bottom
Boolean: Display a color for the bottom of the surface. Choose
True or False.
Default = False
Image palette
User Defined: By selecting Edit Color → Table Edit access
the color table to manipulate surface color values.
Bottom color
Color: Color to be used for the bottom of the surface. Click to
choose from the default color palette, or specify RGB values.
Default = [255,255,255] (white)
Minimum value
Number: Minimum Z-Axis value of the surface plot. Edit the
number to change the value.
Maximum value
Number: Maximum Z-Axis value of the surface plot. Edit the
number to change the value.
Table D-44: Surface Properties
iTool User’s Guide
Surface
450
Appendix D: Visualization Properties
Property
Surface style
Control Type: Values
String List: Style used for rendering the surface. Select a style
from the list. Choose from these values:
• Points: Data points in the surface are rendered as points.
• Wire mesh: Data points in the surface are connected with
lines, forming a mesh.
• Filled: Data points in the surface are connected with filled
quadrangles or triangles, forming a solid surface.
• Ruled XZ: Data points in the surface are connected with
horizontal (Z-direction) lines, forming a grid.
• Ruled YZ: Data points in the surface are connected with
vertical (Y-direction) lines, forming a grid.
• Lego: Stacked histogram-style plot in which each data
value is rendered as an outline box covering the XY extent
of the cell and with a height proportional to the Z value.
• Lego filled: Same as Lego, but the boxes are filled.
Default = Filled
Fill shading
String List: Method used for shading the surface polygons.
Select a shading method from the list. Choose from these
values:
• Flat: Shades polygons with a uniform fill.
• Gouraud: Interpolates intensities from each vertex along
each edge. Then, when the polygons are converted,
interpolates the shading along each scan line from the edge
intensities. Results in a more natural appearance.
Default = Flat
Draw method
String List: Method used for drawing the surface. Select a
method from the list. Choose from these values:
• Quads: Draw a surface composed of quadrangles.
• Triangles: Draw a surface composed of triangles.
Default = Quads
Table D-44: Surface Properties (Continued)
Surface
iTool User’s Guide
Appendix D: Visualization Properties
Property
451
Control Type: Values
Line style
Line Style: Style of lines used for constructing the surface.
Select a style from the list. Default =
(solid
line)
Line thickness
Line Thickness: Thickness of lines used for constructing the
surface. Select a thickness from the list. Default = 1
Remove hidden
lines
Boolean: Hide lines that show through the surface mesh or
grid. Choose True or False.
Default = False
Show skirt
Boolean: Display the edges of the surface as a filled skirt?
Choose True or False.
Default = False
Skirt bottom
height
Number: Set bottom of displayed skirt to this height. Edit the
number to change the value.
Default = 0
Texture
interpolation
String List: Method used for interpolating selected texture
map. Select a method from the list. Choose from these values:
• Nearest Neighbor: Assign the value of the nearest pixel to
the pixel in the output image. Fastest method, but may
cause jagged edges.
• Bilinear: Create a weighted average based on the nearness
and brightness of the closest four pixels, and assign that
value to the pixel in the output image.
Default = Nearest Neighbor
Texture hires
String List: Method used for tiling the selected high-resolution
texture map. Select a tiling method from the list. Choose from
these values:
• No tiling: Do not use tiling
• LOD tiling: Use level of detail tiling
• Tiling: Use tiling
Default = No tiling
Table D-44: Surface Properties (Continued)
iTool User’s Guide
Surface
452
Appendix D: Visualization Properties
Property
Control Type: Values
Skip zero opacity
Boolean: Skip zero opacity for surface? Choose True or False.
Default = True
Vertex Color
Scale
User Defined: Select vertex color scale bottom/top.
Texture Map
Scale
User Defined: Select texture map scale bottom/top.
Table D-44: Surface Properties (Continued)
Surface
iTool User’s Guide
Appendix D: Visualization Properties
453
Contour
Figure D-15: Visualization Browser with Contour Properties Displayed
These properties control contour object visualizations. For each property, the type of
control and the values that can be assigned are listed. For a description of how a
particular control is used, refer to Appendix B, “Property Controls”.
Property
Control Type: Values
Contour level
properties
User Defined: Click to edit individual or all contour level
properties. Click and Edit... to display the Contour Levels
window. See “Contour Levels Window” on page 455 for
details.
Use palette color
Boolean: Use palette color? Choose True or False. Default =
False
Table D-45: Contour Properties
iTool User’s Guide
Contour
454
Appendix D: Visualization Properties
Property
Planar Z Value
Control Type: Values
Number: Z value of plane on to which to project contours. Edit
the number to change the value.
Note - If the Z value is zero, and the Projection is Planar, then
the contour visualization is considered to be 2D. If the Z value
is nonzero, then the contour visualization is considered to be
3D, and the dataspace associated with this contour will be
automatically switched to 3D.
Default = 0
Number of levels
Number: Number of contour levels to display. Edit the number
to change the value. Default = 5
Projection
String List: Method of projection. Select a method from the list.
Choose from these values:
• Three-D: Project in three dimensions
• Planar: Project onto a plane
Default = Planar
Fill contours
Boolean: Fill space between contours? Choose True or False.
Default = False
Shading
String List: Shading method. Select a method from the list.
Choose between these values:
• Flat: Flat shading
• Gouraud: Gouraud shading
Default = Flat
Minimum value
Number: Minimum value to display in the contour. Edit
number to change value. No default value.
Maximum value
Number: Maximum value to display in the contour.Edit
number to change value. No default value.
Downhill ticks
Boolean: Show downhill ticks? Choose Hide or Show. Default
= Hide
Table D-45: Contour Properties (Continued)
Contour
iTool User’s Guide
Appendix D: Visualization Properties
Property
455
Control Type: Values
Downhill tick
interval
Number: Distance between downhill tick marks. Edit number
to change value. Default = 0.2
Downhill tick
length
Number: Length of downhill tick marks. Edit number to
change value. Default = 0.2
Table D-45: Contour Properties (Continued)
Contour Levels Window
Figure D-16: Contour Levels Window
The Contour Levels window contains properties that control the contour levels.
Property
Control Type: Values
Value
Number: Value of the contour level. Edit the number to change
the value. Default comes from contour data.
Color
Color: Color for the contour level. Click to choose from the
default color palette, or specify RGB values. Default =
[0,0,0] (black)
Table D-46: Contour Levels Properties
iTool User’s Guide
Contour
456
Appendix D: Visualization Properties
Property
Control Type: Values
Line style
Line Style: Style for the contour level. Select a style from the
list. Default =
(solid line)
Line thickness
Line Thickness: Thickness for the contour level. Select a
thickness from the list. Default = 1
Label
String List: Choose the kind of label to use for each contour
level. Choose from these values:
• None
• Value
• Text
• Symbol
Label interval
Number: Distance between labels on the contour level. Edit
number to change value. Default = 0.4
No label gaps
Boolean: Interrupt the contour level for the label. Choose True
or False. Default = False
Use label color
Boolean: Display a color for the contour level’s label. Choose
True or False. Default = False
Label color
Color: Color for the contour level label. Click to choose from
the default color palette, or specify RGB values. Default =
[0,0,0] (black)
Symbol label
Symbol: Symbol to appear at regular intervals on the contour
level. Choose a symbol from the list. Default = No symbol
Symbol size
Number: Factor from 0 - 1 determining the size of the selected
symbol. Move slider to change the size. Default = 0.2
Text label
String: Text that labels the contour object in the legend. Edit
string to change value. Default = none
Tick format code
String: Text that defines the tick format. Edit string to change
format. You can edit this value only if Tick Format is set to
Use Tick Format Code. Default = none
Table D-46: Contour Levels Properties (Continued)
Contour
iTool User’s Guide
Appendix D: Visualization Properties
Property
Tick format
457
Control Type: Values
String List: Choose a format code or time interval to use for
each tick interval. Choose from these values:
• None
• Use Tick Format Code
• Filled Fixed Width Integer
• Freeform Integer or Float
• Float with 2 or 4 decimal places
• Exponential with 2 or 4 decimal places
• Date (13 formats)
• Time (11 formats)
Default = None
Text font
String List: Font used for label text. Select a font from the list.
Choose from these values:
• Helvetica
• Courier
• Times
• Symbol
• Hershey
Default = Helvetica
Text style
String List: Style used for label text. Select a style from the list.
Choose from these values:
• Normal
• Bold
• Italic
• Bold italic
Default = Normal
Text font size
Number: Font size in points for the label text. Edit the number
to change the size. Default = 9
Table D-46: Contour Levels Properties (Continued)
iTool User’s Guide
Contour
458
Appendix D: Visualization Properties
Vector
Figure D-17: Visualization Browser with Vector Properties Displayed
These properties control vector visualizations. For each property, the type of control
and the values that can be assigned are listed. For a description of how a particular
control is used, refer to Appendix B, “Property Controls”.
Property
Grid units
Control Type: Values
String List: Set grid units type. Choose from:
• Not applicable
• Meters
• Degrees
Default = Not applicable
Table D-47: Vector Properties
Vector
iTool User’s Guide
Appendix D: Visualization Properties
Property
Vector style
459
Control Type: Values
String List: Set vector style type. Choose between these
values:
• Arrows
• Wind barbs
Default = Arrows
Length scale
Number: Length. Enter value.
Default = 1
Head size
Number: Head size. Enter value.
Default = 1
Arrow style
String List: Set arrow style type. Choose between these values:
• Lines
• Filled
Default = Filled
Proportional
heads
Boolean: Make arrow heads proportional? Choose True or
False. Default = False
Arrowhead angle
Number: Arrowhead angle value. Enter value.
Default = 30
Arrowhead
indentation
Number: Arrowhead indentation value. Enter value.
Arrow thickness
Number: Arrow thickness level. Choose value 1 through 10.
Default = 0.4
Default = 2
Line thickness
Number: Line thickness level. Choose value 1 through 10.
Default = 1
Data location
Boolean: Select location along arrow for data. Choose Tail,
Center, or Head. Default = Center
Automatic color
Boolean: Select color setting. Choose None, Magnitude, or
Direction. Default = Magnitude
Table D-47: Vector Properties (Continued)
iTool User’s Guide
Vector
460
Appendix D: Visualization Properties
Property
Control Type: Values
Color
Color: Color for arrows. Click to choose from the default color
palette, or specify RGB values. Default = [0,0,0] (black)
Color palette
Color: By selecting Edit color table → Edit access the color
table to manipulate vector color values
Note - To edit the opacity only in the editor, uncheck the R, G,
and B boxes in both the Modify and Display rows. Edit the
remaining line by clicking on and dragging the line in the
window. Click OK when finished.
Transparency
Number: Percent transparency. Move slider to change value.
Default = 0
Minimum
magnitude
Number: minimum magnitude. Enter value.
Default = None
Table D-47: Vector Properties (Continued)
Vector
iTool User’s Guide
Appendix D: Visualization Properties
Property
461
Control Type: Values
Maximum
magnitude
Number: maximum magnitude. Enter value.
Z value
Number: Z value of plane on to which to project the vector
visualization. Edit the number to change the value.
Default = None
Note - If the Z value is zero then the vector visualization is
considered to be 2D. If the Z value is nonzero, then the vector
visualization is considered to be 3D, and the dataspace
associated with this vector will be automatically switched to
3D.
Default = 0
Automatic
subsampling
Boolean: Automatically subsample the vector visualization?
Choose True or False. Default = False
Subsampling
method
String List: Set subsample type. Choose between these values:
• Nearest neighbor
• Linear
Default = Nearest neighbor
X subsampling
factor
Number: Subsample factor in the x direction.
Y subsampling
factor
Number: Subsample factor in the y direction.
Mark missing
points
Boolean: Automatically mark missing points? Choose True or
False. Default = False
Direction
convention
Boolean: Choose direction convention. Select Polar,
Meteorological, or Wind azimuths. Default = Polar
(counterclockwise from X axis)
Missing point
symbol
Symbol: Symbol to be used for missing points. Choose a
symbol from the list. Default = No symbol for arrow
visualizations, Points for wind barb visualization.
Symbol size
Number: Factor from 0 - 1 determining the size of the
selected symbol. Move slider to change the size. Default = 0.2
Default = 1
Default = 1
Table D-47: Vector Properties (Continued)
iTool User’s Guide
Vector
462
Appendix D: Visualization Properties
Property
Control Type: Values
Use default color
Boolean: Activate Symbol color property. Choose True or
False. Default = False
Symbol color
Color: Color for the selected symbol. Click to choose from the
default color palette, or specify RGB values. Default = [0,0,0]
(black)
Table D-47: Vector Properties (Continued)
Vector
iTool User’s Guide
Appendix D: Visualization Properties
463
Volume
Figure D-18: Visualization Browser with Volume Properties Displayed
These properties control volume object visualizations. For each property, the type of
control and the values that can be assigned are listed. For a description of how a
particular control is used, refer to Appendix B, “Property Controls”.
iTool User’s Guide
Volume
464
Appendix D: Visualization Properties
Property
Display Scale
Control Type: Values
Set the display scale for the selected volume.
Select Display Scale Bottom/Top → Edit
Table D-48: Volume Properties
Volume
iTool User’s Guide
Appendix D: Visualization Properties
Property
Color & Opacity
Table 0
465
Control Type: Values
Color: By selecting Edit Color → Table Edit access the
color table to manipulate plot color values
Note - To edit the opacity only in the editor, uncheck the R, G,
and B boxes in both the Modify and Display rows. Edit the
remaining line by clicking on and dragging the line in the
window. Click OK when finished.
Color & Opacity
Table 1
Color: By selecting Edit Color → Table Edit access the
color table to manipulate plot color values.
Table D-48: Volume Properties (Continued)
iTool User’s Guide
Volume
466
Appendix D: Visualization Properties
Property
Control Type: Values
Subvolume
String: Edit SubVolume Extents.
Auto render
Boolean: Automatically render the volume each time the
window is redrawn? Choose True or False. Default = False
Quality
String List: Quality of the volume. Choose between these
values:
• Low (texture maps)
• High (volume)
Default = Low
Boundary
String List: Boundary around the volume. Choose between
these values:
• Off
• Wire frame
• Solid walls
Default = Solid walls
Table D-48: Volume Properties (Continued)
Volume
iTool User’s Guide
Appendix D: Visualization Properties
Property
Boundary
transparency
467
Control Type: Values
Number: Percent transparency of the boundary around the
volume (wire frame or solid walls). Move slider to change
value.
Default = 90
Render step X
Number: Stepping factor through the voxel matrix in the x
direction.
Default = 1
Render step Y
Number: Stepping factor through the voxel matrix in the y
direction.
Default = 1
Render step Z
Number: Stepping factor through the voxel matrix in the z
direction.
Default = 1
Extents color
Color: Color for the volume. Click to choose from the default
color palette, or specify RGB values.
Default = [0,0,0] (black)
Ambient color
String: Choose from default color palette or specify RGB
values.
Default = [255, 255, 255] (white)
Composite
function
String: Choose composite function.
Default = Alpha Blending
Acceleration hints Boolean: Use acceleration hints? Choose Enable or Disable.
Default = Disable
Interpolation
String List: Set interpolation type. Choose between these
values:
• Nearest neighbor
• Trilinear
Default = Nearest neighbor
Use lighting
Boolean: Use lighting? Choose True or False. Default = False
Table D-48: Volume Properties (Continued)
iTool User’s Guide
Volume
468
Appendix D: Visualization Properties
Property
Voxel gradient
Control Type: Values
Color: Color of the volume. Click to choose from the default
color palette, or specify RGB values.
Default = [0,0,0] (black)
Update Z Buffer
Boolean: Update Z Buffer? Choose True or False.
Default = True
Skip zero opacity
Boolean: Skip zero opacity? Choose True or False.
Default = True
Table D-48: Volume Properties (Continued)
Volume
iTool User’s Guide
Appendix D: Visualization Properties
469
Isosurface
Figure D-19: Visualization Browser with Isosurface Properties Displayed
These properties control isosurface object visualizations. For each property, the type
of control and the values that can be assigned are listed. For a description of how a
particular control is used, refer to Appendix B, “Property Controls”.
Property
Color
Control Type: Values
Color: Color to be used for the isosurface lines in this
visualization. Click to choose from the default color palette, or
specify RGB values.
Default = [0,0,0] (black)
Linestyle
Line Style: Style of the isosurface lines. Select a line style
from the list.
Default = No line
Thickness
Line Thickness: Thickness of the isosurface lines in points.
Select a thickness from the list.
Default = 1
Table D-49: Isosurface Properties
iTool User’s Guide
Isosurface
470
Appendix D: Visualization Properties
Property
Fill background
Control Type: Values
Boolean: Fill background? Choose True or False.
Default = True
Fill color
Color: Color to fill. Click to choose from the default color
palette, or specify RGB values.
Default = [255,0,0] (red)
Transparency
Number: Level of transparency.
Default = 0
Source color
String List: Choose from the following:
• Isovalue selected (Volume color table)
• User selected (Fill Color Property)
Default = Isovalue selected (Volume color table)
Isovalue dialog
String: Edit isovalue.
Isovalue
Number: The value for the isosurface, which should be in the
range [Min(volume data), Max(volume data)].
Mesh quality
Number: The percent of the isosurface mesh to retain. Default
is 100.
Table D-49: Isosurface Properties (Continued)
Isosurface
iTool User’s Guide
Appendix D: Visualization Properties
471
Interval Volume
Figure D-20: Visualization Browser with Interval Volume Properties Displayed
These properties control interval volume object visualizations. For each property, the
type of control and the values that can be assigned are listed. For a description of how
a particular control is used, refer to Appendix B, “Property Controls”.
Property
Color
Control Type: Values
Color: Color to be used for the interval volume lines in this
visualization. Click to choose from the default color palette, or
specify RGB values.
Default = [0,0,0] (black)
Linestyle
Line Style: Style of the interval volume lines. Select a line
style from the list.
Default = No line
Table D-50: Interval Volume Container Properties
iTool User’s Guide
Interval Volume
472
Appendix D: Visualization Properties
Property
Thickness
Control Type: Values
Line Thickness: Thickness of the interval volume lines in
points. Select a thickness from the list.
Default = 1
Fill background
Boolean: Fill background? Choose True or False.
Default = True
Fill color
Color: Color to fill. Click to choose from the default color
palette, or specify RGB values.
Default = [255,0,0] (red)
Transparency
Number: Level of transparency.
Default = 0
Source Color
String List: Set source color. Choose from the following:
• Isovalue selected (Volume color table)
• User selected (Fill Color Property)
Default = Isovalue selected (Volume color table)
Isovalue dialog
String: Edit isovalue.
Isovalue 0
Number: The lower isovalue for the interval volume, which
should be in the range [Min(volume data), Max(volume data)].
Table D-50: Interval Volume Container Properties (Continued)
Interval Volume
iTool User’s Guide
Appendix D: Visualization Properties
Property
473
Control Type: Values
Isovalue 1
Number: The upper isovalue for the interval volume, which
should be in the range [Min(volume data), Max(volume data)].
Mesh quality
Number: The percent of the interval volume mesh to retain.
Default is 100.
Table D-50: Interval Volume Container Properties (Continued)
iTool User’s Guide
Interval Volume
474
Appendix D: Visualization Properties
Image Plane
Figure D-21: Visualization Browser with Image Plane Properties Displayed
These properties control image plane object visualizations. For each property, the
type of control and the values that can be assigned are listed. For a description of how
a particular control is used, refer to Appendix B, “Property Controls”.
Property
Control Type: Values
Opacity Control
String List: Set opacity. Choose from the following:
• Use Opacity Table
• Opaque
• Opacity Value
Default = Use Opacity Table
Opacity Value
Number: Factor from 0 - 100 determining the level of opacity.
Move slider to change the size.
Default = 50
Table D-51: Image Plane Container Properties
Image Plane
iTool User’s Guide
Appendix D: Visualization Properties
Property
Orientation
475
Control Type: Values
Set orientation.
Default = X
Location
Number: The location of the image plane along the associated
dimension (either X, Y, or Z depending on orientation). The
valid range is from 0 to the size of the associated volume
dimension.
Color
Color: Color to be used for the image plane lines in this
visualization. Click to choose from the default color palette, or
specify RGB values.
Default = [255, 255, 255] (white)
Bottom color
Color: Color to be used for the image plane bottom color in
this visualization. Click to choose from the default color
palette, or specify RGB values.
Default = [255, 255, 255] (white)
Linestyle
Line Style: Style of lines used for constructing the surface.
Select a style from the list.
Default =
Thickness
(solid line)
Line Thickness: Thickness of lines used for constructing the
surface. Select a thickness from the list.
Default = 1
Style
Style: Style of lines used. Choose from the following:
• Points
• Lines
• Filled
Default = Filled
Depth offset
Number: Set depth offset value. Enter value.
Default = 1
Remove hidden
Boolean: Remove hidden? Choose True or False.
Default = False
Table D-51: Image Plane Container Properties (Continued)
iTool User’s Guide
Image Plane
476
Appendix D: Visualization Properties
Property
Skip zero opacity
Control Type: Values
Boolean: Skip zero opacity? Choose True or False.
Default = True
Polygon rejection
String List: Hide polygons based on their orientation. Choose
from the following:
• None
• Normals point away
• Normals point toward
Default = None
Note - Polygon rejection has no effect on non-filled polygons
(where Style is Points or Lines).
Shading
String List: Shading method. Select a method from the list.
Choose between these values:
• Flat: Flat shading
• Gouraud: Gouraud shading
Default = Flat
Texture
interpolation
String List: Set texture interpolation type. Choose between
these values:
• Nearest neighbor
• Bilinear
Default = Nearest neighbor
Table D-51: Image Plane Container Properties (Continued)
Image Plane
iTool User’s Guide
Appendix D: Visualization Properties
477
Colorbar
Figure D-22: Visualization Browser with Colorbar Properties Displayed
iTool User’s Guide
Colorbar
478
Appendix D: Visualization Properties
These properties control colorbar object visualizations. For each property, the type of
control and the values that can be assigned are listed. For a description of how a
particular control is used, refer to Appendix B, “Property Controls”.
Property
Border
Control Type: Values
Boolean: Set border on or off. Choose True or False.
Default = False
Orientation
Boolean: Set orientation of colorbar. Choose Horizontal or
Vertical.
Default = Horizontal
Color
Color: Color to be used for the colorbar in this visualization.
Click to choose from the default color palette, or specify RGB
values. Default = [0,0,0] (black)
Line style
Line Style: Style of the colorbar lines. Select a line style from
the list. Default =
(solid line)
Line thickness
Line Thickness: Thickness of the colorbar lines in points.
Select a thickness from the list. Default = 1
Major ticks
Number: Set number of major tick marks. Enter value.
Default = 3
Minor ticks
Number: Set number of minor tick marks. Enter value.
Default = 0
Major tick length
Number: Factor from 0 - 1 determining major tick length.
Move slider to change the size.
Default = .05
Minor tick length
Number: Factor from 0 - 1 determining minor tick length.
Move slider to change the size.
Default = 1
Tick interval
Number: Set tick interval. Enter value.
Default = 0
Table D-52: Colorbar Container Properties
Colorbar
iTool User’s Guide
Appendix D: Visualization Properties
Property
Tick layout
479
Control Type: Values
String List: Set tick layout type. Choose between these values:
• Axis plus labels
• Labels only
• Box style
Default = Axis plus labels
Tick direction
String List: Set tick direction. Choose between these values:
• Right/Above
• Left/Below
Default = Right/Above
Logarithmic axis
Default = false
Text show
Boolean: Set text to show or not show. Choose True or False.
Default = True (show)
Text position
String List: Set text position. Choose between these values:
• Below/left
• Above/right
Default = Below/left
Tick format code
Shows the code for the tick format selected. Default = empty
Tick format
String List: Choose a format code or time interval to use for
each tick interval. Choose from these values:
• None
• Use Tick Format Code
• Filled Fixed Width Integer
• Freeform Integer or Float
• Float with 2 or 4 decimal places
• Exponential with 2 or 4 decimal places
• Date (13 formats)
• Time (11 formats)
Default = None
Table D-52: Colorbar Container Properties (Continued)
iTool User’s Guide
Colorbar
480
Appendix D: Visualization Properties
Property
Title
Control Type: Values
Title: Enter title for colorbar.
Default = RGB Table 0
Text color
Color: Color to be used for the legend text. Click to choose
from the default color palette, or specify RGB values. Default
= [0,0,0] (black)
Text font
String List: Font used for legend text. Select a font from the
list. Choose from these values:
• Helvetica
• Courier
• Times
• Symbol
• Hershey 3 Simplex
In addition to the above standard fonts, you will also have
available all of the other Hershey fonts as well as any
TrueType fonts available to IDL.
Default = Helvetica
Text style
String List: Style used for legend text. Select a style from the
list. Choose from these values:
• Normal
• Bold
• Italic
• Bold italic
Default = Normal
Text font size
Number: Font size in points for the legend text. Edit the
number to change the size. Default = 12
Table D-52: Colorbar Container Properties (Continued)
Colorbar
iTool User’s Guide
Appendix D: Visualization Properties
481
Histogram
Figure D-23: Visualization Browser with Histogram Properties Displayed
iTool User’s Guide
Histogram
482
Appendix D: Visualization Properties
These properties control histogram object visualizations. For each property, the type
of control and the values that can be assigned are listed. For a description of how a
particular control is used, refer to Appendix B, “Property Controls”.
Property
Vertex Colors
Color Table
Control Type: Values
Color: By selecting Edit Color → Table Edit access the
color table to manipulate plot color values
Histogram binsize Number: Set histogram binsize.
Default = 1
Color
Color: Color to be used for the plot lines. RGB values are
assigned or you may edit your color.
Default = varies
Table D-53: Histogram Container Properties
Histogram
iTool User’s Guide
Appendix D: Visualization Properties
Property
Line style
483
Control Type: Values
Line Style: Style of the colorbar lines. Select a line style from
the list.
Default =
Thickness
(solid line)
Line Thickness: Thickness of the colorbar lines in points.
Select a thickness from the list.
Default = 1
Minimum value
Number: Minimum histogram value. Enter a number.
Default = varies
Maximum value
Number: Maximum histogram value. Enter a number.
Default = varies
Histogram plot
Boolean: Set histogram to show or not show. Choose True or
False.
Default = True (show)
Number of points
to average
Number: Number of points in plot to be averaged. Enter a
number.
Default = 1
Polar plot
Boolean: Set histogram to show or not show as a polar plot.
Choose True or False.
Default = False (hide)
Fill plot
Boolean: Set histogram to show or not show as a filled plot.
Choose True or False.
Default = False (hide)
Fill level
Number: Level to fill if fill plot is selected. Enter a number.
Default = varies
Fill color
Color: Color to be used for fill plot if selected.
Default = [128, 128, 128] (grey)
Table D-53: Histogram Container Properties (Continued)
iTool User’s Guide
Histogram
484
Appendix D: Visualization Properties
Property
Fill transparency
Control Type: Values
Number: Value of transparency if fill plot is selected. Enter a
number.
Default = 0
Symbol
String List: Font used for legend text. Select a font from the
list. Choose from the list of symbols.
Default = No symbol
Symbol size
Number: Value for symbol size in points if fill symbol is
selected. Enter a number.
Default = 0.2
Use default color
Boolean: Set to use default color for symbols. Choose True or
False.
Default = True (use default color)
Symbol color
Color: Color to be used for symbols if default color is set to
False. Enter a value.
Default = varies
Symbol thickness
Number: Value for symbol thickness in points if symbol is
selected. Enter a number.
Default = 1
Symbol
increment
Number: Value for symbol increments if fill symbol is
selected. Enter a number.
Default = 1
Table D-53: Histogram Container Properties (Continued)
Histogram
iTool User’s Guide
Appendix D: Visualization Properties
485
Axes
Figure D-24: Visualization Browser with Axis Properties Displayed
These properties control axis object visualizations. For each property, the type of
control and the values that can be assigned are listed. For a description of how a
particular control is used, refer to Appendix B, “Property Controls”.
iTool User’s Guide
Axes
486
Appendix D: Visualization Properties
The following table contains the properties that control the container for the
visualization axes.
Property
Style
Control Type: Values
String List: Select display style for axes. Choose from these
values:
• None: Do not display axes.
• At Dataspace Minimum: Display 2 axes for 2-D
visualization, 3 axes for 3-D visualization.
• Box Axes: Display 4 axes for 2-D visualization, 12 axes
for 3-D visualization.
• Crosshairs: Display crosshair style axes.
Default = At Dataspace Minimum
Lock to Data
Boolean: Locks axis (axes) to data.
Default = False
Transparency
Number: Adjusts transparency of axis (axes).
Default = 0
Color
Color: Color to be used for the axis lines in this visualization.
Click to choose from the default color palette, or specify RGB
values. Default = [0,0,0] (black)
Line style
Line Style: Style of the axis tick lines. Select a line style from
the list. Default =
(solid line)
Line thickness
Line Thickness: Thickness of the axis tick lines. Select a
thickness from the list. Default = 1
Major ticks
Number: Set number of major tick marks. Enter value.
Default = 0
Minor ticks
Number: Set number of minor tick marks. Enter value.
Default = 0
Table D-54: Axes Container Properties
Axes
iTool User’s Guide
Appendix D: Visualization Properties
Property
487
Control Type: Values
Major Tick
Length
Number: Normalized length of major tick marks for all axes
from 0 (no ticks) to 1 (major tick marks span the
visualization). Move the slider to change the value. Default =
0.05.
Minor tick length
Number: Relative length of minor tick marks for all axes from
-1 (minor tick marks extend the length of major tick marks on
left side of axes) to 1 (minor tick marks extend same length as
major tick marks on right side of axes). Move the slider to
change the value. Default = 0.5 (minor tick marks extend
one-half the length of major tick marks on right side of axes).
Tick interval
Number: Interval between ticks. Edit the number to change the
value. Default = 0
Tick layout
String List: Select layout style for major and minor tick
visualization on all axes. Choose from these values:
• Axis plus labels: Display tick labels and marks.
• Labels only: Display tick labels only (no tick marks).
• Box style: Display tick labels and marks, with labels
enclosed in boxes.
Default = Axis plus labels
Tick direction
String List: Select a direction for tick marks. Choose from
these values:
• Right/Above: Place tick marks to the right of or above the
axis line.
• Left/Below: Place text to the left of or below the axis line.
Default = Right/Above
Text show
Boolean: Set text to show or not show. Choose True or False.
Default = True (show)
Table D-54: Axes Container Properties (Continued)
iTool User’s Guide
Axes
488
Appendix D: Visualization Properties
Property
Text position
Control Type: Values
String List: Select a position for tick and label text. Choose
from these values:
• Below/left: Place text below or to the left of the axis line.
• Above/right: Place text above or to the right of the axis
line.
Default = Below/left
Tick format code
String: A string defining the format of the tick annotation
information. The format code should be enclosed in
parentheses, and should conform to one of the formats
described in “Format Codes” (Chapter 18, Application
Programming). This field always displays the current format
code, but is only available for editing if Use Tick Format
Code is selected as the value of the Tick format property.
Tick format
String List: Choose a format code or time interval to use for
each tick interval. Choose from these values:
• None
• Use Tick format code
• Filled Fixed Width Integer
• Freeform Integer or Float
• Float with 2 or 4 decimal places
• Exponential with 2 or 4 decimal places
• Date (13 formats)
• Time (11 formats)
Default = None
Title
String: Title to apply to all axes for this visualization. Enter
title text for the axes. No default value.
Text color
Color: Color to be used for the text. Click to choose from the
default color palette, or specify RGB values.
Default = [0,0,0] (black)
Table D-54: Axes Container Properties (Continued)
Axes
iTool User’s Guide
Appendix D: Visualization Properties
Property
Text font
489
Control Type: Values
String List: Font used for tick and label text. Select a font from
the list. Choose from these values:
• Helvetica
• Courier
• Times
• Symbol
• Hershey 3 Simplex
In addition to the above standard fonts, you will also have
available all of the other Hershey fonts as well as any
TrueType fonts available to IDL.
Default = Helvetica
Text style
String List: Style used for tick and label text. Select a style
from the list. Choose from these values:
• Normal
• Bold
• Italic
• Bold italic
Default = Normal
Text font size
Number: Font size in points for the tick and label text. Edit the
number to change the size. Default = 12
Table D-54: Axes Container Properties (Continued)
This table contains the properties that control axis visualization X, Y, or (for threedimensional visualizations) Z. For each property, the type of control and the values
iTool User’s Guide
Axes
490
Appendix D: Visualization Properties
that can be assigned are listed. For a description of how a particular control is used,
refer to Appendix B, “Property Controls”.
Property
Control Type: Values
Color
Color: Color to be used for the axis line. Click to choose from
the default color palette, or specify RGB values. Default =
[0,0,0] (black)
Line style
Line Style: Style of the axis tick lines. Select a line style from
the list. Default =
(solid line)
Line thickness
Line Thickness: Thickness of the axis tick lines in points.
Select a thickness from the list. Default = 1
Major ticks
Number: Number of major ticks marks to display along the
axis. Edit the number to change the value. Default = 5
Minor ticks
Number: Number of minor ticks to display between major
ticks. Edit the number to change the value. Default = 3
Major tick length
Number: Normalized length of major tick marks for this axis
from 0 (no ticks) to 1 (major tick marks span the
visualization). Move the slider to change the value. Default =
0.05
Minor tick length
Number: Relative length of minor tick marks for this axis from
-1 (minor tick marks extend the length of major tick marks on
left side of axis) to 1 (minor tick marks extend same length as
major tick marks on right side of axis). Move the slider to
change the value. Default = 0.5 (Minor tick marks extend
one-half the length of major tick marks on right side of axis).
Tick interval
Number: Interval between major tick marks. Edit the number
to change the value. Default = 0 (use the default interval for
the specified range)
Table D-55: Property Settings for Individual Axes
Axes
iTool User’s Guide
Appendix D: Visualization Properties
Property
Tick layout
491
Control Type: Values
String List: Select layout style for major and minor tick
visualization. Choose from these values:
• Axis plus labels: Display tick labels and marks.
• Labels only: Display tick labels only (no tick marks).
• Box style: Display tick labels and marks, with labels
enclosed in boxes.
Default = Axis plus labels
Tick direction
String List: Select a direction for tick marks. Choose from
these values:
• Right/Above: Place tick marks to the right of or above the
axis line.
• Left/Below: Place text to the left of or below the axis line.
Default = Right/Above
Text show
Boolean: Show tick and label text? Choose True or False.
Default = True.
Text position
String List: Select a position for tick and label text. Choose
from these values:
• Below/left: Place text below or to the left of the axis line.
• Above/right: Place text above or to the right of the axis
line.
Default = Below/left
Tick format code
String: A string defining the format of the tick annotation
information. The format code should be enclosed in
parentheses, and should conform to one of the formats
described in “Format Codes” (Chapter 18, Application
Programming). This field always displays the current format
code, but is only available for editing if Use Tick Format
Code is selected as the value of the Tick format property.
Table D-55: Property Settings for Individual Axes (Continued)
iTool User’s Guide
Axes
492
Appendix D: Visualization Properties
Property
Tick format
Control Type: Values
String List: Choose a format code or time interval to use for
each tick interval. Choose from these:
• None
• Use Tick format code
• Filled Fixed Width Integer
• Freeform Integer or Float
• Float with 2 or 4 decimal places
• Exponential with 2 or 4 decimal places
• Date (13 formats)
• Time (11 formats)
Default = None
Title
String: Title to apply to this axis. Enter title text for the axes.
No default value.
Text color
Color: Color to be used for the text. Click to choose from the
default color palette, or specify RGB values. Default =
[0,0,0] (black)
Text font
String List: Font used for tick and label text. Select a font from
the list. Choose from these values:
• Helvetica
• Courier
• Times
• Symbol
• Hershey
Default = Helvetica
Table D-55: Property Settings for Individual Axes (Continued)
Axes
iTool User’s Guide
Appendix D: Visualization Properties
Property
Text style
493
Control Type: Values
String List: Style used for tick and label text. Select a style
from the list. Choose from these values:
• Normal
• Bold
• Italic
• Bold italic
Default = Normal
Text font size
Number: Font size in points for the tick and label text. Edit the
number to change the size. Default = 12
Table D-55: Property Settings for Individual Axes (Continued)
iTool User’s Guide
Axes
494
Appendix D: Visualization Properties
Lights
Figure D-25: Visualization Browser with Light Properties Displayed
Lights properties control the lighting of the data space. These properties are available
only for 3-D Surface and Volume visualizations.
Three types of lights can be configured through the Lights properties: Ambient Light,
Light 1 (from above), and Light 2 (from below). Each type of light has the same set of
properties, as described in Table D-56.
Lights
iTool User’s Guide
Appendix D: Visualization Properties
495
For each property, the type of control and the values that can be assigned are listed.
For a description of how a particular control is used, refer to Appendix B, “Property
Controls”.
Property
Type
Control Type: Values
String List: Type of light source for this light. Select a type of
light from the list. Choose from these options:
• Ambient: Universal light source with no direction or
position. An ambient light illuminates every surface in the
scene equally, which means that no edges are made visible
by contrast. Ambient light controls the overall brightness
and color of the scene.
• Positional: Supplies divergent light rays so that the edges
of surfaces can be made visible by contrast. A positional
light source can be located anywhere in the scene.
• Directional: Supplies parallel light rays from a light
source located at an infinite distance from scene.
• Spotlight: Illuminates only a specific area defined by the
light's position, direction, and the cone angle (angle the
spotlight covers).
Default = Positional
Distance
Number: Distance of the light source from the visualization
from -1 (in front of the visualization) to 1 (behind the
visualization). Move the slider to change the value.
Default = -1 for Ambient Light and Light 1, 1 for Light 2
Intensity
Number: Intensity of this light from 0 (no light) to 1 (bright
light). Move the slider to change the value. Default = 0.5 for
Ambient Light, 0.8 for Light 1 and Light 2
Color
Color: Color of this light. Click to choose from the default
color palette, or specify RGB values.
Default = [255,255,255] (white)
Table D-56: Property Settings for Lights
iTool User’s Guide
Lights
496
Appendix D: Visualization Properties
Property
Cone angle
Control Type: Values
Number: Angle the spotlight covers from 0º to 180º. Active
only when Spotlight type is selected. Move the slider to
change the value.
Default = 60
Focus attenuation
Number: Floating-point value from 0 to 128 that attenuates the
intensity of spotlights as the distance from the center of the
cone of coverage increases. This factor is used as an exponent
to the cosine of the angle between the direction of the spotlight
and the direction from the light to the vertex being lighted.
Active only when Spotlight type is selected. Move the slider
to change the value.
Default = 0
Table D-56: Property Settings for Lights (Continued)
Lights
iTool User’s Guide
Appendix D: Visualization Properties
497
Polygonal ROI
Figure D-26: Visualization Browser with Polygon ROI Properties Displayed
These properties control polygonal ROI object visualizations. For each property, the
type of control and the values that can be assigned are listed. For a description of how
a particular control is used, refer to Appendix B, “Property Controls”
Property
Control Type: Values
Color
Color: Color to be used for the line. Click to choose from the
default color palette, or specify RGB values. Default =
[0,0,0] (black)
Linestyle
Line Style: Style of the polygon lines. Select a line style from
the list. Default =
(solid line)
Thickness
Line Thickness: Thickness of the polygon lines in points.
Select a thickness from the list. Default = 1
Fill background
Boolean: Fill background? Choose True or False.
Default = True
Table D-57: Property Settings for Polygonal ROI
iTool User’s Guide
Polygonal ROI
498
Appendix D: Visualization Properties
Property
Fill color
Control Type: Values
Color: Color to fill. Click to choose from the default color
palette, or specify RGB values.
Default = [255,255, 255] (white)
Transparency
Number: Level of transparency.
Default = 0
Table D-57: Property Settings for Polygonal ROI (Continued)
Polygonal ROI
iTool User’s Guide
Appendix D: Visualization Properties
499
IDL Graphics Objects
Figure D-27: Visualization Browser with
IDL Graphics Object Properties Displayed
You can import an IDL graphics object into an iTool and display it directly by
selecting the “IDL Graphics Object” visualization type. The properties available will
depend on the type of graphics object. See the properties listing for the specific
graphics object in the IDL Reference Guide for details.
Note
The behavior of IDL graphics objects imported into an iTool may not be the same
as that of the corresponding iTool visualization. While importing an existing
graphics object into an iTool will often work, you will generally obtain better
results using an iTool visualization type.
Tip
In order to display properties for a generic IDL graphics object in the iTool property
sheet interface, the graphics object must have been created with the
REGISTER_PROPERTIES keyword set. If no properties are registered, only the
three standard iTool properties (Name, Description, and Show) will be present, as
displayed in the previous figure.
iTool User’s Guide
IDL Graphics Objects
500
Appendix D: Visualization Properties
Map Grid
Figure D-28: Visualization Browser with
Map Grid Object Properties Displayed
Map Grid
iTool User’s Guide
Appendix D: Visualization Properties
501
These properties control map grid object visualizations. For each property, the type of
control and the values that can be assigned are listed. For a description of how a
particular control is used, refer to Appendix B, “Property Controls”.
Name
Description
Automatic grid
Boolean: Automatically compute the grid range and
spacing. Choose True or False. Default = True
Note - If a SAVE file is restored from an IDL version prior
to 6.2, this property is set to False.
Longitude minimum (deg)
Number: Minimum longitude, in degrees, to include in the
grid
Longitude maximum (deg)
Number: Maximum longitude, in degrees, to include in the
grid
Latitude minimum (deg)
Number: Minimum latitude, in degrees, to include in the
grid
Latitude maximum (deg)
Number: Maximum latitude, in degrees, to include in the
grid
Longitude spacing
Number: Longitude grid spacing, in degrees
Latitude spacing
Number: Latitude grid spacing, in degrees
Longitude lines
User Defined: Click to edit individual or all longitude line
properties. Click and Edit... to display the Map Grid
Lines dialog.
Table D-58: Property Settings for Map Grid
iTool User’s Guide
Map Grid
502
Appendix D: Visualization Properties
Name
Description
Latitude lines
User Defined: Click to edit individual or all latitude line
properties. Click and Edit... to display the Map Grid
Lines dialog.
Color
Color: Color for the grid lines. Click to choose from the
default color palette, or specify RGB values. Default =
[0,0,0] (black)
Thickness
Line Thickness: Thickness for the grid lines. Select a
thickness from the list. Default = 1
Transparency
Number: Transparency of the grid lines from 0% to 100%.
Move the slider to change the value. Default = 0
Label
Boolean: Use labels on the grid lines. Choose True or
False. Default = True
Label position
Number: Normalized label position. Default = 0.5
Use label color
Boolean: Use default color instead of Label color. Choose
True or False. Default = False
Label color
Color: Color for the grid label. Click to choose from the
default color palette, or specify RGB values. Default =
[0,0,0] (black)
Table D-58: Property Settings for Map Grid (Continued)
Map Grid
iTool User’s Guide
Appendix D: Visualization Properties
503
Name
Label fill background
Description
String List: Choose the kind of fill background for the
label. Choose from these values:
• None
• View color
• Fill color
Label fill color
Color: Color for the label background’s fill. Click to
choose from the default color palette, or specify RGB
values. Default = [255, 255, 255] (white)
Z value
Number: Z value of plane on to which to project the map
visualization. Edit the number to change the value.
Note - If the Z value is zero then the map visualization is
considered to be 2D. If the Z value is nonzero, then the
map visualization is considered to be 3D, and the dataspace
associated with this map will be automatically switched to
3D.
Default = 0
Text font
String List: Font used for label text. Select a font from the
list. Choose from these values:
• Helvetica
• Courier
• Times
• Symbol
• Hershey 3 Simplex
In addition to the above standard fonts, you will also have
available all of the other Hershey fonts as well as any
TrueType fonts available to IDL.
Default = Helvetica
Table D-58: Property Settings for Map Grid (Continued)
iTool User’s Guide
Map Grid
504
Appendix D: Visualization Properties
Name
Text style
Description
String List: Style used for label text. Select a style from the
list. Choose from these values:
• Normal
• Bold
• Italic
• Bold italic
Default = Normal
Text font size
Number: Font size in points for the label text. Edit the
number to change the size. Default = 12
Table D-58: Property Settings for Map Grid (Continued)
The Map Grid Lines dialog displays a property sheet for the longitude or latitude
lines, depending on which set you want to edit. This sheet includes the same
properties as the overall Map Grid object, from Color to Text font size.
Map Grid
iTool User’s Guide
Appendix D: Visualization Properties
505
ShapePolygon
Figure D-29: Visualization Browser with
ShapePolygon Properties Displayed
These properties control ShapePolygon visualizations. For each property, the type of
control and the values that can be assigned are listed. For a description of how a
particular control is used, refer to Appendix B, “Property Controls”.
Name
Description
Color
Color: Color for the ShapePolygon line. Click to choose
from the default color palette, or specify RGB values.
Default = [0,0,0] (black)
Line style
Line Style: Style for the ShapePolygon line. Select a style
from the list. Default =
(solid line)
Thickness
Line Thickness: Thickness for the ShapePolygon line.
Select a thickness from the list. Default = 1
Fill background
Boolean: Fill background? Choose True or False.
Default = False
Table D-59: Property Settings for ShapePolygon
iTool User’s Guide
ShapePolygon
506
Appendix D: Visualization Properties
Name
Description
Fill color
Color: Color for the ShapePolygon fill. Click to choose
from the default color palette, or specify RGB values.
Default = [255, 255, 255] (white)
Z value
Number: Z value of plane on to which to project the shape
polygon visualization. Edit the number to change the value.
Note - If the Z value is zero then the shape polygon
visualization is considered to be 2D. If the Z value is
nonzero, then the shape polygon visualization is considered
to be 3D, and the dataspace associated with this shape
polygon will be automatically switched to 3D.
Default = 0
Transparency
Number: Transparency of the ShapePolygon fill from 0%
to 100%. Move the slider to change the value. Default = 0
Table D-59: Property Settings for ShapePolygon (Continued)
ShapePolygon
iTool User’s Guide
Appendix D: Visualization Properties
507
ShapePolyline
Figure D-30: Visualization Browser with
ShapePolyline Properties Displayed
These properties control ShapePolyline visualizations. For each property, the type of
control and the values that can be assigned are listed. For a description of how a
particular control is used, refer to Appendix B, “Property Controls”.
Name
Description
Transparency
Number: Transparency of the ShapePolyline from 0% to
100%. Move the slider to change the value. Default = 0
Color
Color: Color for the ShapePolyline. Click to choose from
the default color palette, or specify RGB values. Default =
[0,0,0] (black)
Line style
Line Style: Style for the ShapePolyline. Select a style from
the list. Default =
(solid line)
Table D-60: Property Settings for ShapePolyline
iTool User’s Guide
ShapePolyline
508
Appendix D: Visualization Properties
Name
Description
Thickness
Line Thickness: Thickness for the ShapePolyline. Select a
thickness from the list. Default = 1
Z value
Number: Z value of plane on to which to project the shape
polyline visualization. Edit the number to change the value.
Note - If the Z value is zero then the shape polyline
visualization is considered to be 2D. If the Z value is
nonzero, then the shape polyline visualization is considered
to be 3D, and the dataspace associated with this shape
polyline will be automatically switched to 3D.
Default = 0
Table D-60: Property Settings for ShapePolyline (Continued)
ShapePolyline
iTool User’s Guide
Appendix D: Visualization Properties
509
ShapePoint
These properties control ShapePoint visualizations. For each property, the type of
control and the values that can be assigned are listed. For a description of how a
particular control is used, refer to Appendix B, “Property Controls”.
Name
Description
Symbol
Symbol: Symbol to represent each ShapePoint. Choose a
symbol from the list. Default = No symbol
Symbol size
Number: Factor from 0 to 1 determining the size of the
selected symbol. Move slider to change the size. Default =
0.2
Symbol color
Color: Color for the selected symbol. Click to choose from
the default color palette, or specify RGB values. Default =
[0,0,0] (black)
Symbol thickness
Number: Symbol thickness from 1 to 9.9 for the selected
symbol. Move slider to change the thickness. Default = 1.
Transparency
Number: Transparency of the ShapePoint fill from 0% to
100%. Move the slider to change the value. Default = 0
Table D-61: Property Settings for ShapePoint
iTool User’s Guide
ShapePoint
510
Appendix D: Visualization Properties
Streamlines
These properties control Streamline visualizations. For each property, the type of
control and the values that can be assigned are listed. For a description of how a
particular control is used, refer to Appendix B, “Property Controls”
Name
Grid units
Description
String List: Set grid units type. Choose from:
• Not applicable
• Meters
• Degrees
Default = Not applicable
Head size
Number: Head size. Enter value.
Default = 1
Line thickness
Number: Line thickness level. Choose value 1 through 10.
Default = 1
Automatic color
String List: Select color setting. Choose None, Magnitude,
or Direction. Default = None
Color
Color: Color for arrows. Click to choose from the default
color palette, or specify RGB values. Default = [0,0,0]
(black)
Table D-62: Property Settings for Streamlines
Streamlines
iTool User’s Guide
Appendix D: Visualization Properties
511
Name
Color palette
Description
Color: By selecting Edit color table → Edit access the
color table to manipulate vector color values
Note - To edit the opacity only in the editor, uncheck the
R, G, and B boxes in both the Modify and Display rows.
Edit the remaining line by clicking on and dragging the line
in the window. Click OK when finished.
Transparency
Number: Percent transparency. Move slider to change
value.
Default = 0
Table D-62: Property Settings for Streamlines (Continued)
iTool User’s Guide
Streamlines
512
Appendix D: Visualization Properties
Name
Z value
Description
Number: Z value of plane on to which to project the vector
visualization. Edit the number to change the value.
Note - If the Z value is zero then the vector visualization is
considered to be 2D. If the Z value is nonzero, then the
vector visualization is considered to be 3D, and the
dataspace associated with this vector will be automatically
switched to 3D.
Default = 0
Direction convention
String List: Choose direction convention. Select Polar,
Meteorological, or Wind azimuths. Default = Polar
(counterclockwise from X axis)
X stream particles
Number: Number of X stream particles. Choose value.
Default = 25
Y stream particles
Number: Number of X stream particles. Choose value.
Default = 25
Streamline steps
Number: Number of streamline steps. Choose value
(minimum value is 2).
Default = 100
Streamline step size
Number: Numeric value for streamline step size. Enter
value.
Default = 0.2
Table D-62: Property Settings for Streamlines (Continued)
Streamlines
iTool User’s Guide
Appendix D: Visualization Properties
513
2D Annotation Layer Properties
The Annotation layer appears in the Visualization browser.
Figure D-31: Visualization Browser with Annotation Properties Displayed
The following types of annotations can be added to iTool visualizations: Text, Line,
Line Profile, Rectangle, Oval, Polygon, and Freehand annotations. The following
table contains properties that control the Annotation layer. Subsequent tables
describe the properties specific to each type of annotation.
Property
Control Type: Values
Background color
Color: Color to be used for the Annotation Layer background.
For background to display, Transparent property must be set to
False. Click to choose from the default color palette, or
specify RGB values.
Default = [255,255,255] (white)
Transparent
Boolean: Make the annotation layer transparent? Choose True
or False.
Default = True
Table D-63: Annotation Layer Properties
iTool User’s Guide
2D Annotation Layer Properties
514
Appendix D: Visualization Properties
Text Annotation Properties
These properties control text annotation visualizations. For each property, the type of
control and the values that can be assigned are listed. For a description of how a
particular control is used, refer to Appendix B, “Property Controls”.
Property
Text string
Control Type: Values
String: Text that appears in the annotation. Edit to change the
text, or to add formatting commands such as the following:
• !C: Add new line.
• !U: Add superscript characters.
• !D: Add subscript characters.
• !N: Return to normal characters.
For a complete list of embedded text formatting commands,
refer to “Embedded Formatting Commands” (Appendix H,
IDL Reference Guide). No default value.
Horizontal
alignment
String List: Horizontal alignment of multiple lines within text
box. Choose from these values:
• Left: Align text along the left border of the text box.
• Center: Align text in the center of the text box.
• Right: Align text along the right border of the text box.
Default = Left
Color
Color: Color to be used for the text. Click to choose from the
default color palette, or specify RGB values.
Default = [0,0,0] (black)
Fill background
Boolean: Fill the background of the text with the background
color? Choose True or False.
Default = False
Transparency
Number: Transparency of the text annotation from 0% to
100%. Move the slider to change the value.
Default = 0
Table D-64: Text Annotation Properties
Text Annotation Properties
iTool User’s Guide
Appendix D: Visualization Properties
Property
Text font
515
Control Type: Values
String List: Font used for text annotation. Select a font from
the list. Choose from these values:
• Helvetica
• Courier
• Times
• Symbol
• Hershey 3 Simplex
In addition to the above standard fonts, you will also have
available all of the other Hershey fonts as well as any
TrueType fonts available to IDL.
Default = Helvetica
Text style
String List: Style used for text annotation. Select a style from
the list. Choose from these values:
• Normal
• Bold
• Italic
• Bold italic
Default = Normal
Text font size
Number: Font size in points for the text annotation. Edit the
number to change the size. Default = 12
Table D-64: Text Annotation Properties (Continued)
iTool User’s Guide
Text Annotation Properties
516
Appendix D: Visualization Properties
Line Annotation Properties
These properties control line annotation visualizations. For each property, the type of
control and the values that can be assigned are listed. For a description of how a
particular control is used, refer to Appendix B, “Property Controls”.
Property
Control Type: Values
Color
Color: Color to be used for the line. Click to choose from the
default color palette, or specify RGB values. Default =
[0,0,0] (black)
Linestyle
Line Style: Style of the line annotation. Select a line style from
the list. Default =
(solid line)
Thickness
Line Thickness: Thickness of the line annotation in points.
Select a thickness from the list. Default = 1
Arrow style
Arrow Style Selector: Select an arrow style from the list.
Choose from these values:
Default =
Arrowhead size
(no arrow)
Number: Size of arrowhead in normalized units. Arrow style
must be selected for arrowhead to display. Move the slider to
change the value. Default = 0.05
Table D-65: Line Annotation Properties
Line Annotation Properties
iTool User’s Guide
Appendix D: Visualization Properties
517
Line Profile Annotation Properties
These properties control line profile annotation visualizations. For each property, the
type of control and the values that can be assigned are listed. For a description of how
a particular control is used, refer to Appendix B, “Property Controls”.
Property
Control Type: Values
Vertex Colors
Color Table
User Defined: By selecting Edit Color → Table Edit access
the color table to manipulate plot color values
Color
Color: Color to be used for the line. Click to choose from the
default color palette, or specify RGB values. Default =
[0,0,0] (black)
Line style
Line Style: Style of the line profile annotation. Select a line
style from the list. Default =
(solid line)
Table D-66: Line Profile Annotation Properties
iTool User’s Guide
Line Profile Annotation Properties
518
Appendix D: Visualization Properties
Property
Control Type: Values
Thickness
Line Thickness: Thickness of the line profile annotation in
points. Select a thickness from the list. Default = 1
Minimum value
Number: Minimum value for line profile. Edit number to
change value. No default value.
Maximum value
Number: Maximum value for line profile.Edit number to
change value. No default value.
Histogram plot
Boolean: Show line profile as a histogram plot? Choose True
or False.
Default = False
Number of points
to average
Number: Set number of points to average. Enter a value.
Polar plot
Boolean: Show line profile as a polar plot? Choose True or
False.
Default = 1
Default = False
Fill plot
Boolean: Fill plot? Choose True or False.
Default = False
Number: Set level to fill. Enter value.
Fill level
Default = 71
Fill color
Color: Color used for fill. For color to display, Fill Plot
property must be set to True. Click to choose from the default
color palette, or specify RGB values.
Default = [255,255,255] (white)
Fill transparency
Number: Transparency of the plot fill from 0% to 100%. Move
the slider to change the value. Default = 0
Symbol
Symbol: Symbol to appear at regular intervals on the plot line.
Choose a symbol from the list. Default = No symbol
Symbol size
Number: Factor from 0 - 1 determining the size of the selected
symbol. Move slider to change the size. Default = 0.2
Table D-66: Line Profile Annotation Properties (Continued)
Line Profile Annotation Properties
iTool User’s Guide
Appendix D: Visualization Properties
Property
519
Control Type: Values
Use default color
Boolean: Activate Symbol color property. Choose True or
False. Default = False
Symbol color
Color: Color for the selected symbol. Click to choose from the
default color palette, or specify RGB values. Default =
[0,0,0] (black)
Symbol thickness
Number: Line thickness from 1 - 9.9 for the selected symbol.
Move slider to change the thickness. Default = 1.
Symbol
increment
Number: Interval at which symbols will be displayed on the
plot line. Influenced by Number of points to average (above).
Edit to change the value. Default = 1
Table D-66: Line Profile Annotation Properties (Continued)
iTool User’s Guide
Line Profile Annotation Properties
520
Appendix D: Visualization Properties
Rectangle Annotation Properties
These properties control rectangle annotation visualizations. For each property, the
type of control and the values that can be assigned are listed. For a description of how
a particular control is used, refer to Appendix B, “Property Controls”.
Property
Control Type: Values
Color
Color: Color to be used for the rectangle outline. Click to
choose from the default color palette, or specify RGB values.
Default = [0,0,0] (black)
Linestyle
Line Style: Style of the rectangle outline. Select a line style
from the list.
Default =
Thickness
(solid line)
Line Thickness: Thickness of the rectangle outline in points.
Select a thickness from the list.
Default = 1
Boolean: Fill rectangle background? Choose True or False.
Fill background
Default = True
Fill color
Color: Color to be used for the background. For background
color to display, Fill Background property must be set to True.
Click to choose from the default color palette, or specify RGB
values.
Default = [255,255,255] (white)
Transparency
Number: Transparency of the rectangle background fill from
0% to 100%. Move the slider to change the value. Default = 0
Table D-67: Rectangle Annotation Properties
Rectangle Annotation Properties
iTool User’s Guide
Appendix D: Visualization Properties
521
Oval Annotation Properties
These properties control oval annotation visualizations. For each property, the type of
control and the values that can be assigned are listed. For a description of how a
particular control is used, refer to Appendix B, “Property Controls”.
Property
Control Type: Values
Color
Color: Color to be used for the oval outline. Click to choose
from the default color palette, or specify RGB values. Default
= [0,0,0] (black)
Linestyle
Line Style: Style of the oval outline. Select a line style from
the list. Default =
(solid line)
Thickness
Line Thickness: Thickness of the oval outline in points. Select
a thickness from the list. Default = 1
Fill background
Boolean: Fill oval background? Choose True or False.
Default = True
Fill color
Color: Color to be used for the background. For background
color to display, Fill Background property must be set to True.
Click to choose from the default color palette, or specify RGB
values. Default = [255,255,255] (white)
Transparency
Number: Transparency of the oval background fill from 0% to
100%. Move the slider to change the value. Default = 0
Table D-68: Oval Annotation Properties
iTool User’s Guide
Oval Annotation Properties
522
Appendix D: Visualization Properties
Polygon Annotation Properties
These properties control polygon annotation visualizations. For each property, the
type of control and the values that can be assigned are listed. For a description of how
a particular control is used, refer to Appendix B, “Property Controls”.
Property
Control Type: Values
Color
Color: Color to be used for the polygon outline. Click to
choose from the default color palette, or specify RGB values.
Default = [0,0,0] (black)
Linestyle
Line Style: Style of the polygon outline. Select a line style
from the list. Default =
(solid line)
Thickness
Line Thickness: Thickness of the polygon outline in points.
Select a thickness from the list. Default = 1
Fill background
Boolean: Fill polygon background? Choose True or False.
Default = True
Fill color
Color: Color to be used for the background. For background
color to display, Fill Background property must be set to True.
Click to choose from the default color palette, or specify RGB
values. Default = [255,255,255] (white)
Transparency
Number: Transparency of the polygon background fill from
0% to 100%. Move the slider to change the value. Default = 0
Table D-69: Polygon Annotation Properties
Polygon Annotation Properties
iTool User’s Guide
Appendix D: Visualization Properties
523
Freehand Annotation Properties
These properties control freehand annotation visualizations. For each property, the
type of control and the values that can be assigned are listed. For a description of how
a particular control is used, refer to Appendix B, “Property Controls”.
Property
Control Type: Values
Color
Color: Color to be used for the freehand shape outline. Click to
choose from the default color palette, or specify RGB values.
Default = [0,0,0] (black)
Linestyle
Line Style: Style of the freehand shape outline. Select a line
style from the list. Default =
(solid line)
Thickness
Line Thickness: Thickness of the freehand shape outline in
points. Select a thickness from the list. Default = 1
Fill background
Boolean: Fill freehand shape background. Choose True or
False. Default = True
Fill color
Color: Color to be used for the background. For background
color to display, Fill Background property must be set to True.
Click to choose from the default color palette, or specify RGB
values. Default = [255,255,255] (white)
Transparency
Number: Transparency of the freehand background fill from
0% to 100%. Move the slider to change the value. Default = 0
Table D-70: Freehand Annotation Properties
iTool User’s Guide
Freehand Annotation Properties
524
Appendix D: Visualization Properties
Legend Properties
These properties control legend annotations. For each property, the type of control
and the values that can be assigned are listed. For a description of how a particular
control is used, refer to Appendix B, “Property Controls”.
Figure D-32: Visualization Browser with Legend Properties Displayed
Note
This section discusses the properties of the legend container, which can contain
multiple legend items of different types. The individual legend types are described
in:
“Legend Contour Items” on page 527
“Legend Contour Level Items” on page 528
“Legend Plot Items” on page 530
“Legend Surface Items” on page 531
Legend Properties
iTool User’s Guide
Appendix D: Visualization Properties
525
Property
Layout
Control Type: Values
String List: Arrange the legend elements in columns or rows.
Select a layout from the list. Choose from these values:
• Columns
• Rows
Default = Columns
Sample width
Number: Width in normalized units of the element sample that
appears in the legend box. Range = 0.0 to 0.5. Move the
slider to change the value. Default = 0.15
Horizontal
spacing
Number: Space in normalized units between samples and text
in the legend box. Range = 0.0 to 0.25. Move the slider to
change the value. Default = 0.02
Vertical spacing
Number: Space in normalized units between lines in the
legend box. Move the slider to change the value. Default =
0.02
Text color
Color: Color to be used for the legend text. Click to choose
from the default color palette, or specify RGB values. Default
= [0,0,0] (black)
Text font
String List: Font used for legend text. Select a font from the
list. Choose from these values:
• Helvetica
• Courier
• Times
• Symbol
• Hershey 3 Simplex
In addition to the above standard fonts, you will also have
available all of the other Hershey fonts as well as any
TrueType fonts available to IDL.
Default = Helvetica
Table D-71: Legend Properties
iTool User’s Guide
Legend Properties
526
Appendix D: Visualization Properties
Property
Text style
Control Type: Values
String List: Style used for legend text. Select a style from the
list. Choose from these values:
• Normal
• Bold
• Italic
• Bold italic
Default = Normal
Text font size
Number: Font size in points for the legend text. Edit the
number to change the size. Default = 10
Color
Color: Color to use for the legend border. Legend object must
be deselected for border attributes to be visible. Click to
choose from the default color palette, or specify RGB values.
Default = [0,0,0] (black)
Linestyle
Line Style: Style of the legend border. Select a line style from
the list. Default =
(solid line)
Thickness
Line Thickness: Thickness of the legend border in points.
Select a thickness from the list. Default = 1
Fill background
Boolean: Fill legend background? Choose True or False.
Default = True
Fill color
Color: Color to be used for the background. For background
color to display, Fill Background property must be set to
True. Click to choose from the default color palette, or specify
RGB values. Default = [255,255,255] (white)
Transparency
Number: Transparency of the background fill from 0% to
100% Move the slider to change the value. Default = 0%
Table D-71: Legend Properties (Continued)
Legend Properties
iTool User’s Guide
Appendix D: Visualization Properties
527
Legend Contour Items
The following are properties of the top-level Contour legend item. For a description
of how a particular control is used, refer to Appendix B, “Property Controls”.
Property
Show Levels
Control Type: Values
Boolean: Show contour levels in the legend. Choose True
or False. Default = True
Text
String: Text that labels the contour object in the legend.
Text color
Color: Color to be used for the legend text. Click to choose
from the default color palette, or specify RGB values. Default
= [0,0,0] (black)
Text font
String List: Font used for legend text. Select a font from the
list. Choose from these values:
• Helvetica
• Courier
• Times
• Symbol
• Hershey 3 Simplex
In addition to the above standard fonts, you will also have
available all of the other Hershey fonts as well as any
TrueType fonts available to IDL.
Default = Helvetica
Text style
String List: Style used for legend text. Select a style from the
list. Choose from these values:
• Normal
• Bold
• Italic
• Bold italic
Default = Normal
Text font size
Number: Font size in points for the legend text. Edit the
number to change the size. Default = 12
Table D-72: Contour Legend Properties
iTool User’s Guide
Legend Contour Items
528
Appendix D: Visualization Properties
Legend Contour Level Items
The following are properties of individual Contour level legend items. For a
description of how a particular control is used, refer to Appendix B, “Property
Controls”
Property
Control Type: Values
Text
String: Text that labels the contour in the legend.
Text color
Color: Color to be used for the legend text. Click to choose
from the default color palette, or specify RGB values. Default
= [0,0,0] (black)
Use text from
String List: Choose a source for the legend text. Choose from
these values:
• Level value
• Level label
• User defined
Default = Level value
Text format code
String: Text that defines the text format. Edit string to change
format. You can edit this value only if Text Format is set to
Use Text Format Code. Default = none
Text format
String List: Choose a format code or time interval to use for
each legend item. Choose from these values:
• None
• Use Text Format Code
• Filled Fixed Width Integer
• Freeform Integer or Float
• Float with 2 or 4 decimal places
• Exponential with 2 or 4 decimal places
• Date (13 formats)
• Time (11 formats)
Default = None
Table D-73: Contour Level Legend Properties
Legend Contour Level Items
iTool User’s Guide
Appendix D: Visualization Properties
Property
Text font
529
Control Type: Values
String List: Font used for legend text. Select a font from the
list. Choose from these values:
• Helvetica
• Courier
• Times
• Symbol
• Hershey 3 Simplex
In addition to the above standard fonts, you will also have
available all of the other Hershey fonts as well as any
TrueType fonts available to IDL.
Default = Helvetica
Text style
String List: Style used for legend text. Select a style from the
list. Choose from these values:
• Normal
• Bold
• Italic
• Bold italic
Default = Normal
Text font size
Number: Font size in points for the legend text. Edit the
number to change the size. Default = 12
Table D-73: Contour Level Legend Properties (Continued)
iTool User’s Guide
Legend Contour Level Items
530
Appendix D: Visualization Properties
Legend Plot Items
The following are properties of Plot legend items. For a description of how a
particular control is used, refer to Appendix B, “Property Controls”.
Property
Control Type: Values
Text
String: Text that labels the plot object in the legend.
Text color
Color: Color to be used for the legend text. Click to choose
from the default color palette, or specify RGB values. Default
= [0,0,0] (black)
Text font
String List: Font used for legend text. Select a font from the
list. Choose from these values:
• Helvetica
• Courier
• Times
• Symbol
• Hershey 3 Simplex
In addition to the above standard fonts, you will also have
available all of the other Hershey fonts as well as any
TrueType fonts available to IDL.
Default = Helvetica
Text style
String List: Style used for legend text. Select a style from the
list. Choose from these values:
• Normal
• Bold
• Italic
• Bold italic
Default = Normal
Text font size
Number: Font size in points for the legend text. Edit the
number to change the size. Default = 12
Table D-74: Plot Legend Properties
Legend Plot Items
iTool User’s Guide
Appendix D: Visualization Properties
531
Legend Surface Items
The following are properties of individual Surface legend items. For a description of
how a particular control is used, refer to Appendix B, “Property Controls”.
Property
Control Type: Values
Text
String: Text that labels the surface object in the legend.
Text color
Color: Color to be used for the legend text. Click to choose
from the default color palette, or specify RGB values. Default
= [0,0,0] (black)
Text font
String List: Font used for legend text. Select a font from the
list. Choose from these values:
• Helvetica
• Courier
• Times
• Symbol
• Hershey 3 Simplex
In addition to the above standard fonts, you will also have
available all of the other Hershey fonts as well as any
TrueType fonts available to IDL.
Default = Helvetica
Text style
String List: Style used for legend text. Select a style from the
list. Choose from these values:
• Normal
• Bold
• Italic
• Bold italic
Default = Normal
Text font size
Number: Font size in points for the legend text. Edit the
number to change the size. Default = 12
Table D-75: Surface Legend Properties
iTool User’s Guide
Legend Surface Items
532
Legend Surface Items
Appendix D: Visualization Properties
iTool User’s Guide
Index
Symbols
Numerics
2D
annotation layer, 513
3D
plots
properties, 445
A
adding
plot axis object, 84
annotating
iTool User’s Guide
iTools
contours, 277
freehand type, 83
images, 228
line type, 80
oval type, 82
plots, 299
polygon type, 82
rectangle type, 81
text, 79
toolbar for, 386
types of, 79
vectors, 363
volumes, 320
annotation layer, 513
autosubsampling vectors, 361
axes
adding to
533
534
contours, 273
images, 218
iTools, 84
surfaces, 242
volumes, 313
format of tick annotations
iTools, 488
properties, 485
B
byte scaling
properties, 409
C
canvas zooming, 70
colorbars
adding to
contours, 271
images, 217
plots, 291
surfaces, 239
volumes, 312
properties, 478
colors
changing in contours, 268
in iImage, 215
containers
definition, 179
contour direction
properties, 419
contour magnitude
properties, 419
contours
adding an axis, 273
adding statistics, 279
annotations (iTools), 277
colorbar, 271, 272
colors in, 268
Index
displaying
in iContour, 257
in iMap, 342
filling, 269
filtering, 274
flipping, 276
histogram, 279
labeling, 266
legend level properties, 528
legend properties, 527
on surface data, 244
properties, 264, 416
properties described, 453
convolution
filtering, 124
properties, 398
copyrights, 2
cropping images
iTools, 413
curve fitting
for plots, 294
curve fitting filtering, 403
D
data
importing in iTool, 27
manager, 24
data associations
removing, 57
replacing, 57
data manager, 24
dataspace
adding, 63
properties, 433
range resetting, 131
displaying
contours
in iContour, 257
in iMap, 342
images
iTool User’s Guide
535
in iImage, 209
in iMap, 334
irregular-grid data, 258
maps, 327
multi-channel volumes, 305
plots
2D plots, 283
3D plots, 284
regular-grid data, 257
statistics, 129
surfaces, 235
vectors, 355
fields, 355
streamlines, 359
wind barbs, 356
volumes, 305
drag quality, 429
E
error bar plots, 292
F
file menu, 371
files
operations, 113
toolbar, 383
writing
file writers, 105
filling
contours
iTools, 269
filtering
contours, 274
convolution, 124
data in iTools, 122
images in iImage, 220
median, 123
plots, 297
iTool User’s Guide
smooth filter, 122
surfaces, 247
unsharp mask, 125
flipping
contours, 276
images, 226
freehand annotations
adding, 83
properties, 523
G
general settings, iTool preferences browser, 97
gridding wizard, 259
H
help menu, 382
histogram
adding to a volume, 322
for contours, 279
plot, 128, 301
properties, 397, 482
surface, 254
I
iImage
plot profile operation, 229
iImage images
adding
axis, 218
colorbar, 217
surface, 225
annotating, 228
brightness, 215
contouring, 223
cropping, 229
displaying, 209
displaying multiple, 211
Index
536
filtering, 220
flipping, 226
inverting, 226
line profiling, 228
manipulating, 226
modifying properties, 216
morphing, 222
of surface data, 243
panning, 229
pixel scaling, 227
region growing, 227
registering in iMap, 335
resampling, 219
ROIs, 214
rotating, 226
scaling, 226
window level control, 214
zooming, 227
iImage panel, 213
iImage tool
color in, 215
image properties, 439
image display
in iImage, 209
in iMap, 334
multiple images, 211
image panel, 213
image plane
about, 315
for volumes, 315
properties, 420, 422, 474
image stack, 322
images
displaying. See image display
in iImage. See iImage images
iMap panel, 332
importing
data in iTool, 27
insert menu, 376
inserting
map grid, 344
Index
shapefiles, 345
interval volume
extracting, 318
properties, 471
inverting images, 226, 409
iPlot
properties, 442
irregularly-gridded data, 258
isosurfaces
extracting in volumes, 316
properties, 469
iSurface
plot profile operation, 253
iSurface tool
properties, 449
using, 233
iTools
annotation toolbar, 386
common operations, 112
edit menu, 373
edit toolbar, 384
file menu, 371
file toolbar, 383
help menu, 382
insert menu, 376
inserting a visualization, 54
manipulator toolbar, 385
operations menu, 377
view properties, 430
window menu, 380
window properties, 428
iVector tool
See also vectors.
about, 354
displaying vectors, 355
properties, 458
using, 353
iVolume panel, 309
iVolume tool
image stack, 322
iTool User’s Guide
537
L
labeling
contours, 266
layout window, 73
legalities, 2
legends
adding, 77
to contours, 272
to plots, 289
to surfaces, 241
properties, 524
lights
adding to a surface, 240
properties, 494
line annotations
adding, 80
properties, 516
lines
profiles
annotating, 517
extracting for a surface, 253
in images, 228
M
Macro Controls dialog, 149
Macro Editor
Add and Remove buttons, 161
items
annotation, 170
history, 166
macro, 164
Macro Tools, 171
Tool Menus, 178
visualization, 169
macro property sheet, 156
macro tree, 156
menu bar, 154
source property sheet, 161
source tree, 159
iTool User’s Guide
using, 153
macros
iTool
capturing intermediate manipulations, 144
definition, 141
exporting, 186
importing, 186
properties, 395
recording, 143
running, 146
IDL command line, 148
Macro Editor, 148
Operations menu, 147
Selection Change operation, 180, 181
Tool Change operation, 183, 184
types, 179
manipulating images
in iTools, 226
manipulating volume data
in iTools, 320
manipulator toolbar, 385
map grid
inserting, 344
properties, 501
map panel (IMAP), 332
map projections
applying, 328
common properties (iTools), 329
definition, 328
properties, 410
vector data, 367
map register image operation properties
(iTools), 411
mapping
images onto geometry
iTools, 248
See also texture maps
iTool display, 327
maps, displaying in IMAP, 327
median
filtering, 123
Index
538
morphing
data, 127
images, 222
properties, 412
multi-channel volumes, 305
O
objects
rendering translucent, 132
scaling, 65
selecting, 61
selecting all, 61
translating, 64
operations
browser, 93, 394
common, 112
file, 113
menu, 377
property sheets, 88
oval annotations, 82
properties, 521
overplotting
IPLOT, 286
P
panel
IIMAGE, 213
IMAP, 332
IVOLUME, 309
panning images
IIMAGE, 229
parameter editor, 56
parameters
editor, 56
plot profile operation, 229, 253
plots
3-D iPlot, 284
histogram, 128
legend, 530
Index
plotting
IPLOT
adding a histogram to, 301
annotating, 299
colorbar, 291
curve fitting, 294
displaying 2-D, 283
displaying 3-D, 284
displaying polar, 285
error bars, 292
filtering, 297
legend, 289
modifying properties for, 288
scaling, 301
statistics, 301
translating, 299
IVECTOR
annotating, 363
overplotting
IPLOT, 286
polar plots
IPLOT, 285
polygon annotations
creating, 82
properties
polygon annotation
properties, 522
polygonal ROIs, 497
preferences
browser in iTools, 95
preferences browser, 95
printing
iTools, 134
properties
2D annotation layer, 513
3D plot, 445
axis, 485
byte scale, 409
colorbar, 478
contour, 416, 453
contour direction, 419
contour legend, 527
iTool User’s Guide
539
contour legend level, 528
contour magnitude, 419
contours, 264
convolution, 398
cropping, 413
curve fitting, 403
dataspace, 433
freehand annotation, 523
histogram, 397, 482
image, 439
image plane, 420, 422, 474
interval volume, 471
inverting image, 409
isosurface, 469
iTool macros, 395
legend, 524
lights, 494
line annotation, 516
line profile annotation, 517
map grid, 501
map projection, 410
map register image (iTools), 411
modifying volume, 311
morphing, 412
operations browser, 394
oval annotation, 521
plot, 442
plot legend, 530
polygonal ROI, 497
rectangle annotation, 520
region grow, 414
resample, 406
Roberts filter, 401
rotate, 405
rotate data, 407
scale data, 408
shape point, 509
shape polygon, 505
shape polyline, 507
sheets
defined, 87
iTool User’s Guide
operations, 88
visualization, 88
smooth filter, 400, 401
Sobel filter, 402
statistics, 396
streamline, 510
streamlines, 419
surface, 449
surface legend, 531
text annotation, 514
transform, 406
unsharp mask filter, 402
vector, 458
view, 430
visualization layer, 431
visualization type, 437
volume, 463
window, 428
property sheets
about, 87
iTool operations, 88
iTool visualizations, 88
R
reading
files, 99
rectangle annotations
creating, 81
properties, 520
redo iTool operation, 62
region growing
iTool operation properties, 414
registering
images
in degrees, 340
in meters, 337
wizard, 335
regular-grid data displays, 257
rendering
translucent objects, 132
Index
540
volumes, 306
resampling
data, 119
images, 219
properties, 406
surfaces, 246
volumes, 314
resetting
dataspace, 131
Roberts filter, 401
ROI
iTool annotations, 79
operations, 133
rotating
data, 115, 120
images
iTool operation, 226
left, 117
properties, 405, 407
right, 117
surfaces, 249
volumes, 320
with a mouse, 115
S
scaling
3-D objects, 66
constrained, 66
data, 121
images, 226
objects, 65
plots, 301
properties, 408
surfaces, 251
unconstrained, 67
unconstrained 2-D objects, 68
unconstrained 3-D objects, 69
volumes, 320
selecting
objects in iTools, 61
Index
Shapefile
adding in iMap, 343
creating a visualization, 343
definition, 343
inserting, 345
Canadian provinces, 351
continents, 345
countries (high resolution), 346
countries (low resolution), 346
lakes, 349
rivers, 348
United States, 350
ShapePoint, 509
ShapePolygon, 505
ShapePolyline, 507
smooth filtering, 122, 400, 401
smoothing
volumes, 322
Sobel
filter, 402
statistics
adding to plots, 301
adding to volumes, 322
displaying, 129
properties, 396
surface, 254
Streamlines, 510
streamlines, 359
properties, 419
styles
applying, 189
copying, 195
creating, 190
current style, 195
default style, 205
definition, 188
editing, 202
exporting, 206
importing, 206
types, 189
subsampling vectors, 360
iTool User’s Guide
541
surfaces
adding axes, 242
adding texture map, 248
adding to an image, 225
colorbar, 239
creating contours on, 244
creating images of, 243
displaying, 235
extracting a line profile, 253
filtering, 247
histogram for, 254
legends, 241, 531
lights, 240
rotating, 249
scaling, 251
statistics, 254
T
text annotations
adding, 79
properties, 514
texture mapping. See texture maps
texture maps
iTools, 248
three-dimensional
plots, 445
trademarks, 2
transforming
data, 119
properties, 406
resampling, 119
rotate data, 120
scale data, 121
translating
objects, 64
plots, 299
vectors, 363
translucent object rendering, 132
iTool User’s Guide
U
undo iTool operation, 62
unsharp mask filtering, 125, 402
V
vectors
IVECTOR
autosubsampling, 361
coloring, 362
displaying, 355
fields, 355
map projection, 367
properties for, 360
streamlines, 359
subsampling, 360
translating, 363
wind barbs, 356
properties, 458
view zooming, 70
visualizations
browser, 90
creating, 53
definition of, 52
exporting, 58
inserting, 54
layers, 431
modifying, 56
object selection, 90
property sheets, 88
type properties, 437
volume panel (IVOLUME), 309
volumes
adding
axis, 313
colorbar, 312
histogram, 322
statistics, 322
annotating, 320
displaying, 305
Index
542
displaying multi-channel, 305
extents, 308
extracting
interval volume, 318
isosurface, 316
properties, 311, 463
rendering, 306
resampling, 314
rotating, 320
scaling, 320
showing an image plane for, 315
smoothing, 322
W
wind barbs, 356
window layout, 73
window level control, 214
window menu, 380
writing
dat files, 105
text files, 105
Z
zooming, 70
Index
iTool User’s Guide