1
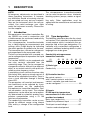
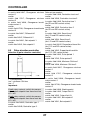
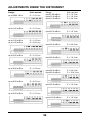
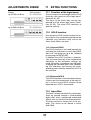
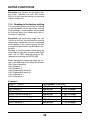
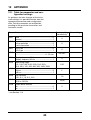
Microprocessor
Transmitter/Controller
for conductivity
Type 262520
B 20.2520
Operating Instructions
6.96 / 00339807
CONTENTS
Page
1
1.1
1.2
1.3
1.4
1.5
1.6
1.7
DESCRIPTION . . . . . . . . . . . . . . . . . . . . . . . . . . . . . . . . . . . . . . . . . . . . . . . . . . . . . . . 1
Introduction . . . . . . . . . . . . . . . . . . . . . . . . . . . . . . . . . . . . . . . . . . . . . . . . . . . . . . . . . 1
Type designation . . . . . . . . . . . . . . . . . . . . . . . . . . . . . . . . . . . . . . . . . . . . . . . . . . . . . 1
Accessories . . . . . . . . . . . . . . . . . . . . . . . . . . . . . . . . . . . . . . . . . . . . . . . . . . . . . . . . . 2
Displays/controls . . . . . . . . . . . . . . . . . . . . . . . . . . . . . . . . . . . . . . . . . . . . . . . . . . . . . . 3
Technical data . . . . . . . . . . . . . . . . . . . . . . . . . . . . . . . . . . . . . . . . . . . . . . . . . . . . . . . . 3
Block diagram . . . . . . . . . . . . . . . . . . . . . . . . . . . . . . . . . . . . . . . . . . . . . . . . . . . . . . . . 6
Operation. . . . . . . . . . . . . . . . . . . . . . . . . . . . . . . . . . . . . . . . . . . . . . . . . . . . . . . . . . . . 6
2
2.1
2.2
2.3
INSTALLATION . . . . . . . . . . . . . . . . . . . . . . . . . . . . . . . . . . . . . . . . . . . . . . . . . . . . . . . 7
Location and climatic conditions. . . . . . . . . . . . . . . . . . . . . . . . . . . . . . . . . . . . . . . . . . 7
Fitting in position . . . . . . . . . . . . . . . . . . . . . . . . . . . . . . . . . . . . . . . . . . . . . . . . . . . . . . 7
Installation in the surface-mounting housing . . . . . . . . . . . . . . . . . . . . . . . . . . . . . . . . 8
3
ELECTRICAL CONNECTION. . . . . . . . . . . . . . . . . . . . . . . . . . . . . . . . . . . . . . . . . . . . . 9
4
4.1
4.2
4.3
4.4
4.5
OPERATION . . . . . . . . . . . . . . . . . . . . . . . . . . . . . . . . . . . . . . . . . . . . . . . . . . . . . . . . 11
Matrix/level scheme. . . . . . . . . . . . . . . . . . . . . . . . . . . . . . . . . . . . . . . . . . . . . . . . . . . 11
Value and function input . . . . . . . . . . . . . . . . . . . . . . . . . . . . . . . . . . . . . . . . . . . . . . . 11
Manual operation. . . . . . . . . . . . . . . . . . . . . . . . . . . . . . . . . . . . . . . . . . . . . . . . . . . . . 16
Temperature compensation . . . . . . . . . . . . . . . . . . . . . . . . . . . . . . . . . . . . . . . . . . . . 17
Matrix summary. . . . . . . . . . . . . . . . . . . . . . . . . . . . . . . . . . . . . . . . . . . . . . . . . . . . . . 18
5
SWITCHING THE RANGE . . . . . . . . . . . . . . . . . . . . . . . . . . . . . . . . . . . . . . . . . . . . . . 19
6
6.1
6.2
6.3
6.4
6.5
CALIBRATION . . . . . . . . . . . . . . . . . . . . . . . . . . . . . . . . . . . . . . . . . . . . . . . . . . . . . . . 20
Introduction . . . . . . . . . . . . . . . . . . . . . . . . . . . . . . . . . . . . . . . . . . . . . . . . . . . . . . . . . 20
Numerical input of cell constant and temperature coefficient . . . . . . . . . . . . . . . . . . 20
Calibrating the cell constant using a calibration solution . . . . . . . . . . . . . . . . . . . . . . 20
Experimental determination of the temperature coefficient . . . . . . . . . . . . . . . . . . . . 21
Accepting old calibration data. . . . . . . . . . . . . . . . . . . . . . . . . . . . . . . . . . . . . . . . . . . 22
7 ANALOGUE OUTPUT . . . . . . . . . . . . . . . . . . . . . . . . . . . . . . . . . . . . . . . . . . . . . . . . . 22
7.1 Process value output. . . . . . . . . . . . . . . . . . . . . . . . . . . . . . . . . . . . . . . . . . . . . . . . . . 22
Page
8
CONTROLLER. . . . . . . . . . . . . . . . . . . . . . . . . . . . . . . . . . . . . . . . . . . . . . . . . . . . . . . 24
8.1 Concepts . . . . . . . . . . . . . . . . . . . . . . . . . . . . . . . . . . . . . . . . . . . . . . . . . . . . . . . . . . . 24
8.2 Possible combinations . . . . . . . . . . . . . . . . . . . . . . . . . . . . . . . . . . . . . . . . . . . . . . . . 26
8.3 Controller switched off . . . . . . . . . . . . . . . . . . . . . . . . . . . . . . . . . . . . . . . . . . . . . . . . 26
8.4 Limit controller. . . . . . . . . . . . . . . . . . . . . . . . . . . . . . . . . . . . . . . . . . . . . . . . . . . . . . . 26
8.5 Pulse duration controller . . . . . . . . . . . . . . . . . . . . . . . . . . . . . . . . . . . . . . . . . . . . . . . 27
8.6 Pulse frequency controller. . . . . . . . . . . . . . . . . . . . . . . . . . . . . . . . . . . . . . . . . . . . . . 28
8.7 Modulating controller. . . . . . . . . . . . . . . . . . . . . . . . . . . . . . . . . . . . . . . . . . . . . . . . . . 28
8.8 Alarm contact . . . . . . . . . . . . . . . . . . . . . . . . . . . . . . . . . . . . . . . . . . . . . . . . . . . . . . . 29
8.9 Notes on possible incorrect controller settings
9
and their correction . . . . . . . . . . . 29
FAULTS, WARNINGS . . . . . . . . . . . . . . . . . . . . . . . . . . . . . . . . . . . . . . . . . . . . . . . . . 30
9.1 Introduction . . . . . . . . . . . . . . . . . . . . . . . . . . . . . . . . . . . . . . . . . . . . . . . . . . . . . . . . . 30
9.2 Faults . . . . . . . . . . . . . . . . . . . . . . . . . . . . . . . . . . . . . . . . . . . . . . . . . . . . . . . . . . . . . . 30
9.3 Warnings . . . . . . . . . . . . . . . . . . . . . . . . . . . . . . . . . . . . . . . . . . . . . . . . . . . . . . . . . . . 31
10 ADJUSTMENTS INSIDE THE INSTRUMENT . . . . . . . . . . . . . . . . . . . . . . . . . . . . . . . 33
10.1Analogue output . . . . . . . . . . . . . . . . . . . . . . . . . . . . . . . . . . . . . . . . . . . . . . . . . . . . . 34
10.2Manual operation . . . . . . . . . . . . . . . . . . . . . . . . . . . . . . . . . . . . . . . . . . . . . . . . . . . . 34
10.3Input filter . . . . . . . . . . . . . . . . . . . . . . . . . . . . . . . . . . . . . . . . . . . . . . . . . . . . . . . . . . 34
10.4Code setting on the conductivity input card . . . . . . . . . . . . . . . . . . . . . . . . . . . . . . . . 35
11 EXTRA FUNCTIONS . . . . . . . . . . . . . . . . . . . . . . . . . . . . . . . . . . . . . . . . . . . . . . . . . . 37
11.1Function of the logic inputs. . . . . . . . . . . . . . . . . . . . . . . . . . . . . . . . . . . . . . . . . . . . . 37
11.2HOLD function. . . . . . . . . . . . . . . . . . . . . . . . . . . . . . . . . . . . . . . . . . . . . . . . . . . . . . . 37
11.3Input filter . . . . . . . . . . . . . . . . . . . . . . . . . . . . . . . . . . . . . . . . . . . . . . . . . . . . . . . . . . 37
11.4Reading-in the factory setting . . . . . . . . . . . . . . . . . . . . . . . . . . . . . . . . . . . . . . . . . . . 38
11.5Probe break monitor . . . . . . . . . . . . . . . . . . . . . . . . . . . . . . . . . . . . . . . . . . . . . . . . . . 39
12 APPENDIX . . . . . . . . . . . . . . . . . . . . . . . . . . . . . . . . . . . . . . . . . . . . . . . . . . . . . . . . . . 40
12.1Table for parameter and configuration settings . . . . . . . . . . . . . . . . . . . . . . . . . . . . . 40
Important installation notes:
The choice of cable and the connection of
the supply line must conform to the requirements of VDE 0100 "Regulations on the Installation of Power Circuits with nominal
voltages below 1000 V" or the appropriate
local regulations.
Both the electrical connection and any work
inside the unit must only be carried out to the
extent described and exclusively by properly
qualified personnel.
The instrument has to be isolated from the
supply before carrying out any maintenance
or service operations.
A current limiting resistor interrupts the supply circuit in case of a short-circuit. The external fuse of the supply should not be rated
above 1 A (slow). The load circuit must be
fused for the maximum relay current1) in order to prevent welding of the output relay
contacts in case of an external short-circuit.
In the neighbourhood of the unit there must
be no magnetic or electrical fields, e.g.
through transformers, portable telephones
or electrostatic discharges.
Inductive loads (relays, solenoid valves etc.),
if installed close to the instrument, must be
fitted with RC modules to prevent interference.
When the network is subject to severe interference (e.g. thyristor controls) the instrument should be supplied through an
isolating transformer since supply fluctuations are only permitted within the specified
voltage range1).
During maintenance or service operations
on the instrument (sensors, controllers, recorders etc.) it is essential to prevent any undesired processes (e.g. due to the switching
of relay contacts).
Input, output and supply lines should be run
separately and not parallel to each other.
Sensor and interface lines should be arranged as twisted and screened cables. Do
not run them close to current-carrying components or cables. Ground the screen at one
end at the instrument on terminal TE.
Ground the instrument at terminal PE to the
earth conductor. This line must have at least
1) see Technical data
the same cross-section as the supply lines.
Ground lines should be run in a star-shaped
lay-out to a common earth point which is
connected to the earth conductor of the
supply. Do not loop the ground connections,
i.e. do not run them from one instrument to
another.
Do not connect any additional loads to the
supply terminals of the instrument.
The instrument is not suitable for installation
in hazardous areas.
Apart from faulty installation, there is a possibility of interference or damage to controlled processes due to incorrect settings on
the controller (setpoint, data of parameter
and configuration levels, internal adjustments). Safety devices independent of the
controller should always be provided and
should be capable of adjustment only by
specialist personnel. Please refer to the appropriate safety regulations in this connection.
1
DESCRIPTION
NOTE:
All necessary adjustments are described in
these Operating Instructions. If, however,
any difficulties should arise during start-up,
you are asked not carry out any manipulations on the instrument which are not permitted. You could endanger your rights
under the instrument warranty. Please contact the supplier.
1.1
The microprocessor transmitter/controller
can be used to operate valves, interlocks,
blocking systems, pumps, motors or signal
ling units. Other applications must be
agreed with the manufacturer and confirmed
in writing.
Introduction
Microprocessor transmitters/controllers Series 262520 are used in conjunction with
suitable sensors for continuous conductivity
measurement in liquids.
The microprocessor transmitter/controller
has a 4-digit display for measurements and
settings and a 2-digit display for indicating
the matrix position as guidance for the user.
The transmitter has a current or voltage output proportional to the measured value.
The unit can be provided with a second current or voltage output to reproduce the liquid
temperature.
The version 262520 can be equipped with
two relay contacts adjustable over the
measuring range. They can be arranged as
changeover contacts with pull-in or drop-out
delay, or as control contacts with pulse-duration or pulse-frequency action.
A monitoring circuit switches the alarm relay
(third relay) with a pulse or steady contact at
the end of an adjustable time delay. There is
also a visual indication through a flashing
alarm LED.
The parameters cell constant and temperature coefficient can be adjusted by a program procedure on the conductivity
microprocessor transmitter/controller. Control parameters can be input. The solution
temperature can be either pre-set or optionally determined by automatic product temperature compensation using a Pt 100
resistance thermometer.
The conductivity transmitter can be re-configured for different ranges using internal
links and by a change at the configuration
level.
1.2
Type designation
The following selections describe the standard versions. Each selection is provided with
a code number which is entered in the appropriate field of the type designation. If a
controller with customized configuration is
required, additional ordering details in plain
language have to be given.
Conductivity microprocessor
transmitter/controller
(1)
(2) (3) (4) (5) (6) (7)
262520
/ .. - .. - ... - .. - .. / ...
(1) Basic type
Conductivity ................................... 262520
(2) Controller function
..
No control contacts ................................ 00
with 2 control contacts and alarmcontact, controller type and structure
can be configured .................................. 60
(3) Inputs
..
Pt 100 input for temperature
measurement in 3-wire circuit
provided as standard
Basic type conductivity .......................... 00
Conductivity difference input ................ 70*
Third input current/voltage .................... 80*
* version under development
1
DESCRIPTION
(4) Outputs
Conductivity output provided
as standard
on controller type 00 ............................
Second output (temperature) ...............
Relay contacts ......................................
Relay contacts and second output
(temperature) ........................................
Ordering example
Conductivity microprozessor transmitter/
controller
...
000
(1)
(2) (3) (4) (5) (6) (7)
060 262520
/ 60 - 00 - 100 - 01 - 00 / 000
100 (1) conductivity microprocessor
tranmitter/controller
160
(2) Alarm contact, controller type and
structure can be configured
(3) Basic type conductivity
(4) Relay contacts
(5) 93 - 263 V AC, 48 - 63 Hz
(5) Supply
..
(6) none
(7) none
93 - 263 v AC, 48 - 63 Hz ....................... 01
20 - 43 V AC, 48 - 63 Hz and
20 - 53 V DC ........................................... 10
(6) Interface (isolated)
..
none ....................................................... 00
RS232C ................................................. 51*
RS422/485 ............................................ 52*
(7) Extra Codes
...
none ..................................................... 000
Surface-mounting housing ................... 110
1.3
Accessories
1.3.1 Standard
2 mounting brackets
1 operating Instruction
Stock versions:
262520/00-00-000-01-00/000
262520/60-00-100-01-00/000
1.3.2 Recommended
Conductivity simulator Type 2H-SLf-1
(Data Sheet 26.2712)for testing and calibrating the conductivity transmitter
*version under development!
2
DESCRIPTION
1.4
Displays/controls
(1) 4-digit LED display to indicate measurement and settings
(2) Step key for selecting the digit to be altered, and switching manual mode off/
on
(3) Up key to alter the selected digit; in manual mode activates relay contact 1
(4) Down key to alter the selected digit; in
manual mode activates relay contact 2
(5) ENTER key to enter the input value
(6) 2-digit LED display to indicate the matrix
position (operator display)
(7) V key for vertical movement to select the
horizontal line in the matrix field
(8) H key for horizontal movement to select
the vertical column in the matrix field
(9) Brief matrix for indication and operating
level
(10)LED line to indicate operating status and
unit of display (µS/cm, mS/cm, °C)
1.5
Technical data
Reference temperature
25°C
1.5.1 Microprocessor transmitter/
controller for conductivity
Input
conductivity cell with two electrodes and cell
constants C of 0.01 to 10.
(see Data Sheets 20.2900 and 20.2921)
Liquid temperature compensation
manually from -50 to +250°C or automatically within the range -50 to +250°C using
Pt 100 resistance thermometer in 2-wire or
3-wire circuit
Measurement frequency and ranges
see Table page 12
Lead compensation Pt 100
not required with 3-wire circuit. When using
a resistance thermometer in 2-wire circuit it
is necessary to provide lead compensation
using an external compensating resistance.
Measuring voltage
approx. 500 mV AC
Accuracy of indication
conductivity: ±1 digit
temperature: 0.1 °C
Relay output with floating contact
rating:
690 W 3 A at 230 V AC 50 Hz, p.f. = 1
contact life:
approx. 106 operations at rated load
Measurement spans
freely adjustable within the selected range
Reference temperature 25°C
3
DESCRIPTION
Range table
Range
Cell constant C
(1/cm)
0.01
0.1
1.0
Meas. frequency
coded
3.0
10.0
Hz
to 0.50 µS/cm
x
85
to 1.00 µS/cm
x
85
to 2.00 µS/cm
x
85
to 3.00 µS/cm
x
85
to 5.00 µS/cm
x
x
85
to 10.0 µS/cm
x
x
85
to 20.0 µS/cm
x
85
to 50.0 µS/cm
x
to 100 µS/cm
x
85
x
85
to 100 µS/cm
x
to 300 µS/cm
x
x
1000
to 500 µS/cm
x
x
1000
to 1000 µS/cm
x
x
to 2000 µS/cm
to 1.00 mS/cm
1000
1000
x
x
x
to 2.00 mS/cm
x
to 3.00 mS/cm
x
to 5.00 mS/cm
x
x
1000
x
1000
1000
x
1000
x
4000
to 10.0 mS/cm
x
x
4000
to 20.0 mS/cm
x
x
4000
to 30.0 mS/cm
x
x
to 50.0 mS/cm
x
to 100 mS/cm
x
to 200 mS/cm
4
x
4000
4000
x
4000
x
4000
DESCRIPTION
Analogue output
Conductivity and temperature
(proportional to measured value and isolated)
selected
0 - 20 mA*
4 - 20 mA
0 - 10 V
8 VA approx.
Electrical connection
faston tags to DIN 46 244/A, 4.8 x 0.8 mm
burden
500 Ωmax.
500 Ωmax.
500 Ωmin.
Permitted ambient temperature
0 to +50°C
Transmitter/controller in surface-mounting
housing
-5 to +50°C
Max deviation of output signal from characteristic: 0.25%
* factory setting
Permitted storage temperature
-40 to +70°C
1.5.2 General controller data
Deviation from characteristic
when connected to conductivity cell:
1% max.
Climatic conditions
Class KWF to DIN 40 040,
rel. humidity not exceeding 75% annual
mean, no condensation
when used with resistance thermometer:
0.20% max.
Housing
aluminium extrusions, black anodised
with plug-in controller chassis (connected to
protective earth)
Ambient temperature error
when connected to conductivity cell:
0.25% max. per 10°C
when used with resistance thermometer:
0.05% max. per 10°C
Protection
to EN 60 529
front IP 54
rear IP 20
(not suitable for hazardous areas)
Signal circuit monitoring with ATC
break or short-circuit of the temperature
probe is recognised and reported.
Operating position
unrestricted
Data back-up
EEPROM
CE mark
EN 50081 Part 1
EN 50082 Part 2
Interference immunity/compatibility
NE 21 (5/93)
Supply
93 - 263 V AC 48 - 63 Hz or
20 - 43 V AC 48 - 63 Hz or
20 - 53 V DC
Power consumption
5
DESCRIPTION
1.6
Block diagram
Conductivity
External
contact
1.7
Operation
The signals of the two inputs pass through the range cards (1) and (2), an analogue multiplexer (3) and an amplifier (6) to the analogue/digital converter (11). The measurements, together with the key inputs (10), are processed in the computer core which consists of CPU
(13), EPROM (7), RAM (4) and EEPROM (5).
The EEPROM stores the operating, parameter and configuration data. The DIL switch (8)
can be used for various settings. An additional function is activated through the external
contact (18). The output signals pass through the ports (14) to (16) to the output stages (20),
(22), (23) and (24) and to the display (9). Each of these output stages can be equipped independently.
A watchdog circuit (12) resets the CPU (13) to a defined initial status in case of faults in the
program sequence. On power-up the reset circuit (19) activates the program start.
The power supply (21) provides the supplies for the individual modules.
6
2
INSTALLATION
2.1
Location and climatic
conditions
The location should be as free as possible
from shock and vibration. Electro-magnetic
fields, e.g. caused by motors, transformers
etc., should be avoided. The ambient temperature at the location must not be outside
0 to +50°C, the relative humidity not exceed
75%. Corrosive air and fumes reduce the life
of the instrument.
2.2
Fitting in position
The unit is inserted from the front into the
panel cut-out. The mounting brackets are
hooked from the back of the panel into the
recesses at the sides of the housing. The flat
sides of the brackets must be against the
housing. Place the mounting brackets
against the back of the panel and tighten
them evenly using a screwdriver.
(1) panel
(2) screwdriver
(3) mounting bracket
mm
0.8
4.5
4.8
7
7.5
21
92+0.5
100
120
138
150
270
inch
0.031
0.18
0.19
0.28
0.30
0.83
3.62+0.02
3.94
4.72
5.43
5.91
10.63
7
INSTALLATION
The folllowing important installation
notes must be observed:
– Fuses for the fitted transmitter and for the
relay contacts must be provided by the installer.
– Separate fuses must be provided for the
transmitter and for the relay contracts.
– Do not connect any control circuit (relay,
contactor) to the supply terminals.
– The wiring must be connected directly to
the transmitter.
– External environmental conditions must
not cause the permitted ambient conditions inside the transmitter surfacemounting housing to be exceeded.
– The ambient temperature must not be
outside the permitted range of -5 to
+50°C.
2.3
Installation in the surfacemounting housing
Code /110
Fixing holes
(knock-outs)
Cable gland
Conductivity microprocessor
Rear cover, hinged
Techn. data:
Protection: IP65
Material: ABS
Front cover hinged, clear
8
3
ELECTRICAL CONNECTION
Connection
for
Relay
Terminals
K1*
K2
K4*
41 (O) n.c. (break)
42 (P) common
43 (S) n.o. (make)
51 (O) n.c. (break)
52 (P) common
53 (S) n.o. (make)
95 (O) n.c. (break)
96 (P) common
Measurement Conductivity 45 output
46 +
(isolated)
Temperature 91 +
92 -
Supply as on AC/DC
label
L1
N
PE
TE
line AC
L+
neutral
Lprotective earth
screen
positive DC
negative
* contact protection circuit 22 nF/56 Ω between common and make contact or common
and
break contact
9
ELECTRICAL CONNECTION
Input
Conductivity
cell
Terminals
111
112
Resistance
211
thermometer 212
in 3-wire
213
circuit
Resistance
211
thermometer 212
in 2-wire
213
circuit
Rcomp = lead resistance
Logic input 1 81
82
82 and 84 are linked internally
Logic input 2 83
84
* contact protection circuit 22 nF/56 Ω between common and make contact or common
and break contact
Outer electrode
Inner electrode
Temperature
compensation
Conductivity cell with
connector
attached cable
white
2
brown
1
yellow
+
+
3
green
10
Transmitter
112
111
211 + 212
extra link
212 + 213
4
OPERATION
4.1
Matrix/level scheme
The instrument is operated solely using six
front keys. The individually adjustable parameters (e.g. control parameters) and configuration data (e.g. range changeover) are
stored in a matrix consisting of 10 x 10 = 100
fields. A matrix field can be reached with the
keys V (vertical movement) and H (horizontal
movement). The matrix is divided into four
levels to ensure a clear presentation of the
many different actions.
The individual levels are inhibited by number
passwords to prevent unauthorised alteration.
Indication level
e.g. conductivity, temperature
This level consists of 10 matrix fields (V0H0
- V9H0). Data can be indicated here but can
not be altered. From the matrix field V9H0
the next level can be reached by input of the
appropriate number password.
The number passwords are as follows:
(input in matrix field V9H0)
❑ to open the indicating level:
no password required
❑ to open the operating level:
0110
❑ to open the parameter level:
0020
❑ to open the configuration level:
0300
A special password permits viewing all the
matrix fields but no alteration of the data
contained in them. This password is:
0009
Input of a different number inhibits the operating level. This status of the instrument corresponds to the status after power-up.
Note:
following any setting or servicing operations
the levels should be inhibited again in order
to prevent unintended alterations of the setting
Operating level
e.g. calibration, select setpoints
This level consists of the 20 matrix fields
V0H0 - V9H1.
4.2
Parameter level
e.g. Tv, Tn, Xp
This level consists of 80 matrix fields (V0H0
- V9H7)
Configuration level
e.g. controller type
This level consists of the 100 matrix fields
(V0H0 - V9H9).
Value and function input
The functions of the matrix fields can be divided into six categories. In general, any not
successfully completed inputs and procedures are followed by retention of the previous status after return to the measurement
mode.
4.2.1 Indication of values
Indication of values without any possibility
of altering them is available only at the indication level, i.e. in the fields of the first matrix column, apart from matrix field V9H0.
After inputting the password 0009 via matrix
field V9H0 it is possible to show the current
value of all other matrix fields on the display.
Matrix field V7H0 (Indicate fault codes) is an
exception; additional existing errors codes
can be displayed using the keys ▲ and ▼.
11
OPERATION
4.2.2 Input of a number password
On the matrix field V9H0 any number between 0000 and 9999 can be input (negative
numbers can not be set).
After selecting the matrix field (direct selection via ENTER, see also 4.2.10) the number
0000 appears on the display, with the units
digit flashing. It can be altered using the
keys ▲ and ▼. The tens digit is selected with
the key ❮ and can again be altered using the
keys ▲ and ▼. This procedure can be continued up to the last digit. If a mistake is
made during the input you can return to the
units digit with the key ❮.
Operating the ENTER key causes the instrument to accept the value which has been input. The display returns to 0000.
If a wrong value has been input it is possible
to repeat the input procedure by pressing
the ENTER key again.
The input of a number password is explained in Section 4.2.7 example 1.
4.2.3 Input of values
When inputting values other than number
passwords it must be noted that the range of
values is limited and is generally set to particular default values. This leads to certain
special features for otherwise similar input
sequence:
a) After selecting the matrix field the display
shows the default setting (factory settings
or previous setting by the user).
b) Decimal point and negative sign can appear on the display.
c) When attempting to input a value outside
the value range of the parameter, pressing the ENTER key is followed by the display flashing the limit which the input has
exceeded upwards or downwards. The
input is taken as unsuccessfully completed and can be restarted by pressing the
ENTER key again.
d) When the input has be completed successfully (after pressing ENTER) the edited value remains steady on the display
without flashing.
Example 2 (Section 4.2.8) explains the input
of a value.
4.2.4 Selection from given alternatives
Several matrix fields permit a selection from
given possibilities (software switch). After
the matrix field has been selected the display flashes the symbol for the default alternative (a figure or alphanumerical characters
such as "no"). The keys ▲ and ▼ can be
used to display all other possible settings
which can be entered by pressing the ENTER key. The symbol of the selected alternative then appears steady on the display
without flashing. The matrix fields V9H2,
V1H2 and V0H3 are exceptions; when selected, they display a flashing "no" which
changes to a flashing "YES" on pressing the
▲ and ▼ key. On pressing the ENTER key in
the case of V9H2, the display flashes BUSY
for about 15 seconds and then changes to a
steady "no" (see Example 3 in Section 4.9.2).
During the BUSY phase it is not possible to
leave this matrix field and the instrument
must not be switched off. If the supply fails
during this phase the factory setting has to
be accepted initially. In the case of V0H3
and V1H2 the BUSY does not appear, the
display immediately shows "no". In all cases
the entry of the required data is then completed.
4.2.5 Activating a procedure
The matrix fields which come under this
heading are V0H1 "Calibration of cell constant" and V1H1 "Experimental evaluation of
temperature coefficient" which are described in detail in Section 6.
4.2.6 Matrix fields not in use
In the case of matrix fields not being used
the display "_ _ _ _" is shown.
12
OPERATION
4.2.7 Example 1:
De-inhibiting the operating level
input of the number password 0110)
Initial status:
Instrument in measurement mode
Displayed matrix position: V0H0
Step 1:
Press ENTER key.
Matrix field V9H0 is selected.
The units digit is flashing.
Step 2:
Using the key ❮ switch to the tens digit.
Using the ▲ and ▼b key set the figure 1.
Step 3:
Using the ❮ key switch to the hundreds digit.
Using the ▲ and ▼ key set figure 1.
13
OPERATION
Step 4:
Using the ENTER key enter the 4-digit
number. The display changes to 0000.
Step 5:
Following the correct input the operating
level is now de-inhibited.
Check: using the H key it is possible now to
alternate between 0 and 1. If this is not possible, repeat steps 1 to 5.
The other number passwords are input similarly.
4.2.8 Example 2:
Setpoint input w1 as 545 µS/cm
Initial status:
Operating level de-inhibited.
Indicated matrix position V9H0
Step 1:
Select matrix field V4H1 using the V and H
keys.
The units digit is flashing.
14
OPERATION
Step 2:
Using the ▲ and ▼ key set the figure 5.
Step 3:
Using the ❮ key change to the tens digit. Using the ▲ and ▼ key set the figure 4.
Step 4:
Using the ❮ key change to the hundreds digit. Using the ▲ and ▼ key set the figure 5.
Step 5:
Using the ENTER key enter the 4-digit
number. The display changes to 0545
steady.
This completes the procedure. After inhibiting the level it is possible if required to return
to the measurement mode by selecting the
matrix field V0H0.
15
OPERATION
4.2.9 Example 3:
Entering factory setting
Initial status: instrument in measurement
mode. Indicated matrix position: V0H0
The relay contacts can only be activated on
matrix field V0H0 (measurement mode) using the following keys:
✱ De-inhibit the parameter level by input of
the number password 0020 (see example
1, Section 4.2.7)
✱ Select matrix field V9H2, the display
flashes "no".
✱ Press ▲ and ▼ key, the display flashes
"YES".
✱ Press ENTER key. The display flashes
BUSY. After about 15 seconds the display
changes automatically to "no" (steady).
This completes the procedure.
After inhibiting the level it is possible if required to return to the measurement mode
by selecting the matrix field V0H0.
Operating key ▲ (K1) activates relay contact
K1.
Operating key ▼ (K2) activates relay contact
K2.
Pulse operation: Select 0 in matrix field
V3H9
The relay contact is activated only while the
corresponding key is pressed.
When the key is released the corresponding
relay contact is immediately inactive (0/manual).
Switch operation: Select 1 in matrix field
V3H9
When key ▲ and ▼ is operated for the first
time, the corresponding relay contact is activated and remains so until the same key is
pressed again.
When the HOLD LED is alight no manual operation is possible.
4.2.10 Special key functions.
At the indicating level, operating the ENTER
key produces a jump to the matrix field
4.3.4 Switching action of the
V9H0.
controller types
At all levels, simultaneous operation of the V
Limit
controller
and H keys produces a jump to the matrix
The appropriate relay contact switches perfield V0H0.
manently.
4.3
Manual operation
4.3.1 De-inhibiting
Manual operation is de-inhibited inside the
instrument (see Section 10) using switch
S201.1 (normally de-inhibited) and through
the matrix field V2H1 (normally inhibited).
If switch S201.1 is inhibited (position 0) manual operation is not possible.
When manual operation is activated the LED
HAND lights up.
Pulse duration controller
The appropriate relay contact switches for
the duration of the pulse.
Pulse frequency controller
The maximum pulse frequency is output as
set in matrix field V6H4 or V7H4.
Modulating controller
The actuator is opened or closed.
4.3.2 Auto/manual changeover
When changeover is not inhibited, key ❮ in
matrix field V0H0 (measurement mode) can
be used to switch between auto and manual
operation.
4.3.3 Operating the relay contacts
16
OPERATION
4.4
Temperature compensation
The temperature compensation corrects the
actually present conductivity to the 25°C reference temperature, using pairs of values for
liquid temperature and temperature co-efficient. This corrected value is then indicated.
Up to a product temperature of 150°C the
max. temperature coefficient is 5.5%/°C; it
then decreases as follows:
to 200°C down to 4%/°C
and then
to 250°C down to 3%/°C
Matrix field V3H2 decides whether the temperature is determined manually or automatically:
0 = MTC (manual input of liquid temperature
in °C in matrix field V3H1)
1 = ATC (automatic evaluation of liquid temperature using a Pt 100 resistance thermometer connected to the unit)
4.4.1 Manual temperature compensation
(MTC)
The liquid temperature in °C is input in matrix
field V3H1.
4.4.2 Automatic temperature compensation (ATC)
With automatic temperature compensation
a Pt 100 resistance thermometer is used to
evaluate liquid temperatures between -50°C
and +250°C.
The conductivity transmitter/controller is intended for the use with a Pt 100 resistance
thermometer in 3-wire circuit (for connection
diagram see Section 3, Electrical connection).
When using a resistance thermometer in 2wire circuit a lead compensating resistance
Rcomp must be connected into the circuit.
Rcomp must correspond to the resistance of
one lead of the connection from Pt 100 resistance thermometer to the transmitter/
controller (for connection diagram see Section 3, Electrical connection).
17
18
Experimental
evaluation of
temperature
coefficient
Interface
Inhibit/de-inhibit
V8
V9
Instrument
addresses
HOLD
0 = off
1 = on
see Section 11
Alarm delay
[sec]
Observe notes in Section 8
see Section 4
Indicate fault
codes
see Section 9
Version
Alarm tolerance
(indication of
[µS/cm or mS/
software version)
cm]
V6
V7
Indicate setpoint
2 [µS/cm or mS/
cm]
V5
Set setpoint 2
[µS/cm or mS/
cm]
Indicate setpoint
1 [µS/cm or mS/
cm]
see Section 4
Set setpoint 1
[µS/cm or mS/
cm]
see Section 6
Indicate
Changeover
cell constant
0 = auto
1 = manual
see Section 4
Indicate temper- Input MTC temature coefficient
perature
[%/°C]
Indicate
temperature
[°C]
V4
V3
V2
V1
OPERATING LEVEL
INDICATING LEVEL
H0
H1
V0
Indicate
measurement
[µS/cm or mS/
cm]
4.5 Matrix summary
see Section 11
Factory settings
(default)
Pull-in delay
relay 2
[sec]
see Section 7
Input filter
constant
[sec]
see Section 11
Drop-out delay
relay 2 [
sec]
Max. pulse
frequency 2
[1/h]
Max. pulse
frequency 1
[1/h]
Reset time 2 Tn
2 [sec]
Reset time 1
Tn 1
[sec]
Start meas. tem- End meas. temperature output perature output
[°C]
[°C]
see Section 7
see Section 7
see Section 7
see Section 4
Proportional
Derivative time 1
band Xp 1
Tv 1
[µS/cm or mS/
[sec]
cm]
Proportional
Derivative time 2
band Xp 2
Tv 2
[µS/cm or mS/
[sec]
cm]
Pull-in delay re- Drop-out delay
lay 1
relay 1
[sec]
[sec]
Changeover
0 = MTC
1 = ATC
see Section 6
H2
H3
H4
Calibration of cell Read in old cell Supply frequenconstant with
constant data
cy 0 = 50Hz
calibration solu1 = 60 Hz
tion see Section
see Section 6
6
Read in old
Start meas. con- End meas. contemp. coefficient ductivity output ductivity output
data
[%]
[%]
Differential 2
[µS/cm or mS/
cm]
Differential 1
[µS/cm or mS/
cm]
see Section 7
Simulation
0 = off
1 = on
H7
Changeover
Changeover
0 = break cont. 1 0 = min contact 1
1 = make cont. 1 1 = max contact
1
Min. ON time 2
or Pulse duration 2 [sec]
Min. ON time 1
or Pulse duration 1 [sec]
see Section 7
Simulation output [%]
H6
Pulse period 2
Changeover
Changeover
[sec]
0 = break cont. 2 0 = min contact 2
1 = make cont. 2 1 = max contact
2
under development
Pulse period 1
[sec]
Output limit Y 2
[%]
Output limit Y 1
[%]
Output
changeover
0 = 0-20 mA
0-10 V
4 = 4-20 mA
see Section 7
H5
CONFIGURATION LEVEL
PARAMETER LEVEL
Measurement
output
0 = linear
1 = dual-slope
H9
Controller type 2
Alarm changeover
0 = steady contact
1 = pulse contact
Actuator stroke
Probe break
time
monitor
[sec]
0 = off / 1 = on
see Section 11
Working point
[%]
Controller
structure 2
see Section 7
Input/ indicate
cell constant
[%]
see Section 5
Input temp. coChangeover
efficient
manual
[%/°C]
0 = pulse op.
1 = switch op.
see Section 6
see Section 4
Controller struc- Controller type 1
ture 1
see Section 1
Select cell
constant
see Section 1, 5
Changeover
0 = µS/cm
1 = mS/cm
H8
Select range
µS/cm or mS/cm
see Section 1
5
SWITCHING THE RANGE
Instruments supplied from stock without
specific ordering details have a basic configuration (incl. span = 0 - 1 mS/cm, cell constant C = 1.0 /cm; see Section 12).
If the user requires a different configuration
he has to set this himself. The parameters involved in the range are the unit of the range
(µS/cm or mS/cm, matrix field V1H8), the
upper range limit (matrix field V0H8) and the
nominal size of the cell constant (matrix field
V2H8). It is essential that the choice is restricted to the combinations shown in the
range table (see Section 1). The additional
hardware change required consists of recoding the input card (see Section 10.4)
which also sets the correct measurement
frequency.
Important:
Before opening the case, observe the Notes
in Section 10: "Adjustments inside the instrument"!
On switching the range, all previous settings
are overwritten by a default setting (see Section 11.4).
19
6
CALIBRATION
6.1
Introduction
6.3.1 Procedure for calibrating the cell
After considering Section 5 the instrument constant with a calibration solution
can be placed into operation in conjunction Note:
with a cell of the given cell constant, without
Before calibration it is necessary to
requiring any additional settings.
The actual value of the cell constant is sub- de-inhibit the operating level!
ject to individual variations, and in addition
the temperature coefficient depends on the
✱ Select matrix field V0H1
product being tested; it may therefore be deTemperature compensation is suppressed.
sirable to determine these two parameters
The current value at the input is indicated,
more precisely in order to obtain a better
taking into account the true value of the cell
measurement accuracy. There are several
constant.
methods to achieve this which are described
below.
✱ Press ENTER
The HOLD LED lights up.
The LED Cal 1 lights up - immerse the sensitive part of the cell in the calibration solution.
6.2 Numerical input of cell conWait until the reading has become steady.
stant and temperature coefficient
✱ Press ENTER
If the values of cell constant and temperature coefficient are known, they can be input
after opening the configuration level, using
the fields V2H9 (cell constant in % of nominal size as input at V2H8), and V3H8 respectively.
The indicated value is "frozen" (i.e. the
display no longer responds to the input).
The indicated value can now be edited (for
editing of values see Example 2, Section
4.2.8). The purpose of editing is to bring the
indicated value to the true value of the calibration solution.
✱ Press ENTER
The newly determined cell constant is
stored in matrix field V2H9 as a percent6.3 Calibrating the cell constant
age.
using a calibration solution
The LED HOLD lights up.
When the precise value of the cell constant
The calibration procedure is now completed.
is unknown it can be determined with the aid
of a calibration solution.
Note:
After selecting field V0H1 the temperature
compensation is suppressed. The cell is im- After moving away from matrix field V0H1
mersed in the calibration solution and the the LED HOLD goes dark.
display then shows a value based on the
true value of the cell constant but without
reference to temperature. The subsequent
editing procedure presumes an accurate
knowledge of the conductivity of the calibration solution at the current temperature.
From the value input the instrument calculates the cell constant and transfers it to the
memory.
20
CALIBRATION
6.4
6.4.1 Procedure for experimental
Experimental determination
determination of the temperature
of the temperature coefficient
An experimental determination of the product temperature coefficient after selection
the field V1H1 requires activating the automatic temperature compensation (matrix
field V3H2). The display shows the temperature-compensated value of the current conductivity. The value of the current cell
constant is taken as being correct. After
pressing the ENTER key the display shows
the temperature measured by the temperature sensor.
The method is based on measuring the nontemperature-compensated conductivities
(temp. coeff. = 0) at two temperatures, the
reference temperature 25°C and a second
temperature T which usually corresponds to
the temperature of the subsequent measurement. When accepting the measured values it is important to allow for the delay of
the temperature sensor, i.e. a steady temperature reading on the display has to be
obtained before pressing the ENTER key.
Technical reasons sometime prevent exact
setting of the product temperature to the reference temperature; values within the range
25.0 ± 2.5°C are therefore accepted by the
instrument. The temperature coefficient is
calculated from the two pairs of values and
transferred to the memory.
In case the reference temperature is not
within the indicated limits there is an error
message. This disappears when making a
fresh experimental determination of the temperature coefficient using field V3H8, or on
entering the old value using field V1H2.
coefficient
Note:
Before calibration, the operating level must
be de-inhibited and in Matrix field V3H2 the
selection ATC = 1 must be made.
✱ Select matrix field V1H1
The current value at the input (conductivity)
is indicated. The current temperature coefficient and the current cell constant are being
used.
✱ Press ENTER
The HOLD LED lights up.
The LED Cal 1 lights up.
Immerse the sensitive part of the cell in the
calibration solution.
Wait until the reading has become steady
(liquid temperature 25°C ± 2.5°C).
✱ Press ENTER
The HOLD LED lights up.
The LED Cal 1 is flashing; the pair of values
conductivity 1 and temperature 1 is being
accepted.
After the first pair has been accepted the
LED Cal 2 lights up.
Bring the solution to the later working temperature. (Check using the indication on the
display. The sensitive part of the cell must
remain immersed in the liquid).
Note:
When accepting the measured values it is
important to allow for the delay of the temperature sensor, i.e. a steady temperature
reading has to be obtained before pressing
the ENTER key.
✱ Press ENTER
The HOLD LED lights up.
The LED Cal 2 is flashing; the value pair conductivity 2 and temperature 2 is being accepted.
After the second value pair has been accepted the LED HOLD is alight.
21
CALIBRATION
7
ANALOGUE OUTPUT
The temperature coefficient is calculated
from the two pairs of values and stored in
matrix field V3H8.
The value currently at the input (conductivity(
is indicated.
It is based in the newly calculated temperature coefficient and on the current cell constant.
7.1
Process value output
Note:
The selection between current and voltage is
made with a DIL switch, see Section 10.1,
Analogue output.
The change between the current outputs 0 20 mA and 4 - 20 mA is made in matrix field
V1H5 for conductivity and temperature.
When the analogue output is being operated
as a voltage output the matrix field V1H5
must be set to current output 0 - 20 mA.
The measurement span to be converted into
the analogue output can be selected in matrix fields V1H3 Start conductivity output
and V1H4 End conductivity output, also
V2H3 Start temperature output and V2H4
End temperature output.
The simulation of the output signal for conductivity and temperature is activated by
switching the matrix field V1H7 from 0 to 1
using the keys ▲ and ▼ and pressing ENTER. The simulated output value for conductivity and temperature, set in matrix field
V1H6 as percentage of span, is then output.
The process output conductivity can be represented in two ways:
After moving away from matrix field V0H1
the HOLD LED goes dark.
6.5
Accepting old calibration data
Following successful completion of the calibration procedures and measurements as
described above, it may be decided not to
accept the new values. The previous value
can then be restored by using the matrix
fields V0H3 (cell constant) and/or V1H2
(temperature coefficient), or fresh inputs can
be made using V2H9 and/or V3H8.
The transmitter/controller can output the following standard signals proportional to the
inputs conductivity (and temperature if configured):
0 - 20 mA
4 - 20 mA
0 - 10 V
linear:
select 0 in matrix field V1H9
dual-slope: select 1 in matrix field V1H9
With a dual-slope signal, the output reaches
mid-range at 10% of the span between start
and end of conductivity range.
22
ANALOGUE OUTPUT
Example:
Selected range
500 µS/cm
Start of conductivity output
20.0% of 500 µS/cm = 100 µS/cm
End of conductivity output
100.0% of 500 µS/cm = 500 µS/cm
Span
500 µS/cm - 100 µS/cm = 400 µS/cm
Selected output signal
4 - 20 mA
The output signal is 12 mA at 140 µS/cm,
20 mA at 500 µS/cm
23
8
CONTROLLER
8.1
Concepts
Alarm delay
The time during which the alarm condition
Alarm contact
The limit controller monitors the active time must be fulfilled before the alarm relay and
of the relay. If this time is exceeded by an the alarm LED are activated.
adjustable value (delay time) the alarm conAlarm tolerance
tact is activated.
The proportional and the modulating con- If the control deviation exceeds the alarm
troller monitors the size of the control devia- tolerance the alarm delay is started. At the
tion. If this exceeds an adjustable value end of the alarm delay the alarm contact is
(alarm tolerance) an adjustable delay time is activated.
started and at its end the alarm contact is
activated.
With both functions the delay time is reset
when the alarm conditions are no longer fulfilled.
Changeover break/make contact
0=
break contact (common connected to
n.c. contact)
1=
make contact (common connected to
n.o. contact
Conductivity
Example
break-make contact
Range
I
Range
II
Range
III
w2
w1
Time
min
max
break
make
break
make
Range I
LED
ON
ON
OFF
OFF
Contact
0
1
1
0
Range II
LED
OFF
OFF
OFF
OFF
24
Contact
1
0
1
0
Range III
LED
OFF
OFF
ON
ON
Contact
1
0
0
1
CONTROLLER
Break contact
As long as the controller is inactive the common is connected to the n.c. (break) contact
and the corresponding LED is off.
Controller type
It defines the controller as:
0 = controller off
1 = limit controller
2 = quasi-proportional controller with
Make contact
pulse duration output
3
=
quasi-proportional controller with
As long as the controller is inactive the compulse frequency output
mon is connected to the n.o. (make) contact
5
=
modulating controller
and the corresponding LED is off.
Changeover min/max contact
Min contact means that the controller is active when the process value is below the setpoint.
Max contact means that the controller is active when the process value is above the setpoint.
0 = min contact
1 = max contact
Derivative time TV
(differentiation constant)
Control parameter in a PD and PID controller. It determines effect and filtering of the
process variable change.
Differential
In the case of a non-analogue controller the
differential is the change in process variable
required to produce changeover of a relay
contact with increasing and with decreasing
process variable.
Changeover steady/pulse contact
Applies only to the alarm contact and defines the action on activating the alarm conDrop-out delay
tact.
The time interval which has to elapse until
0 = steady contact
the relay contact switches over when the
The alarm relay is energised and
switching conditions are no longer fulfilled.
remains so until the cause of the
alarm has been removed. The alarm
Limit controller
LED is flashing.
Single-setpoint controller with pull-in and/or
1 = pulse contact
drop-out delay.
The alarm relay switches once for
approx. 1 second and then returns to
Maximum pulse frequency
its original status. The alarm LED
The value based on the technical data of the
continues to flash until the cause of
dosing pumps (e.g. with magnetic dosing
the alarm has been removed.
pumps).
Controller structure
Determining the controller structure of a proportional or quasi-proportional controller or
modulating controller.
Minimum ON time
The value given by the technical data of the
dosing element (in dosing pumps or solenoid valves).
0 = P (proportional)
1=I
(integral)
2 = PD (proportional, differential)
3 = PI (proportional, integral)
4 = PID (proportional, integral, differential)
Output limit
The maximum value of the output signal of a
proportional or quasi-proportional controller.
25
CONTROLLER
Proportional band Xp
Working point
The range of a P controller within which Output on P and PD controllers for zero conthere is a proportional relationship between trol deviation.
control deviation and controller output
change.
Pull-in delay
The time interval until the control contact
switches over when the switching condition
is fulfilled.
8.2
Possible combinations
Two of the following controllers can be combined as required. The selection is made in
the matrix fields V4H9 Controller type 1 and
V5H9 Controller type 2.
Pulse period
The value indicates the period during which - Controller off
the pulse duration modulation takes place.
- Limit controller
- Pulse duration controller
Quasi-proportional controller with pulse
- Pulse frequency controller
duration output
When a control deviation occurs the relay The modulating controller can only be sestarts to output pulses of different duration lected in matrix field V4H9 Controller type 1.
A selection in matrix field V5H9 Controller
(parameter: minimum ON time).
The duration of the pulses depends on the type 2 is then ineffective.
magnitude of the deviation and on the set
control parameters. This output can be used
to control solenoid valves, for example.
8.3 Controller switched off
Selection 0 (controller off)
Quasi-proportional controller with pulse
in matrix field V4H9, Controller type 1
frequency output
and/or
When a control deviation occurs the relay matrix field V5H9, Controller type 2
starts to output pulses of constant duration
Relevant control parameters:
(parameter: minimum ON time).
none
The repeat frequency of the pulses depends
on the magnitude of the deviation and on the
set control parameters. This output can be
used to operate magnetic dosing pumps, for
8.4 Limit controller
example.
Selection 1 (limit controller)
in matrix field V4H9, Controller type 1
Reset time Tn
and/or
(integral constant)
Control parameter of a PI, PID and I control- matrix field V5H9, Controller type 2.
ler. The value determines the rate at which Relevant parameters:
the control deviation is integrated in the inte- in matrix field V6H2, Pull-in delay relay 1
grator.
and/or
matrix field V7H2, Pull-in delay relay 2
Stroke time
or
Adjustable on modulating controller. This in matrix field V6H3, Drop-out delay relay 1
value must be obtained from the data of the and/or
actuator manufacturer (e.g. for a motorised matrix field V7H3, Drop-out delay relay 2
valve).
26
CONTROLLER
in matrix field V6H7, Changeover min/max Relevant parameters:
contact 1
in matrix field V4H8, Controller structure 1
and/or
and/or
matrix field V7H7, Changeover min/max matrix field V5H8, Controller structure 2
contact 2
in matrix field V4H3, Derivative time 1
in matrix field V6H6, Changeover break/ (for PD and PID control action)
make contact 1
and/or
and/or
matrix field V5H3, Derivative time 2
matrix field V7H6, Changeover break/make (for PD and PID control action)
contact 2
or
in matrix field V4H7, Differential 1
in matrix field V4H4, Reset time 1
and/or
(for I, PI and PID control action)
matrix field V5H7, Differential 2
and/or
matrix field V5H4, Reset time 2
in matrix field V4H1, Set setpoint 1
(for I, PI and PID control action)
and/or
matrix field V5H1, Set setpoint 2
8.5
Pulse duration controller
Selection 2 (pulse duration controller)
in matrix field V4H2, Proportional band XP1
(for P, PI and PID control action)
and/or
matrix field V5H2, Proportional band XP2
(for P, PI, PID control action)
in matrix field V6H5, Pulse period 1
and/or
matrix field V7H5, Pulse period 2
in matrix field V4H6, Minimum ON time 1
and/or
matrix field V5H6, Minimum ON time 2
in matrix field V6H7, Changeover min/max
contact 1
and/or
matrix field V7H7, Changeover min/max
contact 2
T = pulse period
tON = minimum ON time
tON < T
Important:
If both relay contacts switch for process
value below setpoint then there must be
w1 < w2!
If both relay contacts switch for process
value above setpoint then there must be
w1 > w2!
in matrix field V4H9, Controller type 1
and/or
matrix field V5H9, Controller type 2.
in matrix field V6H6, Changeover break/
make contact 1
and/or
matrix field V7H6, Changeover break/make
contact 2
in matrix field V6H8, Working point
in matrix field V4H5, Output limit Y1
and/or
matrix field V5H5, Output limit Y2
in matrix field V4H1, Set setpoint 1
and/or
matrix field V5H1, Set setpoint 2
27
CONTROLLER
8.6
Pulse frequency controller
Selection 3 (pulse frequency controller)
and/or
matrix field V5H4, Reset time 2
(for I, PI and PID control action)
in matrix field V4H2, Proportional band XP1
(for P, PI and PID control action)
and/or
matrix field V5H2, Proportional band XP2
(for P, PI, PID control action)
in matrix field V6H4, Max. pulse frequency 1
and/or
matrix field V7H4, Max. pulse frequency 2
tON = minimum ON time
tON + tOFF = T
tON = 0.2 sec min.
T = 0.4 sec min.
pulses/h = (3600 sec/h)/T
in matrix field V4H6, Minimum ON time 1
and/or
matrix field V5H6, Minimum ON time 2
in matrix field V6H7, Changeover min/max
contact 1
and/or
matrix field V7H7, Changeover min/max
contact 2
If tOFF would have to be less than 0.2 sec
there is no steady output signal and the relay in matrix field V6H6, Changeover break/
make contact 1
contact goes to inactive.
and/or
Important:
matrix field V7H6, Changeover break/make
If both relay contacts switch for process
contact 2
value below setpoint then there must be
in matrix field V6H8, Working point
w1 < w2!
in matrix field V4H5, Output limit Y1
and/or
If both relay contacts switch for process
matrix field V5H5, Output limit Y2
value above setpoint then there must be
w1 > w2!
in matrix field V4H1, Set setpoint 1
and/or
in matrix field V4H9, Controller type 1
matrix field V5H1, Set setpoint 2
and/or
matrix field V5H9, Controller type 2.
Relevant parameters:
8.7
in matrix field V4H8, Controller structure 1
and/or
matrix field V5H8, Controller structure 2
Selection 5 (modulating controller)
in matrix field V4H9, Controller type 1
in matrix field V4H3, Derivative time 1
(for PD and PID control action)
and/or
matrix field V5H3, Derivative time 2
(for PD and PID control action)
or
in matrix field V4H4, Reset time 1
(for I, PI and PID control action)
Relevant parameters:
Modulating controller
in matrix field V4H8, Controller structure 1
(only PI and PID action appropriate)
in matrix field V4H4, Reset time 1
(for PI and PID control action)
in matrix field V7H8, Stroke time
in matrix field V4H2, Proportional band XP1
28
CONTROLLER
(for PI and PID control action)
in matrix field V4H6, Min. ON time 1
and/or
matrix field V5H6 Min. ON time 2
in matrix field V4H5, Output limit Y1
and/or
matrix field V5H5, Output limit Y2
in matrix field V4H1, Set setpoint 1
and/or
matrix field V5H1, Set setpoint 2
Optimum
Note:
with PID action there is a fixed ratio
Tv = Tn/4.
8.8
Alarm contact
in matrix field V6H1, Alarm tolerance
and/or
in matrix field V7H1, Alarm delay
in matrix field V6H9, Changeover steady
alarm contact/pulse alarm contact
Note:
Tn too small
In controller type "limit controller" the alarm
tolerance is fixed internally at 0.
8.9
Notes on possible incorrect
controller settings and their
correction
The optimum adjustment of the controller to
the process loop can be tested by recording
a start-up with the control loop closed.
Tn too large
The diagrams below relate to PID action and
indicate possible incorrect settings and their
correction.
It is found that increasing XP and increasing
Tn both produce a more stable and more
sluggish control action.
Reducing XP or Tn leads to a less damped
control action.
XP too small
29
CONTROLLER
9
FAULTS, WARNINGS
9.1
Introduction
The fault codes are shown in matrix field
V7H0. If several faults occur simultaneously
the code with the smallest number is shown
first. All other codes can be called up with
key ▲ in increasing order. Correspondingly
pressing key ▼ calls up the code with the
next lower number.
XP too large
Fault codes are updated continuously. If a
fault code is cleared while on display, the
code with the next lower number (if it exists)
is displayed. Otherwise the code with the
next higher number is displayed. If there is
no fault and no warning the display shows
F000.
Certain faults shift the controller to the
HOLD status for the time they are present.
These are the faults F020, F021, F022, F023,
F024 and F025.
9.2
Faults
Faults activate the alarm relay while they are
present.
F010
Measurement above/below alarm tolerance and controller alarm delay exceeded
Remedy: check control parameters.
F020
Outside permitted tolerance range of cell
constant
The cell constant differs by more than ±20%
from the nominal value.
Remedy: repeat the calibration; possibly
clean cell or check calibration solutions.
F021
Outside permitted range of temperature
coefficient
The temperature coefficient is less than
0%/°C or larger than 5.5%/°C.
Remedy: repeat the calibration
(see Section 6).
30
FAULTS, WARNINGS
F022
Conductivity underrange
Measurement below 0
or
probe break monitor has operated
F031
Process value output above permitted
maximum
The process value is larger than the set value.
The probe break monitor is activated and the Remedy:
measurement is below 2% of the measuring change value in matrix field V1H4
or
range.
change value in matrix field V2H4.
Possible cause:
break in cable, conductivity of liquid less
than 2% of range, or cell not immersed in liq9.3 Warnings
uid.
Warnings do not activate the alarm relay but
the
alarm LED is flashing. If the instrument is
F023
controlling it continues to do so during warnConductivity overrange
ings without being influenced.
Measurement above set range
Possible cause:
F050
short-circuit in cable, range too small or Parameter limits for process value intertemperature coefficient of liquid too high.
changed
The end value of the process value output is
F024
smaller than the start value of the process
Incorrect temperature measurement
value output.
(only relevant with ATC)
Remedy:
Possible cause:
interchange value in matrix field V1H3 with
Pt 100 resistance thermometer has short- value in matrix field V1H4
circuit, break, is not connected, or tempera- or
ture is outside the range -50 to +250°C.
interchange value in matrix field V2H3 with
value in matrix field V2H4.
F025
F060
Combination of range with cell constant
not permitted
Pulse duration controller
Remedy:
Minimum ON time 1 is not less than pulse
use only a combination shown on page 12. period 1
F030
Process value output below permitted
minimum
The process value output is smaller than the
set value.
Remedy:
reduce minimum ON time in matrix field
V4H6
and/or
increase the pulse period in matrix field
V6H5.
Remedy:
change value in matrix field V1H3
or
change value in matrix field V2H3
Pulse frequency controller
Pulse duration 1 [sec] is not less than
3600 [sec/h]
max. pulse frequency 1 [1/h]
31
FAULTS, WARNINGS
Remedy:
reduce the pulse duration in matrix field
V4H6
and/or
reduce the maximum pulse frequency in matrix field V6H4.
F061
Pulse duration controller
Minimum ON time 2 is not less than pulse
period 2
Remedy:
reduce minimum ON time in matrix field
V5H6
and/or
increase the pulse period in matrix field
V7H5.
Pulse frequency controller
Pulse duration 2 [sec] is not less than
3600 [sec/h]
max. pulse frequency 2 [1/h]
Remedy:
reduce the pulse duration in matrix field
V5H6
and/or
reduce the maximum pulse frequency in matrix field V7H4.
F070
Actual liquid temperature differs by more
than 2.5°C from the 25°C reference temperature.
Remedy:
repeat calibration
see Calibration (Section 6)
Note:
This warning appears only with ATC and
during the first calibration step for experimental determination of the temperature coefficient.
32
10 ADJUSTMENTS INSIDE THE INSTRUMENT
Warning:
When working on the microprocessor transmitter/controller observe the VDE and ESD
requirements!
Conductivity output
Temperature output
33
ADJUSTMENTS INSIDE THE INSTRUMENT
10.1 Analogue output
The output signal is selected through DIL
switches. The changeover from 0 - 20 mA to
4 - 20 mA is made in software using matrix
field V1H5 (see Section 7.1).
end start
The instrument is supplied fully calibrated. If
a different output signal is selected on the
switches S1101.1 to S1101.4 it may be necessary to make a slight adjustment to the
output signal using the "start" and "end"
trimmers.
Note:
When the instrument is provided for temperature output, the switches on the temperature card must be altered similarly!
Analogue output
Signal
Switches
S1101.1
S1101.2
S1101.3
S1101.4
0 - 10 V
O
X
X
X
0(4)-20
mA
O
O
O
X
O = off
X = on
(1) Jumper for code setting on the conductivity input card
10.2 Manual operation
Important:
Switch S201.7 is provided for servicing only
and is factory-set to position 0.
The setting of switch S201.7 must not be
altered!
Switch S201.1
inhibited
0
de-inhibited X
For description see Section 4.3
10.3 Input filter
Switch S201.4
on
0
off
X
For description see Section 11.3
34
ADJUSTMENTS INSIDE THE INSTRUMENT
10.4 Code setting on the conductiv- Range:
ity input card
up to 100 µS/cm
Cell constant
C = 0.1 1/cm
The location of the conductivity input card is
shown in Section 10.1 Analogue output.
Range:
Cell constant
up to 0.50 µS/cm
up to 1.00 µS/cm
up to 2.00 µS/cm
up to 3.00 µS/cm
C = 0.01 1/cm
C = 0.01 1/cm
C = 0.01 1/cm
C = 0.01 1/cm
up to 5.00 µS/cm
up to 10.0 µS/cm
up to 5.00 µS/cm
up to 10.0 µS/cm
up to 20.0 µS/cm
up to 50.0 µS/cm
up to 50.0 µS/cm
up to 100 µS/cm
up to 300 µS/cm
C = 0.1 1/cm
up to 300 µS/cm
C = 1.0 1/cm
up to 500 µS/cm
C = 0.1 1/cm
up to 500 µS/cm
C = 1.0 1/cm
up to 1000 µS/cm
C = 0.1 1/cm
up to 1000 µS/cm
up to 1000 µS/cm
C = 1.0 1/cm
C = 3.0 1/cm
C = 0.01 1/cm
C = 0.01 1/cm
C = 0.1 1/cm
C = 0.1 1/cm
C = 0.1 1/cm
C = 0.1 1/cm
C = 1.0 1/cm
C = 1.0 1/cm
35
ADJUSTMENTS INSIDE THE INSTRUMENT
Range:
Cell constant
Range:
Cell constant
up to 2000 µS/cm
C = 1.0 1/cm
up to 5.00 mS/cm
up to 10.0 mS/cm
up to 10.0 mS/cm
C = 1.0 1/cm
C = 1.0 1/cm
C = 3.0 1/cm
up to 1.00 mS/cm
C = 0.1 1/cm
up to 20.0 mS/cm
C = 1.0 1/cm
up to 20.0 mS/cm
C = 3.0 1/cm
up to 30.0 mS/cm
C = 1.0 1/cm
up to 30.0 mS/cm
up to 30.0 mS/cm
C = 3.0 1/cm
C = 10.0 1/cm
up to 50.0 mS/cm
C = 1.0 1/cm
up to 100.0 mS/cm
C = 1.0 1/cm
up to 1.00 mS/cm
up to 1.00 mS/cm
up to 2.00 mS/cm
up to 3.00 mS/cm
up to 3.00 mS/cm
up to 5.00 mS/cm
C = 1.0 1/cm
C = 3.0 1/cm
C = 1.0 1/cm
C = 1.0 1/cm
C = 3.0 1/cm
C = 0.1 1/cm
36
ADJUSTMENTS INSIDE
11 EXTRA FUNCTIONS
Range:
Cell constant
11.1 Function of the logic inputs
up to 100.0 mS/cm
C = 10.0 1/cm
up to 200.0 mS/cm
C = 10.0 1/cm
The instrument can be brought to the HOLD
status by a link (short-circuit) at logic input 1
(terminals 81, 82).
The alarm via the alarm relay can be suppressed by a link across logic input 2 (terminals 83, 84). The alarm LED continues to
operate normally.
11.2 HOLD function
Activating the HOLD function makes the relays inactive. Any started time periods on the
controller (e.g. derivative time) and of the
alarm (alarm delay) are reset.
11.2.1 Internal HOLD
The HOLD function is activated internally by
switching the indication in matrix field V9H1
from 0 to 1 using the key ▲ or ▼ , followed
by pressing the ENTER key.
In addition the HOLD function is automatically activated internally when fundamental
alterations to the instrument settings are
made. Examples: changeover to calibration,
changing the controller type. After completing the alteration and leaving the corresponding matrix field the automatic HOLD is
de-activated.
11.2.2 External HOLD
The HOLD function is activated externally by
a link across the connections of the logic input 1. In this way the HOLD function can be
operated from a PLC, for example.
11.3 Input filter
The input variables conductivity and temperature are passed through a second-order
digital filter which suppressed undesirable
effects such as noise or interference pulses.
The filter constant is factory-set at 0.6 seconds. This value can be altered in matrix
field V9H3.
37
EXTRA FUNCTIONS
Exception: the function of the digital filter
has been switched off with the switch
S201.4. In this case the setting in matrix field
V9H3 is ineffective.
11.4 Reading-in the factory setting
The instrument offers the facility of reading
in the parameter set of the factory setting.
After reading in, all parameters are occupied
by the data which are stored when the instrument is supplied.
Exception: the measuring range, the unit
(µS/cm or mS/cm), the cell constant and the
temperature coefficient remain unchanged
when reading in the factory setting. For adjusting these parameters see Section 6, Calibration.
Reading in the parameters takes place by
switching the indication in matrix field V9H2
from "no" to "YES" using the key ▲ or ▼ ,
followed by pressing the ENTER key.
When altering the measuring range the values in the following matrix fields are altered:
V6H1 Alarm tolerance
V4H1 Setpoint 1
V5H1 Setpoint 2
V4H2 Proportional band XP1
V5H7 Proportional band XP2
V4H7 Differential 1
V5H7 Differential 2
Example 1:
range 0 - 1 mS/cm
V6H1 Alarm tolerance
V4H1 Setpoint 1
V5H1 Setpoint 2
V4H2 Proportional band XP1
V5H7 Proportional band XP2
V4H7 Differential 1
V5H7 Differential 2
Cell constant C = 1.0 1/cm
0.00 mS/cm
(= 0% of range)
0.00 mS/cm
(= 0% of range)
1.00 mS/cm
(= 100% of range)
0.50 mS/cm
0.50 mS/cm
0.02 mS/cm
0.02 mS/cm
38
(= 50% of range)
(= 50% of range)
(= 2% of range)
(= 2% of range)
EXTRA FUNCTIONS
Example 2:
range 0 - 500 µS/cm
V6H1 Alarm tolerance
V4H1 Setpoint 1
V5H1 Setpoint 2
V4H2 Proportional band XP1
V5H7 Proportional band XP2
V4H7 Differential 1
V5H7 Differential 2
Cell constant C = 0.1 1/cm
0 µS/cm
(= 0% of range)
0 µS/cm
(= 0% of range)
500 µS/cm
(= 100% of range)
250 µS/cm
250 µS/cm
10 µS/cm
10 µS/cm
11.5 Probe break monitor
When the probe break monitor is activated in
matrix field V7H9, a conductivity less than
2% of range is recognised as probe break.
This is indicated by the instrument as fault
F022.
39
(= 50% of range)
(= 50% of range)
(= 2% of range)
(= 2% of range)
12 APPENDIX
12.1 Table for parameter and configuration settings
As guidance for later changes of the instrument settings it is possible to enter here the
appropriate parameter and configuration
data. Certain parameters are omitted depending on the particular transmitter and
controller version.
Transmitter
V2H1
V3H9
V9H1
V9H3
V0H4
V0H8
V1H8
V2H8
V2H9
V7H9
Factory setting
conductivity
auto ................................................................ 0
manual ............................................................ 1
manual operation
pulse operation .............................................. 0
switch operation ............................................. 1
HOLD off ........................................................ 0
HOLD on ........................................................ 1
Input filter constant
.......................................................... 0 - 20 sec
Supply frequency 50 Hz ................................. 0
Supply frequency 60 Hz ................................. 1
Measuring range
0.5; 1.00; 2.00; 3.00; 5.00; 10.0; 20.0;
30.0, 50.0; 100; 200; 300; 500; 1000; 2000
Unit
µS/cm ............................................................. 0
mS/cm ............................................................ 1
Cell constant
0.01; 0.1; 1.0; 3.0; 10.0
nput / indicate cell constant
50.0 to 150.0%
Probe break monitor
off ................................................................... 0
on ................................................................... 1
* see Section 11.4
40
0
0
0
0.6 sec*
0
1.00*
1*
1.0
100%
0
User setting
APPENDIX
Calibration
V3H1
V3H2
V3H8
Factory setting
conductivity
MTC temperature
....................................................-50 to +250°C
MTC manual temp compensation .................. 0
ATC automatic temp. comp. .......................... 1
Temperature coefficient
input 0 - 5.5%/°C
Alarm
V6H1
V7H1
V6H9
25.0°C
0
2.30
Factory setting
conductivity
Alarm tolerance
0 to ranges in µS/cm or mS/cm
Alarm delay
........................................................ 0-6000 sec
Steady contact ............................................... 0
Pulse contact ................................................. 1
User setting
User setting
0*
20 sec
0
* see Section 11.4
Process output
V1H3
V1H4
V1H5
V1H6
V1H7
V1H9
V2H3
V2H4
Factory setting
conductivity
Start conductivity output
(conductivity at 0/4 mA or 0 V) .......... 0 - 100%
End conductivity output
(conductivity at 20 mA or 10 V)
........................................................... 0 - 100%
Process value output 0-20 mA/0-10 V ........... 0
Process value output 4-20 mA ...................... 4
Simulation output ................................ 0-100%
Simulation off ................................................. 0
Simulation on ................................................. 1
Process output
linear ............................................................... 0
dual-slope ....................................................... 1
Start temperature output -50 to +250°C
End temperature output -50 to +250°C
Interface
V8H0
V8H1
Interface (under development)
Instrument address (under development)
41
User setting
0%
100%
0
50.0%
0
0
-50°C
250°C
Factory setting
conductivity
0
0
User setting
APPENDIX
Controller
V4H1
V5H1
V4H2
V5H2
V6H2
V7H2
V4H3
V5H3
V6H3
V7H3
V4H4
V5H4
V6H4
V7H4
V4H5
V5H5
V6H5
V7H5
V4H6
Factory setting
conductivity
Setpoint 1
0 to end of range
in mS/cm or mS/cm
Setpoint 2
0 to end of range
in µS/cm or mS/cm
Proportional band XP1
................................................................ 0 digit
............................................... 999 or 9999 digit
Proportional band XP2
................................................................ 0 digit
............................................... 999 or 9999 digit
Pull-in delay relay contact 1
....................................................... 0-999.9 sec
Pull-in delay relay contact 2
.................................................. 0-999.9 sec
Derivative time 1 Tv1
................................................... 0-9999 sec
Derivative time 2Tv2
................................................... 0-9999 sec
Drop-out delay relay contact 1
.................................................. 0-999.9 sec
Drop-out delay relay contact 2
.................................................. 0-999.9 sec
Reset time 1 Tn1 ........................ 0-9999 sec
Reset time 2 Tn2 ........................ 0-9999 sec
Maximum pulse frequency 1
......................................................0-9000 /h
Maximum pulse frequency 2
......................................................0-9000 /h
Output limit Y1 ................................ 0-100%
Output limit Y2 ........................... -100-100%
Pulse period 1 .......................... 1-999.9 sec
Pulse period 2 ........................... 1-999.9 sec
Min. ON time 1 or pulse duration 1
............................................... 0.2-999.9 sec
42
0*
1.00 mS/cm*
0.5 mS/cm
0.5 mS/cm
1.0 sec
1.0 sec
80 sec
80 sec
0.2 sec
350 sec
350 sec
6000/h
6000/h
100%
-100%
20.0 sec
0.2 sec
User setting
APPENDIX
Controller
V5H6
V6H6
V7H6
V4H7
V5H7
V6H7
V7H7
V4H8
V5H8
V6H8
V7H8
V4H9
V5H9
Factory setting
conductivity
Min. ON time 2 or pulse duration 2
............................................... 0.2-999.9 sec
Break contact 1 ......................................... 0
Make contact 1 ......................................... 1
Break contact 2............................................... 0
Make contact 2 ............................................... 1
Differential 1
..................................... within measuring range
Differential 2
..................................... within measuring range
Min. contact 1 ................................................ 0
Max. contact 1 ................................................ 1
Min. contact 2 ................................................. 0
Max. contact 2 ............................................... 1
Controller structure 1
P action .......................................................... 0
I action ........................................................... 1
PD action ........................................................ 2
PI action ......................................................... 3
PID action ....................................................... 4
Controller structure 2
P action .......................................................... 0
I action ........................................................... 1
PD action ........................................................ 2
PI action ......................................................... 3
PID action ....................................................... 4
Working point ...............................-100-+100%
Strke time (modulating controller)
...................................................... 15-3000 sec
Controller type 1
off ................................................................... 0
Limit controller ............................................... 1
Pulse duration controller ................................ 2
Pulse frequency controller ............................. 3
Modulating controller ..................................... 5
Controller type 2
off ................................................................... 0
Limit controller ............................................... 1
Pulse duration controller ................................ 2
Pulse frequency controller ............................. 3
43
0.2 sec
0
0
0.02 mS*
0.02 mS*
0
1
0
0
0%
60 sec
1
1
User setting
CONFIGURATION LEVEL
PARAMETER LEVEL
OPERATING LEVEL
INDICATING LEVEL
H0
V0
V1
H1
H2
H3
H4
Calibration of cell
constant with calibration solution
see Section 6
Read in old cell
constant data
Supply frequency
0 = 50 Hz 1 = 60
Hz
Experimental
Read in old temp.
evaluation of tem- coefficient data
perature coefficient
Start meas. conductivity output
[%]
End meas. conductivity output
[%]
see Section 7
see Section 7
Start meas. temperature output
[°C]
see Section 7
End meas. temperature output
[°C]
see Section 7
Indicate
measurement
[µS/cm or mS/cm]
Indicate
temperature
[°C]
see Section 6
H5
H6
H7
H8
H9
Select range
µS/cm or mS/cm
see Section 1
see Section 6
Output
changeover
0 = 0-20 mA or
0-10 V
4 = 4-20 mA
see Section 7
Simulation output
[%]
Simulation
0 = off
1 = on
Changeover
0 = µS/cm
1 = mS/cm
Measurement
output
0 = linear
1 = dual-slope
see Section 7
see Section 7
see Section 1
see Section 7
Select cell
constant
see Section 1, 5
Input/ indicate
cell constant
[%]
see Section 5
Input temp. coefficient
[%/°C]
Changeover
manual
0 = pulse op.
1 = switch op.
see Section 4
see Section 6
V2
Indicate
cell constant
Changeover
0 = auto
1 = manual
see Section 4
V3
Indicate temperature coefficient
[%/°C]
Input MTC temperature
Changeover
0 = MTC
1 = ATC
see Section 4
see Section 4
V4
Indicate setpoint 1
Set setpoint 1
Proportional band
[µS/cm or mS/cm] [µS/cm or mS/cm]
Xp 1
[µS/cm or mS/cm]
Derivative time 1
Tv 1
[sec]
Reset time 1
Tn 1
[sec]
Output limit Y 1
[%]
Min. ON time 1 or
Differential 1
Pulse duration 1 [µS/cm or mS/cm]
[sec]
Controller structure 1
Controller type 1
V5
Indicate setpoint 2
Set setpoint 2
Proportional band
[µS/cm or mS/cm] [µS/cm or mS/cm]
Xp 2
[µS/cm or mS/cm]
Derivative time 2
Tv 2
[sec]
Reset time 2 Tn2
[sec]
Output limit Y 2
[%]
Min. ON time 2 or
Differential 2
Pulse duration 2 [µS/cm or mS/cm]
[sec]
Controller
structure 2
Controller type 2
V6
Version
Alarm tolerance
(indication of soft- [µS/cm or mS/cm]
ware version)
Pull-in delay
relay 1
[sec]
Drop-out delay
relay 1
[sec]
Max. pulse
frequency 1
[1/h]
Pulse period 1
[sec]
Changeover
Changeover
0 = break cont. 1 0 = min contact 1
1 = make cont. 1 1 = max contact 1
Working point
[%]
Alarm changeover
0 = steady contact
1 = pulse contact
Pull-in delay
relay 2
[sec]
Drop-out delay
relay 2 [
sec]
Max. pulse
frequency 2
[1/h]
Pulse period 2
[sec]
Changeover
Changeover
0 = break cont. 2 0 = min contact 2
1 = make cont. 2 1 = max contact 2
Actuator stroke
time
[sec]
Probe break
monitor
0 = off / 1 = on
see Section 11
V7
Indicate fault
codes
see Section 9
Alarm delay
[sec]
V8
Interface
Instrument
addresses
V9
Inhibit/de-inhibit
HOLD
0 = off
1 = on
see Section 11
see Section 4
Observe notes in Section 8
see Section 6
under development
Factory settings
(default)
see Section 11
Input filter
constant
[sec]
see Section 11