1
INFO—1
GUIDELINES FOR FIELD-MEASURED
WATER-QUALITY PROPERTIES
6.0
By Franceska D. Wilde
Page
6.0 Guidelines for field-measured water-quality properties.............................................. INFO-3
6.0.1 Quality assurance .............................................................................................................. 3
6.0.1.A Records ................................................................................................................ 4
6.0.1.B Criteria for performing field measurements ..................................................... 6
6.0.2 Surface water ..................................................................................................................... 9
6.0.2.A Summary of surface-water sampling methods................................................... 9
Equal-discharge increments (EDI).................................................................... 10
Equal-width increments (EWI) .......................................................................... 12
6.0.2.B In situ field-measurement procedures................................................................... 15
6.0.2.C Subsample field-measurement procedures ....................................................... 16
6.0.3 Ground water................................................................................................................... 17
6.0.3.A Summary of well-purging protocols......................................................................19
6.0.3.B Direct field-measurement procedures. ..................................................................24
Inline-flow (flowthrough cell/chamber) procedure .......................................... 24
Downhole (in situ) procedure ............................................................................ 24
6.0.3.C Subsample field-measurement procedures ...........................................................26
6.0.4 Selected references................................................................................................................28
6.0.5 Acknowledgments............................................................................................................ 29 Chapter A6, Field Measurements
Info, Version 2.0 (10/2008)
2—INFO
Illustrations
6.0–1. Flow chart showing in situ field-measurement procedures for surface water...........15
6.0–2. Flow chart showing subsample field-measurement procedures for conductivity, pH, and alkalinity of surface water .......................................................16
6.0–3. Sketch of a manifold and flowthrough cell/chamber used during well
purging and sample collection...................................................................................... 20
6.0–4. Example of a field form for recording measurements during well purging .............. 23
6.0–5. Flow chart showing field-measurement procedures for ground water using
downhole and flowthrough cell/chamber systems.......................................................25
6.0–6. Flow chart showing subsample field-measurement procedures for conductivity,
pH, and alkalinity of ground water.............................................................................. 27
Tables
6.0–1. Stabilization criteria for recording direct field measurements.................................... 5
6.0–2. Example of field notes for a discharge-weighted conductivity measurement ............12
6.0–3. Example of field notes for an area-weighted conductivity measurement .................. 14
The citation for this section (6.0) of NFM 6 is as follows:
Wilde, F.D., 2008, Guidelines for field-measured water-quality properties (ver. 2.0): U.S. Geological
Survey Techniques of Water-Resources Investigations, book 9, chap. A6, section 6.0, October,
available only online from http://pubs.water.usgs.gov/twri9A/
Info, Version 2.0 (10/2008)
U.S. Geological Survey TWRI Book 9
INFO—3
GUIDELINES FOR FIELD-MEASURED 6.0
WATER-QUALITY PROPERTIES
By Franceska D. Wilde
This section summarizes general information, guidelines, and standard procedures that apply to the
direct determination of water properties that are measured onsite. Procedures at sites where waterquality data are being transmitted continuously are beyond the scope of this chapter.1
FIELD MEASUREMENTS2 : Determinations of physical or
chemical properties that must be measured onsite, as close
as possible in time and space to the medium being sampled.
Onsite measurement is necessary to preserve sample integrity and ensure data accuracy for the
following field measurements: water temperature, dissolved-oxygen (DO) concentration, specific
electrical conductance (SC), pH, reduction-oxidation potential (redox/ORP), alkalinity and acidneutralizing capacity (ANC)3, and turbidity.4 In addition, guidance is provided in section 6.8 for the
use of multiparameter instruments—instruments for which the individual field-measurement sensors
are bundled in a sonde and deployed to the water body for in situ measurements.
QUALITY ASSURANCE 6.0.1
Adherence to standard U.S. Geological Survey (USGS) quality-assurance protocols is
mandatory, and quality-control procedures are to be incorporated into every USGS waterquality data-collection effort. Quality assurance of the data collected includes the timely and
accurate documentation of field information in electronic and paper records, second- or third-party
auditing of such records, consistent and conscientious use of procedures and protocols to ensure
sample integrity and data quality, and training in measurement techniques and the collection of
quality-control data. Quality-control data for field measurements includes records of replicate
measurements.
USGS guidelines for continuous monitoring of selected field measurements are described in Wagner and others (2006).
The term field measurements, as used in this National Field Manual, is synonymous with field properties and field
parameters, terms that are used commonly in environmental water-quality literature.
3
Alkalinity/ANC is a field analysis, not a direct field measurement; however, the analysis is performed routinely during the
same field trip in which the other field-measurement data are collected. In this section, the term alkalinity is used when
referring either to alkalinity or acid-neutralizing capacity.
4 Each of these field measurements is discussed in detail in the following sections of this chapter of the National Field
Manual: temperature (section 6.1), dissolved oxygen (section 6.2), specific electrical conductance (section 6.3), pH (section
6.4), reduction-oxidation potential (section 6.5), alkalinity and acid neutralizing capacity (section 6.6), and turbidity (section
6.7).
1
2
Chapter A6, Field Measurements
Info, Version 2.0 (10/2008)
4—INFO
6.0.1.A Records
Record keeping is the responsibility of all field personnel. Electronic and paper records must be
established and maintained for each uniquely identified sampling location to permanently document
field activities, measurement readings, instrument calibration, and any other information needed to
meet programmatic or regulatory requirements (see NFM 4.1.1 and 4.2.1 for detailed information that
relates to records for surface water and ground water, respectively).
For every field visit, instrument performance and the field-measurement data are transcribed
onto paper and (or) electronic field and laboratory-request forms by the data collector. Much of
the documentation process should be completed at the field site. Records should be checked
independently by a field partner and (or) data administrator. Additional field forms—such as
chain-of-custody or land-use forms—may be required, depending on project needs.
— USGS personnel are encouraged to use the Personal Computer Field Form (PCFF)
instead of the paper field-notes form to increase efficiency and decrease transcription
errors.
— A separate log book must be maintained for each field instrument and into which are
recorded instrument repair, maintenance, and calibration history. The log book travels with
the instrument. The pages of the instrument log books should be pre-numbered
consecutively. Do not skip or tear out pages. Water-resistant paper is recommended. Log
books are available to USGS personnel through the One-Stop Shop (item Q609FLD).
— Use a blue or black indelible ballpoint pen to write on paper forms and in log books. If
recording in a Rite in the Rain® log book or on other water-resistant surface, an all-weather
or bullet pen is recommended. Use of a pencil is not acceptable; felt-tipped pens (for
example, Sharpie®) should not be used, and could compromise the quality of data for
samples for analysis of volatile organic compounds.
— Fill out the forms as completely as possible. Erroneous or mistaken entries should be
crossed out with one line and initialed.
Final or “reported” field-measurement values for USGS studies are to be entered into the
following parts of the National Water Information System (NWIS) (see NFM 4 for more detailed
information).
— QWDATA: Contains discrete (noncontinuous) field-measurement data in addition to
laboratory analyses.
— GWSI: Contains all final noncontinuous, nonautomated ground-water water-level
measurements.
— ADAPS: Contains automated, continuous water data.
The conventions used for reporting field-measurement data are described at the end of each
field-measurement section of chapter 6. Stabilization criteria for recording direct field
measurements are given in table 6.0–1.
Info, Version 2.0 (10/2008)
U.S. Geological Survey TWRI Book 9
INFO—5
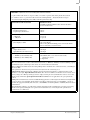
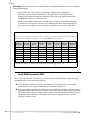
Table 6.0–1. Stabilization criteria for recording direct field measurements
[±, plus or minus value shown; °C, degrees Celsius; , less than or equal to value shown; S/cm, microsiemens
per centimeter at 25°C; >, greater than value shown; unit, standard pH unit; ~, about; DO, dissolved-oxygen
concentration; mg/L, milligram per liter; FNU, formazin nephelometric unit]
Standard direct field measurement1
Stablization criteria2
(variability should be within the value shown for about five
or more measurements)
Temperature:
Thermistor thermometer
Liquid-in-glass thermometer
± 0.2°C
± 0.5°C
Conductivity (SC):
100 S/cm
> 100 S/cm
± 5 percent
± 3 percent
pH:
(meter displays to 0.01)
DO4
Amperometric sensors
Optical/luminescent-method sensors
± 0.1 to 0.2 pH unit3
Allow ± 0.3 pH units if drifting persists or if measurement is
in low-conductivity (~75 µS/cm) water.
± 0.2 mg/L
± 0.2 mg/L
Turbidity5, 6
100 FNU (or other turbidity unit)
> 100 FNU (or other turbidity unit)
± 0.5 turbidity unit or ± 5% of the measured value,
whichever is greater.
± 10 percent6
1 Eh
is not considered to be a routine or direct field measurement (see NFM 6.5). Alkalinity and acid neutralizing capacity
determinations require a titration procedure and are not considered direct measurements.
2 Refer to NFM 6.8 for similar criteria when using multiparameter instruments. For continuous monitors, consult Wagner
and others, 2006.
3 Select pH sensor criteria based on precision and accuracy listed for the sensor being used.
4 Amperometric sensors: Note that the calibration criterion when DO is measured by a continuous monitor can be
extended to ± 0.3 mg/L. Optical/Luminescent sensors: The criterion for luminescent-method sensors is biased conser
vatively, owing to the differing technologies that are employed among the various manufacturers of these sensors and
current paucity of field data. Spectrophotometric method: Stabilization is not applicable to the spectrophotometric
method.
5
Multiparameter instruments used for most USGS turbidity applications contain single-beam infrared wavelength turbid
ity sensors and are reported in FNU. Check the Excel spreadsheet at http://water.usgs.gov/owq/turbidity_codes.xls to
determine the appropriate turbidity unit of measure; consult NFM 6.7 for detailed guidance on turbidity measurement and
instrumentation.
6 In high-turbidity conditions, especially when collecting data during storms, lengthening the averaging period to help
smooth out the signal (assuming this is an option for the instrument in use) or increasing the time period between
measurements, is recommended.
Chapter A6, Field Measurements
Info, Version 2.0 (10/2008)
6—INFO
6.0.1.B
Criteria for Performing Field Measurements
Field measurements should represent, as closely as possible, the ambient physical and chemical
properties of the surface-water or ground-water system at the time of sampling. Properties such as
temperature, DO concentration, and Eh must be measured directly (in situ) in the water body.
Other properties such as pH, conductivity, and turbidity may be measured either in situ or from a
sample withdrawn from the source, depending on the type of equipment selected for field
measurements. Alkalinity determination requires titration on a measured volume of subsample. These
properties are to be measured at the field site.
Expertise. Collecting data for USGS studies requires training, practice, and a knowledge of required
and recommended protocols.
Training: Field personnel are to enroll in USGS water-quality classes. Fundamental training for
performing water-quality field activities in accordance with USGS protocols and standard
procedures includes a 2-week Field Water-Quality Methods class (QW1028). Other
foundational training includes Water-Quality Principles (QW1022), Statistical Methods for
Environmental Data Analysis (QW1075), Quality-Control Sample Design and Interpretation
(QW2034), and Water-Quality Toolbox for NWIS Users (QW1297). These classes provide a
practicum for the knowledgeable execution of field and office project activities and help to
ensure proper management and valid interpretation of the data being collected.
National Field Quality Assurance Program (NFQA): All field personnel, including nonUSGS employees, who collect field-measurement data that are entered into NWIS are to
participate annually in the NFQA Program (http://nfqa.cr.usgs.gov/NFQA-overview.html,
accessed 8/22/08), which evaluates the proficiency of personnel in measuring pH, SC, and
alkalinity (or ANC).
Equipment. A variety of single-parameter and multiparameter field-measurement instruments are
available that use various technologies to measure the same water property and that require differing
calibration, maintenance, and measurement methods.
Single-parameter instruments include, for example, stand-alone temperature sensors; DO, SC,
and pH meters (with or without temperature sensors); and turbidimeters (for example,
nephelometers). The protocols and procedures that pertain to these instruments are a primary
focus of NFM 6.1 through NFM 6.5. Single-parameter instruments are selected according to
project needs and convenience, or when required because site conditions do not allow use of a
multiparameter instrument, or for the purpose of instrumenting a flowthrough cell or chamber.
Multiparameter instruments have measurement sensors that fit into the body of a sonde.
Measurements using the sonde can be made either by submersing the sensor sonde in surface
water or ground water, or by pumping a sample inline from its source to an airtight cell/chamber
into which the sonde fits.
Info, Version 2.0 (10/2008)
U.S. Geological Survey TWRI Book 9
INFO—7
Field teams must determine if the instruments and methods to be used will produce data of the
type and quality required to fulfill study needs as well as USGS requirements.
— Check the appropriate section in this chapter for the required and recommended methods and
equipment, instructions for measurement and quality-control procedures, and guidelines for
troubleshooting and data reporting.
— Become familiar with the instructions and precautions provided by the manufacturers of the
instruments to be used. Field personnel are encouraged to contact instrument manufacturers
for answers to technical questions about the operation of their instrument. Apparent conflicts
between USGS protocols and a manufacturer’s instructions should be identified and resolved
by consulting the local or regional water-quality specialist or the USGS Office of Water
Quality. Field instruments constantly are being improved or replaced using newer
technology that often is unique in some aspect to the manufacture of the instrument.
Personnel should be knowledgeable about emerging technologies that can improve the
quality and efficiency of their field activities.
— Make field measurements only with properly calibrated instruments. Calibration is
required at the field site for many, but not all, instruments. This requirement depends on the
technology employed by the instrument; consult the manufacturer’s instructions.
— Review the instrument log book(s) before leaving for the field site to ensure that problems
previously encountered have been resolved and that the appropriate instrument and site
maintenance were performed.
— Backup instruments and batteries should be readily available and in good working condition.
Test meters and sensors before leaving for the field.
If the instrument or measurement is new to you,
practice your measurement technique with a mentor
who has current experience and is up-to-date with
USGS field-method protocol and procedures.
Performance. Be aware of sampling and field or other conditions that could introduce bias to the
determination of field-measurement values. Execute field measurements in a manner that avoids or
minimizes bias from data-collection activities.
Check instrument precision and accuracy (variability and bias) periodically while at a field site;
precision and accuracy may vary, depending on the instrument used, sampling conditions, and
the expertise of personnel.
The USGS standard procedure is to allow sensors that are calibrated in the field to equilibrate to
the temperature of the water being monitored to the extent possible before making field
measurements, as is appropriate for the instrument in use. Calibration buffers and standards also
should be brought to ambient sample temperature before the instrument sensor(s) are fieldcalibrated.
Chapter A6, Field Measurements
Info, Version 2.0 (10/2008)
8—INFO
Sensors have equilibrated adequately when instrument readings have stabilized; that is, when
the variability among measurements does not exceed an established criterion. The USGS
criteria for stabilized field readings are defined operationally in table 6.0–1 for a set of
about five (or more) sequential measurements.
The natural variability inherent in surface water or ground water at the time of sampling
generally falls within the stability criteria given in table 6.0–1 and reflects the accuracy that
should be attainable with a properly calibrated instrument.
— Surface water: Allow at least 60 seconds (or follow the manufacturer’s guidelines) for
sensors to equilibrate with sample water. Take instrument readings until the stabilization
criteria in table 6.0–1 are met. Record the median of the final three or more readings as the
value to be reported for that measurement point (section 6.0.2).
— Ground water: Start recording measurements after sensors have equilibrated with purge
water. Take instrument readings until the stabilization criteria in table 6.0–1 are met and the
required number of well volumes of ground water have been purged. Record the median of
the final five or more readings as the value to be reported for that site (section 6.0.3).
For sites at which variability exceeds the criteria shown in table 6.0–1: Allow the instrument
a longer equilibration time and record more measurements. To determine the value to be
reported for that measurement point, either use the median of the final five or more
measurements recorded, or apply knowledge of the site and professional judgment to select the
most representative of the final readings.
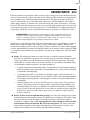
RULE OF THUMB:
For field analyses that are made on subsamples, such as alkalinity, check your precision in the
field at least every tenth sample by making the measurement three times using separate
sample aliquots from the same sample volume.
Info, Version 2.0 (10/2008)
U.S. Geological Survey TWRI Book 9
INFO—9
SURFACE WATER 6.0.2
Field measurements must accurately represent the physical or chemical properties of the surface
water being studied. In order to collect data that represent water conditions at the time of sampling,
it is necessary to correctly locate the point(s) of measurement, select equipment appropriate to site
conditions and study needs, and use appropriate methods to make accurate field measurements.
Properties of water temperature, DO concentration, and Eh must be measured directly within the
water body (in situ). Other properties, such as pH, conductivity, and turbidity, often are measured in
situ but may be measured in a subsample of a composite or grab sample, as appropriate for the study.
Summary of Surface-Water Sampling Methods 6.0.2.A
Standard USGS procedures for locating points of sample collection and sample-collection methods
for surface-water sampling are detailed in NFM 4.1. This section (6.0.2.A) provides an abbreviated
description of surface-water isokinetic sampling methods, and should not be used without a
detailed understanding of the method as given in NFM 4.1.3. The quality and interpretation of the
field-measurement data collected depend also on the equipment with which samples are withdrawn,
composited, and subsampled. Guidance for equipment selection is detailed in NFM 2.1.1.
Familiarity with the USGS protocols and standard procedures prescribed in these chapters of
the National Field Manual is the responsibility of all USGS water-quality field personnel.
Normally, the point or points at which field measurements are made correspond to the location(s) at
which samples are collected for laboratory analysis (NFM 4.1.3). The decision for whether grabsampling methods or isokinetic sampling methods will be used is based on the characteristics of the
water body to be sampled or monitored and on study objectives.
Still-water conditions are found in storage pools, lakes, and reservoirs. Field measurements
often are made in situ at multiple locations and depths. The location, number, and distribution
of measurement points are selected according to study objectives.
— Measurements made at discrete depths through the vertical water column must not be
averaged or reported as a median value that represents the entire vertical.
— Report the value selected to represent each point measured in the vertical as individual
stations, or distinguish measurements in that vertical by assigning a unique time to each
measurement.
Flowing-water conditions are found in perennial and ephemeral streams. The location and the
number of field measurements depend on stream conditions and study objectives (NFM 4.1).
Generally, a single set of field-measurement data is used to represent an entire stream cross
section at a sampling site and can be useful when calculating chemical loads.
— To obtain data representative of the section, the variability of discharge and field
measurements across the stream must be known.
• An exploratory field-measurement profile across a section of a stream can be used
to estimate the magnitude of variation along the cross section.
• A field-measurement profile can be useful also—especially at new or poorly docu
mented sites—to determine which isokinetic method (equal-discharge increment
(EDI) or equal-width increment (EWI)) should be used for sampling.
Chapter A6, Field Measurements
Info, Version 2.0 (10/2008)
10—INFO
— The final points of measurement are determined according to whether the EDI or EWI
method will be used. Make individual measurements at a number of equally spaced verticals
along the cross section and at multiple depths within each vertical. Alternatively, consult
previous records for the site.
To locate measurement points:
1. Check the cross-sectional profile data of the stream site to determine the variability of discharge
per unit width of the stream and of field-measurement values across the section.
• Make individual measurements at a number of equally spaced verticals along the cross sec
tion and at multiple depths within each vertical—or consult previous records for the site.
• Make in situ (6.0.2.B) field measurements for the profile.
• Field-measurement profiles of stream variability are needed for low- and high-flow condi
tions and should be verified at least every 2 years or as study objectives dictate.
2. Select the EDI or EWI method to locate points of measurement (refer to NFM 4.1.3 to select and
execute the appropriate method).
• If stream depth and velocities along the cross section are relatively uniform, use EWI.
• If stream depth and velocities along the cross section are highly variable, use EDI.
• In a small (usually less than 5 feet (ft) in width) and well-mixed stream, a single point at
the centroid of flow may be used to represent the cross section. (The stream is considered
well mixed if the variability of field-measurement values noted in the cross-sectional pro
file is considered negligible; for example, within the stabilization criteria given on table
6.0–1 plus best professional judgment of what is reasonable for the field site.) The centroid
of flow is defined as the point in the increment at which discharge in that increment is
equal on both sides of the point.
Equal-Discharge Increments (EDI)
The stream cross section is divided into increments of equal discharge. Field measurements can be
made in situ at the centroid of each increment or by collecting an isokinetic depth-integrated sample
at the centroid of each increment and determining the value either of each sample or of a composite
of the samples. These methods result in data that are discharge weighted (Edwards and Glysson,
1999).
Knowledge of streamflow distribution in the cross section is required to select verticals at which
measurements will be made or subsamples collected.
Streamflow distribution can be based on the long-term discharge record for the site or on a
discharge measurement made just prior to sample collection.
RULE OF THUMB:
Divide the stream into a minimum of four increments. More increments could be needed for a
stream site that is poorly mixed.
Info, Version 2.0 (10/2008)
U.S. Geological Survey TWRI Book 9
INFO—11
To divide the cross section into increments of equal discharge:
The following comprises a summary of some steps needed in applying the equal-discharge
increment method, and should not be used without an understanding of the method and the
detailed instructions as given in NFM 4.1.3.
1. Visually inspect the stream from bank to bank, observing velocity, width, depth distribution, and
the apparent distribution of sediment and aquatic biota in the cross section. Note the location of
stagnant water, eddies, backwater, reverse flows, areas of faster than normal flow, and piers or
other obstructions.
2. If the channel and the control governing the stage are stable, historical streamflow data can be
used to determine the measurement locations. If the channel is unstable or if no historical data
are available, make a discharge measurement and preliminary field measurements across the
selected section of channel.
a. From the available discharge data, either:
• Construct a graph using cumulative discharge or cumulative percent of total discharge
plotted against the cross-sectional width, or
• Determine EDI sections directly from the discharge-measurements note sheet.
b. If profile values of pH, conductivity, temperature, and DO differ by less than 5 percent and show that the stream is well mixed both across the section and from top to bottom, a single measurement point at the centroid of flow can be used to represent field-
measurement values of the cross section.
3. From the graph or measurement notes, determine the number and locations of EDIs and the
centroids (the far midpoints) of those increments.
EXAMPLE: If five increments will be used, select points of measurement by dividing the total
stream discharge by 5 to determine increment discharge: in this case, each EDI equals 20 percent of
discharge. The first vertical is located at the centroid of the initial EDI, the point where cumulative
discharge equals 10 percent of the total discharge. The remaining 4 centroids are found by adding
increment discharge to the discharge at the initial EDI centroid. The far midpoints also need to be
calculated. The EDI centroids will correspond to points along the stream cross section where 10, 30,
50, 70, and 90 percent of the total discharge occur.
When making field measurements:
1. Select either the in situ or subsample method and follow the instructions in 6.0.2.B or 6.0.2.C.
• In situ method—Go to the centroid of the first equal-discharge increment. Using sub
mersible sensors, measure at mid-depth (or multiple depths) within the vertical. Repeat at each vertical. The value recorded at each vertical represents the median of values observed
within approximately 60 seconds after sensor(s) have equilibrated with stream water.
• Subsample method—Collect an isokinetic depth-integrated sample at the centroid of each equal-discharge increment, emptying the increment sample into a compositing device. Measure field parameters either in the sample collected at each increment or in a
subsample taken from the composite of all the increment samples. 2. The final field-measurement value is the mean of the in situ or individual increment-sample value
for all the EDI verticals in the section (the composite subsample yields a single value). (Note: for
pH, use the median value or compute a mean pH using the method described in section 6.4.3.A).
Enter data on field forms.
Chapter A6, Field Measurements
Info, Version 2.0 (10/2008)
12—INFO
EXAMPLE: Table 6.0–2 provides an example of how mean conductivity measured in situ is calculated
using the EDI method.
• In the example, the correct value for the discharge-weighted mean conductivity is
163 S/cm, calculated from 815 divided by 5 (the sum of the recorded median values
divided by the number of median measurements). This mean value should be entered into
the QWDATA database as a calculated value.
• Note that at the midpoint of the center centroid of flow (increment 3) the median conductiv
ity would have been reported as 155 S/cm; if conductivity had been measured near the left
edge of the water (increment 1), the conductivity would have been reported as 185 S/cm.
Table 6.0–2. Example of field notes for a discharge-weighted conductivity measurement
[ft/sec, feet per second; ft, feet; ft2 square feet; ft3/sec, cubic feet per second; S/cm, microsiemens per centimeter at
25 degrees Celsius; LEW, left edge of water; —, not available; REW, right edge of water]
Equal
discharge
increment
Percent
of flow in
increment
Mean
velocity,
in ft/sec
Width of
increment,
in ft
Depth of
increment,
in ft
Area of
increment,
in ft 2
Increment
discharge,
in ft3/sec
Median
conductivity,
in µS/cm
LEW
0
—
—
—
—
—
—
1
20
2.0
22
5.7
125
250
185
2
20
2.2
11
10.4
114
250
170
3
20
2.3
9
12.0
109
250
155
4
20
3.9
5
12.8
64
250
155
5
20
3.4
10
7.4
74
250
150
REW
0
—
—
—
—
—
—
Calculation of conductivity: mean of median conductivity measurements 815
-------- 163 S c m
5 =
Equal-Width Increments (EWI)
The stream cross section is divided into increments of equal width. Knowledge of the streamflow
distribution in the cross section is not required.
In situ field measurements are made at the midpoints of each increment. Area-weighted concentrations can be computed from these measurements (table 6.0–3).
Subsample field measurements are made in discrete samples that usually are withdrawn from a
composite sample collected using an isokinetic sample and isokinetic depth-integrating method.
The volume of the isokinetic sample must be proportional to the amount of discharge in each
increment and measurements in subsamples taken from the compositing device result in
discharge-weighted values.
Info, Version 2.0 (10/2008)
U.S. Geological Survey TWRI Book 9
INFO—13
To divide the cross section into increments of equal width:
The following comprises a summary of some steps needed in applying the EWI method, and
should not be used without an understanding of the method and the detailed instructions given
in NFM 4.1.3.
1. Visually inspect the stream from bank to bank, observing velocity, width, depth distribution, and
the apparent distribution of sedment and aquatic biota in the cross section. Note the location of
stagnant water, eddies, backwater, areas of faster than normal flow, and piers or other
obstructions.
2. Determine stream width using a tagline or from station markings on bridge railings or cableways.
3. Divide the section into increments of equal width based on flow and stream-channel
characteristics along the cross section, field-measurement variability from the cross-section
profile, and data objectives for the study. This interval width will govern the number of verticals
used, and applies also to streams in which flow is divided (for instance, in a braided channel).
4. Locate the midpoint of the first vertical at a distance of one-half of the selected increment width
from the edge of the water. Locate other measurement verticals at the centers of the remaining
increments.
EXAMPLE: In a stream 60 ft wide that has been divided into 15 increments of 4 ft each, the first
measurement vertical would be 2 ft from the water’s edge, and subsequent verticals would be at 6, 10,
14 ft, and so forth, from the starting point at water’s edge.
RULE OF THUMB:
• In streams 5 ft wide or greater, a minimum of 10 equal-width increments generally is recommended.
• In streams less than 5 ft wide, use as many increments as practical, but they must be equally spaced and a minimum of 3 inches (in.) apart.
When making field measurements:
1. Select either the in situ or the subsample method and follow the instructions in 6.0.2.B or 6.0.2.C,
respectively.
• In situ method—Measure at the midpoint of each equal-width increment. Using submers
ible sensors, measure at mid-depth within the vertical.
• Subsample method—Collect an isokinetic depth-integrated sample at the midpoint of each equal-width increment, emptying each sample into a compositing device. Use of the correct sampling equipment is critical to execute this method successfully; standard
samplers cannot meet isokinetic requirements when stream velocity is less than 1.5 feet/second (NFM 2.1.1.A).
2. Record a value for each field measurement at each vertical. The value recorded represents the
stabilized values observed within approximately 60 seconds after the sensor(s) have equilibrated
with the stream or subsample water.
Chapter A6, Field Measurements
Info, Version 2.0 (10/2008)
14—INFO
EXAMPLE: Table 6.0–3 provides an example of an area-weighted median measurement for
conductivity measured in situ.
• In the example, the area-weighted median conductivity equals 130 S/cm.
• To calculate an area-weighted median, multiply the area of each increment by its corre
sponding field measurement, sum the products of all the increments, and divide by total
cross-sectional area.
• Note that if the conductivity reported were selected at mid-depth of the vertical of centroid
of flow (section 10), it would have been reported as 125 S/cm; if the conductivity
reported were near the left edge of the water, it would have been reported as 150 S/cm.
The final field-measurement value normally is calculated as the mean of the values recorded at
all EWI increments, resulting in an area-weighted mean. (Note: for pH, take the median value
or, to calculate a mean pH, be sure to use only the method described in section 6.4.3.A).
Alternatively for EWI, if the area-weighted median best represents integrated stream chemistry,
then the median can be reported instead of the mean, but be sure to document this on the field
form and in the final data report if a parameter code is not available in NWIS for median values.
Table 6.0–3. Example of field notes for an area-weighted conductivity measurement
[ft, feet; LEW, left edge of water; ft2, square feet; SC, conductivity (specific electrical conductance); S/cm, microsiemens per
centimeter at 25 degrees Celsius;—, not available; REW, right edge of water]
Section
number
Cumulative
percent of flow
in section
Vertical
location, in ft
from LEW
Width of
section, in ft
LEW
1
2
3
4
5
6
7
8
9
10
11
12
13
14
15
REW
0
2
4
6
10
16
22
28
34
42
50
62
76
88
96
99
100
0
2
6
10
14
18
22
26
30
34
38
42
46
50
54
58
60
—
4
4
4
4
4
4
4
4
4
4
4
4
4
4
4
—
Depth of
Area of
vertical, in ft section, in ft2
—
1.0
2.0
2.6
3.2
3.5
4.0
4.5
5.4
6.0
5.7
5.1
4.6
3.5
1.4
1.0
—
—
4.0
8.0
10.4
12.8
14.0
16.0
18.0
21.6
24.0
22.8
20.4
18.4
14.0
5.6
4.0
—
Median SC,
µS/cm
—
150
145
145
140
135
130
130
125
125
125
125
125
125
135
140
—
Product of
median SC
and area
—
600
1,160
1,508
1,792
1,890
2,080
2,340
2,700
3,000
2,850
2,550
2,300
1,750
756
560
—
27
----------836
------- = 130 S cm
Calculation of SC: sum of values in last column divided by the total cross-sectional area
214
Info, Version 2.0 (10/2008)
U.S. Geological Survey TWRI Book 9
INFO—15
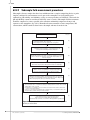
In situ field-measurement procedures
6.0.2.B
An in situ measurement (fig. 6.0–1), made by immersing a mutiparameter sonde or one or more
single-parameter field-measurement sensors directly into the water body, is used to determine a
profile of variability across a stream section. In situ measurement can be repeated if stream discharge
is highly variable and if measurement points need to be located at increments of equal discharge. Note
that in situ measurements are point samples and thus are not depth integrated.
In situ measurement is mandatory for determining temperature, DO concentration, and Eh.
In situ measurement also can be used for pH, conductivity, and turbidity. The alkalinity
determination can only be performed on a stirred subsample contained in a vessel.
If field measurements for pH, DO, and Eh are to be determined in anoxic water, the measurements must be made in situ.
Test, calibrate, and check field instruments.
Allow sensors to equilibrate with ambient water.
Select sampling method.
Still water
1. Select one or more vertical section(s).
2. Lower sensors to the depth
appropriate to meet study needs.
3. Monitor field-measurement readings.
Flowing water
EWI:
Divide cross section
into minimum of 10
equal-width incre
ments. At each
increment,
1. Locate the mid
point.
2. Lower sensors to
middepth of the
vertical.
3. Monitor fieldmeasurement
readings.
EDI:
Divide cross section
into minimum of 4
equal-discharge incre
ments (unless condi
tions are appropriate
for 1 equal-discharge
vertical at centroid of
flow). At each incre
ment,
1. Locate the centroid.
2. Lower sensors to
middepth of the
vertical.
3. Monitor field-mea
surement readings.
Report stabilized value of the median of the last 5 or more values and
the time of measurement.
Still water: Report median of values measured after readings stabilize.
Equal-discharge increment method (EDI):
1. Record median measurement at each vertical.
2. Report mean value of the medians of verticals to get a discharge-weighted value.
Equal-width increment method (EWI):
1. Record median measurement at each vertical.
2. Report mean (or median) value, if appropriate, of the medians of verticals (can be used
in area-weighted calculations).
Figure 6.0–1. In situ field-measurement procedures for surface water.
Chapter A6, Field Measurements
Info, Version 2.0 (10/2008)
16—INFO
6.0.2.C Subsample field-measurement procedures
Subsamples (discrete samples that have been withdrawn from a sample-compositing device or point
sampler) contained in a measurement vessel open to the atmosphere can yield good data for
conductivity, pH, turbidity, and alkalinity, as long as correct procedures are followed. (The results for
pH and alkalinity cannot be considered valid if the water is anoxic.) Subsample field measurements
should be completed as soon as possible after collection, minimizing temperature changes and
exposure to the atmosphere (fig. 6.0–2). Remember that measurements of water temperature, DO
concentration, and Eh cannot be taken from a subsample and must be made in situ.
-Ìi«Ê£®
/iÃÌÊ>`ÊV>LÀ>ÌiÊÃÌÀÕiÌÊÃÞÃÌið
-iiVÌÊÃ>«}ÊiÌ
`Ê>`Ê`iÌiÀiÊÃ>«}ÊV>Ìð
UÊÊ
«ÃÌiÊÃ>«iÃ\ÊÊÌÊÃÌi«Êΰ
UÊÊ V«ÃÌiÊÀÊ`ÃVÀiÌiÊÃ>«iÃ\ÊÊÌÊÃÌi«Ê{°
(2)
i`ÊÀÃiÊ«ÀiVi>i`ÊÃ>«}Ê>`ÊV«ÃÌ}ÊÀÊëÌÌ}
iµÕ«iÌ°Ê
iVÌÊÃ>«iÊÊÊV«ÃÌ}Ê`iÛVi]Ê
ÕÃ}ÊVi>Ê
>`ÃÉ`ÀÌÞÊ
>`ÃÊÌiV
µÕi°
(3)
7Ì
`À>ÜÊÜ
iÜ>ÌiÀÊÃÕLÃ>«iÊÀÊvÌiÀÊÌ
iÊÃ>«iÊvÊiViÃÃ>ÀÞ®°
,ÃiÊViVÌÊÛiÃÃiîÊÌ
ÀiiÊÌiÃÊÜÌ
ÊÃ>«iÊvÌÀ>ÌiÊvÀ
filtered samples).
(4)
Rinse sensors, measurement vessels, and other apparatus three
times with sample. (Rinse with deionized water for alkalinity.)
(5)
Pour sample into measurement vessel, insert sensor(s):
UÊÊ7>ÌÊvÀÊÃiÃÀÃÊÌÊiµÕLÀ>ÌiÊÌÊÃ>«iÊÌi«iÀ>ÌÕÀi°
UÊÊ¿ÌÊiÌÊÃiÃÀÃÊÌÕV
ÊLÌÌÊÀÊÃ`iÃÊvÊÛiÃÃi°
(6)
Swirl or stir gently:
UÊÊâiÊÃÌÀi>}Ê«ÌiÌ>ÊÀÊÛÀÌiÝÆÊii«ÊÃiÃÀÊÕÌÊvÊÛÀÌiÝ°
UÊÊÀÊ«]Ê`ÊÌÊÃÌÀÊÃ>«iÃÊ
>Û}ÊV`ÕVÌÛÌÞÊiÃÃÊÌ
>Ê£ää μ-ÉV°
UÊÊ7
iÊÕÃ}Ê>}iÌVÊÃÌÀÀiÀ]ÊÕÃiÊÃ>iÃÌÊÃÌÀÊL>À°
,iVÀ`Êvi`Êi>ÃÕÀiiÌÊ>`Ê«ÀVi`ÕÀiÃÊÊvi`ÊvÀÃ\
UÊÊ,iVÀ`Êi`>ÊÛ>ÕiÊvÊÃÌ>Lâi`ÊÀi>`}ÃÊÀ>ÞÊÃÌ>LâiÃÊÌÊÌ>LiÊÈ°äq£ÊVÀÌiÀ>Ê
ÊÜÌ
ÊÈäÊÃiV`ÃÊÀÊiÃî°
UÊÊvÊÀi>`}ÃÊ`ÊÌÊÃÌ>Lâi]ÊVÀi>ÃiÊÕLiÀÊvÊi>ÃÕÀiiÌÃÊ>`ÊÀiVÀ`Ê>ÃÌÊvÛiÊ
ÊÊÊÊÊÀÊÀiÊÃiµÕiÌ>ÊÀi>`}ð
UÊÊvÊÌ
iÀiÊÃÊ>ÊVÃÌ>ÌÊÌÀi`ÊÌÜ>À`ÊÜiÀÊÀÊ
}
iÀÊÛ>ÕiÃ]ÊÀiVÀ`ÊÌ
iÊvÀÃÌÊÛ>Õi]ÊÌ
iÊÊ
À>}iÊvÊÛ>ÕiÃ]Ê>`ÊÌ
iÊÌiÊ«iÀ`ÊLÃiÀÛi`°
,i«i>ÌÊ«ÀViÃÃÊvÀÊÃÌi«ÊÈ®ÊÊÌÜÊÀÊÀiÊÃÕLÃ>«iÃÊvÀÊÌ
i
Ã>iÊÃ>«iÊÛÕiÊÌÊ`VÕiÌÊ«ÀiVð
Rinse sensors thoroughly with deionized water.
ÃV>À`ÊÃ>«iÊÌÊÜ>ÃÌi]ÊÊ>VVÀ`>ViÊÜÌ
Ê>««V>LiÊÀi}Õ>ÌðÊ
(7)
(8)
(9)
Figure 6.0–2. Subsample field-measurement procedures for conductivity, pH, and
alkalinity of surface water.
Info, Version 2.0 (10/2008)
U.S. Geological Survey TWRI Book 9
INFO—17
GROUND WATER 6.0.3
Field measurements in ground water must accurately represent the physical and chemical properties
of water in the formation (aquifer) at the time of data collection. This normally requires purging the
well of standing water while monitoring field measurements. The purge procedures applied can,
however, depend on the type of well from which sample water will be withdrawn (for example, a
public-supply, domestic, or monitor well), well-construction and aquifer characteristics, and study
objectives. The final field-measurement values to be recorded for the ground-water site for that date
are determined toward the end of the purging process. Consult NFM 4.2 for additional guidance on
well purging and USGS protocols and standard procedures for ground-water withdrawal at wells.
TECHNICAL NOTE: Well purging removes standing water from a well. Purging reduces chemical and
biochemical artifacts caused by well installation, inadequate well development, well-construction
materials, or infrequent pumping (ASTM International, 2005). Purging also serves to rinse and
condition sampling equipment with the ambient ground water to be sampled.
Ground water can be withdrawn from wells using submersible or above-ground pumps, or bailers or
similar discrete-volume samplers (for example, syringe or Kemmerer samplers). Well type and
construction, sampling objectives and target analytes, and site conditions can constrain the equipment
selected; which method of ground-water withdrawal will be used; and how it will be employed. NFM
2.1.2 provides detailed information on equipment for ground-water withdrawal at wells and sample
collection.
Pumps. The pumping mechanism can affect the degree to which certain measurements represent true ground-water properties. For example, pumps that introduce turbulence or heat to the water column can result in nonrepresentative DO and temperature values. The pump should produce a smooth, solid stream of water with no air or gas bubbles and without pump cavitation during field measurements and sample withdrawal. — A positive-displacement submersible pump is recommended for environmental sampling at
depths greater than 28 ft and generally is recommended for use at wells (unless the well has
a permanently installed pump).
— A peristaltic pump often is a good choice for obtaining samples collected from wells at a
depth of 28 ft or less, but the stream of water from this or other suction-lift pump should not
be used when measuring DO, Eh, or other properties sensitive to oxygen contamination or
volatilization.
— When the depth to water is greater than 250 ft and (or) a large volume of water must be
purged, a dual-pump system can be used: position a submersible pump downhole and a
centrifugal pump at the surface (see NFM 4.2 for additional information). An inflatable
packer system set above the pump can be used to reduce the volume and time required for
purging; this can be especially useful in deep wells or if regulations require that purge
water be contained.
Bailers. Bailers are not recommended for purging because they have limited use for routine field-measurement determinations and also are inefficient for well purging. The bailed sample must be decanted to obtain subsamples for field measurements, exposing the sample to atmospheric conditions. Thus, water subsampled from a bailer sample may not be used for measurements of DO concentration, Eh, and water temperature. The action of the bailer being deployed downhole can introduce atmospheric gases and particulates into the water column, also resulting in biased turbidity and other field measurements. Chapter A6, Field Measurements
Info, Version 2.0 (10/2008)
18—INFO
Ground water is sampled for field measurements in one of three ways: (1) by pumping formation
water inline to a flowthrough cell or chamber5 containing measurement sensors (inline-flow
procedure); (2) by deploying measurement sensors downhole (downhole or in situ procedure); or (3)
by subsampling water collected from a discrete-volume sampler (for example, bailer), and making
measurements using individual instruments (subsample procedure). Inline-flow and in situ procedures
comprise direct-measurement methods (section 6.0.3.B), in contrast to the subsample method (section
6.0.3.C). For most field applications, using inline-flow procedures (the flowthrough
cell/chamber system) is recommended and most efficient.
RECOMMENDED:
Use a positive-displacement submersible
pump for ground-water withdrawal.
Use inline-flow (flowthrough cell/chamber)
procedures for field measurements.
The measurement system selected can be constrained by the type of well being sampled and its
accessibility.
Supply wells6—Downhole access for a pump or sensors might be limited or not possible at
public or domestic supply wells, and water withdrawal may be located at or near the well head
or from a tap (for drinking-water studies). The flowthrough cell/chamber field-measurement
system (inline-flow procedure) should be used in this case.
— The standard purging protocol may not be appropriate. (Consult “Exceptions to the standard
purging procedure” in NFM 4.2.)
— Identify equipment permanently installed in or at the well (such as a pump) that can affect
the logistics and quality of the field measurement.
— The field-measurement system should be connected to the wellhead so as to bypass holding
tanks, backflow pressure tanks, flow meters, or chemical treatment systems.
Monitor wells—At wells that allow downhole access, it is necessary for the study to determine
the specific depth interval at which measurements will be made or from which water will be
withdrawn for field-measurement determinations. Again, selection of the sampling-depth
interval depends on how the well was constructed, in addition to the sampling design of the
study. Record the depth at which the pump intake is set within a given screened or open interval.
— The standard purging protocol usually is appropriate. (Consult NFM 4.2 before field work
begins; the summary given in section 6.0.3.A does not provide all the information needed to
ensure adequate performance.)
— Either direct-measurement or subsample procedures can be used at monitor wells, depending
on study needs and sampling objectives. If samples for laboratory analysis will be collected,
however, use of the flowthrough cell/chamber system (inline-flow procedure) is
recommended in order to avoid sample contamination from use of a downhole sensor system
or bailer.
5
The terms flowthrough cell and flowthough chamber are synonymous, although "cell" is more commonly used by
manufacturers of such equipment.
6 Supply wells designed for public-supply systems, domestic supply, or commercial or agricultural use.
Info, Version 2.0 (10/2008)
U.S. Geological Survey TWRI Book 9
INFO—19
Summary of Well-Purging Protocols
6.0.3.A
As a rule of thumb, the standard USGS purge protocol is to remove three or more well volumes
of standing water while monitoring water level and the stabilization of routine field
measurements as a function of time, pumping rate, and the volume of water being removed (see NFM
4.2.3). Routine field measurements include pH, temperature, SC, DO, and turbidity. Inherent in the
purge procedure is an assumption that stabilization of field properties indicates that the water being
discharged from the well represents ambient formation water. Field personnel should examine this
assumption for each well, using their knowledge of the well and aquifer hydraulics. Field experience,
understanding of the effects of hydrologic and geochemical conditions, and knowledge of datacollection and data-quality requirements are necessary to determine the most accurate field value.
Before purging begins:
1. Select and set up the field-measurement system that best fits the requirements for the data-collection
effort. Options include:
a. A clear, air-tight flowthrough chamber, holding the sensors of single-parameter instruments (generally temperature, pH, DO, SC; often turbidity; and sometimes Eh (ORP)). The flowthrough chamber is connected to tubing through which the sample is pumped directly from the well to the measurement chamber.
b. A clear, air-tight flowthrough cell/chamber fitted to the sensors-containing sonde of a multiparameter instrument, to which the sample is pumped directly from the well to the measurement chamber.
c. A multiparameter instrument without the flowthough cell on the sonde, deployed downhole in the well.
d. Selected single-parameter meters with sensors allowing for downhole submergence.
e. Single-parameter meters; the measurement is made with each sensor immersed in separate subsamples collected from a discrete-volume sampler.
Options (a) and (b) generally are preferred and constitute what is termed in this report as the “Inline
flow Procedure.” Options (c) and (d) constitute what is termed in this report as the “Downhole (in situ)
Procedure.” Option (e) is termed in this report as the “Subsample Procedure.”
2. Check the identification number on the well and well depth to verify that this is the well intended
for data collection or sampling. Review the well’s record of water levels, drawdown, and fieldmeasurement variability (if available), and prepare the necessary field forms (for example, the wellpurge record, national or study field form, and chain-of-custody record). Record the type of
equipment being used.
3. Lay plastic sheeting around the well to prevent contaminating the equipment. Unlock the well
housing or top of the protective casing and remove the well cap. Set up the field-measurement
system, paying attention to the sequence in which sensors are inserted into the flowthrough chamber
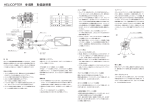
with respect to water flow (if a flowthrough chamber is used). Figure 6.0–3 illustrates a typical
sample-collection manifold, through which water is directed either to waste, to the flowthrough
(field-measurements) cell/chamber, or to the sample-collection chamber. To adjust the direction of
flow, a flow-regulating needle valve or ball valve should be kept either full on or full off and should
not be used to adjust either the proportion or rate of flow.
4. Review the purging history of the well, particularly the field-measurement data previously
recorded. This can save time and help determine the procedures and length of time over which the
well should be purged.
Chapter A6, Field Measurements
Info, Version 2.0 (10/2008)
20—INFO
From the portable pump tubing used for a monitor
well, or from the garden-hose-threaded connections
for a water-supply well
Extension
line
Extension
line
(optional)
Sample-collection
chamber
(2b)
(2)
Manifold
system
(1)
To waste-water
drainage
(2a)
To waste-water drainage
Flowthrough
cell/chamber
DO
pH
SC
T
Flowthrough cell/chamber: note
sensor placement and direction of flow.
EXPLANATION
RIGID-WALL TEFLON ™
TUBING
QUICK CONNECTION
FIELD SENSORS —
(flowthrough chamber):
FLOW-REGULATING
NEEDLE VALVE (PINCH
CLAMP) —Keep valve
either full on or full off;
do not use valve to
adjust the proportion or
rate of flow.
FLOW DIRECTION IN MANIFOLD AT
DIFFERENT STAGES:
pH
pH sensor
DO
Dissolved-oxygen
sensor
(1) During initial purge stage
T
Temperature sensor
(2) During intermediate
and final stages
SC
Specific electrical
conductance sensor
ANTIBACKSIPHON
THREE-WAY TEFLON ™
FLOW VALVE
(2a) While obtaining most field
measurements
(2b) To obtain turbidity samples
if sensor is not available for
the cell/chamber, and
at end of purge to route flow
to a chamber for collection.
Figure 6.0–3. Sketch of a manifold and flowthrough cell/chamber used during
well purging and sample collection (top view) (modified from NFM 4,
Figure. 4–10).
Info, Version 2.0 (10/2008)
U.S. Geological Survey TWRI Book 9
INFO—21
To purge a monitor well (assuming that the well will be pumped and that a flowthrough
cell/chamber system and water-level sensor will be used):
1. Measure and record the depth to static water level (fig. 6.0–4). Instructions for water-level
measurement are given in NFM 4, appendix A4–B.
2. Calculate and record the well volume using the information on fig. 6.0–4. Note that the depth to
the screened or open interval and the inside casing diameter must be known to calculate well
volume.
• Calculate the casing volume using the height of the water column to the bottom of the well (instead of the water column height to the top of the screen). • Include an estimate for the volume of water stored in the annular space between the casing and the borehole wall, using knowledge of the borehole diameter. 3. In monitor and other wells with downhole access, lower a submersible pump followed by a
water-level sensor to the desired location of the pump intake. The final pump intake position
always is located at the point of sample collection. Lower the equipment slowly and smoothly to
avoid stirring up particulate matter.
• Position the pump intake between 3 ft (~0.9 meter (m)) below the static water surface and a minimum distance above the top of the open/screened interval of 10 times the well diam
eter (for example, 20 in. for a 2-in. well diameter), if the sample is to be integrated over the entire screened or open area of the aquifer. The location of the intake depends on the study objective, well construction, and the type of equipment used. Unless the intended sampling interval can be isolated adequately, locating the intake at a point within a well screen or open borehole will result in extracting a sample that includes water from the entire screened or open interval (Varljen and others, 2006; Reilly and Gibs, 1993).
• The water-level sensor should be a maximum of 1 ft (~0.3 m) below the static water sur
face.
4. Start the pump. Gradually increase and (or) adjust the pumping rate to limit drawdown to between
0.5 and 1.0 ft (~0.15 to ~0.3 m, or as determined by field practice).
• If the final intake position is above the screened or open interval, the final pumping rate should be about 500 to 1,000 milliliters (mL) per minute. Do not exceed 1 ft of drawdown.
• If the pump and intake position are fixed, as in a supply well, control the rate of flow for field measurements through flow-splitting valve(s).
• Monitor the water level as purging progresses. Ideally, drawdown will be at a steady state, with the water level remaining above the top of the open or screened interval. 5. Purge a minimum of three well volumes or the purge volume dictated by study objectives (consult
NFM 4.2.3 for detailed guidance on exceptions to the standard three-well-volume purging
procedure).
• Monitor values for field properties sequentially and at regular time intervals throughout purging (fig. 6.0–4). The frequency of these measurements depends on the purging rate, which in turn is a function of well depth and diameter, and aquifer transmissivity.
• If required by Federal, State, or local regulations, contain purge water as directed.
Chapter A6, Field Measurements
Info, Version 2.0 (10/2008)
22—INFO
6. As the third or last well volume is purged, slowly adjust the purge rate to the pumping rate
to be used during sampling, if necessary; do not halt or suddenly change the pumping or flow
rate during the final phase of purging or while sampling.
• Record field measurements at regular time intervals, about 3 to 5 minutes apart.
• Check the last three to five or more measurement values for each field property against the
criteria for field-measurement stabilization (table 6.0–1).
• Determine final field-measurement values.
—
If the criteria are being met—report the median value.
—
If criteria are not being met—consult the study requirements and objectives. Extend the
purge time if readings still do not stabilize; report the median value of the last five or
more sequential measurements and document problems encountered and how they were
resolved.
To purge a supply well (assuming that a flowthrough cell/chamber will be used):
A supply well that is in regular service and that is pumping continuously or that has been operating
long enough to have removed three casing volumes of water within several hours of sample collection
does not require removal of three well volumes. Before withdrawing a sample in this case, flush one
tubing volume of sample water through the tubing and monitor measurement values.
1. Determine or estimate and record the depth to static water level (fig. 6.0–4). Instructions for waterlevel measurement are given in NFM 4, appendix A4–B.
2. Calculate and record the well volume (fig. 6.0–4).
3. Select the location and method of tubing hookup to the well and connect sample tubing as close as
possible to the wellhead.
• There must be no water-storage tanks, holding or pressurization tanks, or chemical disin
fection or water-softening systems connected inline between the pump and the tap/faucet
to which sample tubing will be connected.
• Select a faucet without an aerator or obtain written permission to remove the aerator
(replace the aerator after sampling).
4. Regulate the flow using a manifold with a needle valve, if possible.
a. Open any additional valves or taps/faucets to ensure that the pump will operate
continuously and reduce the possibility of backflow stored in ancillary plumbing lines;
keep these open throughout purging and sample withdrawal.
b. The pump should produce a smooth, solid stream of water with no air or gas bubbles
and without pump cavitation during field measurements and sample withdrawal.
5. Purge three well volumes or the purge volume dictated by the pumping status of the well or
sampling objectives.
• Throughout purging, monitor and record field-measurement readings (fig. 6.0–4).
• If required by Federal, State, or local regulations, contain purge water as directed.
Info, Version 2.0 (10/2008)
U.S. Geological Survey TWRI Book 9
INFO—23
6. As the third or last well volume is purged, when the final field measurements are recorded,
adjust the purge rate to the pumping rate to be used during sampling, if necessary.
• Record field measurements at regular time intervals, about 3 to 5 minutes apart.
• Check the last three to five or more measurement values for each field property against the criteria for field-measurement stabilization (table 6.0–1). • Determine final field-measurement values.
—
If the criteria are being met—report the median value.
—
If criteria are not being met—consult the study requirements and objectives. Extend
the purge time if readings still do not stabilize; report the median value of the last five or
more sequential measurements and document problems encountered and how they were
resolved.
RECORD OF WELL PURGING
Date: __________________ By: ________________________________________
SITE ID ________________________ STATION NAME _____________________________________
HEIGHT OF WATER COLUMN__________________ DEPTH OF WELL _______________________
PUMP INTAKE (ft or m below MP): Start__________ End ____________________________________
WELL-PURGING METHOD AND PUMP TYPE (describe):___________________________________
____________________________________________________________________________________
TIME
WATER
LEVEL
below
*MP LS
HR:MIN *ft or m
DRAWDOWN
*ft or m
TEMPER CONDUC
ATURE
TIVITY
°Celsius
μS/cm
pH
DISSOLVED
OXYGEN
standard
units
mg/L
TURBID
ITY
**
APPROX.
PUMPING
RATE
*gpm or
L/min
*Circle the unit used; MP, measuring point; LS, land surface; HR:MIN, hour and minutes; ft, feet; m,
meter; μ S/cm, microsiemens per centimeter at 25° C; mg/L, miligrams per liter; gpm, gallons per minute;
L/min, liters per minute.
**Select the appropriate turbidity unit from http://water.usgs.gov/owq/turbidity_codes.xls.
Well volume = V= 0.0408 HD 2 = ____ gallons. Purge volume = (n)(V) = ____ gallons.
V = volume of water in well, in gallons; D = inside well diameter, in inches; H = height of water column,
in feet; n = number of well volumes to purge.
Well volume is 0.16 gallons per foot for a 2-in. diameter casing.
Figure 6.0–4. Example of a field form for recording measurements during well purging
(modified from NFM 4, Figure 4-12).
Chapter A6, Field Measurements
Info, Version 2.0 (10/2008)
24—INFO
6.0.3.B
Direct Field-Measurement Procedures
Direct field measurements are those that are performed either (a) above ground by pumping water
from the well, inline, directly to a sensor-instrumented flowthrough cell or chamber (inline-flow
measurement procedure performed using either single-parameter instruments within a flowthrough
chamber or a multiparameter instrument), or (b) downhole, using individual submersible sensors or a
multiparameter sonde (in situ measurement procedure). Ambient ground-water temperature, SC, DO,
pH, Eh, and turbidity can be determined using either procedure (fig. 6.0-5), but use of the in situ
procedure can have more limitations and, to avoid sample contamination, should not be used if
samples for laboratory or other offsite analyses will be collected.
Inline-flow (Flowthrough Cell/Chamber) Procedure
A flowthrough cell/chamber is an airtight, transparent vessel with a pressure-relief valve and with
either (1) leak-proof ports (compression fittings) to accommodate individual sensors, or (2) a
multiparameter instrument. Several types of flowthrough cell/chamber systems are available and can
be designed for a specific measurement or simultaneous measurements (for example, see NFM 6.2.2
for the description of a flowthrough cell for the spectrophotometric determination of DO
concentration). Figure 6.0–3 is a diagram of a flowthrough cell system and figure 6.0–5 shows the
steps for inline-flow measurement of field parameters using a flowthrough cell/chamber system.
All sensors must be calibrated before use, as described in the relevant sections of this chapter (sections
6.1 through 6.8) and according to the manufacturer’s guidelines for the instrument in use.
When using a flowthrough cell/chamber system, install the cell/chamber inline from the pump and
as close to the wellhead as possible.
Keep the cell/chamber, field-measurement instruments, and tubing off the ground, shaded from
direct sunlight, and shielded from wind. Keep the tubing as short as possible.
For a system for which sensors are to be installed in the chamber, insert the DO sensor directly
downstream from the chamber inflow, and install the pH sensor downstream from the
conductivity sensor. Turn on the pump; direct initial flow to waste to avoid introducing sediment
into the chamber.
For a multiparameter instrument system, place the sonde into the cell provided by the
manufacturer, according to the manufacturer’s instructions.
Adjust the flow into the chamber so that a constant stream of water is maintained at the rate
required for DO measurements (see NFM 6.2). Correct any backpressure conditions; tilt the
chamber to expel trapped air.
Downhole (In Situ) Procedure
When deploying sensors or a multiparameter sonde downhole, ground water should be pumped
to flow upward past downhole sensors in order to obtain values representative of the depth interval
being sampled; therefore, a submersible pump follows the downhole instrument. Because of this
constraint, the downhole method may not be practical at wells with dedicated pumps or when using
multiple equipment in small-diameter wells. Figure 6.0–5 shows the steps for downhole measurement
of field parameters.
Info, Version 2.0 (10/2008)
U.S. Geological Survey TWRI Book 9
INFO—25
The depth at which sensors are located depends on study objectives. If a sample is to represent
ground water that is integrated over the screened interval, locate sensors approximately 1 ft
above the screened interval in a 2-in.-diameter well and just below the pump intake.
Remove downhole sensors from the well before collecting samples for chemical analysis in
order to prevent these instruments from affecting sample chemistry. Note that the process of
removing these instruments and putting the pump back in the well causes disturbances that can
affect the quality of samples subsequently collected for chemical analyses (Puls and others,
1991; Kearl and others, 1992; Puls and Powell, 1992).
Test and calibrate field instruments. Select
downhole or flowthrough-chamber system.
FLOWTHROUGH CELL/CHAMBER
DOWNHOLE (IN SITU)
Lower sensors and pump intake
to selected depth.
U Install pump in monitoring well or any
additional lines and plumbing at a supply well
with a pump.
U Hook up well and flowthrough cell/chamber
inline.
U Install sensors in flowthrough chamber/cell
unless a multiparameter sonde is being used.
Turn on pump and adjust flow to
desired purge rate; record rate and
time purging began. Allow sensors
to equilibrate at purge rate.
Adjust flow to desired purge rate
and record rate and time purging began.
U Divert initial water to waste.
U Connect chamber in-line from pump.
U Adjust flow to chamber and eliminate
backpressure; allow sensors
to equilibrate.
Record and monitor sequential sets of field-measurement
readings during withdrawal of final well volume.
U After two or more well volumes are purged and before
final five or more readings are made, adjust flow rate
to be used for sampling flow; flow must be sufficient
for dissolved-oxygen measurements (see 6.2).
U For pH: divert flow from chamber and record
measurement when water is quiescent. Redirect
flow to chamber for next set of readings.
NO
Are stabilization criteria being met?
(table 6.0–1)
Extend purge time. Document
difficulty in field notes.
YES
Record at least 5 measurements
at intervals of 3 to 5 minutes
or more.
Report the median of the last 5 or more
readings and the time of measurement.
Figure 6.0–5. Field-measurement procedures for ground water using downhole and
flowthrough cell/chamber systems.
Chapter A6, Field Measurements
Info, Version 2.0 (10/2008)
26—INFO
6.0.3.C
Subsample Field-Measurement Procedures
Subsamples or discrete samples are aliquots of sample collected from a nonpumping sampling device
such as a bailer, a thief sampler, or a syringe sampler. Measurements of field parameters made in
discrete or nonpumped samples are more vulnerable to bias from changes in temperature, pressure,
turbidity, and concentrations of dissolved gases than measurements using inline-flow or in situ
measurement procedures.
Subsamples must not be used for reported measurements of temperature, DO, Eh, or
turbidity.
Subsamples can be used to determine ambient ground-water conductivity, pH, and alkalinity and
other carbonate species.
Subsample procedures must not be used for any field-measurement determination if the ground
water conditions are in reducing (anoxic) waters, unless the sample is decanted and
measurements are made within a chamber or glove box filled with an inert gas (for example,
ultrapure nitrogen or argon gas).
Figure 6.0–6 shows the steps for measurement of field parameters on a bailed sample. Use bailers
having a double (top and bottom) check valve and a bottom-emptying device. Field rinse the bailer or
other discrete-volume sampler with sample water before using. To shield the sample from
atmospheric contamination, make measurements within a collection chamber or a glove box.
Info, Version 2.0 (10/2008)
U.S. Geological Survey TWRI Book 9
INFO—27
Test and calibrate field instruments.
UÊ
UÊ
UÊ
UÊ
UÊ
UÊ
Purge well (see text for exceptions and instructions).
(2)
Field rinse precleaned sampler.
Use clean/dirty hands technique. Lower sampler smoothly, without
splashing, to desired depth of screened or open interval.
Raise sampler smoothly at a constant rate, keeping lines clean and off the ground.
Place sampler in holding stand.
(3)
Withdraw subsamples from sampler.
If using bailer, insert clean bottom-emptying device (device should fit snugly over
collection bottles and (or) measurement vessels).
If a filtered sample is needed, filter in-line from sampler to bottle/vessel.
Drain subsample without turbulence into collection bottles or measurement vessel.
Rinse collection bottle(s) three times with sample (filtrate for filtered samples), fill to
brim, cap tightly, and maintain at temperature of water source until measurement.
Rinse sensors, stir bar, and measurement vessel three times with sample.
For alkalinity, rinse with deionized water.
UÊ
UÊ
UÊ
UÊ
(4)
Insert sensor(s) into measurement vessel.
Wait for sensors to equilibrate to sample temperature.
Don't let sensors touch bottom or sides of vessel.
(5)
Swirl or stir gently to mix sample.
Minimize streaming potential or vortex; keep sensor out of vortex.
For pH, do not stir samples with conductivity less than 100 μS/cm.
When using magnetic stirrer, use smallest stir bar.
(6)
UÊ
UÊ
UÊ
UÊ
Step (1)
Record field measurement and method used on field form.
Record median value of stabilized readings (table 6.0–1).
If readings do not stabilize, extend number of measurements and record median of at
least 5 or more sequential readings.
If there is a constant trend toward lower or higher values, record the first value,
the range of values, and the time period observed.
(7)
Repeat process from steps (4) through (7) on two or more subsamples from
the same sample volume to document precision.
Rinse sensors and equipment thoroughly with deionized water.
Discard sample to waste, in accordance with applicable regulations.
(8)
Figure 6.0–6. Subsample field-measurement procedures for conductivity, pH, and alkalinity of
ground water.
Chapter A6, Field Measurements
Info, Version 2.0 (10/2008)
28—INFO
6.0.4
SELECTED REFERENCES
ASTM International, 2005, D6452–99 (2005), Standard guide for purging methods for wells used for
ground-water quality investigations: ASTM International publication accessed May 5, 2005, from
http://www.astm.org.
ASTM International, 1992, Standards on ground water and vadose zone investigations: American
Society for Testing and Materials publication code number 03–418192–38, 166 p.
Edwards, T.K., and Glysson, D.G., 1999, Field methods for measurement of fluvial sediment:
U.S. Geological Survey Techniques of Water-Resources Investigations, book 3, chap. C2,
80 p.
Fishman, M.J., and Friedman, L.C., 1989, Methods for determination of inorganic substances in water
and fluvial sediments: U.S. Geological Survey Techniques of Water-Resources Investigations,
book 5, chap. A1, 545 p.
Hem, J.D., 1086, Study and interpretation of the chemical characteristics of natural water:
U.S. Geological Survey Water-Supply Paper 2254, 263 p.
Hoopes, B.C., ed., 2004, User’s manual for the National Water Information system of the U.S.
Geological Survey (USGS): U.S. Geological Survey Open-File Report 2004–1238, 262 p.
Horowitz, A.J., Demas, C.R., Fitzgerald, K.K., Miller, T.L., and Rickert, D.A., 1994, U.S. Geological
Survey protocol for the collection and processing of surface-water samples for the subsequent
determination of inorganic constituents in filtered water: U.S. Geological Survey Open-File Report
94–539, 57 p.
Hydrologic Instrumentation Facility, 1991, Hydrolab H2O, in Instrument News: Stennis Space
Center, Miss., U.S. Geological Survey Hydrologic Instrumentation Facility, December 1991,
p. 7–9.
Hydrologic Instrumentation Facility, 1992, pH, in Instrument News: Stennis Space Center,
Miss., U.S. Geological Survey Hydrologic Instrumentation Facility, March 1992, p. 7–8.
Hydrologic Instrumentation Facility, 1992, pH, in Instrument News: Stennis Space Center,
Miss., U.S. Geological Survey Hydrologic Instrumentation Facility, September 1992, p. 8.
Hydrologic Instrumentation Facility, 1992, Conductivity, in Instrument News: Stennis Space Center,
Miss., U.S. Geological Survey Hydrologic Instrumentation Facility, December 1992, p. 12–13.
Hydrologic Instrumentation Facility, 1993, pH, in Instrument News: Stennis Space Center,
Miss., U.S. Geological Survey Hydrologic Instrumentation Facility, March 1993, p. 10–14.
Hydrologic Instrumentation Facility, 1992, Hydrolab’s H2O, in Instrument News: Stennis Space
Center, Miss., U.S. Geological Survey Hydrologic Instrumentation Facility, March 1993, p. 4–5.
Hydrologic Instrumentation Facility, 1993, Dissolved oxygen, in Instrument News: Stennis Space
Center, Miss., U.S. Geological Survey Hydrologic Instrumentation Facility, September 1993,
unnumbered insert.
Hydrologic Instrumentation Facility, 1994, Temperature measurement tests, in Instrument News:
Stennis Space Center, Miss., U.S. Geological Survey Hydrologic Instrumentation Facility,
September 1994, p. 3–7; 10–12.
Hydrologic Instrumentation Facility, 1994, Turbidity meter tests, in Instrument News: Stennis Space
Center, Miss., U.S. Geological Survey Hydrologic Instrumentation Facility, June 1994, p. 11–13.
Kearl, P.M., Korte, N.E., and Cronk, T.A., 1992, Suggested modifications to ground water sampling
procedures based on observations from the colloidal borescope: Ground Water Monitoring Review,
v. 12, no. 2, p. 155–160.
Lapham, W.W., Wilde, F.D., and Koterba, M.T., 1997, Guidelines and standard procedures for studies
of ground-water quality—Selection and installation of wells, and supporting documentation:
U.S. Geological Survey Water-Resources Investigations Report 96–4233, 110 p.
Info, Version 2.0 (10/2008)
U.S. Geological Survey TWRI Book 9
INFO—29
Puls, R.W., and Powell, R.M., 1992, Acquisition of representative ground water quality samples for
metals: Ground Water Monitoring Review, v. 12, no. 3, p. 167–176.
Puls, R.W., Powell, R.M., Clark, D.A., and Paul, C.J., 1991, Facilitated transport of inorganic
contaminants in ground water, part II, Colloidal transport: Ada, Oklahoma, Robert S. Kerr
Laboratory, U.S. Environmental Protection Agency Report EPA/600/m-91/040, 12 p.
Rantz, S.E., and others, 1982, Measurement and computation of streamflow: Volume 1, Measurement
of stage, and Volume 2, Computation of discharge: U.S. Geological Survey Water-Supply Paper
2175, v. 1, p. 1–284, v. 2, p. 285– 631.
Reilly, T.E., and Gibs, Jacob, 1993, Effects of physical and chemical heterogeneity of water-quality
samples obtained from wells: Ground Water, v. 31, no. 5, p. 805–813.
U.S. Geological Survey, 1978, Sediment, chap. 3 in U.S. Geological Survey, National handbook of
recommended methods for water-data acquisition: p. 3–1 to 3–100.
U.S. Geological Survey, variously dated, National field manual for the collection of water-quality
data: U.S. Geological Survey Techniques of Water-Resources Investigations, book 9,
chaps. A1–A9, available online at http://pubs.water.usgs.gov/twri9A.
Varljen, M.D., Barcelona, M.J., Obereiner, James, and Kaminski, David, 2006, Numerical
simulations to assess the monitoring zone achieved during low-flow purging and sampling:
Ground Water Monitoring and Remediation, v. 26, no. 1, p. 44–52.
Wagner, R.J., Boulger, R.W., Jr., Oblinger, C.J., and Smith, B.A., 2006, Guidelines and standard
procedures for continuous water-quality monitors—Station operation, record computation, and
data reporting: U.S. Geological Survey Techniques and Methods 1–D3, available only online at
http://pubs.water.usgs.gov/tm1d3. (Accessed August 28, 2008.)
Ward, J.R., and Harr, C.A., 1990, Methods for collection and processing of surface-water and bedmaterial samples for physical and chemical analyses: U.S. Geological Survey Open-File Report
90–140, 71 p.
ACKNOWLEDGMENTS
6.0.5
This version of NFM 6.0, dated October 2008, represents an update of the September 2006 version.
The information contained in this report is based largely on the scholarship and field expertise of D.B.
Radtke, one of the original authors of this and other chapters of the National Field Manual for the
Collection of Water-Quality Data. In addition, the scientific and technical knowledge, practical field
experience, and valuable contributions of D.A. Evans and Jacob Gibs (USGS technical reviewers),
and of the following scientists are gratefully acknowledged: C.W. Anderson (USGS), Michael
Lizotte (YSI, Inc.), Michael Sadar (Hach, Inc.), and R.J. Wagner (USGS). I.M. Collies and L.J.
Ulibarri (USGS) provided editorial and production support, which improved the quality of this report.
Chapter A6, Field Measurements
Info, Version 2.0 (10/2008)