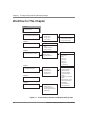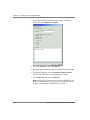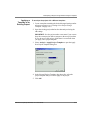
1
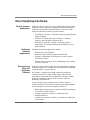
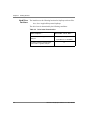
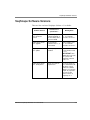
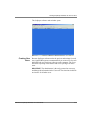
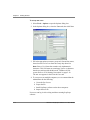
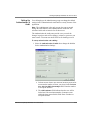
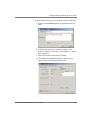
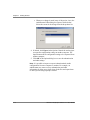
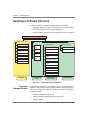
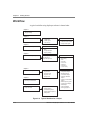
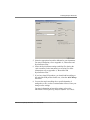
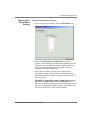
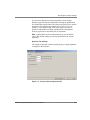
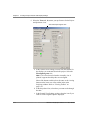
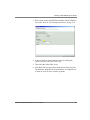
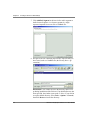
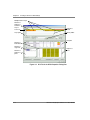
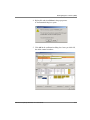
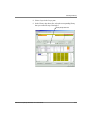
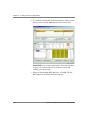
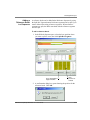
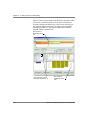
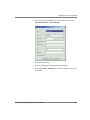
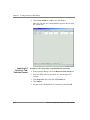
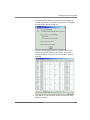
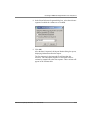
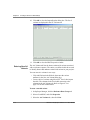
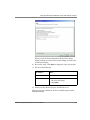
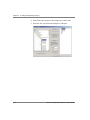
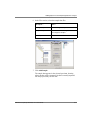
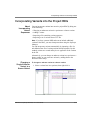
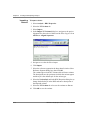
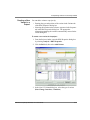
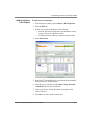
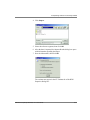
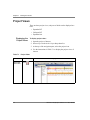
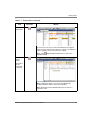
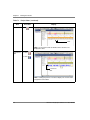
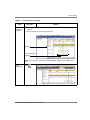
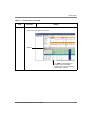
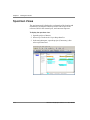
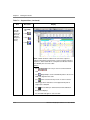
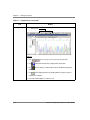
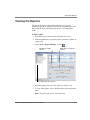
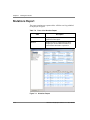
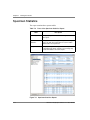
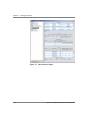
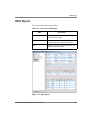
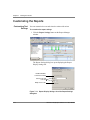
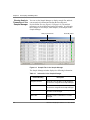
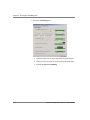
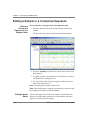
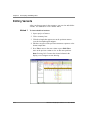
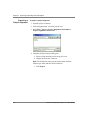
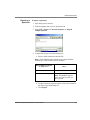
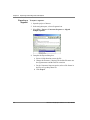
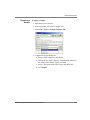
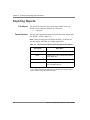
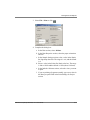
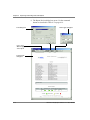
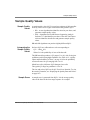
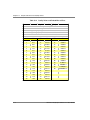
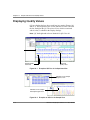
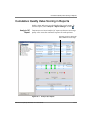
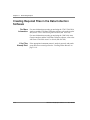
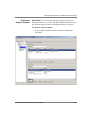
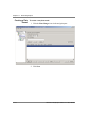
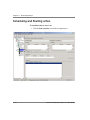
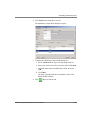
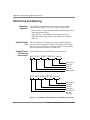
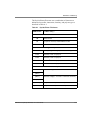
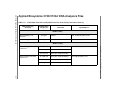
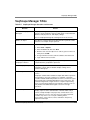
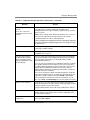
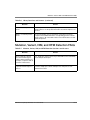
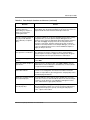
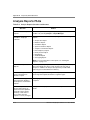
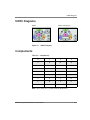
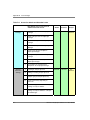
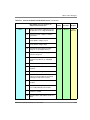
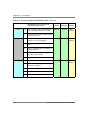
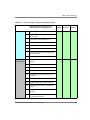
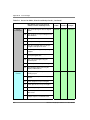
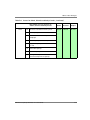
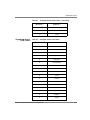
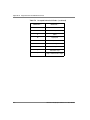
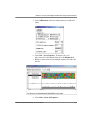
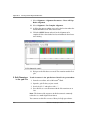
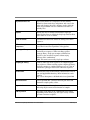
Cumulative Quality Value Scoring in Reports
Specimen
Statistics Report
The Specimen Statistics table of this report displays the average
consensus QV score for a segment in the Segment Score column.
The Sample Results table displays the average sample QV for the
bases in the clear range in the Sample Score column.
Average sample QV for the bases is in the clear range
Average consensus QV score for a segment
Figure 10-7 Specimen Statistics Report
ABI PRISM SeqScape Software v2.1 User Guide
DRAFT
August 28, 2003 2:54 pm, 10_QualityValuesConsensus.fm
10-13