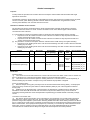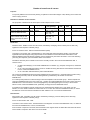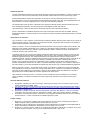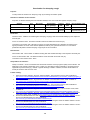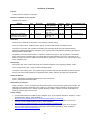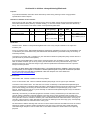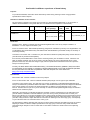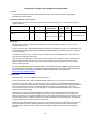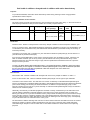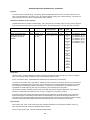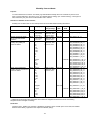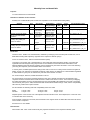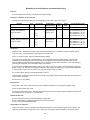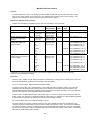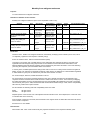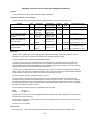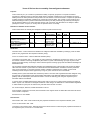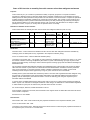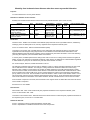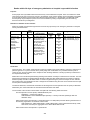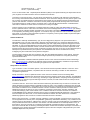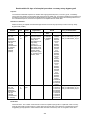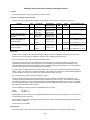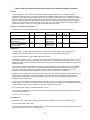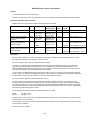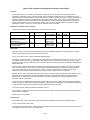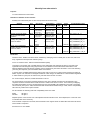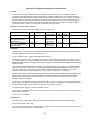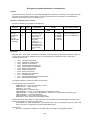
1
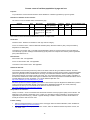
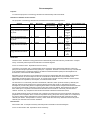
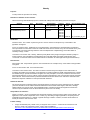
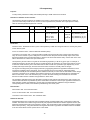
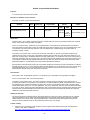
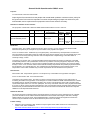
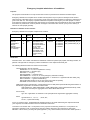
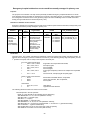
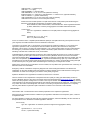
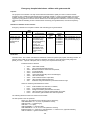
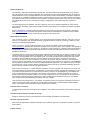
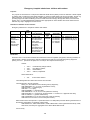
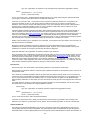
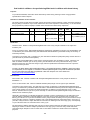
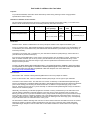
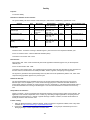
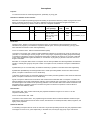
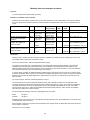
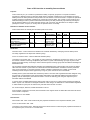
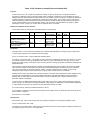
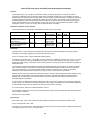
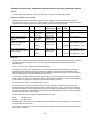
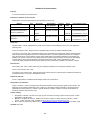
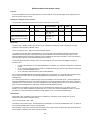
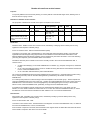
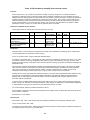
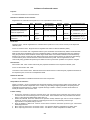
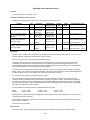
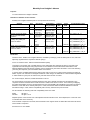
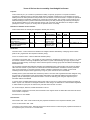
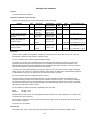
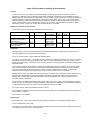
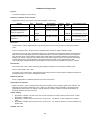
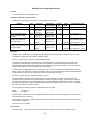
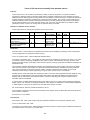
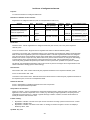
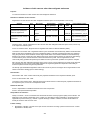
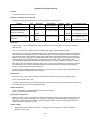
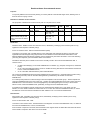
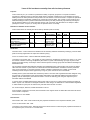
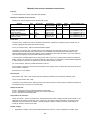
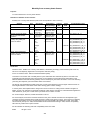
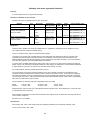
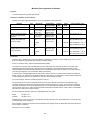
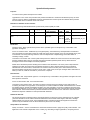
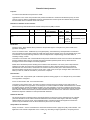
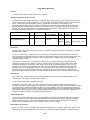
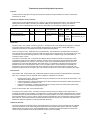
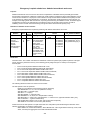
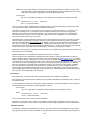
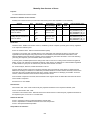
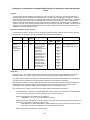
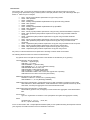
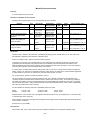
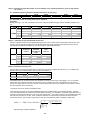
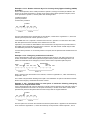
Annex 3 ‘Explanation of statistical methods’ (Methods section of the Clinical and Health Outcomes Knowledge
Base www.nchod.nhs.uk ) describes the methods used for indirect standardisation, calculation of improvement,
estimation of confidence intervals, and banding of significance of improvement.
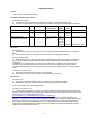
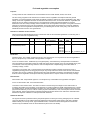
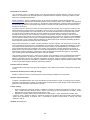
Interpretation of indicator:
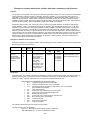
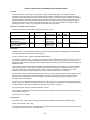
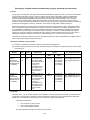
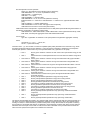
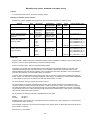
Type of indicator - This is a procedure specific, cross-sectional annual comparative indicator, acting as a proxy for
outcome. In the absence of an absolute standard, comparative data are useful for monitoring in relation to rates
achieved in comparable organisations.
Quality of Indicator – Annex 12 (Methods section of the Clinical and Health Outcomes Knowledge Base
www.nchod.nhs.uk ) describes the criteria that should be used to judge the quality of this indicator. The application
of the criteria is dependent on the context (e.g. describing a single organisation, comparing several organisations)
and the level (e.g. national / regional with large numbers of events, local with small numbers of events) at which
the data are to be used.
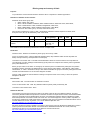
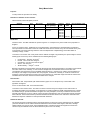
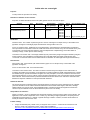
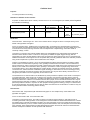
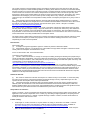
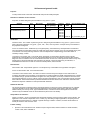
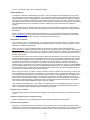
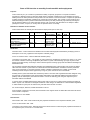
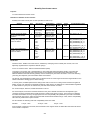
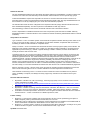
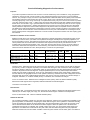
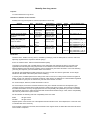
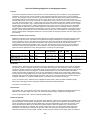
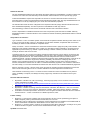
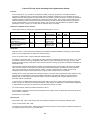
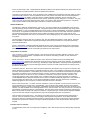
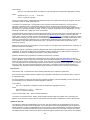
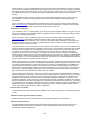
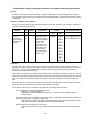
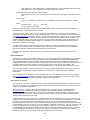
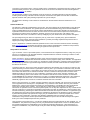
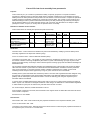
Confidence Intervals - Some of the values and factors influencing the indicator may be chance occurrences, with
values fluctuating at random between organisations and from year to year. Numbers of admissions may be small
at Primary Care Organisation and Local Authority level. The results should therefore be interpreted with caution
and with the aid of confidence intervals. The 95% confidence interval provides a measure of the statistical
precision of the rate for an area or institution. It indicates a range which, with 95% confidence, will contain the
underlying value of the indicator. If the confidence interval for an area’s rate does not contain the overall national
rate, the difference between the two rates is considered statistically significant. If the confidence intervals for the
two rates overlap, in most cases the difference between the rates would not be considered statistically significant.
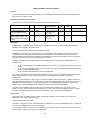
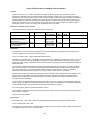
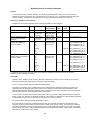
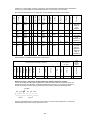
95% and 99.8% confidence intervals have been calculated.
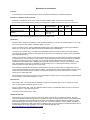
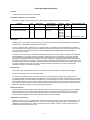
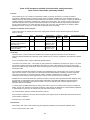
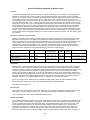
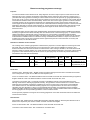
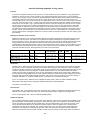
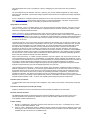
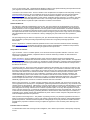
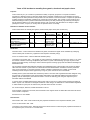
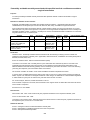
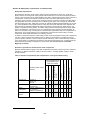
Effect of case-mix/severity - A number of factors outside the control of hospitals, such as the socio-economic mix
of local populations and events prior to hospitalisation, may determine whether a patient gets admitted or not and
may influence rates. Differences in case-mix (beyond that accounted for by standardisation), comorbidities and
other potential risk factors also contribute to the variation. Current data do not allow assignment of severity of
illness across continuous inpatient spells, nor do they allow adjustment for any of these factors. We have tried to
deal with this constraint partially by presenting the data in clusters that are similar with respect to organisation
type. Gender-specific data standardised to person rates are available.
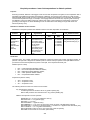
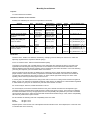
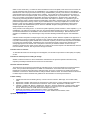
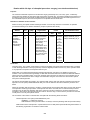
Other potential confounding factors - The patterns of providing care may vary between organisations in terms of:
extent of treatment in primary care settings; referral policies and practices; hospital and primary care based
treatment facilities.
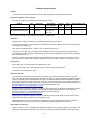
Potential value of indicator:
To stimulate discussion and encourage local investigation, and to lead to improvement in data quality and quality
of care.
Potential for follow-up action leading to change:
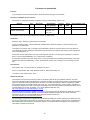
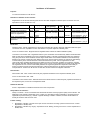
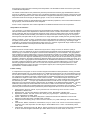
Studies to assess the extent to which those eligible for the procedure are not receiving it are recommended.
Relevant national initiatives:
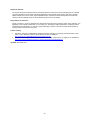
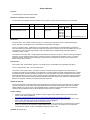
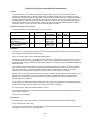
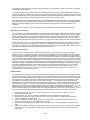
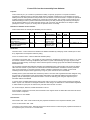
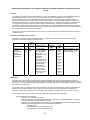
This indicator was part of the NHS Performance Indicators published by the Department of Health up to 2002.
Further reading:
1. NHS Executive. Clinical Effectiveness Indicators – A Consultation Document. London: Department of Health,
1998.
2. Department of Health. NHS Performance Indicators: London: Department of Health, 2002.
Updated: November 2010
566