1
3.4.2.3.2
Line thickness settings for control parameter – wave speed plots
homocliniclinethickness (setting in colour.style: 5)
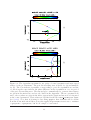
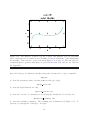
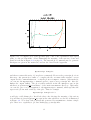
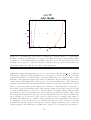
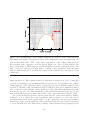
This determines the thickness of the loci of homoclinic solutions (which are actually
contours of waves of large period that have been designated as homoclinic).
hopflocuslinethickness (setting in colour.style: 5)
This determines the thickness of the loci of Hopf bifurcations in the travelling wave
equations.
foldlocuslinethickness (setting in colour.style: 5)
This determines the thickness of folds in the periodic travelling wave solution branch.
periodcontourlinethickness (setting in colour.style: 3)
This determines the thickness of contours of constant period.
sbdyeckhauslinethickness (setting in colour.style: 5)
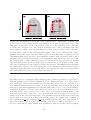
This determines the thickness of curve(s) indicating the boundary between stable
and unstable waves, when the change of stability is of Eckhaus type.
sbdyhopflinethickness (setting in colour.style: 5)
This determines the thickness of curve(s) indicating the boundary between stable
and unstable waves, when the change of stability is of Hopf type.
3.4.2.3.3
Line thickness settings for bifurcation diagram plots
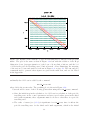
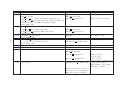
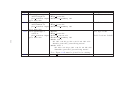
bdlinethicknessmax (setting in colour.style: 3)
bdlinethicknessmean (setting in colour.style: 3)
bdlinethicknessmin (setting in colour.style: 3)
bdlinethicknessnorm (setting in colour.style: 3)
bdlinethicknessperiod (setting in colour.style: 3)
bdlinethicknessstst (setting in colour.style: 3)
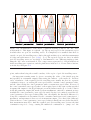
These settings determine the thickness of the curves showing the various properties
of the periodic travelling wave solution branch.
3.4.2.3.4
Line thickness settings for the @line, @point and @text commands
extralinethickness (setting in colour.style: 1.5)
This specifies the thickness of lines generated by the @line command. Note that
this does not affect any other lines.
3.4.2.4 Line Type Settings
These are specified by a code number, whose interpretation depends on whether the plotter
being used is sm or gnuplot. For gnuplot, the number specifies the gnuplot line style
of that number. This is terminal dependent: see gnuplot documentation for details. In
particular the same number may give different line styles on the screen and in a postscript
plot. This is clearly unsatisfactory but is an intrinsic feature of gnuplot. However two
different line style are guaranteed to be the same for all terminal types including postscript
148