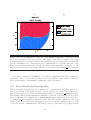
1
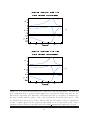
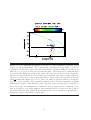
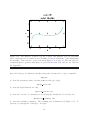
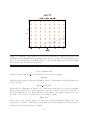
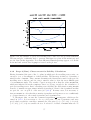
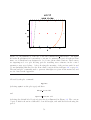
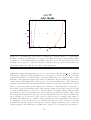
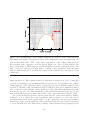
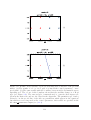
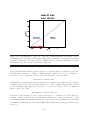
(a)
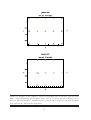
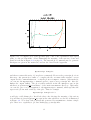
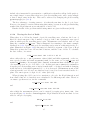
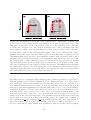
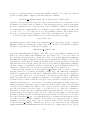
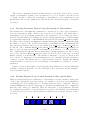
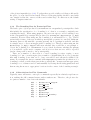
(b)
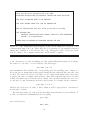
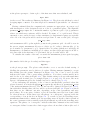
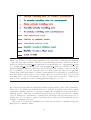
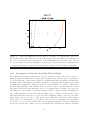
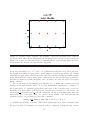
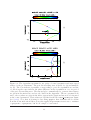
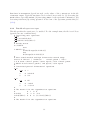
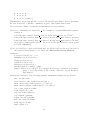
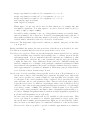
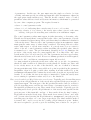
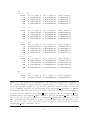
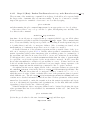
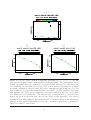
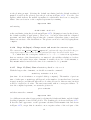
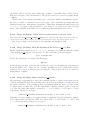
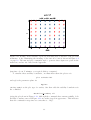
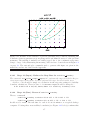
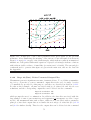
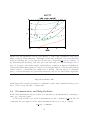
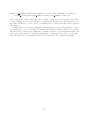
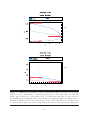
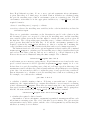
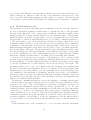
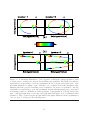
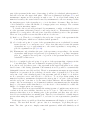
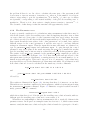
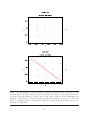
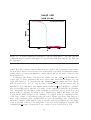
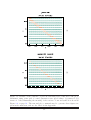
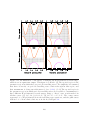
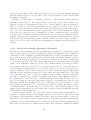
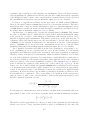
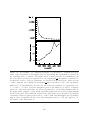
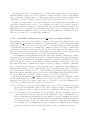
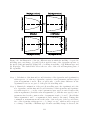
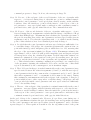
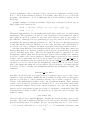
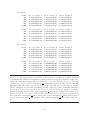
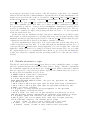
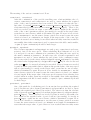
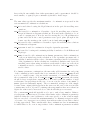
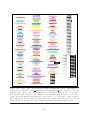
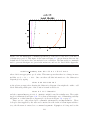
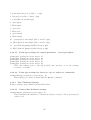
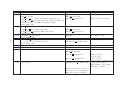
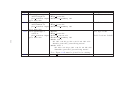
Figure 3.24: (a) An illustration of the use of the @shade command to shade regions in
the control parameter–wave speed plane. This figure is the same as Figure 2.11 except
that shading has been added to indicate the parameter regions giving stable and unstable
periodic travelling waves. The run and plot commands used to generate this part of the
figure are given in the main text, and are also listed in the Appendix. (b) The key to the
shading used in part (a) of the figure. This key is generated by the @shade key command.
As a final comment about @shade, it should be emphasised that the command is
restricted to plots of the control parameter–wave speed plane, and it cannot be used for
plots of wavelength or wavenumber against the control parameter.
3.3.7
Record Keeping for Postscript Plots
When generating postscript plots for publication or presentation, users may wish to retain a record that would enable them to recreate the plot at a later date. This can be
achieved by setting the plotter variable keeprecords to yes in plot defaults.input.
This setting causes the @postscript command to generate a plotting record as well as
the postscript file. For example, the command @postscript demoplot creates the directory demoplot record which contains two files. The first of these, demoplot.tar, is an
archive of all of the data used for demoplot.eps; the second file, demoplot.plt, is a list
of the various plot commands and option choices used to generate the plot, plus a listing
134