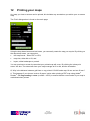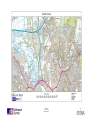
1
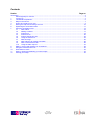
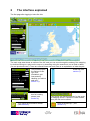
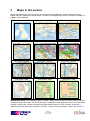
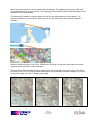
Basic user guide Contents Section Page no Introduction .............................................................................................................................................................. 3 About Digimap for Schools ......................................................................................................................... 3 1 Logging on .................................................................................................................................................. 4 2 The interface explained .............................................................................................................................. 5 3 Maps in the service ..................................................................................................................................... 7 4 How to find a place on a map ..................................................................................................................... 9 5 Moving the map and zooming in and out.................................................................................................. 10 6 Explaining the annotation toolbar ............................................................................................................. 11 7 Using the annotation tools ........................................................................................................................ 13 7.1 Add a label ................................................................................................................................... 16 7.2 Adding a marker........................................................................................................................... 17 7.3 Draw a line ................................................................................................................................... 18 7.4 Draw an area ............................................................................................................................... 20 7.5 Draw a fixed shape area .............................................................................................................. 22 7.6 Using the buffer tool ..................................................................................................................... 23 7.7 Add an image ............................................................................................................................... 25 7.8 Add a label to an existing annotation ........................................................................................... 26 7.9 Add a measurement label ............................................................................................................ 26 7.10 Using the fade map tool ............................................................................................................... 27 8 Editing, moving and deleting your annotations ......................................................................................... 28 9 Using the measurement tool ..................................................................................................................... 30 10 Grid reference tools .................................................................................................................................. 32 11 Saving, opening and deleting your saved maps ....................................................................................... 33 12 Printing your maps .................................................................................................................................... 35 D11124 v1.1 Apr 2014 Page 2 of 38 Introduction About Digimap for Schools Digimap for Schools is an online mapping service for use by teachers and pupils providing easy access to a range of current Ordnance Survey maps, including the most detailed mapping available for Great Britain, OS MasterMap®, as well as digital versions of Ordnance Survey’s famous paper maps, the OS Landranger Map and OS Explorer Map series. Also included are street-level maps, showing street names and road-atlas style maps. Maps can be printed as PDF files at A3 or A4 size with an individual’s own map title and name included with the scale bar and school name and address. Search tools include postcode, place name or National Grid reference, and maps can be moved to centre on any chosen location within Great Britain. Map keys are available for each scale map to explain the symbols used within the map. Maps can be annotated with symbols, lines, areas, text and can be saved to be reused during another session. Digimap for Schools is a subscription service. Schools purchase a subscription for 12 months’ access to the service. Details on subscriptions can be found at http://digimapforschools.edina.ac.uk/subscribe.html. Terms of use of the service can be found at http://digimapforschools.edina.ac.uk/termsofuse.pdf. For further information, or to give feedback on our resources, contact the EDINA Help Desk on 0131 650 3302 (Monday to Friday 9.00 am to 5.00 pm) or email [email protected]. This user guide has been created to help new users with the service. If you are using the service via an iPad®, some of the functionality may work differently than if you are using a computer. D11124 v1.1 Apr 2014 Page 3 of 38 1 Logging on The first step is to open the Digimap for Schools homepage in your browser. The web address is http://digimapforschools.edina.ac.uk. Here you will be presented with the Digimap for Schools homepage; click login > from the centre of the page: Enter your school’s Username and Password and then press Login. D11124 v1.1 Apr 2014 Page 4 of 38 2 The interface explained The first page after logging in looks like this: The main map area shows an outline of the UK, and you can zoom through the scales of the mapping by double-clicking on a point on the map or by searching using the search tool (on an iPad or tablet, you can pinch and zoom). There are several boxes and tools; here is an explanation of what they do: The print box offers the options for file type, size, orientation, grid lines and any labelling you wish to add (see section 12). This is the search box for locating places (see section 4). Scale bar (see section 5). This opens the relevant map key for the scale of mapping shown. It opens in a new window, as a pdf and can be saved. Open a saved map – (see section 11). This opens the annotation toolbar (see section 6). D11124 v1.1 Apr 2014 Page 5 of 38 Measurement tool – (see section 9). Map Manager – (see section 11). Grid reference tool (see section 10). Make the map bigger – this makes your map fill the screen. This will hide the search and print box; to restore them, click on this button again to minimise the map screen. Start again – this will reset the map screen. Grid reference overlay tool – (see section 10). Zoom to an area – (see section 4). Navigation arrows (see section 5). Overview map – this shows an overview of where the current map is. This will take you to the help pages on the website. Save current map – (see section 11). D11124 v1.1 Apr 2014 Page 6 of 38 3 Maps in the service Within the Digimap for Schools service, you can access eight different current Ordnance Survey digital maps at 12 different zoomed views. For each of the digital maps there is a map key. Below is a graphic of each dataset: Print scale 1:8 000 000 Print scale 1:160 000 Print scale 1:800 000 Print scale 1:400 000 Print scale 1:200 000 Print scale 1:100 000 Print scale 1:50 000 Print scale 1:25 000 Print scale 1:10 000 Print scale 1:5000 Print scale 1:2500 Print scale 1:1250 IMPORTANT NOTE: when viewing a map on screen, there will be a scale bar visible on the screen but no label to tell you the scale. The on-screen map is a depiction of the map scale; and is not exact when viewing on the screen. Screen resolution and map scales cannot be 100% accurate, as there is a different resolution when maps appear on screen. To print a map accurately to scale, see section 12. D11124 v1.1 Apr 2014 Page 7 of 38 Within in the service there is also an historic layer of mapping. The mapping is dated circa 1890, and was originally drawn at 1inch to the mile. The mapping is only viewable at certain scales (because of the resolution of the scanned data). The data can be viewed by using the slider, found on the top right hand side of the mapping. The historic map slider turns from grey to blue when you are at a zoom level where historic maps are available. When the slider turns blue, click on the 1890s button and drag it to the left to peel away the modern map and reveal the historic map underneath. There are three different transparencies layers; as you move the slider from right to left, it will reveal the historic map. You can view a modern and historic map combined to compare changes, or you can view historic maps only with no modern map visible. D11124 v1.1 Apr 2014 Page 8 of 38 4 How to find a place on a map The search box (right) gives you the option to find a place to centre your map on. You can search using: A place name – you can enter a place and it will zoom to that area. If there are numerous places with the same name, the search option will list all the possibilities, then click on your choice and the map will zoom to your choice. (There are over 250,000 place names in the gazetteer). A postcode – (must be complete; that is, 6 or 7 characters). The map will then zoom to the centre of this postcode area. A grid reference – you can enter a grid reference up to 10 figures (you must include the prefix). Another option is to use the zoom to area tool, click on the button (a white outline will appear around the tool), now left-click and drag on the area you want to view. Once the box is drawn to the area you need to, release the mouse button and the map will zoom to the area you requested (this tool will close once it is used). See below: An alternative option is double-click on the map. When you do this, the map will zoom in and a largerscale map with more detail will be displayed. Keep double-clicking until you have found the place you require. D11124 v1.1 Apr 2014 Page 9 of 38 5 Moving the map and zooming in and out Moving the map The map is a ‘slippy map’, which means you can left-click and hold and drag the map. Releasing the click will stop the map from moving. On an iPad or tablet, you can use finger swipe. You can also use the navigation arrows to pan around the map, moving north, east, south and west. A third option is to use the cursor keys on the keyboard; this pans the map similar to the navigation arrows. Zooming in and out There are different ways to zoom in and out of the map. There are two options for just zooming in: 1 Double-click on the map; this will automatically zoom the map in on the point you clicked. Every subsequent double-click will zoom the map to the next map scale (see section 3 for these). 2 Using the zoom to tool, you can zoom to a particular area (see section 4). There are two options for zooming in and out: 1 By using the scale bar (right) you can zoom the map in and out, either by clicking on the + or - , or by dragging the bar to the scale you require. 2 If you have a mouse with a scroll wheel, you can zoom in and out by rolling this forwards or backwards (sensitivity of this can vary). On an iPad or tablet, you can also pinch and stretch to zoom in and out. D11124 v1.1 Apr 2014 Page 10 of 38 6 Explaining the annotation toolbar Within the Digimap for Schools service, you can annotate and customise your mapping using the annotation tools. The annotation tools can be found by clicking on the button at the top of the screen. Once you click on the annotation button, the toolbar will open and will look like this: The toolbar can be moved around the screen by clicking and holding on the top of the toolbar. You can then move this around the screen and place it somewhere convenient to you. Alternatively, you can rotate the toolbar by clicking on the icon on the top right. Again this can then be moved around the screen. Below is a brief explanation of what each tool does: Show/Hide/Clear This turns your annotation (s) on and off This removes all annotations Draw & Create Place a label Add a marker Draw a line Draw an area, either with edges or freehand Draw a fixed shape Point buffer tool Add an image Modify Add a label to an existing feature you have annotated Add measurement label Delete individual annotations Move annotations Scale feature D11124 v1.1 Apr 2014 Page 11 of 38 Text Options Font and size for text labels Colour of text labels Fill Options Area fill colour Area fill transparency Outline Options Outline colour Line style Edit single annotations Edit multiple annotations Select Fade Map Fade map When a tool has been activated it will turn white: it will turn back to green. To deactivate a tool, click on the button and NOTE: if you close the annotation toolbar, this will deactivate the tool you are using. D11124 v1.1 Apr 2014 Page 12 of 38 7 Using the annotation tools NOTE: the annotation toolbar must be open for you to access the tools. This section gives detailed information about the tools and instructions on how to use them. When using the annotation tools, you can customise the look of the annotations you create. You can change: text colour, size and font; line style and colour; and outline and fill colour, and transparency percentage for areas. To customise any text you add to your map, you can use the tools under Text Options (the default setting is black text, Arial font, and 36 pt. To change the colour of your text, by clicking on the drop-down arrow (right), a palette of colours will be viewable for you to choose from: To change the font and text size, you can select using the drop-down arrows: D11124 v1.1 Apr 2014 Page 13 of 38 You can use the tools under Outline Options to customise your line style and outline colour. The colour can be changed by using the drop-down arrow on the button; this will offer a palette of colours to choose from: You can select you line type by using the drop-down arrow on the style button: When drawing an area, you can change the line style, outline colour (see the instructions above) fill colour and transparency percentage. Under Fill Options, you have two buttons where you can select the fill of your area and the transparency percentage. The fill colour can be changed by using the drop-down arrow on the button; this will offer a palette of colours to choose from: D11124 v1.1 Apr 2014 Page 14 of 38 To change the transparency percentage, click on the drop-down arrow under transparency; this will offer you three options: 0% transparency will fill your area with a block of colour. 50 % will have some colour, but the underlying map will be visible. D11124 v1.1 Apr 2014 Page 15 of 38 100 % will have no colour fill. 7.1 Add a label Using this tool, you can add labels to your map. You can select the colour, font and font size for each label you want to place. See section 7 for details. To place a label, activate the label tool and click on the map where you want to place your label. When you have done this, a text box will open: Add your text in the box and then click Save. The text will then appear on the screen: You can edit and move your label after it has been added, see section 8. NOTE: this move annotation tool will stay active, so ensure you click on the tool button to deactivate it when you have placed your marker(s). D11124 v1.1 Apr 2014 Page 16 of 38 7.2 Adding a marker You can add a marker to your map using the add marker tool: you a selection of markers to add to your map: the drop-down arrow gives To add a marker, select your marker and click on the map where you want to place it: You can add multiple markers of different types on a map. NOTE: this tool will stay active, so ensure you click on the tool button to deactivate it when you have placed your marker(s). D11124 v1.1 Apr 2014 Page 17 of 38 7.3 Draw a line With the draw line tool, you can annotate lines on your maps. These are drawn as straight lines and can cover any distance. You can select a colour and style for your line prior to plotting. See section 7 for more details. To draw your line, first you must activate the draw line tool: Create (when activated the button will turn white). this is found under Draw and When you have activated the tool, the cursor will have a blue dot: . To start drawing your line, click once on your starting point and move the mouse; a line will show. NOTE: the colour of the line when you are plotting will be blue; once your line is complete, it will be shown with the style and colour you selected. Every time you now make a left click, a new vertex is added to the map. This will enable you to change the direction of the line. D11124 v1.1 Apr 2014 Page 18 of 38 If you want to navigate around the map while drawing your line, you can do this in three different ways: 1 Click, hold and drag the mouse: this will keep the line tool active and move the map (this may need some practice as it’s easy to accidentally double-click and close your line). 2 Use the navigation arrows: 3 Use the cursor keys on the keyboard: this works the same as the navigation arrows. to move around the screen. You can also zoom in and out when the line is open; to do this, either: use the zoom bar: use the scroll wheel on your mouse (if you have one). to change the scale; or While drawing your line, if you incorrectly click and want to remove this point on your line, you can do this by pressing Ctrl and Z together on your keyboard. This will undo the last point you plotted and can be used to undo multiple points. Once you have completed your line, you will need to double-click to finish the line on the map. Once you have done this, your line will be drawn with the colour and style you selected: You can edit the colour and style for your line, once it has been drawn. See section 8 for more details. D11124 v1.1 Apr 2014 Page 19 of 38 7.4 Draw an area When drawing an area on the map, you have two options available: draw an area with straight lines or draw a free-form shape. You can select the line colour, style, fill colour and transparency prior to drawing your shape. See section 7 for more details. To draw an area with a straight line, click on the ‘draw a line’ button , found under Draw and Create (the default setting for this tool is to draw an area with a straight line; when activated, the button will turn white). Once you have clicked on the button, the curser will have a blue circle on it: . Now click on the first point of the area you are going to draw and move the mouse, and a line will appear. NOTE: the colour of the line when you are plotting will be blue; once your line is complete, it will be shown with the style and colour you selected. Now click a second point and drag the mouse; the area will now have a fill: You can continue to add as many points as you require. When you have finished your area, double-click to finish. The area will now be filled, including any changes you made to line type, line colour, fill colour and transparency. D11124 v1.1 Apr 2014 Page 20 of 38 To draw a free-form shape, click on the drop-down arrow on the draw a line button, found under Draw and Create: Now click the ‘draw a free-form shape’ button (it will turn white when active). Once you have clicked on the button, the curser will have a blue circle on it: . To draw your area, click and hold the left mouse button and drag the mouse around the screen, and the area will begin to draw. NOTE: the colour of the line when you are plotting will be blue; once your line is complete, it will be shown with the style and colour you selected. When you have finished, release the mouse and the area will be drawn, including any changes you made to line type, line colour, fill colour and transparency: You can edit the outline and fill colour, line style and transparency level, once you have drawn your area. See section 8 for more details. D11124 v1.1 Apr 2014 Page 21 of 38 7.5 Draw a fixed shape area You can draw seven different fixed shape areas using this tool. Prior to drawing your area, you can select a line type, outline colour, fill option and transparency. See section 7 for more details. To draw your fixed shaped area, first select the shape you want to draw. Click on the drop-down arrow on the fixed shape area button: (the default is set to draw a circle), you can then select one of the shapes below: To draw your area, select the shape you require and click and hold the mouse. Now drag the mouse to increase/decrease the size of the shape. Once you have drawn the shape to the size you require, release the mouse button. You can edit the outline and fill colour, line style and transparency level once you have drawn your area. See section 8 for more details. D11124 v1.1 Apr 2014 Page 22 of 38 7.6 Using the buffer tool A buffer tool allows you to create circles and linear bands, to enable you to do spatial analysis. To use the buffer tool, click on the buffer tool button box can be moved by clicking and holding on it): . The buffer tool dialogue box will open; (this You have two options available, Point and Line. To select one of these, click on the radio button next to it. The drop-down box, gives you a list of distance options you can select; if you want a distance that is not shown on the list, you can manually enter one. You can also select if you want the distance in miles or kilometres. To draw a point buffer, select the distance from the drop-down list, or type the distance and then click on the point you want at the centre of your circle and it will be drawn automatically: D11124 v1.1 Apr 2014 Page 23 of 38 To draw a line buffer, select the distance from the drop-down list, or type the distance. This tool works exactly the same as the line drawing tool (see section 7.3). Once you have finished your line, the buffer line will be drawn. You can edit the outline and fill colour, line style and transparency level once you have drawn your area. See section 8 for more details. D11124 v1.1 Apr 2014 Page 24 of 38 7.7 Add an image This tool enables you to add images to your map. You can upload any image that is in JPG or PNG format. You can add photos that are saved on your computer or network. To add an image, click on the ‘add image’ button: and then click on the map where you want to place your image. A dialogue box will open: Click on browse; this will open another dialogue box, which will show the files on your computer: Now navigate to the location of the image you want to load (this may be on your machine or your network). Click on the file you want to use (this will appear in the box marked ‘File name’) and click open. The file name and location will be loaded into the first dialogue box, under image file location. To add your image, click on upload and the image will appear (right). You can click on the image to view it in a bigger window. You can also add a label to the photo; see section 7.8 for details. You can also move the image to another part of the screen. See section 8 for more details. D11124 v1.1 Apr 2014 Page 25 of 38 7.8 Add a label to an existing annotation This tool enables you to link a label to an annotation you have already added. Prior to adding your label, you can change the font, text size and colour. See section 7 for more details. Click on the add label tool this, a text box will open: . Now click on the annotation you want to label. When you have done Type your text in the box and click ‘Save’. The label will now be added. You can change the font, text size and colour after placing it. See section 8 for more details. NOTE: by adding a label this way, it will become an attribute of the annotation. You will be unable to move/delete the label independently without moving/deleting the annotation. 7.9 Add a measurement label Using this tool you can add a measurement label to either a line or an area. If you are measuring a line, you have the option to show the distance in miles or kilometres. For an area, the measurement is only shown in metric as m²/km². To add a measurement label to your line, once you have drawn your line, activate the measurement tool: then click anywhere on your line. You will then have the option to show the distance in either miles or kilometres. You can change the font, text size and colour, as well as move the label. See section 8 for more details. To add a label to your area, once you have drawn your area, activate the measurement tool: then click anywhere in the area. The area will be shown in m² or km², depending on size. D11124 v1.1 Apr 2014 Page 26 of 38 You can change the font, text size and colour, as well as move the label. See section 8 for more details. 7.10 Using the fade map tool This tool enables you to reduce the colour of the background map to make your annotations stand out. By clicking the tool, the background mapping will become slightly bleached. This tool works extremely well on printed copies. Non-faded printed version Faded printed version D11124 v1.1 Apr 2014 Page 27 of 38 8 Editing, moving and deleting your annotations Editing With any annotations you have added, you have the option to customise them after they have been added. To change an individual annotation, click on the ‘edit single annotation’ tool: . Then click on the item you wish to change. You can change your annotation using the customising options explained in section 7. If you are changing a label, the label text box will open, make your changes and then click on save. If you are changing a line or an area, click on the item; it will turn yellow, and then make the changes you require. When you have finished, click on the map and the item will be amended: Before edit After edit If you want to change the look of a group of labels, you can edit them as a group, by clicking on the edit multiple annotation tool: . You can click, hold and drag on the map to select the labels you wish to edit. A box will be drawn as below: Release the click, and you will notice that the text label will have a yellow circle any lines will turn yellow as well. This indicates that the items can now be edited as a group. Now make the changes you require to your group of items. Once you have finished editing, click anywhere on screen and your items will be changed. D11124 v1.1 Apr 2014 Page 28 of 38 Before edit After edit NOTE: this tool will change all the labels to the same specification. Moving items You can move text, shapes and photos that you have added to your map using the move tool. To move an annotation, select the move tool: click and hold on the annotation you want to move. You can now drag the annotation; to replace it on the map, release the click (see note at section 7.8 regarding labels). Deleting If you want to remove an annotation, or clear the map of all annotations, you can use the delete tools. To delete individual annotations, activate the tool: then click on the item you want to delete. If you want to clear you map of all annotations, use the button. A dialogue box will open asking you to confirm that you want to delete everything. Click yes to remove all annotations. D11124 v1.1 Apr 2014 Page 29 of 38 9 Using the measurement tool In section 7.9, you were shown how to use the measurement label tool. There is a secondary option for measuring distance and area. Using the measurement tool button: distance and area on the fly. you can measure Click on the tool and a dialogue box will open, giving you the option to measure a distance or an area: To measure a distance, click on the line icon (see above) then click on a point on the map and then drag the mouse. A purple line will appear and the distance will start to be calculated: Every left click will now add a point to your distance, enabling you to change direction. To complete your distance measurement, double-click and your distance will be shown in the dialogue box. You have the option to show the distance in miles or kilometres, by clicking in the box under distance: D11124 v1.1 Apr 2014 Page 30 of 38 To measure an area, activate the area button. Now click on the starting point of the area you want to measure and drag the mouse; a purple line will appear: Now click a second point and drag the mouse; the area will now have a fill: You can continue to add as many points as you require. When you have finished your area, double-click to finish. In the dialogue box, the area will be shown in metres or kilometres squared, depending on the size of the area you have measured. The area is only shown in metric: D11124 v1.1 Apr 2014 Page 31 of 38 10 Grid reference tools There are two grid references tools to use within the service. One shows a specific grid reference for a place of your choice, the other overlays the National Grid lines. Using the grid reference tool, you can get a very accurate grid reference for any point on the map. This can vary from two figures on the MiniScale® maps, right through to ten figures when at the largest scale of mapping. The tool can be found in the main toolbar. Click on the tool: and then click on the map and the grid reference will be shown. You can only show one grid reference at a time. To place the National Grid overlay on your map, simply click the icon: found in the main toolbar. The overlay will then be shown on your map. When the map is fully zoomed out, it will show the whole grid: As you zoom into the map, the overlay will show gridlines with the prefix. D11124 v1.1 Apr 2014 Page 32 of 38 11 Saving, opening and deleting your saved maps Using the ‘save current map’ option, you can save a map in order to come back to it later in your next class, or to share with teachers and other pupils. If you have added your own annotations, they will also be saved when you save your map. You have the option to add a title, pupil name and class. The ‘save current map’ icon can be found in the main toolbar. Click on the: a dialogue box: icon; this will open Enter the information in the boxes, then click ‘save’. To open your saved maps, click on the ‘open a saved map’ icon: . This will open a dialogue box showing all the maps that have been saved under your login: You can order the list of the maps by clicking on Title, Name, Class or Date. You can alternatively search, using the boxes by the same criteria. Click on the map you require and this will load on the map screen; now click ‘Close’ to close the dialogue box. You can delete maps that have been saved on your login by using the Map Manager: D11124 v1.1 Apr 2014 Page 33 of 38 . Click on the icon and you will be prompted for a pin number (this will be with the primary contact for your school). Enter the PIN number, click OK and a dialogue box will open showing all the maps you have saved: To delete a map, simply click in the box under ‘Delete’ and click the green ‘delete’ button. You will then be prompted to confirm deletion of the map; click OK to remove it from your saved files. D11124 v1.1 Apr 2014 Page 34 of 38 12 Printing your maps Any map you view on-screen can be printed; this includes any annotations you add to your on-screen map. The ‘Print’ dialogue box is found on the main page: Using the drop-down boxes and text boxes, you can easily create the map you require. By clicking on the drop-down boxes, you can select: the map format – either PDF or JPG; map size; either A4 or A3; and layout, either landscape or portrait. You can preview on-screen the area that your printed map will cover. By clicking the ‘show print extent’ tick box. The extent will show your map coverage at A3 or A4, and the orientation. Q. Why is the distance between grid lines on my printed 1:50 000 scale map 19 mm and not 20 mm? A. This happens if you choose ‘scale to fit paper’ option when printing a PDF map using Adobe® Reader®. Set Page scaling to none (or scale = 100%) to ensure that the correct scale of your map is maintained when printed. D11124 v1.1 Apr 2014 Page 35 of 38 You can move the centre of the map, by clicking and dragging the outline box. The red circle depicts where the centre of the map is. You can also zoom in and out to change the scale of the map. You can lock the print box, by clicking on the ‘Lock/Unlock’ tick box. You can unlock the area again, by removing the tick. NOTE: once the ‘lock’ tick box is ticked, you can still zoom in and out of the map, but the map will print at the scale you have locked it at. By checking the ‘Add Grid Lines’ box, your map will be printed with gridlines and eastings and northings. You can add a title to your map and your name. Once you have selected the map using the boxes, click on ‘make printable map’. Your printable map will be generated and you will be prompted to open the file in another programme (for example, Adobe® Reader® for a PDF file). Select the required programme and click OK. Depending on your browser settings, it will either open in a browser window or as a file. D11124 v1.1 Apr 2014 Page 36 of 38 You can also save the map to your local computer or network. Your printed map will include: scale; scale bar; date and time; school details; any name you added; and any title you added. D11124 v1.1 Apr 2014 Page 37 of 38 D11124 v1.1 Jan 2014 Page 38 of 38