1
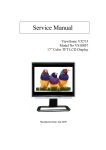
National Adult Social Care Intelligence Service (NASCIS) Online Analytical Processor (OLAP) User Guide Adult Social Care Statistics Published October 2014 Version 3.0 1 Copyright © 2014, Health and Social Care Information Centre. Contents 1 2 3 4 5 2 Introduction 4 1.1 Purpose 4 1.2 Background 4 1.3 Access and authentication 4 1.4 Browser performance 5 1.5 User support 5 Accessing the System 6 2.1 The NASCIS Website 6 2.2 The NASCIS Data Resources 7 2.3 Login screen 8 2.4 Selecting the required data set 10 2.5 Selecting the required table from the data 11 The OLAP screen 12 3.1 Rows, columns and filters 14 3.2 Measures and dimensions 14 3.3 Viewing pre-release access data 15 3.4 Query metadata 15 Building a query 16 4.1 Selecting rows and columns 16 4.2 Changing between grid and chart views 17 4.3 Filters 19 4.3.1 Choose the required dimension to filter 19 4.3.2 Drilling down to select a filter value 19 4.3.3 The filtered chart 20 4.3.4 Selected filters 21 Customising icons 22 5.1 Exporting and copying data to Excel 22 5.2 Pivot the data 23 5.3 Clear the data 24 5.4 Toggle the view total 24 5.5 Saving your query 25 Copyright © 2014, Health and Social Care Information Centre. NASCIS Online Analytical Processor (OLAP) User Guide 6 Joint Strategic Needs Assessment (JSNA) 26 6.1 Background 26 6.2 Some differences to other data in OLAP 26 7 User Experience Survey (UES) 28 7.1 Background 28 7.2 How to create UES data views using NASCIS 30 7.3 How to use NASCIS to check response rates 35 7.4 Non responses to survey options on NASCIS 36 7.5 Important information and limitations 36 8 Adult Social Care Outcomes Framework (ASCOF) 37 8.1 Background 37 8.2 OLAP components 37 8.3 Regional and England measures 38 8.4 Unavailable measures 38 9 Miscellaneous 39 9.1 Default year 39 9.2 Percentage measures 39 9.3 Rounding and suppression 39 9.4 Estimates 39 9.5 Comparators 40 41 9.6 Totals 42 9.7 Population estimates 43 9.8 Guidance updates 43 9.9 Additional table notes 43 10 47 10.1 Release summary 47 10.2 Data currently available to view 52 11 3 Data releases Functionality changes 58 Copyright © 2014, Health and Social Care Information Centre. NASCIS Online Analytical Processor (OLAP) User Guide 1 Introduction 1.1 Purpose This document provides guidance on using the NASCIS interactive online analytical processor, or OLAP. It provides information to get a new user started, rather than attempting to explain every possible report combination. 1.2 Background The NASCIS OLAP is an online service that provides quick, easy and flexible access to a wide range of social care information. It was developed by the Health and Social Care Information Centre (HSCIC), in conjunction with key partners. The OLAP will enable users to undertake a wide range of analyses based on an authoritative, common set of data for performance management and benchmarking purposes. Users will be able to make selections, view comparisons, create tables and generate graphs in a flexible way. It is an important means by which the HSCIC makes aggregated data available to the health and social care community. It has a flexible graphical interface and is accessible via an internet browser. It encompasses: Fast navigation around screens and sub screens for experienced users Intuitive or explanatory navigation for inexperienced users Help facilities within the resource Granular security to ensure that users who are authorised to access Social Care data will not be able to access the other data domains. All client PCs running Internet Explorer 6 and above over a broadband or better link will be able to access the reporting tool. Other browsers may be used, though minor visual defaults may result. 1.3 Access and authentication Access to the NASCIS Data Resources will be made available to all users in the public domain by a self-registration process on the Data Resources page. Users accessing the NASCIS Data Resources require a ‘Single Sign-on’ username and password to login to the system. This will give access to both the OLAP and Standard Reports. The user ID authentication will be administered by our Contact Centre. Users can register for an account by completing the self-registration form in which they will have to specify a username and password, amongst other details such as name and email address. Once registered and the account has been activated the user will then have secure access to the NASCIS Data Resources. 4 Copyright © 2014, Health and Social Care Information Centre. NASCIS Online Analytical Processor (OLAP) User Guide Throughout the release cycle of data within NASCIS, there are times where local authority users have pre-release access to the data for management information purposes. This is done to provide councils with up-to-date information, however this data will either be part of the full set of data or still be going through formal validation checks. Access to this data is strictly managed, and must be applied for each year via an authentication process. If you have any queries regarding the user registration process please use the HSCIC’s Contact Centre on 0300 303 5678 or via email at [email protected] 1.4 Browser performance The latest version of Microsoft Internet Explorer 10 is not currently compatible with the current OLAP – resulting in an inability to drag dimensions and measures, as well as altering the layout of the page, resulting in the tabs of the NASCIS site being pushed on to two rows. This is something we will be addressing in a future release, however if you are using IE10, there is a solution that will enable the OLAP to work correctly. On the IE10 address bar you will see a small icon for compatibility mode. Clicking on this will enable compatibility mode and allow you to use the OLAP in IE10 without any further problems. 1.5 User support The first point for user support on queries regarding the OLAP will be provided by the HSCIC’s Contact Centre, who should be able to answer most queries. They can be contacted by phoning 0300 303 5678 or by emailing [email protected]. You can also contact the HSCIC for support and information by clicking on ‘Contact us’, which is shown at the top of each screen. In some cases enquiries will then be passed to the Social Care team, if they relate to the system, or need input from the relevant expert on the Social Care data, if the enquiry is data related. Guidance notes and updated information will be made available on the NASCIS web site. 5 Copyright © 2014, Health and Social Care Information Centre. NASCIS Online Analytical Processor (OLAP) User Guide 2 Accessing the System 2.1 The NASCIS Website https://nascis.hscic.gov.uk/ The NASCIS OLAP is available on the NASCIS website, simply click on the NASCIS Data Resources tab or section header to access data. 6 Copyright © 2014, Health and Social Care Information Centre. NASCIS Online Analytical Processor (OLAP) User Guide 2.2 The NASCIS Data Resources The NASCIS OLAP is one of a number of applications which can be accessed from this page. Click on the ‘NASCIS Online Analytical Processor’ link indicated by the red arrow. 7 Copyright © 2014, Health and Social Care Information Centre. NASCIS Online Analytical Processor (OLAP) User Guide 2.3 Login screen If you do not have an account you can register for one by clicking the Register button and following the on-screen instructions. Enter your username and password. If you have forgotten your details, you do not have to register again, instead click the ‘Forgotten details?’ link. 8 Copyright © 2014, Health and Social Care Information Centre. NASCIS Online Analytical Processor (OLAP) User Guide This will take you to a screen where you can request either your username, password or both. 9 Copyright © 2014, Health and Social Care Information Centre. NASCIS Online Analytical Processor (OLAP) User Guide 2.4 Selecting the required data set Once you have logged on you will see the screen above, displaying the currently available Social Care datasets. For this example click on ‘RAP’ from either the side menu or collections list. 10 Copyright © 2014, Health and Social Care Information Centre. NASCIS Online Analytical Processor (OLAP) User Guide 2.5 Selecting the required table from the data This screen lists the various data sets within RAP and gives a brief explanation of the information available. A shortcut is also available to each data set from the left hand menu. The datasets include the latest provisional or final data plus historical data for 2005-06 onwards where available. Each menu of data will show when a table was introduced or ceased within the time-period of data available on OLAP. Select P1 (Number of clients receiving services during the period) from the left hand menu, this will take you to the main OLAP screen which is where you select the required data to build your report. 11 Copyright © 2014, Health and Social Care Information Centre. NASCIS Online Analytical Processor (OLAP) User Guide 3 The OLAP screen Work Area: Measures & Dimensions are ‘dropped’ into this area The screenshot above is a working example of the main OLAP query screen, using RAP P1 data. The drop down menu allows user to navigate between tables within the same screen. There are two sections to the screen: 12 The top section (marked by the red box) is the Work Area. It enables the user to build reports by selecting Measures and Dimensions from the left and ‘dragging and dropping’ them onto the ‘Filter’, ‘Rows’ and ‘Columns’ areas on the right. The bottom section (marked by the purple box) is where the resulting grids (i.e. tables of data) and charts (i.e. graphical representations) are displayed. Copyright © 2014, Health and Social Care Information Centre. NASCIS Online Analytical Processor (OLAP) User Guide Users can select a council’s comparator group Measures for selection (selected items are greyed out) Dimensions for selection The list of Dimensions and Measures for selection as Filters, Rows and Columns will be different for each social care data set that you are analysing. The example above shows those used for the RAP data and shows a grid of the Total Number of Service Users broken down by Primary Client Type, Aged 65+ in Yorkshire & Humber, in 2012-13. The ‘+’ symbol against items shows that you can drill down to lower levels of detail for selection. These are shown against measures and dimensions in the Work Area and also against certain items on the grids and charts. If you click on the ‘expand next level’ button, all drill downs will be expanded to show the lower level. The buttons here will select or deselect all the items within the selection window. The left hand button will select them all, the second button will deselect them. Buttons three to six expand and contract the levels. The double arrows will open (and close) all the items with a + next to them and show the next drill down level You can also select or deselect manually 13 Copyright © 2014, Health and Social Care Information Centre. NASCIS Online Analytical Processor (OLAP) User Guide Similarly, if you click on selected measures and dimensions on the right side of the Work area a drop down list can be accessed to select particular values for the dimension (e.g. to show Mental Health service users only from Client Type dimension). Dimensions and measures that have been added to the work area have been greyed out for ease of use. 3.1 Rows, columns and filters Rows define the values in the rows of a grid and these values are displayed on the horizontal axis of charts. Columns define the values in the columns of a grid. Filters define the scope of the values to be included (e.g. “Only include councils in the East Midlands”) 3.2 Measures and dimensions Measures are the items that you are counting and will vary depending on the data set you are querying. Example measures for the Social Care data include ‘Number of Service Users’, ‘No. of service users per 100,000 population’, ‘% Change Year on Year’ and ‘% Distribution’. Please note that the ‘No. of service users per 100,000 population’ measure is specific to the age-band selected, i.e. Age band 18-64 will use the 18-64 mid-year population estimate for that year. The total population figure used is for ages 18 and over. Please note for any query to fetch back data for tables or charts, a ‘Measure’ must be present in your query, this in effect tells the OLAP what data to show. Measures should only be placed in ROWS or COLUMNS only, not Filters. Dimensions give meaning to the measures by allowing you to break the counts down. For example, allowing you to show Number of Service Users broken by Age Group, Client Type, Service Type, etc. Again, these will vary depending on which data set you are analysing. 14 Copyright © 2014, Health and Social Care Information Centre. NASCIS Online Analytical Processor (OLAP) User Guide 3.3 Viewing pre-release access data Local authority users who have pre-release access to ‘Restricted’ data in the OLAP will see an extra drop-down box above their OLAP toolbar. They will be able to select restricted data and see whatever data is available to them during the pre-release periods. For security purposes, the default view for all users is Published and any queries that are saved in the Published view will have to be recreated on Restricted. Please see section 5.5 of this guide for further information on saving queries. 3.4 Query metadata As further information about the query you have created, a date and time of creation is placed on screen below the Grid/Chart area. This will allow you to determine when the query was run and what filters were applied to the query. This information will tell you how up to date your query is, so that you can re-run the query if the OLAP has been updated. 15 Copyright © 2014, Health and Social Care Information Centre. NASCIS Online Analytical Processor (OLAP) User Guide 4 Building a query 4.1 Selecting rows and columns To define a report (e.g. table to show Total Number of Service Users by Age): 16 Left click on year and drag into filters, this will automatically select the latest year. Click into year to change the year range to an historical single date Left click on Area and drag into the Rows box, then click on ‘Area:Total’ in the Rows box and select Yorkshire & Humber councils only Left click on Number of Service Users from the Measures list on the left and drag the item across to the Columns box; Click on the ‘+’ symbol to expand Yorkshire & Humber on the grid Copyright © 2014, Health and Social Care Information Centre. NASCIS Online Analytical Processor (OLAP) User Guide 4.2 Changing between grid and chart views To change the view from grid (table) to a chart (graphical), click on the ‘Chart’ tab. A number of Chart types will produce different views depending on the data you are querying. The screenshot below shows a Bar Chart. 17 Copyright © 2014, Health and Social Care Information Centre. NASCIS Online Analytical Processor (OLAP) User Guide Line Charts and Stacked Bar Charts are also available to choose depending on the data you are viewing. The above example shows a line chart displaying the number of service users in receipt of Home Care on the last day of the year, for 3 councils, from 2008-09 to 2012-13, taken from the RAP P1 table. 18 Copyright © 2014, Health and Social Care Information Centre. NASCIS Online Analytical Processor (OLAP) User Guide 4.3 Filters 4.3.1 Choose the required dimension to filter Using the RAP P1 query, remove year from filter and drop Service Type from the left into the Filters box. 4.3.2 Drilling down to select a filter value Open the drop-down list by clicking on the ‘Service Type: Total’ in Filters, which will bring up a view like this. Select the required value (e.g. Residential Care) and click OK. Additionally add ‘Year’ to the Rows, select 2012-13 and expand the Area to show all councils in Yorkshire & Humber. 19 Copyright © 2014, Health and Social Care Information Centre. NASCIS Online Analytical Processor (OLAP) User Guide 4.3.3 The filtered chart Clicking on the Chart tab and selecting Bar Chart from the drop down chart menu will show your filtered data as above, in this example Residential Care only. 20 Copyright © 2014, Health and Social Care Information Centre. NASCIS Online Analytical Processor (OLAP) User Guide 4.3.4 Selected filters For additional information, whenever filters are used, the filters that have been applied to the query are displayed at the end of the query. Please note that this only displays in the Grid layout and not the chart. 21 Copyright © 2014, Health and Social Care Information Centre. NASCIS Online Analytical Processor (OLAP) User Guide 5 Customising icons There are several icons at the top of the screen. This section shows how they can be used. Hovering over each icon provides a brief explanation. 5.1 Exporting and copying data to Excel Data in the views (i.e. charts and grids) can be exported into a spreadsheet for further analysis. Click on the ‘Save current view to disk’. (i.e. the first icon on the customising icon row), and then click ‘Open’ to view, or ‘Save’ the data. The file is saved with an .xls extension so it can be opened in any version of Microsoft Excel you are using. Similarly you can copy the data to the clipboard (second icon along) and paste the contents into Excel. The first screen shot below shows a ‘Paste as text’ option, the second shows a ‘Paste’ option (which retains text wrap and merge cell formats). 22 Copyright © 2014, Health and Social Care Information Centre. NASCIS Online Analytical Processor (OLAP) User Guide Please note that because the file is saved via the NASCIS website you may get the following notice when opening the file: The file you are trying to open Export.xls is in a different format than specified by the file extension. Verify the file is not corrupted and is from trusted source before opening the file. Do you want to open the file now? This happens as the file contains web-space formatting, however it is safe to proceed and click yes. Once you have the file open, you can save it with a different file name. 5.2 Pivot the data The third icon allows the data in the chart or grid to be pivoted. On a grid it swaps the dimensions in the Columns with the Rows, and swaps the row values with the columns. The above example shows the results of the use of the Pivot function on a grid. 23 Copyright © 2014, Health and Social Care Information Centre. NASCIS Online Analytical Processor (OLAP) User Guide 5.3 Clear the data The fourth icon along simply clears the current view, creating a blank template to create a new query. 5.4 Toggle the view total The icon fifth from the left of the Customising Bar allows you to switch or ‘toggle’ the totals at the foot of the grid, on or off, with on highlighting the Σ in orange. Please see example below – the first diagram shows totals on, the second has totals turned off. 24 Copyright © 2014, Health and Social Care Information Centre. NASCIS Online Analytical Processor (OLAP) User Guide 5.5 Saving your query This is a feature which has been added following the feedback from recent NASCIS User Workshops. The ‘Save View’ icon allows you to save the query you have built for future use. Saved queries can then be accessed in the Views part of the OLAP Work Area. These are area specific so any views saved for RAP P1 will only show when you are viewing the RAP P1 data. The view name is also shown in the metadata underneath the grid / table. If you have access to the pre-release data, any views you have saved in Published will need to be recreated in Restricted, as they will not transfer over between views. 25 Copyright © 2014, Health and Social Care Information Centre. NASCIS Online Analytical Processor (OLAP) User Guide 6 Joint Strategic Needs Assessment (JSNA) 6.1 Background Joint Strategic Needs Assessment (JSNA) is a process that helps identify current and future health and wellbeing needs of a local population, informing the priorities and targets set by Local Area Agreements, leading to agreed commissioning priorities that will improve outcomes and reduce health inequalities. key JSNA indicators from the current dataset are provided through NASCIS, covering domains including demography, social and environmental context, lifestyle and risk factors, burden of ill-health and services. 6.2 Some differences to other data in OLAP The Areas for which to view the JSNA data are split into ‘Health’ and ‘Administrative’ geographic areas whilst the Indicators are split by theme and sub-theme e.g. Burden of ill health>Cancer. Each indicator also contains a code for the latest period of data that is available, in the following format X##. X shows the time period (C is calendar year and F is financial year) ## shows the year, so for example C11 is calendar year 11 (2011). The Period dimension (fig4) shows the data period for time series analysis. This enables you to choose how far back from the data period you wish to view, hence Latest Period -1. This is dependent on the availability of historical data for the indicator(s) in your query. Fig4 - Period There are a number of measures available to complete your query, again dependent on the information available. The default setting for the JSNA indicators is Rate, but where possible Numerator and Denominator are also available to show the underlying data. Additionally statistical confidence intervals (CIs) are available, where these have been calculated for any indicators. 26 Copyright © 2014, Health and Social Care Information Centre. NASCIS Online Analytical Processor (OLAP) User Guide Fig5 - Measures Please note that where the indicator is an actual figure, this will show under the Numerator measure. For further information please consult the metadata, available in the JSNA section of the NASCIS website. The most efficient way to view the indicators in the processor is by placing the ‘Indicator theme’ dimension in ‘Rows’ and the ‘Area’ dimension in ‘Columns’. It is recommended that you choose your specific area prior to dragging on ‘Measures’ (which will render the grid). 27 Copyright © 2014, Health and Social Care Information Centre. NASCIS Online Analytical Processor (OLAP) User Guide 7 User Experience Survey (UES) 7.1 Background The information available via NASCIS for Social Care User Experience Survey provides information on outcomes for users which can be used to contextualise some of the information provided from other returns. For example, ‘Are the home care users identified via RAP happy with their home care service?’ The UES data currently available in NASCIS is the: ‘Adult Social Care Survey’ (Beta) ‘Survey of Adult Carers In England’ ‘Home Care Survey 2008-09’ The main difference to the other social care data is that the UES data is at individual level so any cross-analysis of questions or demographics is possible, i.e. you are not restricted to the way in which the proformas are constructed as in the other returns. The data is available to view as counts and also as percentages, although please bear in mind small numbers when looking at percentages, e.g. where the query is based on 10 people, each representing 10%. Perhaps the most useful way of analysing the survey data is by looking at the percentage distributions for the survey questions, or by sample demographics. See example below for Q4 of the Home Care survey, which asks home care users in the Yorkshire and Humberside region “Do your care workers do the things that you want done?” 28 Copyright © 2014, Health and Social Care Information Centre. NASCIS Online Analytical Processor (OLAP) User Guide The OLAP will allow you to filter the dimensions, for example to omit non-respondents when looking at percentage distributions for a particular question. Using the previous example simply click on the ‘Q4: Total’ dimension in the Columns area and deselect those data items you do not wish to view e.g. non-respondents to the survey, or any number of the responses to the question itself. Omitting non-respondents from the percentage calculation is the standard way to look at survey data (unless you are of course interested in how many people failed to respond). Cross analysis (often referred to as cross-tabulation) of questions is also possible using the OLAP Tool, for example for the Home Care survey you could view whether or not seeing the same care workers (Q8 from top to bottom) affects overall satisfaction with home care services (Q1 left to right across the top of the table). The Adult Social Care User Survey provides information on service user satisfaction with the care services they receive. The information available on NASICS compliments the published data in the reports as it also allows the user access to information on survey administration and non-responses relative to demographic and area information. This could be used by survey administrators to compare response rates among certain demographic groups for example. The data for separate years are held on NASCIS as individual views. 29 Copyright © 2014, Health and Social Care Information Centre. NASCIS Online Analytical Processor (OLAP) User Guide 7.2 How to create UES data views using NASCIS An example view of user satisfaction by age demographic as a % of Row Distribution. Drag and drop the Question you require into the rows. Left click the question once it is in the column box and it will bring up a pop-up menu. Drag and drop the attribute to compare against (for example Demographic – Primary Client Group, or Services Received) into the column box. You can left click the attribute once it is in the row box and un-tick the box for “missing”. Drag and drop the ‘% Row Distribution’ measure into the row section. It will be displayed as ‘Measures’ once placed. This will then distribute the figures as a % of the total for the responses for the age group. For example the percentage of respondents in the 65-74 age bracket is 14.2% of the respondents who answered they were very satisfied for question 1. The above figure shows a completed view following the above method and the grid produced. 30 Copyright © 2014, Health and Social Care Information Centre. NASCIS Online Analytical Processor (OLAP) User Guide An example view of user satisfaction by age demographic as a % of Column Distribution. Drag and drop the Question you require into the rows. Left click the question once it is in the column box and it will bring up a pop-up menu. Drag and drop the attribute to compare against (for example Demographic – Primary Client Group, or Services Received) into the column box. You can left click the attribute once it is in the row box and un-tick the box for “missing”. Drag and drop the ‘% Column Distribution’ measure into the row section. It will be displayed as ‘Measures’ once placed. This will then distribute the figures as a % of the total for the responses for the question. For example, the percentage of respondents who answered they were very satisfied for question 1 bracket is 13.1% of the total number of people aged 65-74. The above figure shows a completed view following the above method and the grid produced. 31 Copyright © 2014, Health and Social Care Information Centre. NASCIS Online Analytical Processor (OLAP) User Guide An example view of user satisfaction by primary client type demographic as a % Distribution. Drag and drop the Question you require into the rows. Left click the question once it is in the column box and it will bring up a pop-up menu. Drag and drop the attribute to compare against (for example Demographic – Primary Client Group, or Services Received) into the column box. You can left click the attribute once it is in the row box and un-tick the box for “missing”. Drag and drop the ‘% Distribution’ measure into the row section. It will be displayed as ‘Measures’ once placed. This will then distribute the figures as a % of the grand total for the each component of the responses for the question. For example, the percentage of respondents who answered they were very satisfied for question 1 in the 65-74 age bracket is 1.7%. The above figure shows a completed view following the above method and the grid produced. 32 Copyright © 2014, Health and Social Care Information Centre. NASCIS Online Analytical Processor (OLAP) User Guide The pop-up menu displayed when clicking on an attribute Un-tick the “Did not receive a model questionnaire”, “Non response to the whole survey” and “Non response to this question” boxes as shown in figure 4. Omitting non respondents is the standard way to view survey data, unless you want to check how many people failed to respond. The table should automatically generate. Any question or attribute can be substituted for the ones used. Examples of use include checking to see levels of satisfaction among different ethnic groups, client types or service users. 33 Copyright © 2014, Health and Social Care Information Centre. NASCIS Online Analytical Processor (OLAP) User Guide An example view of the data in the same style as the published annex tables, by area as a % of row distribution The above shows a typical view showing a question by area, as in ‘U1 - Answers by Council’ of the annex tables that are published with the ASCS reports Drag and drop ‘area’ from the left hand field into the rows. Left click ‘area’ once it is in the row box and you can select either the region, or drill down into the region. To do this, click on the + next to Eastern, then click the select all button, which is the first button on the left at the top. Then click on the checkbox next to Bedfordshire (610) to deselect this council and click OK. Drag and drop the % Row Distribution measure from the left-hand field into the rows. Drag and drop the Question you require from the left-hand field into the columns. Left click the question once it is in the column box to bring up a pop-up menu. Click on the + next to Q1 to drill down to the question responses. Click the select all button, then un-tick the “Did not receive a model questionnaire”, “Non response to the whole survey” and “Non response to this question” boxes. 34 Copyright © 2014, Health and Social Care Information Centre. NASCIS Online Analytical Processor (OLAP) User Guide Omitting non respondents is the standard way to view survey data as created in the annex table, unless you want to check how many people failed to respond. The table should automatically generate as the above image, in alphabetical order of council. Note you can select as many or as few of the areas and or question responses as you wish. 7.3 How to use NASCIS to check response rates An example response rate view, comparing response rates to question 1 between ethnic groups in Croydon Drag and drop ‘area’ or an attribute from ‘demographics’ from the left-hand side field. If you wish to look at a certain demographic in an area, you can drag and drop area into the ‘filters’ field and then click it to bring up a menu in which you select the area to filter by. Drag and drop the % Row Distribution measure from the left hand field into the rows. Drag and drop the Question you require from the left hand field into the columns. To interpret these results, you should sum the percentage of people who responded to each answer of the question (in the picture above this would be the sum of all of the respondents to ‘I am extremely satisfied’ to ‘I am extremely dissatisfied’ and then use this as the percentage of people who responded to the survey. Figure 5 above shows an example of response rate compared between different ethnic groups in the Croydon area of London. 35 Copyright © 2014, Health and Social Care Information Centre. NASCIS Online Analytical Processor (OLAP) User Guide 7.4 Non responses to survey options on NASCIS To check for non-response to the survey questions in OLAP, users should add “nonresponse to question”, “non-response to questionnaire” and “did not receive questionnaire” options by the area category, and applying the % row distribution measure, a sensible table will be produced. The row % totals will add up to 100%. The same is applied when exploring non-response by demographic. However, it should be noted that the answer percentages within this table are not consistent with the published percentages as it takes into the account the total number of people who answered and did not answer the survey and so this will lower the percentage for people who answered the question, despite the actual total number of answers for each being the same. This data could be used to asses if certain areas, ethnic groups or client types are more disinclined to answer the questionnaire 7.5 Important information and limitations NASCIS displays information relating to the primary and secondary client type demographic groups. This is slightly different to the client type demographic group displayed in the published results (which is composed of the combined primary and secondary client type data). Due to this, any grids made using primary or secondary client will not exactly match the client type data in the annex tables as these are a combination of the two groups. The other known limitations not previously mentioned are that not all questions are able to be cross compared in a meaningful way and caution is needed to compare data between 2010-11 and 2011-12, due to different questions between years. 36 Copyright © 2014, Health and Social Care Information Centre. NASCIS Online Analytical Processor (OLAP) User Guide 8 Adult Social Care Outcomes Framework (ASCOF) 8.1 Background Adult Social Care Outcomes Framework (ASCOF) is a set of outcome measures, which have been agreed to be of value both nationally and locally for demonstrating the achievements of adult social care. Nationally, the ASCOF will give an indication of the strengths of social care and success in delivering better outcomes for people who use services. Locally, one of the key uses of the ASCOF is for ‘benchmarking’ and comparison between areas. The ASCOF is not a national performance management tool. The ASCOF definitions handbook was first launched on 31 March 2011, and updated annually for the year of reporting. Definitions handbook and supporting material can be found at: https://www.gov.uk/government/publications/the-adult-social-care-outcomes-framework2013-to-2014 8.2 OLAP components Categories and measures Measures: Numerator Denominator (council systems only) Outcome (percentage) - is the main outcome measure for benchmarking Base (surveys only) Year – financial years (some indicators will not have data for 2011/12, 2013/14) Area – CASSR administration area (152 in England) Outcome ID – range of outcome indicators and levels of disaggregation 37 Copyright © 2014, Health and Social Care Information Centre. NASCIS Online Analytical Processor (OLAP) User Guide Outcome category disaggregation Disaggregation categories include: Gender Age band Client Type Client and Carer 8.3 Regional and England measures Regional outcomes measures are not currently available for 2011/12 data. England totals and outcome measures are subject to change and refinement. 8.4 Unavailable measures The following outcome measures were unavailable for 2011-12 and 2013-14, when the carers survey data was unavailable: 1D - Carer-reported quality of life 3B - Overall satisfaction of carers with social services 3C - The proportion of carers who report that they have been included or consulted about the person in care 3D - The proportion of people who use services and carers who find it easy to find information about services (carers element). 38 Copyright © 2014, Health and Social Care Information Centre. NASCIS Online Analytical Processor (OLAP) User Guide 9 Miscellaneous This user guide has been written to assist users who are new to the NASCIS OLAP and also as a point of reference as to how to perform basic queries on the system. Every possible report combination is not described as it is likely that users will develop their own way of using the OLAP to get the reports they want. Experimenting with the drag and drop process is encouraged to arrive at a point where the user can display the information in a way that best suits them. 9.1 Default year Please note the default ‘Year’ for running queries is the latest year – currently 2013/14 (as at October 2014). If you choose not to drag and filter the ‘Year’ Dimension from the left-hand menu, then the grid/chart will display the latest available data. 9.2 Percentage measures The percentage measures are based on the underlying raw data, not the rounded data as shown on the tables and charts. 9.3 Rounding and suppression All numerical values presented in the OLAP tables (with the exception of ASCOF data1) are rounded to the nearest five and may not sum to totals because of rounding. Rounding of small numbers will mean that 0 may not be a true 0, as it may be a low number that has been rounded down. For example: 4 is rounded to 5 3 is rounded to 5 2 is rounded to 0 1 is rounded to 0 As of November 2010, values of five or less are no longer suppressed. 9.4 Estimates Where councils have not provided complete information, estimates have been made by calculating proportions based on data reported by councils who have provided a complete return. These estimates have been used to provide grossed up national figures for England, but are not published at council level. The OLAP table will display council estimated data as ‘blank or ‘missing’. National and Regional totals should be considered as estimates. 1 Details of the rounding and suppression rules applied to ASCOF data are shown beneath the OLAP grid on the ASCOF page. 39 Copyright © 2014, Health and Social Care Information Centre. NASCIS Online Analytical Processor (OLAP) User Guide 9.5 Comparators One of the key features of the NASCIS OLAP is the ability for the user to compare council data against its comparators. There are a number of comparator groupings available as described below. To select a comparator group, first build your query on the grid by dragging dimensions and measures across (selecting one council). Then open the comparator drop down list show here and select the comparator type you want and then the council of interest. This will then display your chosen measures and dimensions for that council and its comparator group based on the comparator group type you have selected. Please note, comparator groups will not work if you are using the Area dimension as a filter. Area must be placed in rows or columns. Chartered Institute of Public Finance and Accountancy (CIPFA) comparator groups The Chartered Institute of Public Finance and Accountancy (CIPFA) comparators should be used for Social Care activity data such as RAP (Referrals, Assessments and Packages of care) and ASC-CAR (Adult Social Care Combined Activity Return). Each council has 15 CIPFA comparator councils which have been determined using ‘nearest neighbours’ methodology. This means for each council, the 15 councils which are most similar based on a number of characteristics are included in its comparator group. This results in each council having a unique comparator group. Please note we have the comparator groups at 2009 and 2010 which reflects changes in the councils. LA Council Type 1 Metropolitan Districts, Principle Metropolitan Cities, Shire Counties, London Boroughs Inner and Outer, and Unitary Authorities LA Council Type 2 Metropolitan Districts, Shire Counties, London Boroughs and Unitary Authorities Primary Care Trust (PCT) Office of National Statistics (ONS) Cluster Primary Care Trust (PCT) groupings are available to compare JSNA Indicator data. Area Cost Adjustment (ACA) comparator groups The Area Cost Adjustment (ACA) comparator groups should be used for Social Care expenditure data from the PSS-EX1 return. For the ACA comparator groups, each council has an ACA factor determined from a number of characteristics such as education, police, fire, highways, social care and geographic area. Councils are then split into four ACA comparator groups, which are shown below. 40 Copyright © 2014, Health and Social Care Information Centre. NASCIS Online Analytical Processor (OLAP) User Guide 2nd ACA Grouping 1st ACA Grouping 102 104 106 107 - 108 109 110 111 112 113 114 116 117 204 205 206 207 214 215 216 217 218 219 323 324 325 413 414 415 416 417 418 503 506 507 508 509 510 511 512 607 609 809 810 811 902 905 912 913 914 - 41 Cumbria Northumberland Gateshead Newcastle upon Tyne North Tyneside South Tyneside Sunderland Hartlepool Middlesbrough Redcar & Cleveland Stockton-on-Tees Durham Darlington Barnsley Doncaster Rotherham Sheffield East Riding Kingston-upon-Hull N E Lincolnshire N Lincolnshire North Yorkshire York Lancashire Blackburn Blackpool Staffordshire Stoke-on-Trent Herefordshire Worcestershire Shropshire Telford and Wrekin Lincolnshire Derbyshire Derby Leicestershire Leicester Rutland Nottinghamshire Nottingham Norfolk Suffolk Dorset Bournemouth Poole Cornwall Somerset Devon Plymouth Torbay 209 210 211 212 213 304 305 306 307 308 309 310 311 312 313 315 316 317 318 319 321 322 326 327 - 404 406 407 408 409 410 411 412 504 611 620 621 623 624 625 626 803 807 812 813 814 815 816 817 819 820 821 904 908 - 909 910 911 - Bradford Calderdale Kirklees Leeds Wakefield Bolton Bury Manchester Oldham Rochdale Salford Stockport Tameside Trafford Wigan Knowsley Liverpool Sefton St Helens Wirral Halton Warrington Cheshire East Cheshire West and Chester Warwickshire Birmingham Coventry Dudley Sandwell Solihull Walsall Wolverhampton Northamptonshire Luton Essex Southend Cambridgeshire Peterborough Bedford Central Bedfordshire Isle of Wight West Sussex Hampshire Portsmouth Southampton East Sussex Brighton & Hove Wiltshire Swindon Kent Medway Towns Gloucestershire Bath & N E Somerset Bristol North Somerset South Gloucestershire 3rd ACA Grouping 606 608 612 613 614 615 616 617 618 - 619 622 716 717 718 719 720 721 722 723 724 725 726 727 728 729 - 730 731 732 733 - 734 735 805 - Hertfordshire Oxfordshire Buckinghamshire Milton Keynes Bracknell Forest West Berkshire Reading Slough Windsor & Maidenhead Wokingham Thurrock Barking & Dagenham Barnet Bexley Brent Bromley Croydon Ealing Enfield Haringey Harrow Havering Hillingdon Hounslow Kingston-uponThames Merton Newham Redbridge Richmond upon Thames Sutton Waltham Forest Surrey 4th ACA Grouping 702 703 704 705 - 706 707 708 709 710 711 712 713 714 906 - Camden Greenwich Hackney Hammersmith & Fulham Islington Kensington & Chelsea Lambeth Lewisham Southwark Tower Hamlets Wandsworth Westminster City of London Isles of Scilly Copyright © 2014, Health and Social Care Information Centre. NASCIS Online Analytical Processor (OLAP) User Guide 9.6 Totals There are some interesting features with the totals, and what is displayed, following the header box structure, for example The column headers are grouped in boxes that show the subtotals of the relevant sections, as well as the total of all the component parts. If some of the components are removed, such as More than 2 weeks and less than or equal to 4 weeks and More than 4 weeks and less than or equal to 6 weeks, the final totals remain constant. This works however your query is structured, and provides a useful option for area comparisons. Council Region England Council figure(s) above Regional figure second from bottom row National (England) figure last row This will enable you to do comparison work without returning all the figures. It does not return a sub-total for the selected areas. 42 Copyright © 2014, Health and Social Care Information Centre. NASCIS Online Analytical Processor (OLAP) User Guide 9.7 Population estimates The 'per 100,000 population’ and ‘per 10,000 population’ measures in the NASCIS Online Analytical Processor are calculated using the relevant mid-year population estimates from ONS. Final social care data for 2013-14 uses 2013 mid year population estimates, 2012-13 uses the 2012 mid year population estimates and so on. Mid-year population figures are not available via the OLAP, but may be obtained from ONS. The latest mid-year population statistical dataset can be sourced from: http://www.ons.gov.uk/ons/rel/pop-estimate/population-estimates-for-uk--england-and-wales-scotland-and-northern-ireland/2013/stb---mid-2013-uk-population-estimates.html Population figures provided to us by ONS have not been weighted or age standardised. 9.8 Guidance updates This user guidance will be updated throughout the NASCIS development cycle. 9.9 Additional table notes 1. RAP Tables C1 and C2 Please note that there are two distinct age band dimensions on these tables for the ages of the carers and the ages of those cared for. Please ensure you have selected the age band dimension that you require. Additionally the Client Type on ‘Age of person cared for’ is available by expanding the dimension and drilling down. 2. NIS (National Indicator Set) Please note from Release 3 on 30th September 2009 the NIS displayed now includes indicators on Mental Health. For the 2010/11 release of NIS data, indicators NI128, NI132, NI133 and NI136 were dropped from collection. Additionally, NI127 was calculated using a new methodology and NI127 indicators for 2010/11 are not comparable with indicators from previous years. The NIS data was not published in 2011/12, superseded by The Adult Social Care Outcomes Framework (ASCOF). 3. Personal Social Services Expenditure - SSMSS Please note that if no service is selected, the default setting for SSMSS data will show Total Adult Services expenditure. 43 Copyright © 2014, Health and Social Care Information Centre. NASCIS Online Analytical Processor (OLAP) User Guide 4. Personal Social Services Expenditure – Capital Charges In 2007-08 a change was made to the definition of capital charges to bring the PSSEX1 data in line with the 2006 Local Authority Accounting SORP (Statement of Recommended Practice). This means that Total Cost can not be compared historically. Capital charges i.e. depreciation, loss on impairment of assets, amortisation of deferred charges and credit for amortisation of capital grants. Credit for amortisation of capital grants is included for the first time and the previous element of notional interest is no longer being included within capital charges. These changes were introduced by CIPFA in the 2006 Local Authority Accounting SORP (Statement of Recommended Practice). Further information about the effect of this change on the definition of total cost can be found in Section 2: Annex B of the 2006 Best Value Code of Practice (BVACOP). A new column has been added to record Grants to voluntary organisations against the appropriate service line to allow more meaningful unit costs for provision by others to be calculated. Grants are now excluded from the unit cost expenditure as only activity relating to the CASSR (Councils with Adult Social Services Responsibilities) care plan can be recorded and used in the unit cost calculation. This change combined with the change to the definition of capital charges which applies to both own provision and provision by others means that the unit costs for 2007-08 can not be compared with previous years. 5. Personal Social Services Expenditure – Gross Current Expenditure The Gross Current Expenditure calculation used is Total Expenditure excluding capital charges, less all income other than client contributions. 6. Personal Social Services Expenditure - Unit Costs Summary (UCS) If no service is selected the first displayed figure is from the ‘Residential and Nursing Care for Older People’ service. The Unit Costs Summary in the OLAP has now been revised so that numerator and denominator data for the average costs has been supplied. This is available retrospectively for all available years. Please note the overall totals for services are the figures for adults and older people in the relevant service and all totals are for per person per week unless otherwise stated. The numerator for working out the unit costs is displayed in £000s and is highlighted as such. The denominator for working out the unit costs in some cases has been divided by 52 to get the weekly cost. These are: 44 Copyright © 2014, Health and Social Care Information Centre. NASCIS Online Analytical Processor (OLAP) User Guide Service Service sub-type Basis Provision Source Day care Adults with learning disabilities receiving day care Per client Other Per client Own Per client All (Total) Total Total Per client Other Per client Own Per client All (Total) Total All (Total) Per client Other Per client Own Per client All (Total) Total All (Total) Per client Other Per client Own Per client All (Total) Total All (Total) Adults and older people receiving day care Total All (Total) Adults with learning disabilities receiving direct payments Total All (Total) Adults with mental illness receiving direct payments Total All (Total) Adults with physical disabilities receiving direct payments Total All (Total) Older people receiving direct payments Total All (Total) Adults and older people receiving direct payments Total All (Total) Adults with mental illness receiving day care Adults with physical disabilities receiving day care Older people receiving day care Direct payments All (Total) Home Adults and older people receiving home care Total All (Total) care Adults with learning disabilities receiving home care Total All (Total) Adults with mental illness receiving home care Total All (Total) Adults with physical disabilities receiving home care Total All (Total) Older people receiving home care Total All (Total) Adults and older people receiving meals Per meal Other Adults and older people receiving meals Per meal Own Adults and older people receiving meals Per meal All (Total) Adults and older people receiving meals Total All (Total) Older people receiving meals Total All (Total) Meals 45 Copyright © 2014, Health and Social Care Information Centre. NASCIS Online Analytical Processor (OLAP) User Guide The ‘Activity’ data from the PSS-EX1 expenditure return is available as a downloaded Excel file on the PSS-EX1 OLAP page. 46 Copyright © 2014, Health and Social Care Information Centre. NASCIS Online Analytical Processor (OLAP) User Guide 10 Data releases 10.1 Release summary 2008-09 The first phase of NASCIS was released on 17th July 2009 providing more timely and consistent management information, together with access to the NASCIS library and range of analytical data resources. The data resources include 2008-09 raw activity data for adult social care (initially on a restricted basis) alongside the historical data for 2005-06 to 200708. The second phase on the 28th August 2009 contained 2008-09 social care raw expenditure data within the analytical data resources (initially on a restricted basis). The data released on 30th September 2009 contained formally published provisional adult social care activity and expenditure data for 2008-09. The data released on 30th November 2009 contained a range of data and indicators from the Joint Strategic Needs Assessment (JSNA) core data set. The data released on 28th April 2010 contained the formally published final adult social care activity and expenditure data for 2008-09. This data includes the estimations and shows the final England figures for 2008-09. 2009-10 The data released on 30th June 2010 contained the raw data for social care activity 2009-10 and was released on a restricted basis to local authorities only for management information purposes only. The data released on 12th August 2010 contained raw expenditure data for 2009-10 and the 2nd cut of activity data released on a restricted basis to local authorities only for management information purposes only, as well as the formal publication of the provisional NIS indicators. The data released on 30th September 2010 contained the provisional activity data, which comprises of the 2nd cut data and select estimations as well as an update of NIS Indicators NI149 and NI150. The data released on 30th November 2010 contained the provisional adult social care expenditure data with estimations of missing ‘Including SSMSS’ data and a range of updated and new data and indicators from the Joint Strategic Needs Assessment (JSNA) core data set. The data released on 28th January 2011 contained the formally published final Adult Social Care Combined Activity Return (ASC-CAR) data for 2009-10 and indicators from the Joint Strategic Needs Assessment (JSNA) core data set as a public release. The ASC-CAR data includes the estimations and shows the final England figures for 2009-10. 3rd cut Referrals, Assessments and Packages of Care (RAP) 2009-10 data was made available on a restricted basis to local authorities for management information purposes. The data released on 15th February 2011 contained the formally published final adult social care expenditure data for 2009-10. This data includes the estimations and shows the final England figures for 2009-10. 47 Copyright © 2014, Health and Social Care Information Centre. NASCIS Online Analytical Processor (OLAP) User Guide The data released on 8th March 2011 contained the final Abuse of Vulnerable Adults (AVA) data for 2009-10, available to local authorities only as management information only due to data quality issues. A national summary was made available as a standard report. The data released on 20th April 2011 contained the formally published final RAP 2009/10 data for 2009-10 and final NIS data for 2009-10. This data includes the estimations and shows the final England figures for 2009-10. 2010-11 The data released on 17th June 2011 contained the raw data for ASC-CAR data for 2010-11 and was released on a restricted basis to local authorities only for management information purposes only. The data released on 15th July 2011 contained the raw data for RAP data for 2010-11 and was released on a restricted basis to local authorities only for management information purposes only. The data released on 29th July 2011 contained the raw data for PSS-EX1 data for 2010-11 and initial NIS 2010-11 figures and was released on a restricted basis to local authorities only for management information purposes only. The data released on 12th August 2011 contained the raw data for AVA data for 2010-11 and the second cut of raw data for ASC_CAR data for 2010-11 was released on a restricted basis to local authorities only for management information purposes only. The data released on 29th September 2011 contained the 2nd cut of raw data for RAP and PSS-EX1 data for 2010-11 and third cut of raw data for ASC-CAR for 2010-11 and was released on a restricted basis to local authorities only for management information purposes only. The data released on 7th October 2011 contained the provisional release of NIS data for 2010-11. The data released on 3rd November 2011 contained the provisional release of AVA data for 2010-11. The data released on 30th November 2011 contained the provisional release of RAP, ASCCAR and PSS-EX1 data for 2010-11. The data released on 3rd March 2012 contained the final release of AVA data for 2010-11. The data released on 29th March 2012 contained the final release of RAP, ASC-CAR, NIS and PSS-EX1 data for 2010-11. 48 Copyright © 2014, Health and Social Care Information Centre. NASCIS Online Analytical Processor (OLAP) User Guide 2011-12 May 2012 Update of JSNA Indicators June 2012 Initial (1st cut) 2011-12 Referrals, Assessments and Packages of Care (RAP) data * Initial (1st cut) 2011-12 Adult Social Care Combined Activity Return (ASC-CAR) data * Initial (1st cut) measures from the 2011-12 Adult Social Care Outcomes Framework * July 2012 Initial (1st cut) 2011-12 Abuse of Vulnerable Adults (AVA) data* Initial (1st cut) 2011-12 Personal Social Services Expenditure (PSS-EX1) data * August 2012 Initial (2nd cut) 2011-12 Referrals, Assessments and Packages of Care (RAP) data * Initial (2nd cut) 2011-12 Adult Social Care Combined Activity Return (ASC-CAR) data* September 2012 Provisional 2011-12 Referrals, Assessments and Packages of Care (RAP) data Provisional 2011-12 Adult Social Care Combined Activity Return (ASC-CAR) data Provisional measures from the 2011/12 Adult Social Care Outcomes Framework (ASCOF) October 2012 Initial (2nd cut) 2011-12 Abuse of Vulnerable Adults (AVA) data * Initial (2nd cut) 2011-12 Personal Social Services Expenditure (PSS-EX1) data * November 2012 Provisional 2011-12 Abuse of Vulnerable Adults (AVA) data Provisional 2011-12 Personal Social Services Expenditure (PSS-EX1) data January 2013 Initial (3rd cut) 2011-12 Abuse of Vulnerable Adults (AVA) data * Final 2011-12 Personal Social Services Expenditure (PSS-EX1) data February 2013 Final 2011-12 Referrals, Assessments and Packages of Care (RAP) data Final 2011-12 Adult Social Care Combined Activity Return (ASC-CAR) data Final measures from the 2011-12 Adult Social Care Outcomes Framework (ASCOF) March 2013 Final 2011-12 Abuse of Vulnerable Adults (AVA) data * Only available to Local Authorities as pre-release data for management purposes. 49 Copyright © 2014, Health and Social Care Information Centre. NASCIS Online Analytical Processor (OLAP) User Guide 2012-13 May 2013 Update of JSNA Indicators June 2013 Initial (1st cut) 2012-13 Referrals, Assessments and Packages of Care (RAP) data * Initial (1st cut) 2012-13 Adult Social Care Combined Activity Return (ASC-CAR) data * Initial (1st cut) measures from the 2012-13 Adult Social Care Outcomes Framework * July 2013 Initial (1st cut) 2012-13 Personal Social Services Expenditure (PSS-EX1) data* Initial (1st cut) 2012-13 Abuse of Vulnerable Adults (AVA) data * Provisional 2012-13 Referrals, Assessments and Packages of Care (RAP) data Provisional 2012-13 Adult Social Care Combined Activity Return (ASC-CAR) data Provisional measures from the 2012-13 Adult Social Care Outcomes Framework Provisional 2012-13 Adult Social Care Survey (ASCS) data September 2013 Provisional 2012-13 Personal Social Services Expenditure (PSS-EX1) data Provisional 2012-13 Abuse of Vulnerable Adults (AVA) data October 2013 Final cut 2012-13 Personal Social Services Expenditure (PSS-EX1) data* Final cut 2012-13 Abuse of Vulnerable Adults (AVA) data * Final cut 2012-13 Referrals, Assessments and Packages of Care (RAP) data * Final cut 2012-13 Adult Social Care Combined Activity Return (ASC-CAR) data* Final cut measures from the 2012-13 Adult Social Care Outcomes Framework * Final cut 2012-13 Adult Social Care Survey data * Final cut 2012-13 Carers Survey data* November 2013 Interim 2012-13 Referrals, Assessments and Packages of Care (RAP) data Final cut 2012-13 Adult Social Care Combined Activity Return (ASC-CAR) data Interim measures from the 2012/13 Adult Social Care Outcomes Framework (ASCOF) Final cut 2012-13 Adult Social Care Survey data Final cut 2012-13 Carers Survey data December 2013 Final cut 2012-13 Referrals, Assessments and Packages of Care (RAP) data Final cut measures from the 2012/13 Adult Social Care Outcomes Framework Final cut 2012-13 Personal Social Services Expenditure (PSS-EX1) data February 2014 Final 2012-13 Abuse of Vulnerable Adults (AVA) data 50 Copyright © 2014, Health and Social Care Information Centre. NASCIS Online Analytical Processor (OLAP) User Guide 2013-14 May 2014 Update of JSNA Indicators June 2014 Initial (1st cut) 2013-14 Referrals, Assessments and Packages of Care (RAP) data * Initial (1st cut) 2013-14 Adult Social Care Combined Activity Return (ASC-CAR) data * Initial (1st cut) measures from the 2013/14 Adult Social Care Outcomes Framework (ASCOF)* Initial (1st cut) Adult Social Care Survey data for 2013-14 * July 2014 Provisional 2013-14 Referrals, Assessments and Packages of Care (RAP) data Provisional 2013-14 Adult Social Care Combined Activity Return (ASC-CAR) data Provisional measures from the 2013-14 Adult Social Care Outcomes Framework (ASCOF) Provisional 2013-14 Adult Social Care Survey (ASCS) data First cut data 2013-14 Safeguarding Adults Return (SAR) * Final validated data 2013-14 Deprivation of Liberty Safeguards (DoLS) return * Initial (1st cut) 2013-14 Personal Social Services: Expenditure and Unit Costs data* September 2014 Final validated data 2013-14 Deprivation of Liberty Safeguards (DoLS) return Final data from the 2013-14 Safeguarding Adults Return (SAR) * Provisional 2013-14 Personal Social Services: Expenditure and Unit Costs data * Only available to Local Authorities as pre-release data for management purposes. (Future) Final release on 4th December 2014 for finance data. Final release on 9th December 2014 for activity, ASCOF and survey data. 2014-15 New collections SALT and ASC-FR replacing RAP, ASC-CAR and PSS-EX1. 51 Copyright © 2014, Health and Social Care Information Centre. NASCIS Online Analytical Processor (OLAP) User Guide 10.2 Data currently available to view The table below shows the data currently displayed within the NASCIS OLAP tool, as at October 2014. Referrals, Assessments and Packages of Care (RAP) tables 2005/06 FINAL 2006/07 FINAL 2007/08 FINAL 2008/09 FINAL 2009/10 FINAL 2010/11 FINAL 2011/12 FINAL 2012/13 FINAL 2013/14 (revised April 2011) R (R1,R2, R3) R (R1,R2, R3) R (R1,R2, R3) R (R1,R2, R3) R (R1,R2, R3) R (R1,R2, R3) R (R1,R2, R3) R (R1,R2, R3) R (R1,R2, R3) A1 A1 A1 A1 A1 A1 A1 A1 A1 A5 A5 A5 A6 A6 A6 A6 A6 A6 A6 A6 A6 A7 A7 A7 A7 A7 A7 A7 A8 A8 A8 A8 A8 A8 A9 A9 A9 A10 A10 A10 A11 (A & B) A11 (A & B) A11 (A & B) A11 (A & B) P1 P1 P1 P1 P1 P1 P1 P1 P1 P2F P2F P2F P2F P2F P2F P2F P2F P2F P2S P2S P2S P2S P2S P2S P2S P2S P2S P4 P4 P4 P4 P4 P4 P4 P4 P7 (A & B) P7 (A & B) P7 (A & B) P7 (A & B) 52 C1 C1 C1 C1 C1 C1 C1 C1 C1 C2 C2 C2 C2 C2 C2 C2 C2 C2 H1 H1 H1 H1 H1 H1 SD1 SD1 SD1 SD1 SD1 SD2 SD2 SD2 SD2 SD2 SD3 SD3 SD3 SD3 SD3 Copyright © 2014, Health and Social Care Information Centre. NASCIS Online Analytical Processor (OLAP) User Guide ASC-CAR (formerly SR1) 2005/06 2006/07 2007/08 FINAL FINAL FINAL S1 (SR1 Table 1) S1 (SR1 Table 1) S1 (SR1 Table 1) S2 (SR1 Table 2) S2 (SR1 Table 2) S2 (SR1 Table 2) S3 (SR1 Table 5a) S3 (SR1 Table 5a) S3 (SR1 Table 5a) S4 (SR1 Table 5b) S4 (SR1 Table 5b) S4 (SR1 Table 5b) S5 (SR1 Table 5c) S5 (SR1 Table 5c) S5 (SR1 Table 5c) 2008/09 2009/10 2010/11 2011/12 2012/13 FINAL FINAL FINAL FINAL FINAL S1 S1 S1 S1 S1 S1 S2 S2 S2 S2 S2 S2 S3 S3 S3 S3 S3 S3 S4 S4 S4 S5 S5 S5 S5 L1 L1 L1 L1 L1 L1 L2 L2 L2 L2 L2 L2 I1 I1 I1 I1 I1 I1 I1N I1N I1N I1N 2013/14 National Indicator Set (NIS) 2008 FINAL 2009 FINAL 2010 FINAL NI125 (VSC04) NI125 (VSC04) NI125 (VSC04) NI130 (VSC17) 08/09 NI 127 NI 127* NI130 (VSC17) 09/10 N1 128 (VSC32) NI130 (VSC17) 09/10 NI132 (VSC12) NI130 (VSC17) 09/10 NI135 (VSC18) NI133 (VSC13) NI132 (VSC12) NI145 (VSC05) NI135 (VSC18) NI133 (VSC13) NI146 (VSC07) NI136 (VSC03) NI135 (VSC18) NI149 NI145 (VSC05) NI136 (VSC03) NI150 NI146 (VSC07) NI145 (VSC05) NI149 NI146 (VSC07) NI150 NI149 NI150 NI127 in 2010 has been calculated using a different definition and is therefore not comparable with previous years. Please note that the 2010 data is the final publication of NIS as this has now been discontinued following the Coalition Government’s announcement in October 2010 concerning the abolition of the National Indicator Set. 53 Copyright © 2014, Health and Social Care Information Centre. NASCIS Online Analytical Processor (OLAP) User Guide Personal Social Services Expenditure (PSS-EX1) 2005/06 FINAL 2006/07 FINAL 2007/08 FINAL 2008/09 FINAL 2009/10 FINAL 2010/11 FINAL SSMSS SSMSS SSMSS SSMSS SSMSS SSMSS Unit Costs Unit Costs Unit Costs Unit Costs Unit Costs Unit Costs 2011/12 FINAL SSMSS 2012/13 FINAL SSMSS 2013/14 SSMSS Unit Costs Unit Costs Unit Costs Abuse of Vulnerable Adults (AVA) 2010/11 2011/12 2012/13 FINAL FINAL FINAL AVA Table 1 Alerts AVA Table 1 Alerts AVA Table 1 Alerts AVA Table 1 Referrals AVA Table 1 Referrals AVA Table 1 Referrals AVA Table 1 Completed Referrals AVA Table 1 Completed Referrals AVA Table 1 Completed Referrals AVA Table 2 Alerts AVA Table 2 Alerts AVA Table 2 Alerts AVA Table 2 Referrals AVA Table 2 Referrals AVA Table 2 Referrals AVA Table 2 Completed Referrals AVA Table 2 Completed Referrals AVA Table 2 Completed Referrals AVA Table 3 AVA Table 3 AVA Table 3 AVA Table 4a AVA Table 4a AVA Table 4a AVA Table 4b AVA Table 4b AVA Table 4b AVA Table 5a AVA Table 5a AVA Table 5a AVA Table 5b AVA Table 5b AVA Table 5b AVA Table 6a AVA Table 6a AVA Table 6a AVA Table 6b AVA Table 6b AVA Table 6b AVA Table 7 AVA Table 7a, 7b AVA Table 7a, 7b AVA Table 8 AVA Table 8a, 8b, 8c AVA Table 8a, 8b, 8c AVA Table 9 AVA Table 9 AVA Table 9 The 2009-10 data previously presented as restricted data in NASCIS has been removed and is now available as a formatted spreadsheet for all users to download. 54 Copyright © 2014, Health and Social Care Information Centre. NASCIS Online Analytical Processor (OLAP) User Guide Adult Social Care Outcomes Framework (ASCOF) 2011/12 2012/13 2013/14 FINAL FINAL 1A 1A 1A 1B 1B 1B 1C 1C 1C 1E 1E 1E 1D 1F 1F 1F 1G 1G 1G 1H 1H 1H 1I 2A 2A 2A 2B 2B 2B 2C 2C 2C 3A 3A 3A 3B 3C 3D 4A 4A 4A 4B 4B 4B 1D, 3B, 3C, 3D (see 2012/13) 1D, 3B, 3C, 3D (next release 2014/15) The following outcome measures are unavailable for 2011/12 and 2013/14: 1D Carer-reported quality of life 3B Overall satisfaction of carers with social services 3C The proportion of carers who report that they have been included or consulted about the person in care 3D The proportion of people who use services and carers who find it easy to find information about services (carers element) 55 Copyright © 2014, Health and Social Care Information Centre. NASCIS Online Analytical Processor (OLAP) User Guide Population data (ONS mid year estimates) MALE MALE MALE 56 2005 2006 2007 (revised 2012) (revised 2012) (revised 2012) LA LA LA FEMALE PERSONS MALE FEMALE PERSONS MALE FEMALE PERSONS 18-64 18-64 18-64 18 PLUS 18 PLUS 18 PLUS 65-74 65-74 65-74 65 PLUS 65 PLUS 65 PLUS 75-84 75-84 75-84 85 PLUS 85 PLUS 85 PLUS 00-17 00-17 00-17 2008 2009 2010 (revised 2012) (revised 2012) (revised 2012) LA LA LA FEMALE PERSONS MALE FEMALE PERSONS MALE FEMALE PERSONS 18-64 18-64 18-64 18 PLUS 18 PLUS 18 PLUS 65-74 65-74 65-74 65 PLUS 65 PLUS 65 PLUS 75-84 75-84 75-84 85 PLUS 85 PLUS 85 PLUS 00-17 00-17 00-17 2011 2012 2013 (revised 2012) (revised 2012) (due to publish October 2014) LA LA LA FEMALE PERSONS MALE FEMALE PERSONS MALE FEMALE 18-64 18-64 18-64 18 PLUS 18 PLUS 18 PLUS 65-74 65-74 65-74 65 PLUS 65 PLUS 65 PLUS 75-84 75-84 75-84 85 PLUS 85 PLUS 85 PLUS 00-17 00-17 00-17 PERSONS Copyright © 2014, Health and Social Care Information Centre. NASCIS Online Analytical Processor (OLAP) User Guide User Experience Survey (UES) Personal Social Services Survey of Adults receiving Home Care in 2008-09’ Adult Social Care Survey (Final 2012-13) Carers Survey (Final 2012-13) Users wishing to see council level results from the survey can also access them from the HSCIC publication page and some headline England level analysis is available from our website. Joint Strategic Needs Assessment (JSNA) Please refer to the Data Availability spreadsheet to see at what level and which measures are available for the data you want to view. Safeguarding Adults Return (SAR) The Safeguarding Adults Return (SAR) collects information about safeguarding cases managed by Councils with Adult Social Services Responsibilities (CASSRs) in England. It includes information about the adults at risk, the types of risk experienced and the locations of the risk. The 2013-14 reporting period is the first year of the SAR collection. Before this time, safeguarding data were gathered in the Abuse of Vulnerable Adults (AVA) collection which has now been discontinued. Records are kept of all safeguarding cases and this information is submitted to the HSCIC on an annual basis. Each year of data will be made available in Excel spreadsheets. Users will be able to access these spreadsheets using links which will appear below when the data become available. SAR data is not currently available in the OLAP. Available Data: 2013-14 Final SAR data Deprivation of Liberty Safeguards (MCA DoLS) Data from the Mental Capacity Act Deprivation of Liberty Safeguards (MCA DoLS) returns. The Mental Capacity Act Deprivation of Liberty Safeguards (MCA DoLS) provide a legal framework to ensure that people are deprived of their liberty only when there is no other way care or treatment can be provided safely. The safeguards are intended to protect people from overly restrictive care whilst in a hospital or care home. Where a DoL is believed to be occurring, it must be assessed and authorised by a Council with Adult Social Services Responsibilities (CASSR). Records are kept of all applications and this information is submitted to the HSCIC on an annual basis. Each year of submitted data will be made available in Excel spreadsheets. DoLS data is not available in the OLAP. Available Data: 2013-14 Final DoLS data aggregated to CASSR level 57 Copyright © 2014, Health and Social Care Information Centre. NASCIS Online Analytical Processor (OLAP) User Guide 11 Functionality changes The following has been added or changed within the OLAP since April 2010 to improve functionality and resolve any outstanding issues: ASC-CAR S1 Client types have been relabelled: People with Physical Disabilities is now Physical disability People with Mental Health problems is now Mental health People with Learning Disabilities is now Learning disability Alcohol/Drug misusers is now Substance misuse Others is now Other vulnerable people S2 S3 Client types have been relabelled: People with Physical Disabilities is now Physical disability People with Mental Health problems is now Mental health People with Learning Disabilities is now Learning disability Alcohol/Drug misusers is now Substance misuse Others is now Other vulnerable people S4 (Discontinued from 2011-12) S5 (Discontinued from 2012-13) Client types have been relabelled: L1 L2 I1 I1N RAP R A1 People with Physical Disabilities is now Physical disability People with Mental Health problems is now Mental health People with Learning Disabilities is now Learning disability Alcohol/Drug misusers is now Substance misuse Others is now Other vulnerable people A5 58 (Discontinued from 2008-09) Copyright © 2014, Health and Social Care Information Centre. NASCIS Online Analytical Processor (OLAP) User Guide A6 There have been some changes to the ethnicity subtypes: White now includes Traveller of Irish heritage and Gypsy/Roma and this has altered the comparability of Irish and Other background so there is now a 2009-10 definition for these. The gender split collected in previous years has been removed from the 2010-11 tables. The gender information is now available in table A11, but is not split by ethnicity. A7 Ethnicity categories re-organised for 2013-14. Client types have been relabelled: People with Physical Disabilities is now Physical disability People with Mental Health problems is now Mental health People with Learning Disabilities is now Learning disability Alcohol/Drug misusers is now Substance misuse Others is now Other vulnerable people A8 (Discontinued from 2012-13) Client types have been relabelled: People with Physical Disabilities is now Physical disability People with Mental Health problems is now Mental health People with Learning Disabilities is now Learning disability Alcohol/Drug misusers is now Substance misuse Others is now Other vulnerable people (Discontinued from 2011-12) A9 (Discontinued from 2008-09) A10 This is a new table for the 2009-10 RAP return (Discontinued from 2012-13) This is a new table for 2010-11 RAP Return, A11 This table has been split in to 2 sections (A and B) in the OLAP. A11 holds data previously collected in A6. P1 Client types have been relabelled: People with Physical Disabilities is now Physical disability People with Mental Health problems is now Mental health People with Learning Disabilities is now Learning disability Alcohol/Drug misusers is now Substance misuse Others is now Other vulnerable people P2F Client types have been relabelled: People with Physical Disabilities is now Physical disability People with Mental Health problems is now Mental health People with Learning Disabilities is now Learning disability Alcohol/Drug misusers is now Substance misuse Others is now Other vulnerable people 59 Direct payments within Service Type has been renamed to Existing/new Direct payments and Personal Budgets’ Copyright © 2014, Health and Social Care Information Centre. NASCIS Online Analytical Processor (OLAP) User Guide P2S Client types have been relabelled: People with Physical Disabilities is now Physical disability People with Mental Health problems is now Mental health People with Learning Disabilities is now Learning disability Alcohol/Drug misusers is now Substance misuse Others is now Other vulnerable people P4 Direct payments within Service Type has been renamed to Existing/new Direct payments and Personal Budgets’ Personal Budgets information is no longer collected as part of the P2S return Client types have been relabelled: People with Physical Disabilities is now Physical disability People with Mental Health problems is now Mental health People with Learning Disabilities is now Learning disability Alcohol/Drug misusers is now Substance misuse Others is now Other vulnerable people There have been some changes to the ethnicity subtypes: White now includes Traveller of Irish heritage and Gypsy/Roma and this has altered the comparability of Irish and Other background so there is now a 9/10 definition for these. The gender split collected in previous years has been removed from the 2010-11 tables. The gender information is now available in table P7, but is not split by ethnicity. P7 Ethnicity categories re-organised for 2013-14. This is a new table for 2010-11 RAP Return, This table has been split in to 2 sections (A and B) in the OLAP. P7 holds data previously collected in P4. H1 The number of planned visits per week was removed from 2011-12. C1 Client types have been relabelled: People with Physical Disabilities is now Physical disability People with Mental Health problems is now Mental health People with Learning Disabilities is now Learning disability Alcohol/Drug misusers is now Substance misuse Others is now Other vulnerable people C2 Client types have been relabelled: People with Physical Disabilities is now Physical disability People with Mental Health problems is now Mental health People with Learning Disabilities is now Learning disability Alcohol/Drug misusers is now Substance misuse Others is now Other vulnerable people 60 Copyright © 2014, Health and Social Care Information Centre. NASCIS Online Analytical Processor (OLAP) User Guide SD1 SD2 SD3 This was a new table for the 2009-10 RAP return This was a new table for the 2009-10 RAP return Ethnicity categories re-organised for 2013-14. This was a new table for the 2009-10 RAP return PSS-EX1 Incl. SSMSS Unit Costs Summary Headline Adult services and accounting categories and now prefixed with a letter and number respectively to bring them in to the same order as they appear on the return 2009-10 data contains the voluntary items, which are published for the first time. Per person per week figures have not been collected in 2009-10 the Services, and headline figures for this year will appear to be blank. Figures for lower levels are still available. For the November 2011 release, Unit Costs has been reworked so that it now has numerator and denominator data available, and this has been applied retrospectively to all years. GENERAL 61 An ‘expand’ button has been added to the selection options when a dimension is on build window. Dimension attributes now appear in the order of the return rather than alphabetical order. Please note that this does not apply to the area dimension. Copyright © 2014, Health and Social Care Information Centre. NASCIS Online Analytical Processor (OLAP) User Guide Published by the Health and Social Care Information Centre Part of the Government Statistical Service For further information: www.hscic.gov.uk 0300 303 5678 [email protected] Copyright © 2014 Health and Social Care Information Centre. All rights reserved. This work remains the sole and exclusive property of the Health and Social Care Information Centre and may only be reproduced where there is explicit reference to the ownership of the Health and Social Care Information Centre. This work may be re-used by NHS and government organisations without permission. 62 Copyright © 2014, Health and Social Care Information Centre.